Attached files
| file | filename |
|---|---|
| 8-K - CURRENT REPORT - MID AMERICA APARTMENT COMMUNITIES INC. | v380445_8k.htm |
| EX-99.1 - PRESS RELEASE - MID AMERICA APARTMENT COMMUNITIES INC. | v380445_ex99-1.htm |

REIT WEEK 2014 NAREIT’S INVESTOR FORUM JUNE 3 - 5, 2014 6584 POPLAR AVENUE MEMPHIS, TN 38138 / WWW.MAAC.COM

ENHANCED OPPORTUNITY • Enhanced scale delivering expanded opportunities and benefits • 20 year established public company platform • Well diversified in high - growth markets across 14 Sunbelt states • Long - tenured management team; sophisticated public company board of directors 2 • A+ to B quality portfolio; appealing to broadest segment of rental market • 95.5% same store occupancy at March 31, 2014 • Average same store revenue per occupied unit of $1,011 for Q1 2014 • Significant deal flow; $1.16 billion in acquisitions from 2009 - 2013 with an estimated additional $200 - $300 million for 2014 • $ 146 million active development pipeline at March 31, 2014 • $182 million lease - up portfolio • Redevelopment pipeline of $110 million • Investment grade rated balance sheet with positive to stable outlook by the three major rating agencies (Fitch, Moody’s , S&P) • Net debt/recurring EBITDA is 6.2x at March 31, 2014; sector average is 6.6x • Unencumbered assets to book value 63.9% at March 31, 2014; 97% debt fixed or hedged 1 FOCUS ON HIGH - GROWTH SUNBELT REGION 2 HIGH QUALITY PORTFOLIO 3 COMPELLING GROWTH MODEL 4 INVESTMENT GRADE BALANCE SHEET A STRONGER PLATFORM
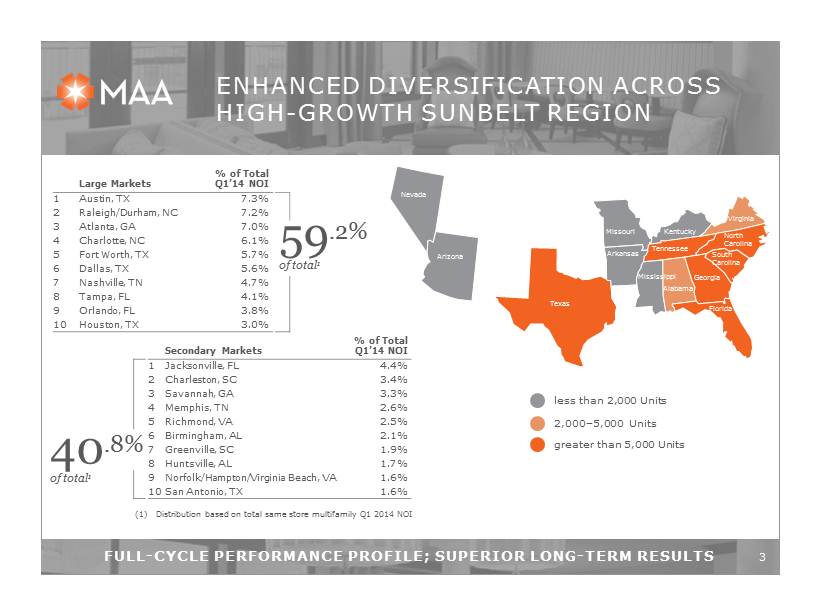
Nevada Arizona Texas Mississippi Arkansas Kentucky Missouri Virginia North Carolina Tennessee Georgia South Carolina Alabama Florida FULL - CYCLE PERFORMANCE PROFILE; SUPERIOR LONG - TERM RESULTS ENHANCED DIVERSIFICATION ACROSS HIGH - GROWTH SUNBELT REGION 3 less than 2,000 Units 2,000 – 5,000 Units greater than 5,000 Units Large Markets % of Total Q1’14 NOI 1 Austin, TX 7.3% 2 Raleigh/Durham, NC 7.2% 3 Atlanta, GA 7.0% 4 Charlotte, NC 6.1% 5 Fort Worth, TX 5.7% 6 Dallas, TX 5.6% 7 Nashville, TN 4.7% 8 Tampa, FL 4.1% 9 Orlando, FL 3.8% 10 Houston, TX 3.0% 59 .2% of total 1 Secondary Markets % of Total Q1’14 NOI 1 Jacksonville, FL 4.4% 2 Charleston, SC 3.4% 3 Savannah, GA 3.3% 4 Memphis, TN 2.6% 5 Richmond, VA 2.5% 6 Birmingham, AL 2.1% 7 Greenville, SC 1.9% 8 Huntsville, AL 1.7% 9 Norfolk/Hampton/Virginia Beach, VA 1.6% 10 San Antonio, TX 1.6% 40 .8% of total 1 (1) Distribution based on total same store multifamily Q1 2014 NOI
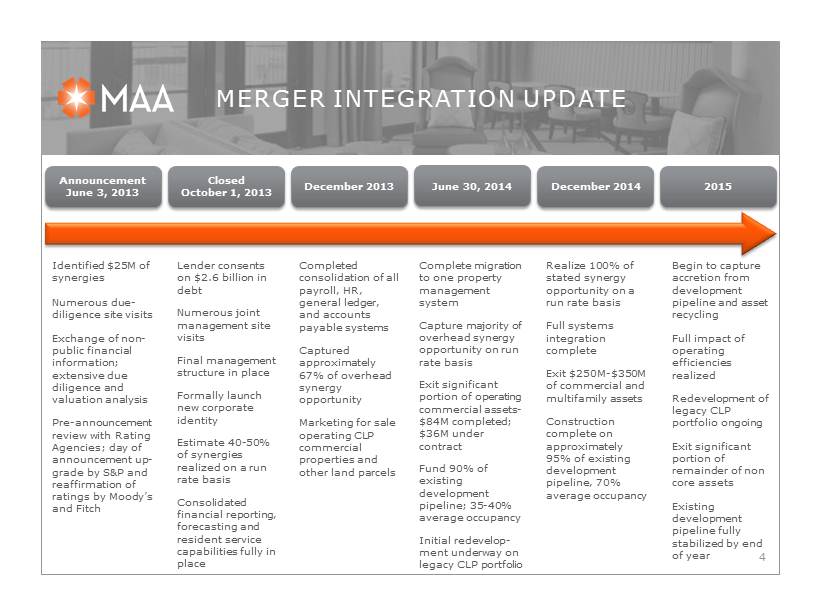
MERGER INTEGRATION UPDATE 4 Announcement June 3, 2013 Closed October 1, 2013 December 2014 December 2013 Identified $25M of synergies Numerous due - diligence site visits Exchange of non - public financial information; extensive due diligence and valuation analysis Pre - announcement review with Rating Agencies; day of announcement up - grade by S&P and reaffirmation of ratings by Moody’s and Fitch Completed consolidation of all payroll, HR, general ledger, and accounts payable systems Captured approximately 67% of overhead synergy opportunity Marketing for sale operating CLP commercial properties and other land parcels Realize 100% of stated synergy opportunity on a run rate basis Full systems integration complete Exit $250M - $350M of commercial and multifamily assets Construction complete on approximately 95% of existing development pipeline, 70% average occupancy June 30, 2014 Complete migration to one property management system Capture majority of overhead synergy opportunity on run rate basis Exit significant portion of operating commercial assets - $84M completed; $36M under contract Fund 90% of existing development pipeline; 35 - 40% average occupancy Initial redevelop - ment underway on legacy CLP portfolio 2015 Begin to capture accretion from development pipeline and asset recycling Full impact of operating efficiencies realized Redevelopment of legacy CLP portfolio ongoing Exit significant portion of remainder of non core assets Existing development pipeline fully stabilized by end of year Lender consents on $2.6 billion in debt Numerous joint management site visits Final management structure in place Formally launch new corporate identity Estimate 40 - 50% of synergies realized on a run rate basis Consolidated financial reporting, forecasting and resident service capabilities fully in place

MERGER OPPORTUNITIES 5 Additional Areas of Opportunity FFO/Share Opportunity NOI Operating Synergies $0.05 - $0.11 Stabilize Development Pipeline $0.10 - $0.14 Recycle Non - earning Assets $0.05 - $0.08 Redevelopment of CLP Assets $0.10 - $0.17 Total $0.30 - $0.50 Value Premium Paid 1 ($226.5 million) Deal Costs ($60.0 million) Total Cost ($286.5 million) Value of Synergy & Redevelopment ($42M) 2 $579.6 million Net Value Created $293.1 million CR at Medical District, Dallas, TX Stations Square, Fredericksburg, VA CG at Lake Mary, Orlando, FL 1225 S. Church, Charlotte, NC Hue, Raleigh, NC CG at Godley Lake, Savannah, GA (1) Implied price paid based on day of announcement at .360x exchange rate (2) Using pre - merger announcement FFO multiple of 13.8 and midpoint of synergy opportunity; at current sector multiple of approximately 16 , net value increases to $385.5m Approximately $25 million ($0.32 per share) of combined overhead expense synergies across the platform, to be captured on a run rate basis by the end of 2014
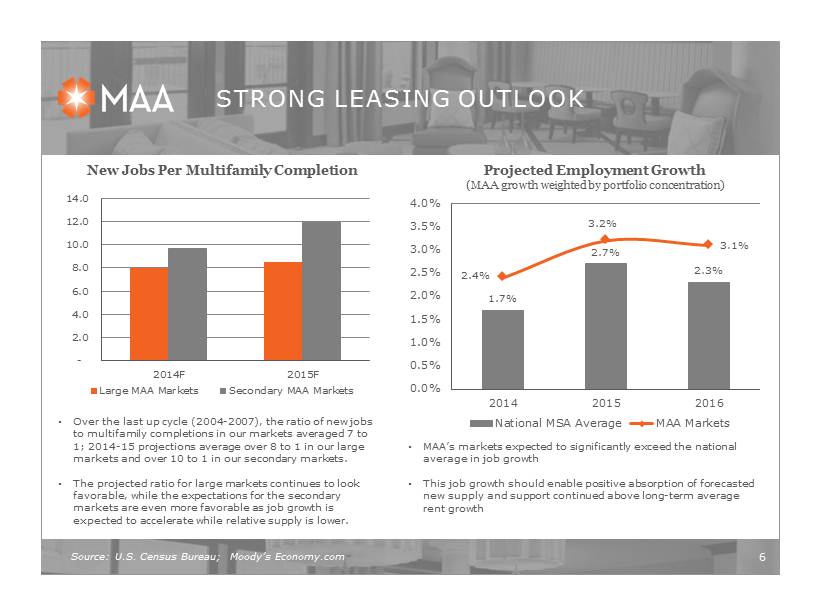
Source: U.S. Census Bureau; Moody’s Economy.com STRONG LEASING OUTLOOK 6 New Jobs Per Multifamily Completion - 2.0 4.0 6.0 8.0 10.0 12.0 14.0 2014F 2015F Large MAA Markets Secondary MAA Markets • Over the last up cycle (2004 - 2007), the ratio of new jobs to multifamily completions in our markets averaged 7 to 1; 2014 - 15 projections average over 8 to 1 in our large markets and over 10 to 1 in our secondary markets. • The projected ratio for large markets continues to look favorable, while the expectations for the secondary markets are even more favorable as job growth is expected to accelerate while relative supply is lower. Projected Employment Growth (MAA growth weighted by portfolio concentration) 1.7% 2.7% 2.3% 2.4% 3.2% 3.1% 0.0% 0.5% 1.0% 1.5% 2.0% 2.5% 3.0% 3.5% 4.0% 2014 2015 2016 National MSA Average MAA Markets • MAA’s markets expected to significantly exceed the national average in job growth • This job growth should enable positive absorption of forecasted new supply and support continued above long - term average rent growth
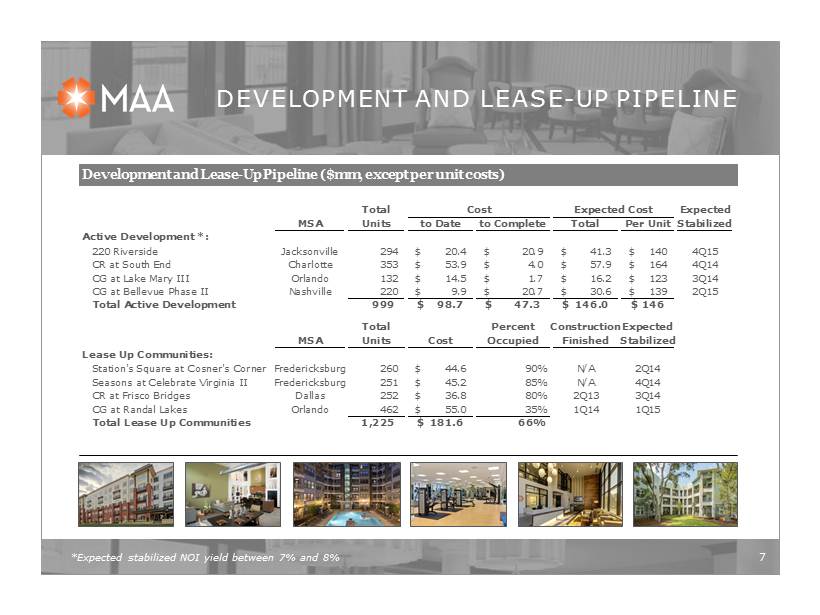
*Expected stabilized NOI yield between 7% and 8% DEVELOPMENT AND LEASE - UP PIPELINE 7 Development and Lease - Up Pipeline ($mm, except per unit costs) Total Expected MSA Units to Date to Complete Total Per Unit Stabilized Active Development *: 220 Riverside Jacksonville 294 20.4$ 20.9$ 41.3$ 140$ 4Q15 CR at South End Charlotte 353 53.9$ 4.0$ 57.9$ 164$ 4Q14 CG at Lake Mary III Orlando 132 14.5$ 1.7$ 16.2$ 123$ 3Q14 CG at Bellevue Phase II Nashville 220 9.9$ 20.7$ 30.6$ 139$ 2Q15 Total Active Development 999 98.7$ 47.3$ 146.0$ 146$ Total Percent ConstructionExpected MSA Units Cost Occupied Finished Stabilized Lease Up Communities: Station's Square at Cosner's Corner Fredericksburg 260 44.6$ 90% N/A 2Q14 Seasons at Celebrate Virginia II Fredericksburg 251 45.2$ 85% N/A 4Q14 CR at Frisco Bridges Dallas 252 36.8$ 80% 2Q13 3Q14 CG at Randal Lakes Orlando 462 55.0$ 35% 1Q14 1Q15 Total Lease Up Communities 1,225 181.6$ 66% Cost Expected Cost

REDEVELOPMENT PIPELINE 8 2013 Results • Redeveloped approximately 2,600 units at an average cost of approximately $4,200 per unit • Achieved an average rent increase of $89 per month ($1,068 per year), 11% higher than non - redeveloped units • Generated a cash on cash return of 24% assuming 95% occupancy Future Redevelopment Opportunity • We have identified 30% - 50% of the legacy CLP portfolio as a target for redevelopment • In 2014, we plan to redevelop 4,000 units (half legacy MAA and half legacy CLP) at a cost of approximately $17 million, achieving an $80 average monthly rent increase • Assuming an $80 per month increase, every 4,000 units redeveloped creates $3.6 million of additional NOI opportunity once fully leased (assuming 95% occupancy) or $65 million of additional value at a 5.5% cap rate BEFORE 1 3 2 4 Stainless Appliances Faux Granite Countertops Updated Cabinetry Wood Plank Vinyl Flooring Updated Plumbing/ Lighting Fixtures AFTER 5
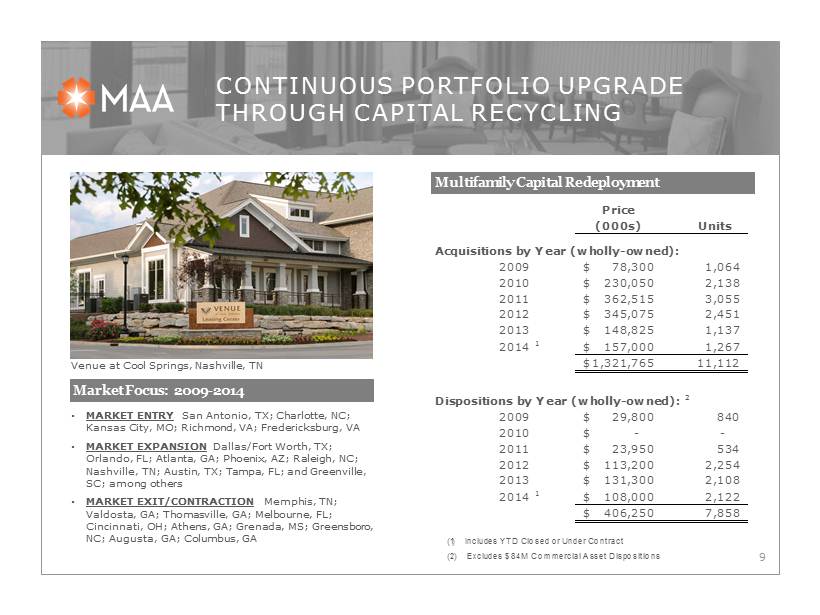
CONTINUOUS PORTFOLIO UPGRADE THROUGH CAPITAL RECYCLING 9 • MARKET ENTRY San Antonio, TX; Charlotte, NC; Kansas City, MO; Richmond, VA; Fredericksburg, VA • MARKET EXPANSION Dallas/Fort Worth, TX; Orlando, FL; Atlanta , GA; Phoenix, AZ; Raleigh, NC; Nashville , TN; Austin, TX; Tampa, FL; and Greenville, SC; among others • MARKET EXIT/CONTRACTION Memphis, TN; Valdosta , GA; Thomasville, GA; Melbourne, FL; Cincinnati, OH; Athens, GA; Grenada , MS; Greensboro, NC; Augusta, GA; Columbus, GA Market Focus : 2009 - 2014 Venue at Cool Springs, Nashville, TN Multifamily Capital Redeployment Price (000s) Units Acquisitions by Year (wholly-owned): 2009 78,300$ 1,064 2010 230,050$ 2,138 2011 362,515$ 3,055 2012 345,075$ 2,451 2013 148,825$ 1,137 2014 1 157,000$ 1,267 1,321,765$ 11,112 Dispositions by Year (wholly-owned): 2 2009 29,800$ 840 2010 -$ - 2011 23,950$ 534 2012 113,200$ 2,254 2013 131,300$ 2,108 2014 1 108,000$ 2,122 406,250$ 7,858 (1) Includes YTD Closed or Under Contract (2) Excludes $84M Commercial Asset Dispositions
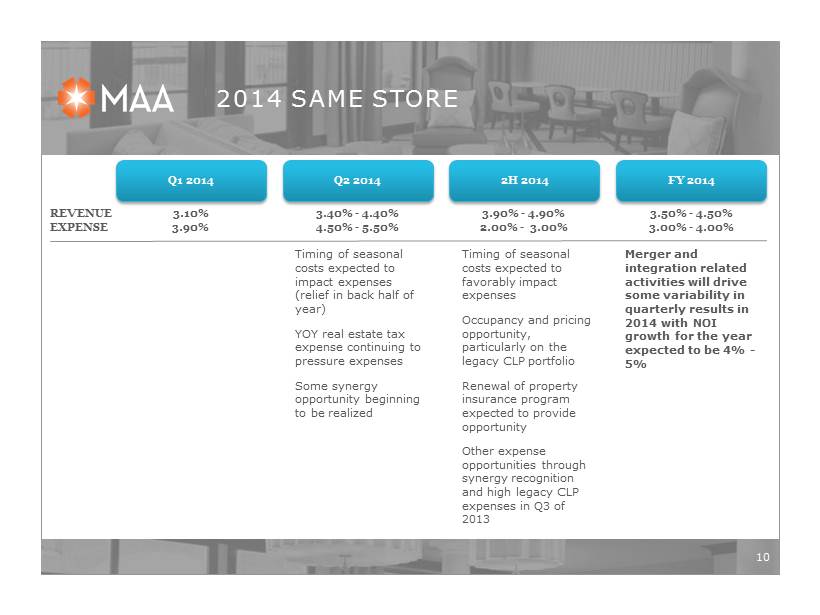
2014 SAME STORE 10 Q2 2014 Timing of seasonal costs expected to impact expenses (relief in back half of year) YOY real estate tax expense continuing to pressure expenses Some synergy opportunity beginning to be realized 2H 2014 FY 2014 Timing of seasonal costs expected to favorably impact expenses Occupancy and pricing opportunity, particularly on the legacy CLP portfolio Renewal of property insurance program expected to provide opportunity Other expense opportunities through synergy recognition and high legacy CLP expenses in Q3 of 2013 Q1 2014 3.10% 3.90% REVENUE EXPENSE 3.40% - 4.40% 4.50% - 5.50 % 3.90% - 4.90% 2.00% - 3.00% 3.50% - 4.50% 3.00% - 4.00% Merger and integration related activities will drive some variability in quarterly results in 2014 with NOI growth for the year expected to be 4% - 5%

2014 GUIDANCE 11 2014 Guidance Range Core FFO/Share $4.84 - $5.04 ($4.94 Midpoint) Core AFFO/Share $4.09 - $4.29 ($4.19 Midpoint) SS Revenue Growth 3.5% - 4.5% SS Expense Growth 3% - 4% SS NOI Growth 4% - 5% Multifamily Acquisition Volume $200 - $300 Million Multifamily Disposition Volume $125 - $175 Million Commercial / Land Disposition Volume $125 - $175 Million Development Investment $65 - $70 Million G&A and Property Management Expenses $54 - $56 Million Merger and Integration Expenses $9 - $10 Million Average Interest Rate 4.3% - 4.5% Leverage (Net Debt/Total Gross Assets) 42% - 45% Unencumbered Asset Pool (% of Total Gross Assets 60% - 65%
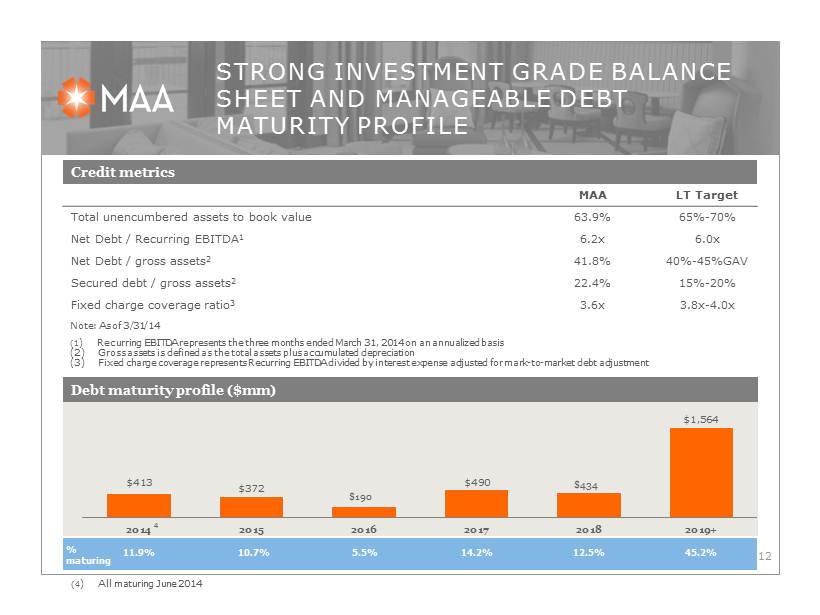
STRONG INVESTMENT GRADE BALANCE SHEET AND MANAGEABLE DEBT MATURITY PROFILE 12 Credit metrics MAA LT Target Total unencumbered assets to book value 63.9% 65% - 70% Net Debt / Recurring EBITDA 1 6.2x 6.0x Net Debt / gross assets 2 41.8% 40% - 45%GAV Secured debt / gross assets 2 22.4% 15% - 20% Fixed charge coverage ratio 3 3.6x 3.8x - 4.0x Note: As of 3/31/14 (1 ) Recurring EBITDA represents the three months ended March 31, 2014 on an annualized basis (2) Gross assets is defined as the total assets plus accumulated depreciation (3) Fixed charge coverage represents Recurring EBITDA divided by interest expense adjusted for mark - to - market debt adjustmen t Debt maturity profile ($mm) $ 413 $372 $190 $ 490 $434 $1,564 2014 2015 2016 2017 2018 2019+ 4 11.9% 10.7% 5.5% 14.2% 45.2% % maturing 12.5% (4 ) All maturing June 2014
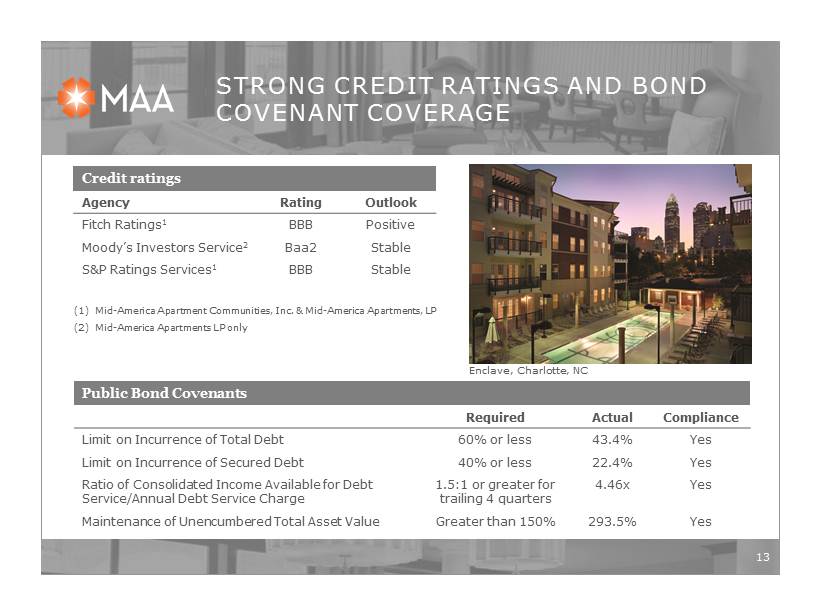
STRONG CREDIT RATINGS AND BOND COVENANT COVERAGE 13 Credit ratings Agency Rating Outlook Fitch Ratings 1 BBB Positive Moody’s Investors Service 2 Baa2 Stable S&P Ratings Services 1 BBB Stable (1) Mid - America Apartment Communities, Inc. & Mid - America Apartments, LP (2) Mid - America Apartments LP only Public Bond Covenants Required Actual Compliance Limit on Incurrence of Total Debt 60% or less 43.4% Yes Limit on Incurrence of Secured Debt 40% or less 22.4% Yes Ratio of Consolidated Income Available for Debt Service/Annual Debt Service Charge 1.5:1 or greater for trailing 4 quarters 4.46x Yes Maintenance of Unencumbered Total Asset Value Greater than 150% 293.5% Yes Enclave, Charlotte, NC

20 YEARS OF SUCCESS 14 12.9 % 11.2% 9.5% 8.5% 7.8% 0.0% 2.0% 4.0% 6.0% 8.0% 10.0% 12.0% 14.0% MAA-US Multifamily Peer Average S&P 500 SNL US REIT Equity DJIA Superior Long - term Performance Annualized 20 Year Total Shareholder Return March 31, 2014 Source: SNL Equity Research $110,281 $10,000 $30,000 $50,000 $70,000 $90,000 $110,000 $130,000 1994 1995 1996 1997 1998 1999 2000 2001 2002 2003 2004 2005 2006 2007 2008 2009 2010 2011 2012 2013 2014 Return on Investment Value of $10,000 MAA Investment Dividends Reinvested March 31, 1994 - March 31, 2014 Source: SNL Equity Research
SUMMARY 15 x 20 year track record of superior growth in shareholder value x Annualized 20 year return of 12 . 9 % assuming reinvestment of dividend a t March 31 , 2014 x Merger related opportunities and scale creates upside over the next 2 - 3 years x Outlook for continued solid leasing fundamentals across Sunbelt region x Pipeline of redevelopment, lease - up and new development to contribute to earnings x Continuing to create higher value through capital recycling x Solid investment grade balance sheet strength ; well positioned
FORWARD LOOKING STATEMENTS 16 Certain matters in this presentation may constitute forward - looking statements within the meaning of Section 27 - A of the Securities Act of 1933 and Section 21 E of the Securities and Exchange Act of 1934 . Such statements include, but are not limited to, statements made about anticipated economic and market conditions, expectations for future demographics, the impact of competition, general changes in the apartment industry, expectations for acquisition and joint venture performance, ability to pay dividends and the ability to obtain financing at reasonable rates . Actual results and the timing of certain events could differ materially from those projected in or contemplated by the forward - looking statements due to a number of factors, including a downturn in general economic conditions or the capital markets, competitive factors including overbuilding or other supply/demand imbalances in some or all of our markets, changes in interest rates and other items that are difficult to control such as the impact of legislation, as well as the other general risks inherent in the apartment and real estate businesses . Reference is hereby made to the filings of Mid - America Apartment Communities, Inc . , with the Securities and Exchange Commission, including quarterly reports on Form 10 - Q, reports on Form 8 - K, and its annual report on Form 10 - K, particularly including the risk factors contained in the latter filing . Eric Bolton Chairman and CEO 901 - 248 - 4127 eric.bolton@maac.com Al Campbell EVP, CFO 901 - 248 - 4169 al.campbell@maac.com Tim Argo SVP, Finance 901 - 248 - 4149 tim.argo@maac.com Jennifer Patrick Investor Relations 901 - 435 - 5371 jennifer.patrick@maac.com Rob DelPriore EVP, General Counsel 901 - 248 - 4150 robert.delpriore@maac.com Contact