Attached files
| file | filename |
|---|---|
| 8-K - 8-K - APARTMENT INVESTMENT & MANAGEMENT CO | june2014nareitpresentation.htm |

1 INVESTOR PRESENTATION NAREIT REITWEEK – JUNE 2014
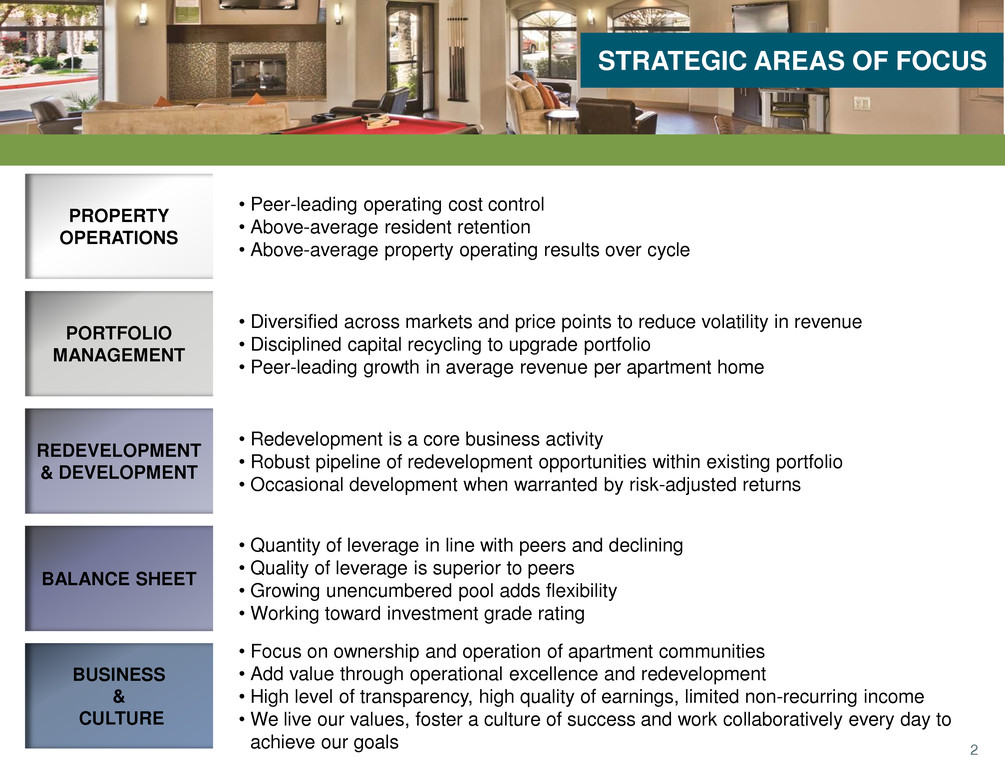
2 STRATEGIC AREAS OF FOCUS • Peer-leading operating cost control • Above-average resident retention • Above-average property operating results over cycle • Diversified across markets and price points to reduce volatility in revenue • Disciplined capital recycling to upgrade portfolio • Peer-leading growth in average revenue per apartment home • Redevelopment is a core business activity • Robust pipeline of redevelopment opportunities within existing portfolio • Occasional development when warranted by risk-adjusted returns • Quantity of leverage in line with peers and declining • Quality of leverage is superior to peers • Growing unencumbered pool adds flexibility •Working toward investment grade rating • Focus on ownership and operation of apartment communities • Add value through operational excellence and redevelopment • High level of transparency, high quality of earnings, limited non-recurring income •We live our values, foster a culture of success and work collaboratively every day to achieve our goals PROPERTY OPERATIONS PORTFOLIO MANAGEMENT REDEVELOPMENT & DEVELOPMENT BALANCE SHEET BUSINESS & CULTURE
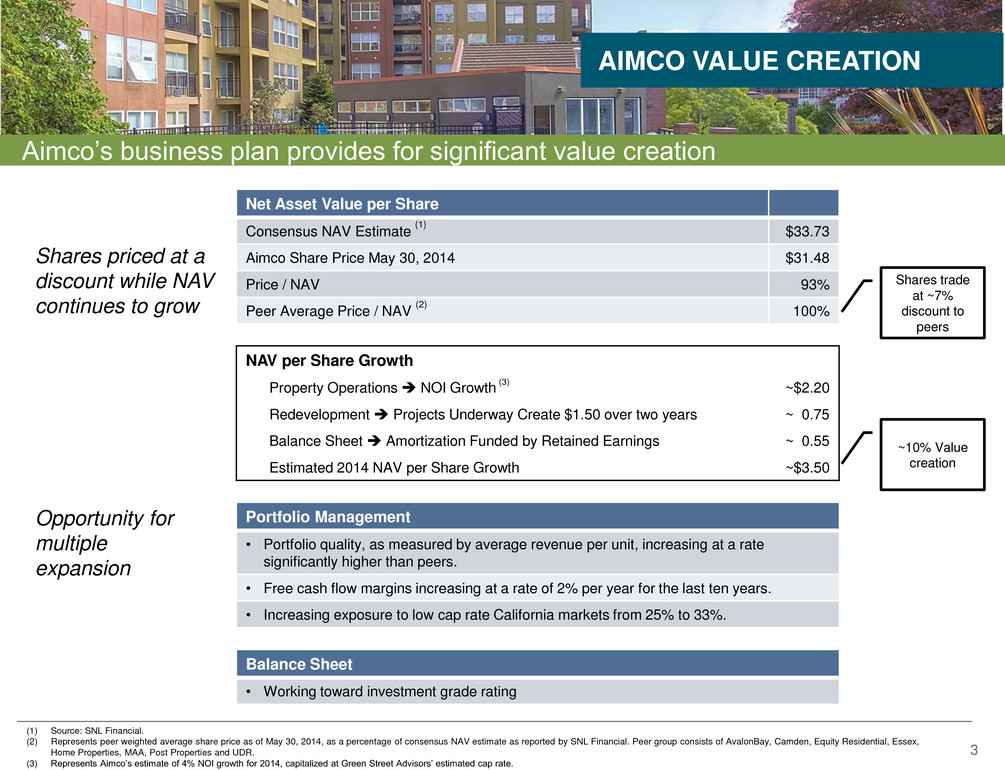
3 Aimco’s business plan provides for significant value creation AIMCO VALUE CREATION Shares priced at a discount while NAV continues to grow Net Asset Value per Share Consensus NAV Estimate (1) $33.73 Aimco Share Price May 30, 2014 $31.48 Price / NAV 93% Peer Average Price / NAV (2) 100% Shares trade at ~7% discount to peers ~10% Value creation Opportunity for multiple expansion Portfolio Management • Portfolio quality, as measured by average revenue per unit, increasing at a rate significantly higher than peers. • Free cash flow margins increasing at a rate of 2% per year for the last ten years. • Increasing exposure to low cap rate California markets from 25% to 33%. Balance Sheet • Working toward investment grade rating (1) Source: SNL Financial. (2) Represents peer weighted average share price as of May 30, 2014, as a percentage of consensus NAV estimate as reported by SNL Financial. Peer group consists of AvalonBay, Camden, Equity Residential, Essex, Home Properties, MAA, Post Properties and UDR. (3) Represents Aimco’s estimate of 4% NOI growth for 2014, capitalized at Green Street Advisors’ estimated cap rate. NAV per Share Growth Property Operations NOI Growth (3) ~$2.20 Redevelopment Projects Underway Create $1.50 over two years ~ 0.75 Balance Sheet Amortization Funded by Retained Earnings ~ 0.55 Estimated 2014 NAV per Share Growth ~$3.50
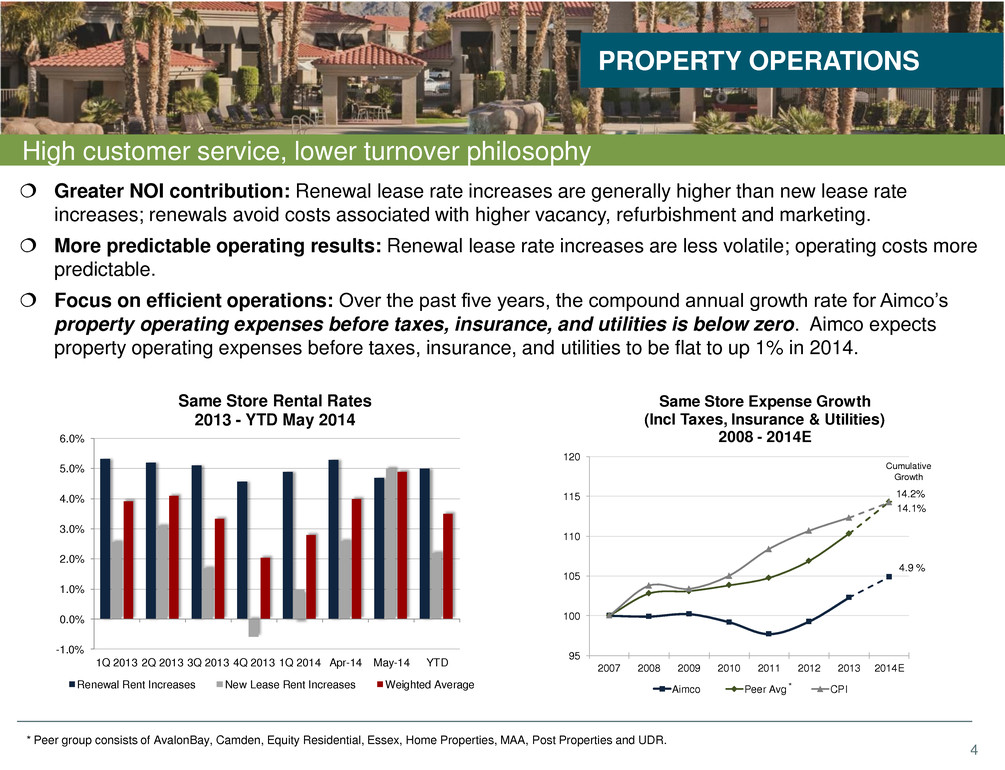
4 High customer service, lower turnover philosophy Greater NOI contribution: Renewal lease rate increases are generally higher than new lease rate increases; renewals avoid costs associated with higher vacancy, refurbishment and marketing. More predictable operating results: Renewal lease rate increases are less volatile; operating costs more predictable. Focus on efficient operations: Over the past five years, the compound annual growth rate for Aimco’s property operating expenses before taxes, insurance, and utilities is below zero. Aimco expects property operating expenses before taxes, insurance, and utilities to be flat to up 1% in 2014. PROPERTY OPERATIONS * Peer group consists of AvalonBay, Camden, Equity Residential, Essex, Home Properties, MAA, Post Properties and UDR. 4.9 % 14.1% 14.2% 95 100 105 110 115 120 2007 2008 2009 2010 2011 2012 2013 2014E Same Store Expense Growth (Incl Taxes, Insurance & Utilities) 2008 - 2014E Aimco Peer Avg CPI Cumulative Growth * 1Q 2013 2Q 2013 3Q 2013 4Q 2013 1Q 2014 Apr-14 May-14 YTD -1.0% 0.0% 1.0% 2.0% 3.0% 4.0% 5.0% 6.0% Same Store Rental Rates 2013 - YTD May 2014 Renewal Rent Increases New Lease Rent Increases Weighted Average
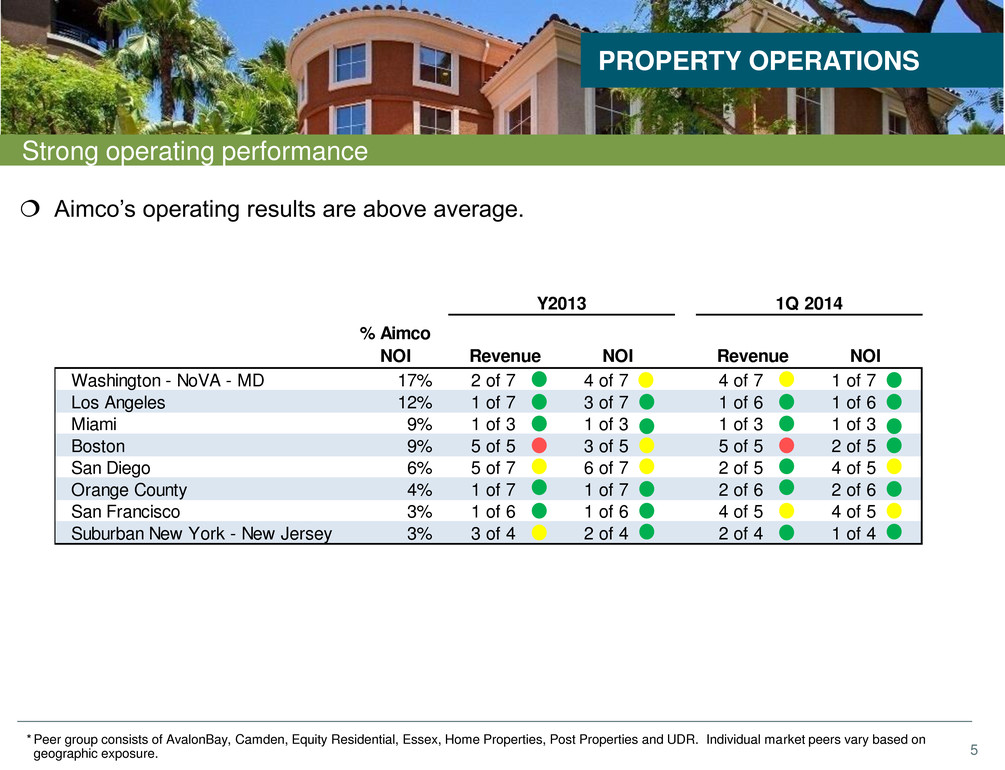
5 Strong operating performance Aimco’s operating results are above average. PROPERTY OPERATIONS * Peer group consists of AvalonBay, Camden, Equity Residential, Essex, Home Properties, Post Properties and UDR. Individual market peers vary based on geographic exposure. % Aimco NOI Revenue NOI Revenue NOI Washington - NoVA - MD 17% 2 of 7 4 of 7 4 of 7 1 of 7 Los Angeles 12% 1 of 7 3 of 7 1 of 6 1 of 6 Miami 9% 1 of 3 1 of 3 1 of 3 1 of 3 Boston 9% 5 of 5 3 of 5 5 of 5 2 of 5 San Diego 6% 5 of 7 6 of 7 2 of 5 4 of 5 Orange County 4% 1 of 7 1 of 7 2 of 6 2 of 6 San Francisco 3% 1 of 6 1 of 6 4 of 5 4 of 5 Suburban New York - New Jersey 3% 3 of 4 2 of 4 2 of 4 1 of 4 1Q 2014Y2013
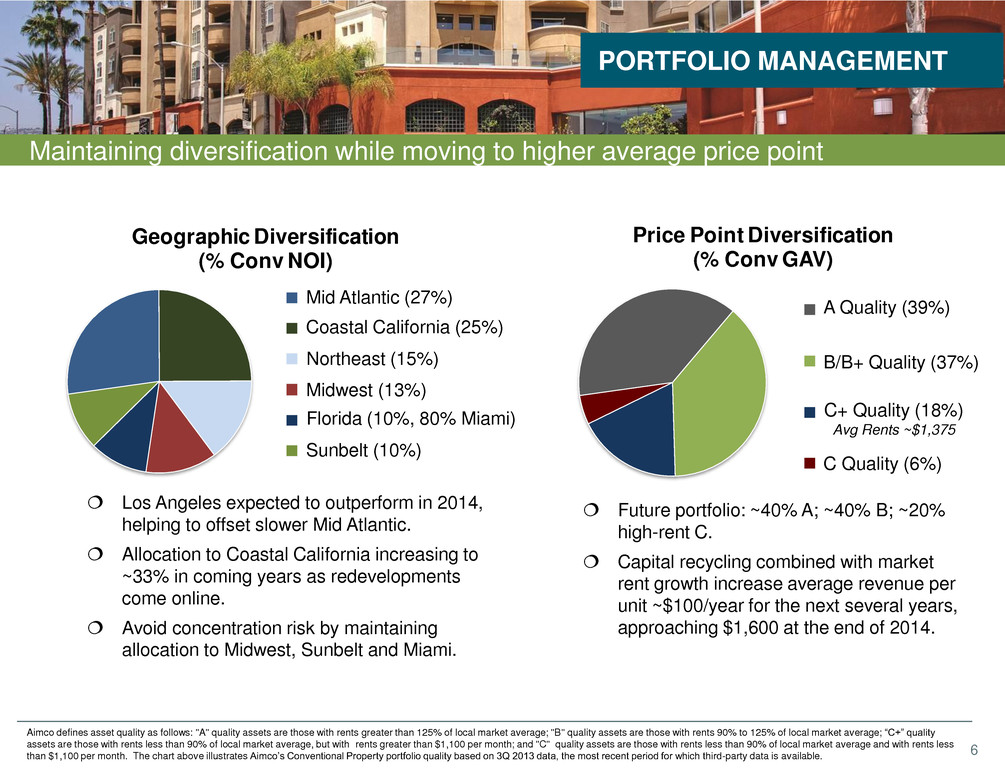
6 Price Point Diversification (% Conv GAV) Geographic Diversification (% Conv NOI) Maintaining diversification while moving to higher average price point Los Angeles expected to outperform in 2014, helping to offset slower Mid Atlantic. Allocation to Coastal California increasing to ~33% in coming years as redevelopments come online. Avoid concentration risk by maintaining allocation to Midwest, Sunbelt and Miami. PORTFOLIO MANAGEMENT Aimco defines asset quality as follows: "A" quality assets are those with rents greater than 125% of local market average; "B" quality assets are those with rents 90% to 125% of local market average; “C+” quality assets are those with rents less than 90% of local market average, but with rents greater than $1,100 per month; and "C" quality assets are those with rents less than 90% of local market average and with rents less than $1,100 per month. The chart above illustrates Aimco’s Conventional Property portfolio quality based on 3Q 2013 data, the most recent period for which third-party data is available. Future portfolio: ~40% A; ~40% B; ~20% high-rent C. Capital recycling combined with market rent growth increase average revenue per unit ~$100/year for the next several years, approaching $1,600 at the end of 2014. Coastal California (25%) Mid Atlantic (27%) Northeast (15%) Midwest (13%) Sunbelt (10%) Florida (10%, 80% Miami) A Quality (39%) B/B+ Quality (37%) C+ Quality (18%) Avg Rents ~$1,375 C Quality (6%)
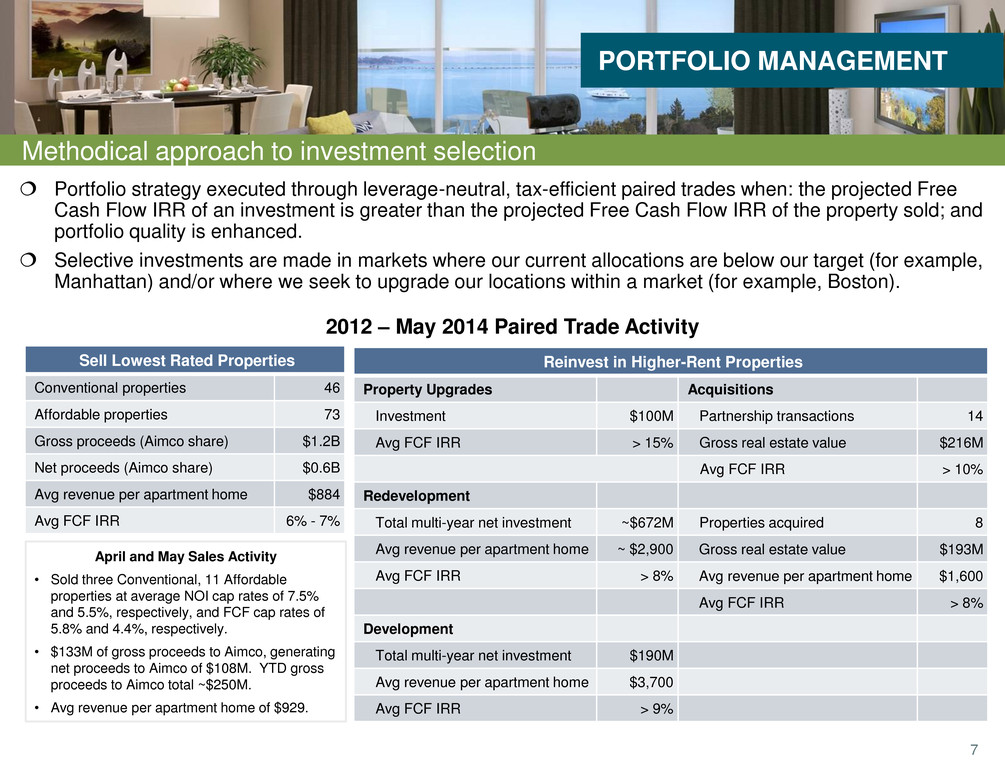
7 Methodical approach to investment selection Portfolio strategy executed through leverage-neutral, tax-efficient paired trades when: the projected Free Cash Flow IRR of an investment is greater than the projected Free Cash Flow IRR of the property sold; and portfolio quality is enhanced. Selective investments are made in markets where our current allocations are below our target (for example, Manhattan) and/or where we seek to upgrade our locations within a market (for example, Boston). 2012 – May 2014 Paired Trade Activity PORTFOLIO MANAGEMENT Sell Lowest Rated Properties Conventional properties 46 Affordable properties 73 Gross proceeds (Aimco share) $1.2B Net proceeds (Aimco share) $0.6B Avg revenue per apartment home $884 Avg FCF IRR 6% - 7% Reinvest in Higher-Rent Properties Property Upgrades Acquisitions Investment $100M Partnership transactions 14 Avg FCF IRR > 15% Gross real estate value $216M Avg FCF IRR > 10% Redevelopment Total multi-year net investment ~$672M Properties acquired 8 Avg revenue per apartment home ~ $2,900 Gross real estate value $193M Avg FCF IRR > 8% Avg revenue per apartment home $1,600 Avg FCF IRR > 8% Development Total multi-year net investment $190M Avg revenue per apartment home $3,700 Avg FCF IRR > 9% April and May Sales Activity • Sold three Conventional, 11 Affordable properties at average NOI cap rates of 7.5% and 5.5%, respectively, and FCF cap rates of 5.8% and 4.4%, respectively. • $133M of gross proceeds to Aimco, generating net proceeds to Aimco of $108M. YTD gross proceeds to Aimco total ~$250M. • Avg revenue per apartment home of $929.
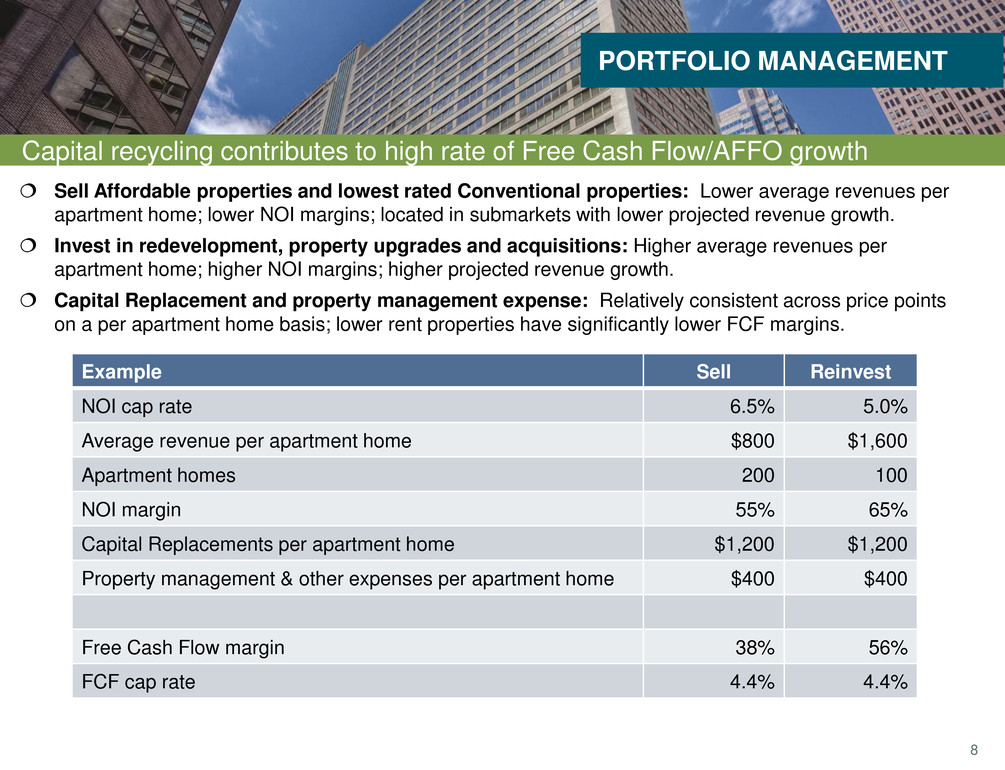
8 Capital recycling contributes to high rate of Free Cash Flow/AFFO growth Sell Affordable properties and lowest rated Conventional properties: Lower average revenues per apartment home; lower NOI margins; located in submarkets with lower projected revenue growth. Invest in redevelopment, property upgrades and acquisitions: Higher average revenues per apartment home; higher NOI margins; higher projected revenue growth. Capital Replacement and property management expense: Relatively consistent across price points on a per apartment home basis; lower rent properties have significantly lower FCF margins. PORTFOLIO MANAGEMENT Example Sell Reinvest NOI cap rate 6.5% 5.0% Average revenue per apartment home $800 $1,600 Apartment homes 200 100 NOI margin 55% 65% Capital Replacements per apartment home $1,200 $1,200 Property management & other expenses per apartment home $400 $400 Free Cash Flow margin 38% 56% FCF cap rate 4.4% 4.4%
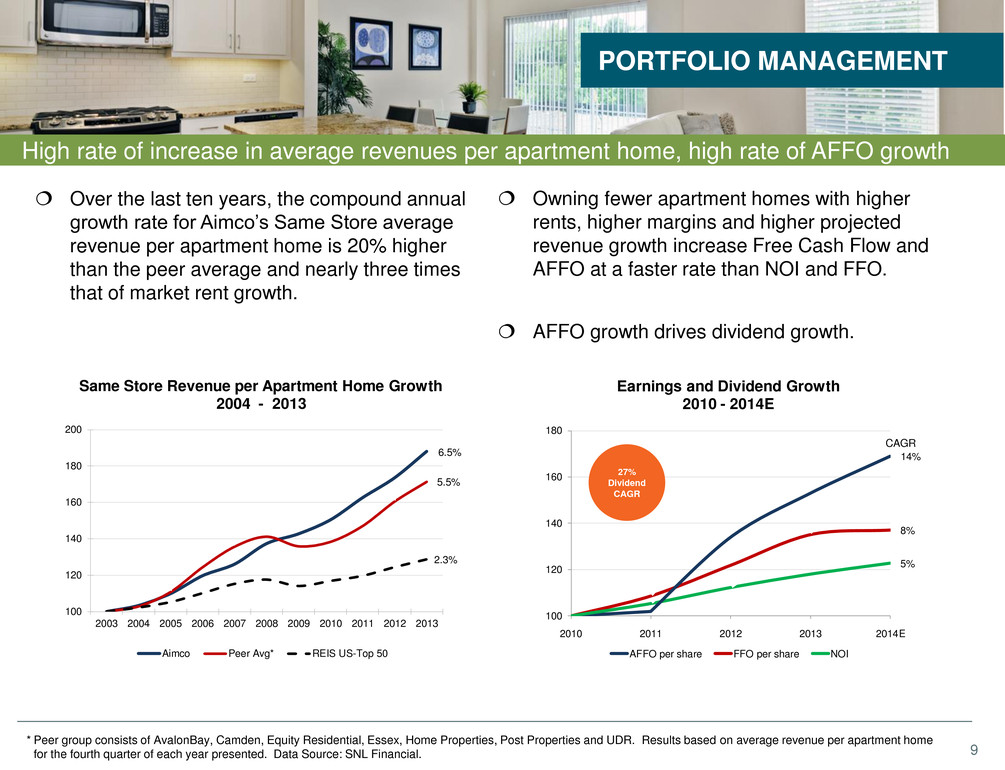
9 8% 5% 14% 100 120 140 160 180 2010 2011 2012 2013 2014E Earnings and Dividend Growth 2010 - 2014E AFFO per share FFO per share NOI High rate of increase in average revenues per apartment home, high rate of AFFO growth Owning fewer apartment homes with higher rents, higher margins and higher projected revenue growth increase Free Cash Flow and AFFO at a faster rate than NOI and FFO. AFFO growth drives dividend growth. PORTFOLIO MANAGEMENT * Peer group consists of AvalonBay, Camden, Equity Residential, Essex, Home Properties, Post Properties and UDR. Results based on average revenue per apartment home for the fourth quarter of each year presented. Data Source: SNL Financial. CAGR 27% Dividend CAGR Over the last ten years, the compound annual growth rate for Aimco’s Same Store average revenue per apartment home is 20% higher than the peer average and nearly three times that of market rent growth. 6.5% 5.5% 2.3% 100 120 140 160 180 200 2003 2004 2005 2006 2007 2008 2009 2010 2011 2012 2013 Same Store Revenue per Apartment Home Growth 2004 - 3 Aimco Peer Avg* REIS US-Top 50
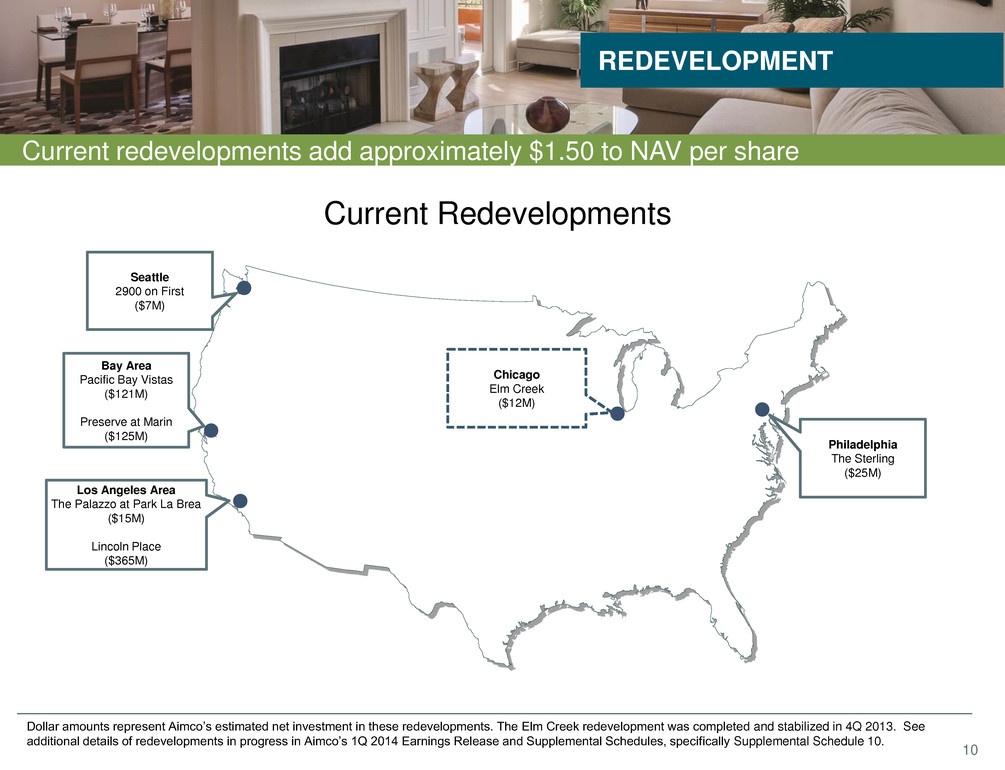
10 REDEVELOPMENT Current redevelopments add approximately $1.50 to NAV per share Chicago Elm Creek ($12M) Philadelphia The Sterling ($25M) Seattle 2900 on First ($7M) Los Angeles Area The Palazzo at Park La Brea ($15M) Lincoln Place ($365M) Bay Area Pacific Bay Vistas ($121M) Preserve at Marin ($125M) Dollar amounts represent Aimco’s estimated net investment in these redevelopments. The Elm Creek redevelopment was completed and stabilized in 4Q 2013. See additional details of redevelopments in progress in Aimco’s 1Q 2014 Earnings Release and Supplemental Schedules, specifically Supplemental Schedule 10. Current Redevelopments
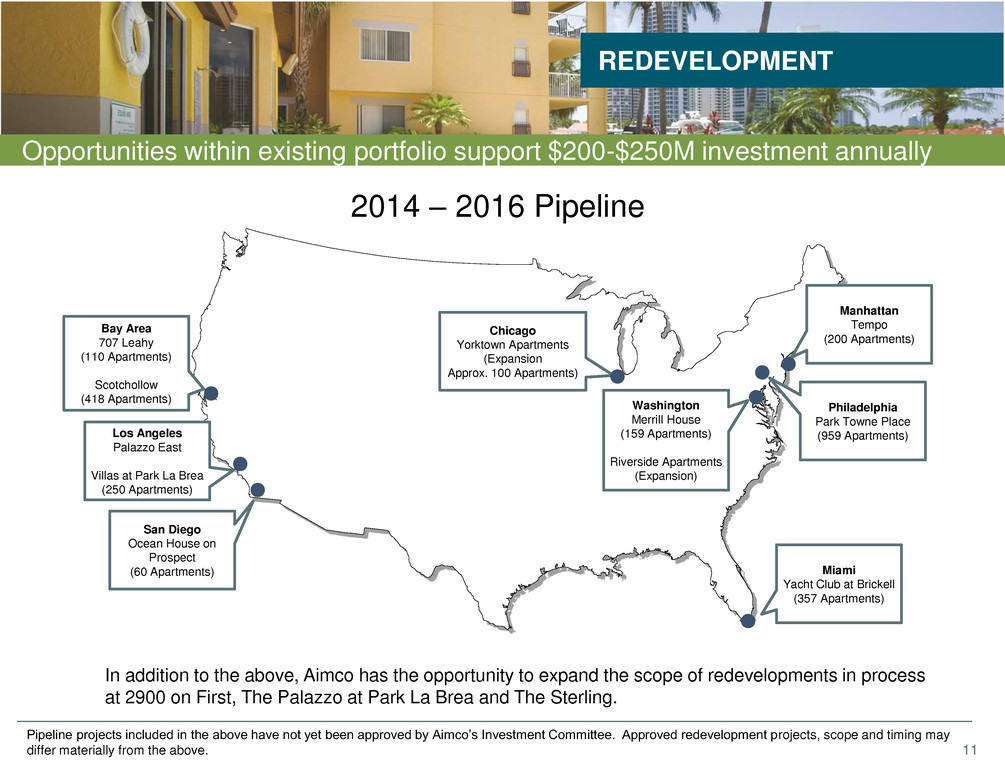
11 REDEVELOPMENT Opportunities within existing portfolio support $200-$250M investment annually San Diego Ocean House on Prospect (60 Apartments) Chicago Yorktown Apartments (Expansion Approx. 100 Apartments) Manhattan Tempo (200 Apartments) Philadelphia Park Towne Place (959 Apartments) Washington Merrill House (159 Apartments) Riverside Apartments (Expansion) Miami Yacht Club at Brickell (357 Apartments) Los Angeles Palazzo East Villas at Park La Brea (250 Apartments) Bay Area 707 Leahy (110 Apartments) Scotchollow (418 Apartments) In addition to the above, Aimco has the opportunity to expand the scope of redevelopments in process at 2900 on First, The Palazzo at Park La Brea and The Sterling. Pipeline projects included in the above have not yet been approved by Aimco’s Investment Committee. Approved redevelopment projects, scope and timing may differ materially from the above. 2014 – 2016 Pipeline
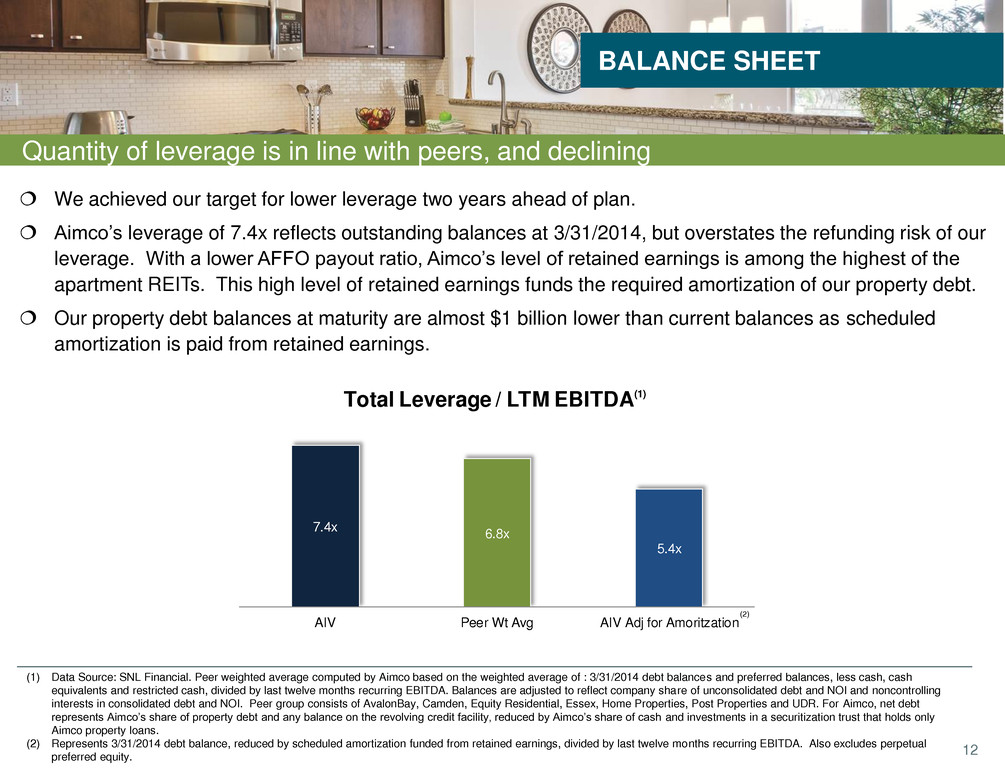
12 Quantity of leverage is in line with peers, and declining We achieved our target for lower leverage two years ahead of plan. Aimco’s leverage of 7.4x reflects outstanding balances at 3/31/2014, but overstates the refunding risk of our leverage. With a lower AFFO payout ratio, Aimco’s level of retained earnings is among the highest of the apartment REITs. This high level of retained earnings funds the required amortization of our property debt. Our property debt balances at maturity are almost $1 billion lower than current balances as scheduled amortization is paid from retained earnings. BALANCE SHEET (1) Data Source: SNL Financial. Peer weighted average computed by Aimco based on the weighted average of : 3/31/2014 debt balances and preferred balances, less cash, cash equivalents and restricted cash, divided by last twelve months recurring EBITDA. Balances are adjusted to reflect company share of unconsolidated debt and NOI and noncontrolling interests in consolidated debt and NOI. Peer group consists of AvalonBay, Camden, Equity Residential, Essex, Home Properties, Post Properties and UDR. For Aimco, net debt represents Aimco’s share of property debt and any balance on the revolving credit facility, reduced by Aimco’s share of cash and investments in a securitization trust that holds only Aimco property loans. (2) Represents 3/31/2014 debt balance, reduced by scheduled amortization funded from retained earnings, divided by last twelve months recurring EBITDA. Also excludes perpetual preferred equity. 7.4x 6.8x 5.4x AIV Peer Wt Avg AIV Adj for Amoritzation Total Leverage / LTM EBITDA(1) (2)
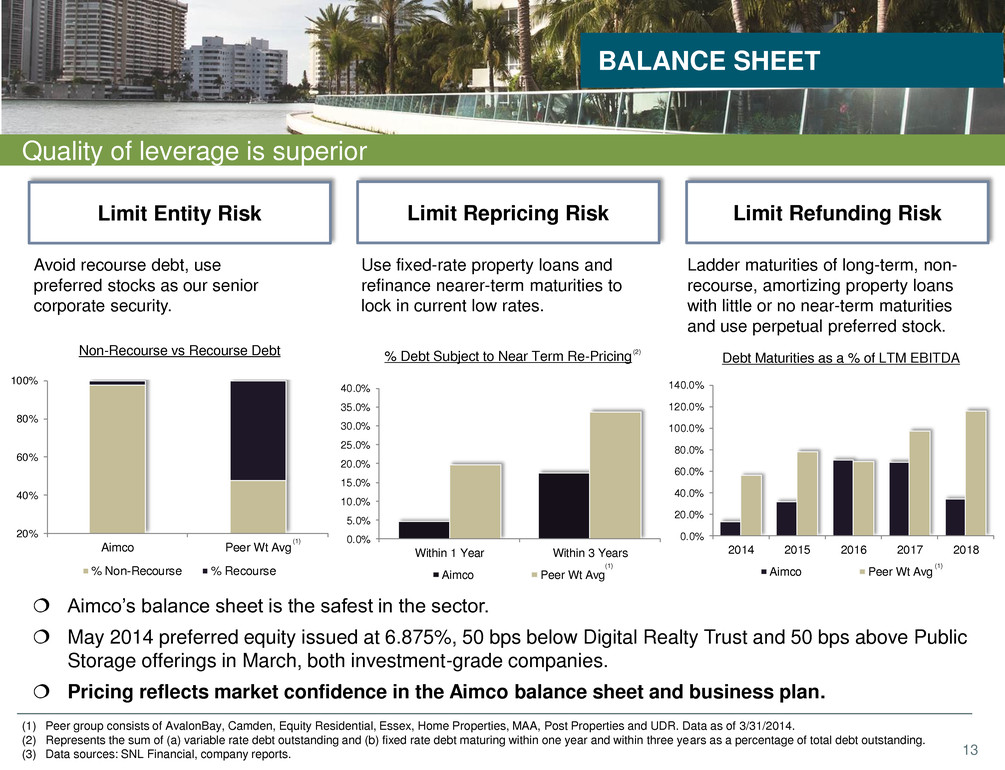
13 Quality of leverage is superior BALANCE SHEET (1) Peer group consists of AvalonBay, Camden, Equity Residential, Essex, Home Properties, MAA, Post Properties and UDR. Data as of 3/31/2014. (2) Represents the sum of (a) variable rate debt outstanding and (b) fixed rate debt maturing within one year and within three years as a percentage of total debt outstanding. (3) Data sources: SNL Financial, company reports. Ladder maturities of long-term, non- recourse, amortizing property loans with little or no near-term maturities and use perpetual preferred stock. Avoid recourse debt, use preferred stocks as our senior corporate security. Limit Entity Risk Use fixed-rate property loans and refinance nearer-term maturities to lock in current low rates. Limit Repricing Risk Limit Refunding Risk Aimco’s balance sheet is the safest in the sector. May 2014 preferred equity issued at 6.875%, 50 bps below Digital Realty Trust and 50 bps above Public Storage offerings in March, both investment-grade companies. Pricing reflects market confidence in the Aimco balance sheet and business plan. 0.0% 20.0% 40.0% 60.0% 80.0% 100.0% 120.0% 140.0% 2014 2015 2016 2017 2018 Aimco Peer Wt Avg 0.0% 5.0% 10.0% 15.0% 20.0% 25.0% 30.0% 35.0% 40.0% Within 1 Year Within 3 Years Aimco Peer Wt Avg 20% 40% 60% 80% 100% Aimco Peer Wt Avg % Non-Recourse % Recourse Debt Maturities as a % of LTM EBITDA % Debt Subject to Near Term Re-Pricing Non-Recourse vs Recourse Debt (1) (1) (1) (2)

14 We live our values, foster a culture of success and work collaboratively BUSINESS & CULTURE Our Vision To be the best owner and operator of apartment communities, inspired by a talented team committed to exceptional customer service, strong financial performance, and outstanding corporate citizenship. This year, we celebrate 10 years of Aimco Cares, our philanthropic arm, created to assist team members, contribute to charitable organizations, and have a positive impact on the communities where we do business. 2013 2014 In 2014, Aimco was again recognized by the Denver Post as a Top Work place based on independent team member surveys.
15 This presentation contains forward-looking statements within the meaning of the federal securities laws, including, without limitation, statements regarding projected results and specifically: forecasts of 2014 financial and operating results; Aimco's development and redevelopment project investments, timelines and stabilized rents; projected returns on property upgrades, acquisitions, redevelopment and development projects; estimated value of 2014 unencumbered asset pool. These forward- looking statements reflect management’s judgment as of this date, and Aimco assumes no obligation to revise or update them to reflect future events or circumstances. These forward-looking statements include certain risks and uncertainties. Readers should carefully review Aimco’s financial statements and notes thereto, as well as the risk factors described in Aimco’s Annual Report on Form 10-K for the year ended December 31, 2013, and the other documents Aimco files from time to time with the Securities and Exchange Commission. This presentation does not constitute an offer of securities for sale. Future quarterly dividend payments are subject to determinations by Aimco's board of directors based on the circumstances at the time of authorization, and the actual dividends paid may vary from the currently expected amounts. FORWARD LOOKING STATEMENTS & OTHER INFORMATION
