Attached files
| file | filename |
|---|---|
| 8-K - 8-K - Farmland Partners Inc. | a14-14457_18k.htm |
Exhibit 99.1
|
|
June 2014 Investor Presentation |
|
|
Forward-Looking Statements Some of the statements contained in this presentation constitute forward-looking statements within the meaning of the federal securities laws. Forward-looking statements relate to expectations, beliefs, projections, future plans and strategies, anticipated events or trends and similar expressions concerning matters that are not historical facts. In some cases, you can identify forward-looking statements by the use of forward-looking terminology such as “may,” “will,” “should,” “expects,” “intends,” “plans,” “anticipates,” “believes,” “estimates,” “projects,” “predicts,” or “potential” or the negative of these words or similar words, which are predictions of or indicate future events or trends and which do not relate solely to historical matters. You can also identify forward-looking statements by discussions of strategy, plans or intentions. The forward-looking statements contained in this presentation reflect our current views about future events and are subject to numerous known and unknown risks, uncertainties, assumptions and changes in circumstances, many of which are beyond our control, that may cause actual results to differ significantly from those expressed in any forward-looking statement. While forward-looking statements reflect our good faith beliefs, assumptions and expectations, they are not guarantees of future performance. Furthermore, we expressly disclaim any obligation to publicly update or revise any forward-looking statement to reflect changes in the underlying assumptions or factors, new information, data or methods, future events or other changes. For a further discussion of these and other factors that could cause our future results to differ significantly from any forward-looking statements, see the section entitled “Risk Factors” in the final prospectus related to our initial public offering, which was filed with the Securities and Exchange Commission on April 14, 2014, and subsequent filings with the Securities and Exchange Commission. This presentation contains statistics and other data that has been obtained from or compiled from information made available by third parties. We have not independently verified such statistics or data. |
|
|
Powerful Long-Term Global Supply & Demand Dynamics _____________________ Sources: OECD, World Bank, FAO, U.S. Geological Survey |
|
|
Attractive Investment Characteristics Yield and crop optionality differentiate farmland from individual agricultural commodity investments Since 1991, farmland has offered consistently positive annual returns and lower volatility, leading to significant cumulative outperformance (1) _____________________ Sources: NCREIF, SNL Financial, FactSET and Economic Research Service/USDA. (1991 = 100) Farmland Cumulative Returns vs. Corn & Soybeans (1) (non-cumulative) Farmland Annual Returns vs. Corn & Soybeans |
|
|
Attractive Investment Characteristics Farmland properties have regularly outperformed other real estate asset classes Since NCREIF began tracking farmland values in 1992, there has not been a year with negative total returns Since 2003, farmland has yielded total returns of 15.8% _________________ Source: National Council of Real Estate Investment Fiduciaries. 2003 2004 2005 2006 2007 2008 2009 2010 201 1 2012 2013 S&P 500 26.4% Retail 23.0% Farm 33.9% Hotel 23.6% Office 20.5% Farm 15.8% S&P 500 23.5% Apartment 18.2% Apartment 15.5% Farm 18.6% S&P 500 29 .6 % Retail 17.1 % Farm 20.5% Apartment 21.2% Farm 21.2% Timber 18.4% Timber 9.5% Farm 6.3% Retail 12.8% Farm 15.2% S&P 500 13.4% Farm 20.9 % Farm 9.7% Apartment 13.0% Industrial 20.3% Office 19.1 % Hotel 18.1% Retail (4.1%) Timber (4.8%) S&P 500 12.8% Industrial 14.6% Retail 11.6% Retail 12.9 % Apartment 8.9% Industrial 12.1% Retail 20.0% Industrial 17.0% Farm 15.9% Industrial (5.8%) Retail ( 10.9 %) Office 11.7% Retail 13.8% Apartment 11.2% Industrial 12.3 % Industrial 8.2% Office 12.0% Office 19.5% Apartment 14.6% Industrial 14.9 % Apartment (7.3%) Apartment (17.5%) Industrial 9.4% Office 13.8 % Industrial 10.7% Apartment 10.4 % Timber 7.7% Timber 11.2% Timber 19.3 % Timber 13.7% Retail 13.5% Office (7.3%) Industrial (17.9%) Hotel 9.0% Hotel 11.8% Office 9.5% Office 9.9% Hotel 6 .1% Hotel 10.2% Hotel 19.0% S&P 500 13.6% Apartment 11.4% Hotel (9.4%) Office (19.1%) Farm 8.8% Timber 1.6% Hotel 8.3% Timber 9.7 % Office 5.7% S&P 500 9.0 % S&P 500 3.0 % Retail 13.3 % S&P 500 3.5% S&P 500 (38.5%) Hotel (20.4%) Timber (0.2%) S&P 500 (0.0%) Timber 7.8% Hotel 7.7 % |
|
|
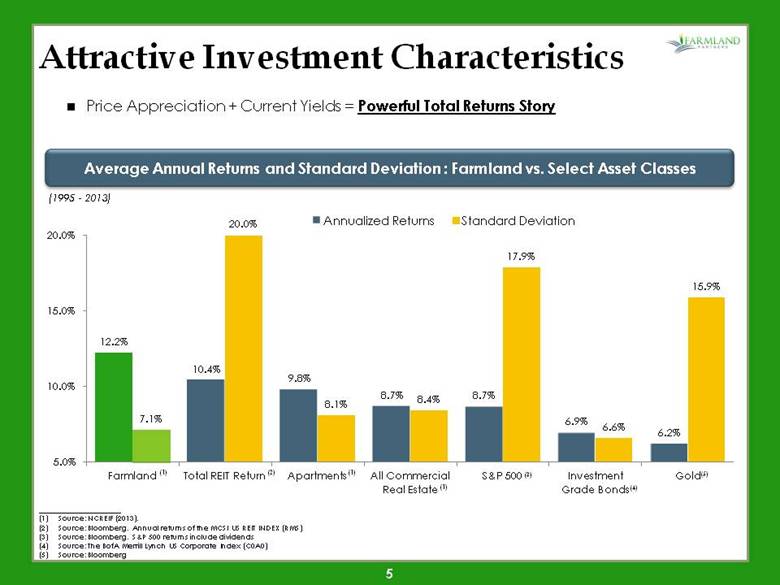
Attractive Investment Characteristics Average Annual Returns and Standard Deviation : Farmland vs. Select Asset Classes _____________________ Source: NCREIF (2013). Source: Bloomberg. Annual returns of the MCSI US REIT INDEX (RMS) Source: Bloomberg. S&P 500 returns include dividends Source: The BofA Merrill Lynch US Corporate Index (C0A0) Source: Bloomberg (1) (2) (3) (4) (5) Price Appreciation + Current Yields = Powerful Total Returns Story (1995 - 2013) (1) (1) |
|
|
Attractive Investment Characteristics Global Fundamentals Operating Environment Capital Markets Opportunity Vs. Real Estate Alternatives: Near-zero Vacancy Up-front Rent Little or no Maintenance Capex Supply Constraints No Obsolescence No Economic Depreciation Vs. Commodity Alternatives: Current Yield Crop Optionality Productivity Gains Long-term Drivers |

|
|
Sustainable Rents with Room to Grow Farmland rents remain in line with or below long term averages on several key metrics: Vs. Crop Value Vs. Farm Value Vs. Overall Farm Profitability Non-Rent Cash Costs US Corn Farmer Economics US Cropland Rent-to-Value _____________________ Source: USDA ERS, Commodity Costs and Returns (2013) _____________________ Source: USDA NASS (2013) _____________________ Source: Iowa State University Extension and Outreach Iowa Cash Rent as % of Gross Crop Revenue Avg. 4.0% |
|
|
$16.6 $93.3 $14.7 $19.0 Our Focus on Primary Row Crops We focus on primary row crops because we believe this segment of the market generates the most attractive returns with a lower risk profile: Essential components of the global food supply Direct beneficiary of long-term global and economic trends Crop optionality allows for flexibility over time Our Focus Description of Farmland Production Segment 2007 Market Value of U.S. Harvest Products Sold ($B) Permanent crops such as trees and vines Includes pears, peaches, apples, plums, figs, oranges, lemons, cherries, avocados, walnuts, pecans, almonds, pistachios and wine and table grapes Produce row crops produce fruits and vegetables annually Includes strawberries, raspberries, blackberries, cantaloupes, peppers, beans, peas, celery, melons, tomatoes, lettuce, cabbage, radicchio and other leaf produce Primary crops produce non-vegetable crops annually Includes corn, soybeans, wheat, rice, cotton, sugar cane, barley and beets Also includes irrigated hay and other forage _____________________ Sources: FAO (The Resource Outlook to 2050), USDA Farm Census (2007) (1) Products sold during the 2007 fiscal year Nursery, Greenhouse, Floriculture and Sod $106.6 $16.0 $17.0 (1) Permanent crops have permanent plants, such as trees and vines Includes pears, peaches, apples, plums, figs, oranges, lemons, cherries, avocados, walnuts, pecans, almonds, pistachios, wine and table grapes Produce row crops produce fruits and vegetables annually Includes strawberries, raspberries, blackberries, cantaloupes, peppers, beans, peas, celery, melons, tomatoes, lettuce, cabbage, radicchio, and other leaf produce Primary row crops produce annually Includes wheat, corn, rice, cotton, sugar cane, barley and beets Previous Example $106.6 $16.0 $17.0 |
|
|
Only Publicly Traded Company with a Focus on Primary Row Crops Our growth strategy provides multiple avenues to support and grow the bottom line with low cost of capital and high levels of operating leverage Highly efficient aggregator of primarily mid-sized farms, not always competing directly with other large institutions Low cost of capital relative to individual farmers and institutional buyers “First call” for broker relationships in key farming markets around the country Attractive play for individual investors seeking modest, liquid exposure to farmland Farming is a highly fragmented industry, with relatively few operators enjoying true economies of scale Over time, we expect to leverage our tenants’ buying power to create meaningful cost savings, supporting higher rent for the REIT and enhanced profitability and credit profile of our tenants OP units provide unique tax-deferred currency First-Mover Advantage Tenant Value Creation |
|
|
Acquisition Criteria & Process Currently evaluating more than 10 properties representing about 20,000 acres and approximately $100 million of estimated market value We look for good land and good tenants Improve farms and increase rents through improvements in drainage, irrigation, storage, input purchasing and agronomy and business management support Soil Quality Water Availability Climate Market Access Many Potential Tenants Experience and reputation Financial stability and willingness to pay a competitive rental rate Similar factors considered in sale-leaseback transactions Existing leases with us Active management of rent rolls is key to maximizing returns Management has experience with both closing deals and getting to a “quick no” Efficient diligence program makes use of local resources Knowledge and network to avoid “out of town” pricing faced by many institutional buyers Selecting the Property Selecting the Tenant Executing on Acquisitions |
|
|
11 Executing Our Strategy Key Metric At IPO Pro Forma for 4/21 Acquisition(4) Pro Forma for 5/29 Acquisition(5) Total Acres 7,323 10,494 22,994 Implied Cap Rate(1): - at market stock price(2) - at IPO stock price(3) 3.37% 3.37% 3.65% 3.50% 4.12% 3.87% Total Number of Tenants 4 5 11 % of Acres Rented by Unrelated Parties 16% 41% 73% Rapid execution of our acquisition strategy has increased our implied capitalization rate, reduced portfolio concentration, and diversified our tenant base and, after giving effect to our expected acquisition, is expected to triple the acres in our portfolio Announced Q2 dividend of $0.105 per share, representing an annualized yield of 3.0% on the IPO price or 3.3% on the May 29 closing price (1) Implied cap rate calculated as run-rate Net Operating Income divided by implied value. (2) Implied value calculated based on the IPO stock price of $14.00 and the closing stock price of $13.40 and $12.88 on 4/21/2014 and 5/29/2014, respectively, plus proforma post-IPO net debt adjusted for acquisitions. (3) Implied value calculated based on the IPO stock price of $14.00, plus proforma post-IPO net debt adjusted for acquisitions. (4) The acquisition closed on May 30, 2014. (5) The acquisition, which is subject to customary closing conditions, is expected to close in June 2014. |

|
|
12 (1) After giving effect to the expected acquisition of Hudye Farms U.S., Inc. (2) Based on management’s estimates, including grain storage facilities. (3) Excluding grain storage facilities. High Quality Farmland Portfolio(1) 22,994 acres located in three states in the U.S. heartland States Acres Estimated Private Market Value(2) Approximate Estimated $ / Acre(3) Illinois 5,744 $73.1 million $12,550 Nebraska 618 $9.2 million $13,250 Colorado 16,632 $33.7 million $2,050 Total 22,994 $116.0 million $4,950 |
