Attached files
| file | filename |
|---|---|
| 8-K - FORM 8-K - Atlantic Union Bankshares Corp | v380036_8k.htm |
Exhibit 99.1

Investor Presentation May 2014

Forward - Looking Statement Certain statements in this report may constitute “forward - looking statements” within the meaning of the Private Securities Litigation Reform Act of 1995. Forward - looking statements are statements that include projections, predictions, expectations, or beliefs about future events or results or otherwise and are not statements of historical fact. Such statements are often characterized by the use of qualified words (and their derivatives) such as “expect,” “believe,” “estimate,” “plan,” “project,” “anticipate,” “intend,” “will,” or words of similar meaning or other statements concerning opinions or judgment of the Company and its management about future events. Although the Company believes that its expectations with respect to forward - looking statements are based upon reasonable assumptions within the bounds of its existing knowledge of its business and operations, there can be no assurance that actual results, performance, or achievements of the Company will not differ materially from any future results, performance, or achievements expressed or implied by such forward - looking statements. Actual future results and trends may differ materially from historical results or those anticipated depending on a variety of factors, including, but not limited to, the effects of and changes in: general economic and bank industry conditions, the interest rate environment, legislative and regulatory requirements, competitive pressures, new products and delivery systems, inflation, changes in the stock and bond markets, accounting standards or interpretations of existing standards, mergers and acquisitions, technology, and consumer spending and savings habits. More information is available on the Company’s website, http://investors.bankatunion.com and on the Securities and Exchange Commission’s website, www.sec.gov. The information on the Company’s website is not a part of this press release. The Company does not intend or assume any obligation to update or revise any forward - looking statements that may be made from time to time by or on behalf of the Company. 2
Company Overview • The largest community banking organization headquartered in Virginia • Holding company formed in 1993 – Banking history goes back more than 100 years • Assets of $7.3 Billion • Comprehensive financial services provider offering commercial and retail banking, mortgage, investment, trust and insurance products and services 3
Union’s Strengths • Unique branch network across Virginia, competitive banking products and services and a loyal client base • Well positioned for organic growth given commercial activity, household income levels and population growth in its footprint • Strong balance sheet and solid capital base • Conservative in - market lender • Experienced management team • Successful acquirer and integrator • Proven financial performance in both good and bad economic climates 4

Union First Market Footprint 5 • Acquisition of StellarOne Corporation resulted in statewide footprint • Only Virginia - based bank with a statewide presence – 131 branches
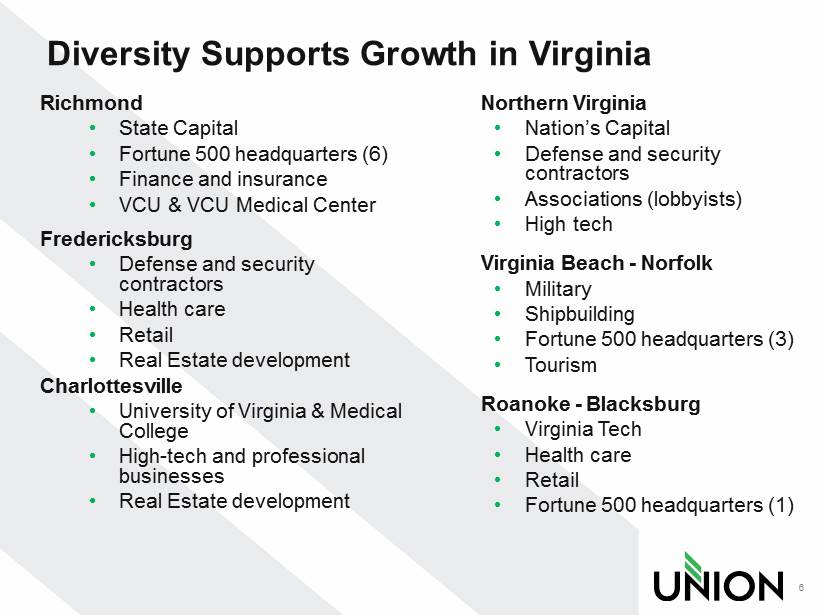
Diversity Supports Growth in Virginia Richmond • State Capital • Fortune 500 headquarters (6) • Finance and insurance • VCU & VCU Medical Center Fredericksburg • Defense and security contractors • Health care • Retail • Real Estate development Charlottesville • University of Virginia & Medical College • High - tech and professional businesses • Real Estate development Northern Virginia • Nation’s Capital • Defense and security contractors • Associations (lobbyists) • High tech Virginia Beach - Norfolk • Military • Shipbuilding • Fortune 500 headquarters (3) • Tourism Roanoke - Blacksburg • Virginia Tech • Health care • Retail • Fortune 500 headquarters (1) 6

NC DC VA AL CT DE GA IL IN KY MA MD MI MS NJ NY OH RI SC TN WV Branch Franchise 7 Branches FTEs Assets Loans Deposits 131 1,628 $7.3 Billion $5. 3 Billion $5.7 Billion Source: SNL Financial and MapInfo Professional Note: Richmond market total deposits includes non - retail deposits; Richmond market share represents retail market share as defin ed per SNL Financial; Fredericksburg market defined as Caroline, Fredericksburg City, King George, Spotsylvania, & Stafford counties; all other markets per MSA de fin itions in SNL Financial Richmond Rank: #5 Deposits: $1.6 bn Market Tot.: $71.8 bn Mkt. Share: 5.2% Blacksburg Rank: #1 Deposits: $709 mm Market Tot.: $2.8 bn Mkt. Share: 25.6% Staunton / Harrisonburg Rank: #2 Deposits: $484 mm Market Tot.: $3.4 bn Mkt. Share: 14.3% Culpeper Rank: #1 Deposits: $205 mm Market Tot.: $0.6 bn Mkt. Share: 33.3% MSA Market Share Rank Company Deposits Total Market Deposits Market Share Roanoke Deposits: $353 mm Market Tot.: $7.2 bn Mkt. Share: 4.9% Rank : #6 Charlottesville Rank: #4 Deposits: $434 mm Market Tot.: $3.6 bn Mkt. Share: 11.9% VA Fredericksburg Rank: #2 Deposits: $822 mm Market Tot.: $3.5 bn Mkt. Share: 23.3% Branches: 8 Branches: 13 Branches: 4 Branches: 14 Branches: 43 Branches: 8 Branches: 8 Statewide Rank: #6 Deposits: $5.7 bn Market Tot.: $167 bn Mkt. Share: 3.44% Highlights
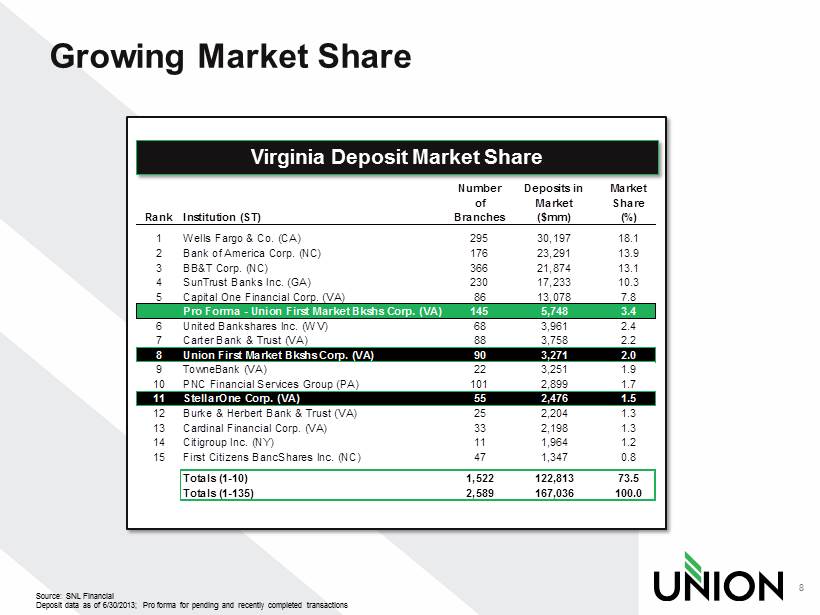
Growing Market Share 8 Virginia Deposit Market Share Source: SNL Financial Deposit data as of 6/30/2013; Pro forma for pending and recently completed transactions Rank Institution (ST) Number of Branches Deposits in Market ($mm) Market Share (%) 1 Wells Fargo & Co. (CA) 295 30,197 18.1 2 Bank of America Corp. (NC) 176 23,291 13.9 3 BB&T Corp. (NC) 366 21,874 13.1 4 SunTrust Banks Inc. (GA) 230 17,233 10.3 5 Capital One Financial Corp. (VA) 86 13,078 7.8 Pro Forma - Union First Market Bkshs Corp. (VA) 145 5,748 3.4 6 United Bankshares Inc. (WV) 68 3,961 2.4 7 Carter Bank & Trust (VA) 88 3,758 2.2 8 Union First Market Bkshs Corp. (VA) 90 3,271 2.0 9 TowneBank (VA) 22 3,251 1.9 10 PNC Financial Services Group (PA) 101 2,899 1.7 11 StellarOne Corp. (VA) 55 2,476 1.5 12 Burke & Herbert Bank & Trust (VA) 25 2,204 1.3 13 Cardinal Financial Corp. (VA) 33 2,198 1.3 14 Citigroup Inc. (NY) 11 1,964 1.2 15 First Citizens BancShares Inc. (NC) 47 1,347 0.8 Totals (1-10) 1,522 122,813 73.5 Totals (1-135) 2,589 167,036 100.0

StellarOne Acquisition Financial Recap 9 Projections Assumptions • Net expense savings of 32%, or $28 million pre - tax • 65% phased in by 2014; 100% thereafter • Share repurchases of $65 million planned for 2014 and 2015 with excess capital • One time merger related expenses of approximately $19.5 million after - tax • Credit mark of 2.5% • Double digit accretion to earnings per share with fully phased in expense savings • Single digit tangible book value per share dilution • Accretive in approximately 5 years • Approximately 25 bps accretive to tangible common equity / tangible assets • Internal rate of return > 20% Results to date • Net expense savings - On track • ~820 ,000 shares repurchased as of April 18, 2014 $44 million of authorization remaining • ~$11 million of one - time merger related after - tax expenses incurred to date • Credit mark of 2.5%
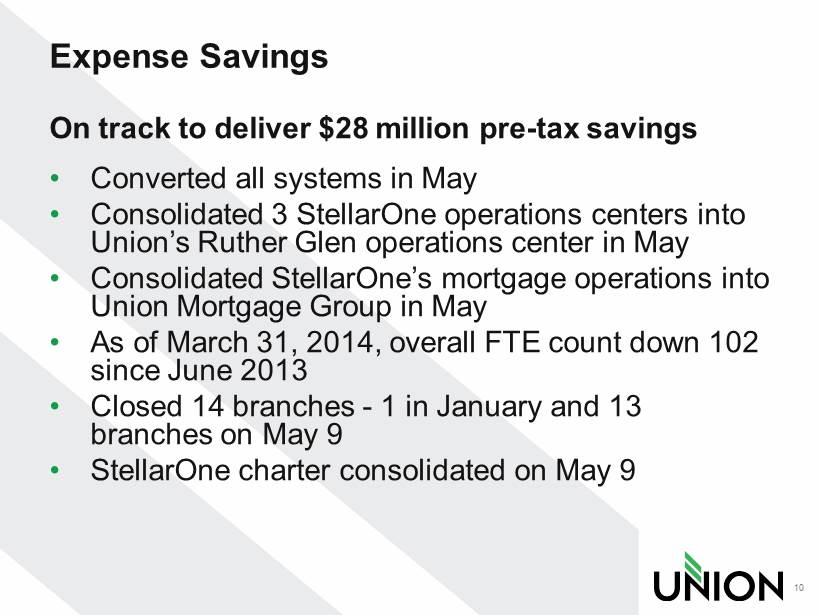
Expense Savings On track to deliver $28 million pre - tax savings • Converted all systems in May • Consolidated 3 StellarOne operations centers into Union’s Ruther Glen operations center in May • Consolidated StellarOne’s mortgage operations into Union Mortgage Group in May • As of March 31, 2014, overall FTE count down 102 since June 2013 • Closed 14 branches - 1 in January and 13 branches on May 9 • StellarOne charter consolidated on May 9 10

Balance Sheet Trends 11 $0 $1,000,000 $2,000,000 $3,000,000 $4,000,000 $5,000,000 $6,000,000 2010 2011 2012 2013 2014 1Q $ 2,837 $ 2,819 $ 2,967 $ 3,039 $ 5,274 Loans ($M) $0 $1,000,000 $2,000,000 $3,000,000 $4,000,000 $5,000,000 $6,000,000 2010 2011 2012 2013 2014 1Q $ 3,070 $ 3,175 $ 3,298 $ 3,237 $ 5,686 Deposits ($M) $0 $1,000,000 $2,000,000 $3,000,000 $4,000,000 $5,000,000 $6,000,000 $7,000,000 $8,000,000 2010 2011 2012 2013 2014 1Q $3,837 $3,907 $4,096 $4,177 $7,295 Assets ($M) • First quarter financial results include the full quarter financial results of StellarOne which was acquired on January 1, 2014

Capital Ratios 12 • Union has authorization to repurchase $65 million worth of stock by the end of 2015 • ~820,000 shares repurchased at an average price of $25.23 per share leaving approximately $44 million remaining as of April 18, 2014 0.00% 2.00% 4.00% 6.00% 8.00% 10.00% 12.00% 14.00% 16.00% 2010 2011 2012 2013 2014 1Q 14.68% 14.51% 14.57% 14.17% 13.70% 8.22% 8.91% 8.97% 8.94% 9.29% Total risk-based capital Tangible Equity/Tangible Assets

Profitability Ratio’s and Income Trends 13 * excludes after - tax acquisition expenses 0.40% 0.50% 0.60% 0.70% 0.80% 0.90% 1.00% 2010* 2011* 2012* 2013* 2014 1Q* 0.78% 0.80% 0.89% 0.90% 0.94% Return on Average Assets 8.80% 9.00% 9.20% 9.40% 9.60% 9.80% 10.00% 10.20% 10.40% 2010* 2011* 2012* 2013* 2014 1Q* 9.77% 9.42% 9.89% 10.07% 10.33% Return On Tangible Common Equity $0 $5,000 $10,000 $15,000 $20,000 $25,000 $30,000 $35,000 $40,000 2010* 2011* 2012 2013* 2014 1Q* $29,129 $ 30,722 $35,411 $36,538 $16,831 Net Income ($)

Core Net Interest Margin 14 * Excludes acquisition accounting impact 0.00% 0.50% 1.00% 1.50% 2.00% 2.50% 3.00% 3.50% 4.00% 4.50% 5.00% 2010* 2011* 2012* 2013* 2014 1Q 4.24% 4.37% 4.24% 4.18% 3.99% Best - in - Class Net Interest Margin
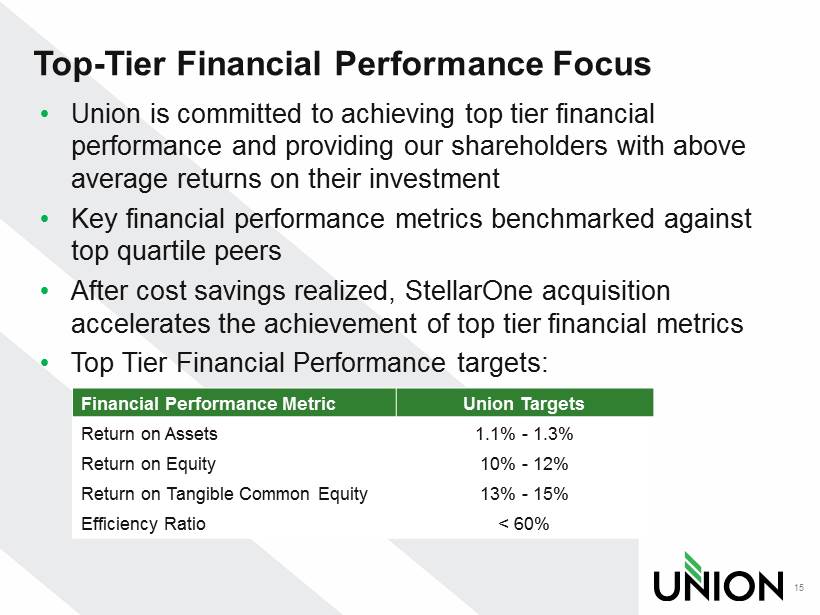
Top - Tier Financial Performance Focus • Union is committed to achieving top tier financial performance and providing our shareholders with above average returns on their investment • Key financial performance metrics benchmarked against top quartile peers • After cost savings realized, StellarOne acquisition accelerates the achievement of top tier financial metrics • Top Tier Financial Performance targets: 15 Financial Performance Metric Union Targets Return on Assets 1.1% - 1.3% Return on Equity 10% - 12% Return on Tangible Common Equity 13% - 15% Efficiency Ratio < 60%
2014 Outlook • Focus on integration of StellarOne and achieving cost savings target • Leveraging new franchise • Stable to growing economy in footprint • Low to Mid - single digit loan growth • Modest net interest margin compression • Continued asset quality improvement • Improving ROA, ROTCE and Efficiency Ratio • $65 million in share repurchases authorized through 2015 - $44 million remaining 16

Value Proposition • Statewide Branch footprint is a competitive advantage and brings a unique franchise value • Strong balance sheet and capital base • Best in class net interest margin • Experienced management team • Proven acquirer and integrator • Committed to top tier financial performance • Shareholder Value Driven • Solid dividend yield and payout ratio with earnings upside 17

THANK YOU!