Attached files
Table of Contents
UNITED STATES
SECURITIES AND EXCHANGE COMMISSION
Washington, D.C. 20549
FORM 10-K
| x | ANNUAL REPORT PURSUANT TO SECTION 13 OR 15(d) OF THE SECURITIES EXCHANGE ACT OF 1934 |
For the fiscal year ended December 31, 2009
| ¨ | TRANSITION REPORT PURSUANT TO SECTION 13 OR 15(d) OF THE SECURITIES EXCHANGE ACT OF 1934 |
Commission file number: 0-20293
UNION FIRST MARKET BANKSHARES CORPORATION
(Exact name of registrant as specified in its charter)
| VIRGINIA | 54-1598552 | |
| (State or other jurisdiction of incorporation or organization) |
(I.R.S. Employer Identification No.) |
111 Virginia Street, Suite 200, Richmond, Virginia 23219
(Address of principal executive offices) (Zip Code)
Registrant’s telephone number, including area code is (804) 633-5031
Securities registered pursuant to Section 12(b) of the Act:
| Title of each class |
Name of exchange on which registered | |
| Common Stock, par value $1.33 per share | The NASDAQ Global Select Market |
Securities registered pursuant to Section 12(g) of the Act: None
Indicate by check mark if the registrant is a well-known seasoned issuer, as defined in Rule 405 of the Securities Act.
Yes ¨ No x
Indicate by check mark if the registrant is not required to file reports pursuant to Section 13 or Section 15(d) of the Act.
Yes ¨ No x
Indicate by check mark whether the registrant (1) has filed all reports required to be filed by Section 13 or 15(d) of the Securities Exchange Act of 1934 during the preceding 12 months (or for such shorter period that the registrant was required to file such reports), and (2) has been subject to such filing requirements for the past 90 days.
Yes x No ¨
Indicate by check mark whether the registrant has submitted electronically and posted on its corporate Website, if any, every Interactive Data File required to be submitted and posted pursuant to Rule 405 of Regulation S-T (§232.405 of this chapter) during the preceding 12 months (or for such shorter period that the registrant was required to submit and post such files).
Yes ¨ No ¨
Indicate by check mark if disclosure of delinquent filers pursuant to Item 405 of Regulation S-K (§ 29.405 of this chapter) is not contained herein, and will not be contained, to the best of registrant’s knowledge, in definitive proxy or information statements incorporated by reference in Part III of this Form 10-K or any amendment to this Form 10-K. ¨
Indicate by check mark whether the registrant is a large accelerated filer, an accelerated filer, a non-accelerated filer or a smaller reporting company. See the definitions of “large accelerated filer”, “accelerated filer” and “smaller reporting company” in Rule 12b-2 of the Exchange Act. (Check one):
| Large accelerated filer | ¨ | Accelerated filer | x | |||
| Non-accelerated filer | ¨ | Smaller reporting company | ¨ | |||
Indicate by check mark whether the registrant is a shell company (as defined in Rule 12b-2 of the Act).
Yes ¨ No x
The aggregate market value of voting stock held by non-affiliates of the registrant as of June 30, 2009 was approximately $187,312,231.
The number of shares of common stock outstanding as of March 5, 2010 was 25,928,948.
DOCUMENTS INCORPORATED BY REFERENCE
Portions of the registrant’s definitive proxy statement to be used in conjunction with the registrant’s 2010 Annual Meeting of Shareholders are incorporated by reference into Part III of this Form 10-K.
Table of Contents
UNION FIRST MARKET BANKSHARES CORPORATION
FORM 10-K
INDEX
| PAGE | ||||
| ITEM |
||||
| PART I | ||||
| Item 1. |
1 | |||
| Item 1A. |
10 | |||
| Item 1B. |
17 | |||
| Item 2. |
17 | |||
| Item 3. |
17 | |||
| Item 4. |
18 | |||
| PART II | ||||
| Item 5. |
18 | |||
| Item 6. |
20 | |||
| Item 7. |
Management’s Discussion and Analysis of Financial Condition and Results of Operations |
21 | ||
| Item 7A. |
42 | |||
| Item 8. |
43 | |||
| Item 9. |
Changes in and Disagreements with Accountants on Accounting and Financial Disclosure |
82 | ||
| Item 9A. |
82 | |||
| Item 9B. |
83 | |||
| PART III | ||||
| Item 10. |
83 | |||
| Item 11. |
83 | |||
| Item 12. |
Security Ownership of Certain Beneficial Owners and Management and Related Stockholder Matters |
83 | ||
| Item 13. |
Certain Relationships and Related Transactions, and Director Independence |
84 | ||
| Item 14. |
84 | |||
| PART IV | ||||
| Item 15. |
84 | |||
Table of Contents
FORWARD-LOOKING STATEMENTS
Certain statements in this report may constitute “forward-looking statements” within the meaning of the Private Securities Litigation Reform Act of 1995. Forward-looking statements are statements that include projections, predictions, expectations or beliefs about future events or results or otherwise are not statements of historical fact. Such statements are often characterized by the use of qualified words (and their derivatives) such as “expect,” “believe,” “estimate,” “plan,” “project,” “anticipate” or other statements concerning opinions or judgment of the Company and its management about future events. Although the Company believes that its expectations with respect to forward-looking statements are based upon reasonable assumptions within the bounds of its existing knowledge of its business and operations, there can be no assurance that actual results, performance or achievements of the Company will not differ materially from any future results, performance or achievements expressed or implied by such forward-looking statements. Actual future results and trends may differ materially from historical results or those anticipated depending on a variety of factors, including, but not limited to, the effects of and changes in: general economic conditions, the interest rate environment, legislative and regulatory requirements, competitive pressures, new products and delivery systems, inflation, changes in the stock and bond markets, technology, and consumer spending and savings habits. The Company does not update any forward-looking statements that may be made from time to time by or on behalf of the Company.
GENERAL
Union First Market Bankshares Corporation (the “Company”) is a multi-bank holding company organized under Virginia law and registered under the Bank Holding Company Act of 1956. The Company is headquartered in Richmond, Virginia. The Company is committed to the delivery of financial services through its four community bank subsidiaries (the “Community Banks”) and three non-bank financial services affiliates. The Company’s Community Banks and non-bank financial services affiliates are:
| Community Banks | ||||||
| Union Bank and Trust Company |
Bowling Green, Virginia | |||||
| First Market Bank |
Richmond, Virginia | |||||
| Northern Neck State Bank |
Warsaw, Virginia | |||||
| Rappahannock National Bank |
Washington, Virginia | |||||
| Financial Services Affiliates | ||||||
| Union Mortgage Group, Inc. |
Annandale, Virginia | |||||
| Union Investment Services, Inc. |
Ashland, Virginia | |||||
| Union Insurance Group, LLC |
Bowling Green, Virginia | |||||
History
The Company was formed in connection with the July 1993 merger of Northern Neck Bankshares Corporation and Union Bancorp, Inc. In connection with the merger, Union Bank and Trust Company (“Union Bank”) and Northern Neck State Bank became wholly owned bank subsidiaries of the Company. Although the Company was formed in 1993, the Community Banks are among the oldest in Virginia. Union Bank and Rappahannock National Bank began business in 1902 and Northern Neck State Bank dates back to 1909. On September 1, 1996, King George State Bank and on July 1, 1998, Rappahannock
1
Table of Contents
National Bank became wholly owned subsidiaries of the Company. On February 22, 1999, Bay Community Bank (formerly The Bank of Williamsburg) began business as a newly organized bank. In June 1999, King George State Bank was merged into Union Bank, the Company’s largest subsidiary. The Company acquired Guaranty Financial Corporation and its wholly owned subsidiary, Guaranty Bank (“Guaranty”), on May 1, 2004, and operated Guaranty as a separate subsidiary until September 13, 2004, when Guaranty was merged into Union Bank. The Company acquired Prosperity Bank & Trust Company (“Prosperity”) on April 1, 2006 and operated Prosperity as a separate subsidiary until March 15, 2008, when Prosperity was also merged into Union Bank. On October 31, 2008, the Company merged its Bay Community Bank affiliate into Union Bank.
On February 1, 2010, the Company acquired First Market Bank, FSB, a privately held federally chartered savings bank (“First Market Bank” or “FMB”), in an all stock transaction. At December 31, 2009, FMB had over $1.3 billion in assets and operated 38 branches throughout central Virginia with 31 locations in the greater Richmond metropolitan area. In connection with the transaction, the Company changed its name to Union First Market Bankshares Corporation and moved its headquarters to Richmond, Virginia. In addition, First Market Bank became a state chartered commercial bank subsidiary of the Company. It is anticipated that First Market Bank will merge with Union Bank on March 22, 2010 and the combined bank will operate under the name Union First Market Bank. The Company’s operations center, in Caroline County, will continue to serve the operational needs of the Company.
Product Offerings and Market Distribution
The Company is the largest community banking organization based in Virginia, providing full-service banking to the Northern, Central, Rappahannock, Tidewater, and Northern Neck regions of Virginia through its bank subsidiaries, Union Bank (41 locations in the counties of Albemarle, Caroline, Chesterfield, Fairfax, Fluvanna, Hanover, Henrico, King George, King William, Nelson, Spotsylvania, Stafford, and Westmoreland and the cities of Fredericksburg, Williamsburg, Newport News, Grafton, and Charlottesville); First Market Bank (38 locations in the counties of Chesterfield, Hanover, Henrico, James City and Stafford and the cities of Chester, Colonial Heights, Richmond and Roanoke); Northern Neck State Bank (nine locations in the counties of Richmond, Westmoreland, Essex, Northumberland, and Lancaster); and Rappahannock National Bank (six locations in Washington, Front Royal, Middleburg, Warrenton, and Winchester).
Each of the Community Banks is a full service retail commercial bank offering consumers and businesses a wide range of banking and related financial services, including checking, savings, certificates of deposit and other depository services, as well as loans for commercial, industrial, residential mortgage and consumer purposes. The Community Banks issue credit cards and deliver automated teller machine (“ATM”) services through the use of reciprocally shared ATMs in the major ATM networks as well as remote ATMs for the convenience of customers and other consumers. Each of the Community Banks also offers internet banking services and online bill payment for all customers, whether consumer or commercial. The company’s largest affiliate, Union First Market Bank also offers trust services.
The Company provides other financial services through its non-bank affiliates, Union Investment Services, Inc., Union Mortgage Group, Inc. (“Union Mortgage”) and Union Insurance Group, LLC. Union Bank owns a non-controlling interest in Johnson Mortgage Company, LLC.
Union Investment Services, Inc. has provided securities, brokerage and investment advisory services since its formation in February 1993. It has six offices within the Community Banks’ trade areas and is a full service investment company handling all aspects of wealth management including stocks, bonds, annuities, mutual funds and financial planning.
2
Table of Contents
Union Mortgage has fifteen offices in the following locations: Virginia (eight), Maryland (four), North Carolina (two), and South Carolina (one). Union Mortgage is also licensed to do business in selected states throughout the Mid-Atlantic and Southeast, as well as Washington, D.C. It provides a variety of mortgage products to customers in those areas. The mortgage loans originated by Union Mortgage are generally sold in the secondary market through purchase agreements with institutional investors.
On August 31, 2003, the Company formed Union Insurance Group, LLC (“UIG”), an insurance agency, in which each of the subsidiary banks and Union Mortgage has an ownership interest. This agency operates in a joint venture with Bankers Insurance, LLC, a large insurance agency owned by community banks across Virginia and managed by the Virginia Bankers Association. UIG generates revenue through sales of various insurance products, including long term care insurance and business owner policies.
SEGMENTS
The Company has two reportable segments: its traditional full service community banking business and its mortgage loan origination business. For more financial data and other information about each of the Company’s operating segments, refer to the “Management’s Discussion and Analysis of Financial Condition and Results of Operations” section, “Community Bank Segment,” and to Note 18 “Segment Reporting” in the “Notes to Consolidated Financial Statements.”
EXPANSION AND STRATEGIC ACQUISITIONS
The Company expands its market area and increases its market share through internal growth, de novo expansion and strategic acquisitions. Strategic acquisitions by the Company to date have included whole bank acquisitions, branch and deposit acquisitions and purchases of existing branches from other banks. The Company generally considers acquisitions of companies in strong growth markets or with unique products or services that will benefit the entire organization. Targeted acquisitions are priced to be economically feasible with minimal short-term drag to achieve positive long-term benefits. These acquisitions may be paid for in the form of cash, stock, debt or a combination thereof. The amount and type of consideration and deal charges paid could have a short-term dilutive effect on the Company’s earnings per share or book value. However, cost savings and revenue enhancements in such transactions are anticipated to provide long-term economic benefit to the Company.
In September 2007, the Company completed the acquisition of the deposits and facilities of six bank branches (“Acquired Bank Branches”) in Virginia from Provident Bank. The branches acquired are located in the communities of Charlottesville, Middleburg, Warrenton (two) and Winchester (two). They became part of two of the Company’s banking subsidiaries, Union Bank (Charlottesville branch) and Rappahannock National Bank (five branches). The Acquired Bank Branches’ deposits were approximately $43.3 million. In December 2009, one of the two bank branches in the community of Winchester was closed (Picadilly branch) and combined with the other existing bank branch (Millwood branch) located nearby.
The Company’s de novo expansion during the last three years consists of opening three new branches in Virginia:
| • | Staples Mill, Union Bank branch located in Henrico County (February 2009) |
| • | Cosner’s Corner, Union Bank branch located in Spotsylvania County (October 2008) |
| • | Harrison Crossing, Union Bank branch located in Spotsylvania County (December 2007) |
3
Table of Contents
On February 1, 2010, the Company completed the acquisition of First Market Bank, FSB, a privately held federally chartered savings bank with over $1.3 billion in assets and operating 38 branches throughout central Virginia with 31 locations in the greater Richmond metropolitan area. As a result of the FMB acquisition, the Company is the largest Virginia based community banking organization with 94 branch locations and total assets of approximately $4.0 billion.
EMPLOYEES
As of December 31, 2009, the Company had approximately 662 full-time equivalent employees, including executive officers, loan and other banking officers, branch personnel, operations personnel and other support personnel. Of this total, 115 were mortgage segment personnel. None of the Company’s employees is represented by a union or covered under a collective bargaining agreement. Management of the Company considers its employee relations to be excellent. First Market Bank full-time equivalent employees totaled 321 as of December 31, 2009.
COMPETITION
The financial services industry remains highly competitive and is constantly evolving. The Company experiences strong competition in all aspects of its business. In its market areas, the Company competes with large national and regional financial institutions, credit unions, other independent community banks, as well as consumer finance companies, mortgage companies, loan production offices, mutual funds and life insurance companies. Competition has increasingly come from out-of-state banks through their acquisitions of Virginia-based banks. Competition for deposits and loans is affected by various factors including interest rates offered, the number and location of branches and types of products offered, and the reputation of the institution. Because they enjoy a favorable tax status, credit unions have been allowed to increasingly expand their membership definitions and to offer more attractive loan and deposit pricing. The Company’s non-bank affiliates also operate in highly competitive environments.
The Company is headquartered in Richmond, Virginia and is the largest independent community bank holding company based in Virginia. The Company believes its community bank framework and philosophy provide a competitive advantage, particularly with regard to larger national and regional institutions, allowing the Company to compete effectively. The Company’s Community Banks generally have strong market shares within the markets they serve. The Company’s proforma (with First Market Bank) deposit market share in Virginia was 2.13% and 2.02% as of December 31, 2009 and 2008. The Company’s deposit market share (excluding First Market Bank) in Virginia was 1.32% and 1.26% as of December 31, 2009 and 2008, respectively.
ECONOMY
Economic conditions over the last two years have significantly impacted the U. S. and much of the world. Stock markets in most nations have dropped sharply, foreclosures have increased dramatically, unemployment has risen significantly, the capital and liquidity of financial institutions have been severely challenged and credit markets have been greatly reduced. In the U. S. and other industrialized nations, governments have provided support for financial institutions in order to strengthen capital, increase liquidity and ease the credit markets. In the U. S., these actions have provided capital for banks and other financial institutions and have increased regulations and bank oversight, including the Company.
SUPERVISION AND REGULATION
Bank holding companies and banks are extensively and increasingly regulated under both federal and state laws. The following description briefly addresses certain historic and current provisions of federal and state laws and certain regulations, proposed regulations, and the potential impacts on the Company and its Community Banks. To the extent statutory or regulatory provisions or proposals are described herein, the description is qualified in its entirety by reference to the particular statutory or regulatory provisions or proposals.
4
Table of Contents
Bank Holding Companies
As a bank holding company registered under the Bank Holding Company Act of 1956 (the “BHCA”), the Company is subject to regulation by the Board of Governors of the Federal Reserve System (the “Federal Reserve”). The Federal Reserve has jurisdiction under the BHCA to approve any bank or non-bank acquisition, merger or consolidation proposed by a bank holding company. The BHCA generally limits the activities of a bank holding company and its subsidiaries to that of banking, managing or controlling banks, or any other activity that is so closely related to banking or to managing or controlling banks as to be a proper incident thereto.
Since September 1995, the BHCA has permitted bank holding companies from any state to acquire banks and bank holding companies located in any other state, subject to certain conditions, including nationwide and state imposed concentration limits. Banks are also able to branch across state lines provided certain conditions are met, including that applicable state law must expressly permit interstate branching. Virginia law permits branching across state lines if there is reciprocity with the state law where the out-of-state bank is based. The Company currently has no plans to branch outside the Commonwealth of Virginia.
There are a number of obligations and restrictions imposed on bank holding companies and their depository institution subsidiaries by federal law and regulatory policy. Collectively, these are designed to reduce potential loss exposure to the depositors of such depository institutions and to the Deposit Insurance Fund (the “DIF”) of the Federal Deposit Insurance Corporation (the “FDIC”) if the depository institution is either in danger of default or is in default. For example, under a Federal Reserve policy relating to bank holding company operations, a bank holding company is required to serve as a source of financial strength to its subsidiary depository institutions and to commit resources to support such institutions in circumstances where it might not do so absent such policy. In addition, the “cross-guarantee” provisions of federal law require insured depository institutions under common control to reimburse the FDIC for any loss suffered or reasonably anticipated by the DIF as a result of the default of a commonly controlled insured depository institution. The FDIC may decline to enforce the cross-guarantee provisions if it determines that a waiver is in the best interest of the DIF. The FDIC’s claim for damages is superior to claims of stockholders of the insured depository institution or its holding company, but is subordinate to claims of depositors, secured creditors and holders of subordinated debt (other than affiliates) of the commonly controlled insured depository institutions.
The Federal Deposit Insurance Act (the “FDIA”) also provides that amounts received from the liquidation or other resolution of any insured depository institution by any receiver must be distributed (after payment of secured claims) to pay the deposit liabilities of the institution prior to payment to any other general creditor or stockholder. This provision would give depositors a preference over general and subordinated creditors and stockholders in the event a receiver is appointed to distribute the assets of such depository institutions.
The Company is registered under the bank holding company laws of Virginia. The Company and the Community Banks, other than Rappahannock National Bank, which is regulated and supervised by the Office of the Comptroller of the Currency (the “OCC”), are subject to regulation and supervision by the State Corporation Commission of Virginia (the “SCC”) and the Federal Reserve.
Capital Requirements
The Federal Reserve, the OCC and the FDIC have issued substantially similar risk-based and leverage capital guidelines applicable to U. S. banking organizations. In addition, those regulatory agencies may from time to time require that a banking organization maintain capital above the minimum levels because of its financial condition or actual or anticipated growth. Under the risk-based capital requirements of these federal bank regulatory agencies, the Company and each of the Community Banks are required to
5
Table of Contents
maintain a minimum ratio of total capital to risk-weighted assets of at least 8.0%. At least half of the total capital is required to be “Tier 1 capital,” which consists principally of common and certain qualifying preferred shareholders’ equity (including Trust Preferred Securities), less certain intangibles and other adjustments. The remainder (“Tier 2 capital”) consists of a limited amount of subordinated and other qualifying debt (including certain hybrid capital instruments) and a limited amount of the general loan loss allowance. The Tier 1 and total capital to risk-weighted asset ratios of the Company were 13.45% and 14.70%, respectively, as of December 31, 2009, thus exceeding the minimum requirements.
Each of the federal regulatory agencies has established a minimum leverage capital ratio (Tier 1 capital to average adjusted assets) (“Tier 1 leverage ratio”). These guidelines provide for a minimum Tier 1 leverage ratio of 4% for banks and bank holding companies that meet certain specified criteria, including having the highest regulatory examination rating and are not contemplating significant growth or expansion. The Tier 1 leverage ratio of the Company as of December 31, 2009 was 10.86%, which is above the minimum requirements. The guidelines also provide that banking organizations experiencing internal growth or making acquisitions will be expected to maintain strong capital positions substantially above the minimum supervisory levels without significant reliance on intangible assets.
Limits on Dividends and Other Payments
The Company is a legal entity, separate and distinct from its subsidiaries. A significant portion of the revenues of the Company result from dividends paid to it by the Community Banks. There are various legal limitations applicable to the payment of dividends by the Community Banks to the Company and to the payment of dividends by the Company to its respective shareholders. The Community Banks are subject to various statutory restrictions on their ability to pay dividends to the Company. Under the current supervisory practices of the Community Banks’ regulatory agencies, prior approval from those agencies is required if cash dividends declared in any given year exceed net income for that year, plus retained net profits of the two preceding years. The payment of dividends by the Community Banks or the Company may be limited by other factors, such as requirements to maintain capital above regulatory guidelines. Bank regulatory agencies have the authority to prohibit the Community Banks or the Company from engaging in an unsafe or unsound practice in conducting their business. The payment of dividends, depending on the financial condition of the Community Banks, or the Company, could be deemed to constitute such an unsafe or unsound practice.
Under the FDIA, insured depository institutions such as the Community Banks are prohibited from making capital distributions, including the payment of dividends, if, after making such distribution, the institution would become “undercapitalized” (as such term is used in the statute). Based on the Community Banks’ current financial condition, the Company does not expect this provision will have any impact on its ability to receive dividends from the Community Banks. Non-bank subsidiaries pay the parent company dividends periodically on a non-regulated basis.
In addition to dividends it receives from the Community Banks, the Company receives management fees from its affiliated companies for various services provided to them including: data processing, item processing, loan operations, deposit operations, financial accounting, human resources, funds management, credit administration, credit support, sales and marketing, collections, facilities management, call center, legal, compliance and internal audit. These fees are charged to each subsidiary based upon various specific allocation methods measuring the estimated usage of such services by that subsidiary. The fees are eliminated from the financial statements in the consolidation process.
Under federal law, the Community Banks may not, subject to certain limited exceptions, make loans or extensions of credit to, or investments in the securities of, the Company or take securities of the Company as collateral for loans to any borrower. The Community Banks are also subject to collateral security requirements for any loans or extensions of credit permitted by such exceptions.
6
Table of Contents
The Community Banks
The Community Banks are supervised and regularly examined by the Federal Reserve and the SCC, except for Rappahannock National Bank, which is examined by the OCC. The various laws and regulations administered by the regulatory agencies affect corporate practices, such as the payment of dividends, incurrence of debt and acquisition of financial institutions and other companies; they also affect business practices, such as the payment of interest on deposits, the charging of interest on loans, types of business conducted and location of offices.
The Community Banks are subject to the requirements of the Community Reinvestment Act (the “CRA”). The CRA imposes on financial institutions an affirmative and ongoing obligation to meet the credit needs of the local communities, including low and moderate income neighborhoods, consistent with the safe and sound operation of those institutions. Each financial institution’s efforts in meeting community credit needs are evaluated regularly as part of the examination process pursuant to up to ten assessment factors. These factors also are considered in evaluating mergers, acquisitions and applications to open a branch or facility. Many of the banks’ competitors, such as credit unions, are not subject to the requirements of CRA.
Substantially all of the deposits of the Community Banks are insured up to applicable limits by the DIF of the FDIC and are subject to deposit insurance assessments to maintain the DIF. The FDIC utilizes a risk-based assessment system that imposes insurance premiums based upon a risk matrix that takes into account a bank’s capital level and supervisory rating (“CAMELS rating”). The risk matrix utilizes four risk categories which are distinguished by capital levels and supervisory ratings.
On December 16, 2008, the FDIC issued a final rule that raised the then current assessment rates uniformly by 7 basis points for the first quarter of 2009 assessment, which resulted in annualized assessment rates for institutions in the lowest risk category (“Risk Category 1 institutions”) ranging from 12 to 14 basis points (basis points representing cents per $100 of assessable deposits).
On February 27, 2009, the FDIC issued final rules to amend the DIF restoration plan, change the risk-based assessment system and set assessment rates for Risk Category 1 institutions, effective on April 1, 2009. The new rule is intended to tie more closely each bank’s deposit insurance assessments to the risk it poses to the DIF. The rule sets initial base assessment rates at 12 to 45 basis points of deposits. Under the new risk-based assessment system the FDIC evaluates each bank’s risk based on three primary factors: (1) its supervisory rating, (2) its financial ratios, and (3) its long-term debt issuer rating, if the bank has one. In 2009 and 2008, the Company paid only the base assessment rate for “well capitalized” institutions, which totaled $3.4 million and $1.2 million, respectively, in regular deposit insurance assessments.
On May 22, 2009, the FDIC issued a final rule that levied a special assessment applicable to all insured depository institutions totaling 5 basis points of each institution’s total assets less Tier 1 capital as of June 30, 2009, not to exceed 10 basis points of domestic deposits. The special assessment was part of the FDIC’s efforts to rebuild the DIF. Deposit insurance expense during 2009 for the Company included an additional $1.2 million recognized in the second quarter related to the special assessment.
On November 12, 2009, the FDIC issued a rule that required all insured depository institutions, with limited exceptions, to prepay their estimated quarterly risk-based assessments for the fourth quarter of 2009 and for all of 2010, 2011 and 2012. The FDIC also adopted a uniform three-basis point increase in assessment rates effective on January 1, 2011. In December 2009, the Company paid $12.6 million in prepaid risk-based assessments, which will be expensed in the appropriate periods through December 31, 2012.
7
Table of Contents
Legislation
On October 3, 2008, the FDIC’s deposit insurance temporarily increased from $100 thousand to $250 thousand per depositor. Checking, savings, certificates of deposit, money market accounts, and other interest-bearing deposit accounts, when combined, are now FDIC insured up to $250 thousand per depositor. Joint accounts may be insured up to $250 thousand per owner in addition to the $250 thousand of insurance available on those same owner’s individual accounts. On May 19, 2009, Congress extended the temporary $250 thousand coverage through December 31, 2013. On January 1, 2014, the standard coverage limit is scheduled to return to $100 thousand for all deposit categories except IRAs and certain retirement accounts mentioned above, which will continue to be insured up to $250 thousand per owner because that is permanent coverage set by Congress in 2006.
On October 14, 2008, the FDIC announced the Temporary Liquidity Guarantee Program (“TLGP”) to strengthen confidence and increase liquidity in the banking system. The program guarantees newly issued senior unsecured debt of eligible institutions and provides full deposit insurance coverage for non-interest bearing transaction accounts in FDIC-insured institutions, regardless of the dollar amount, for participating entities. The TLGP has two primary components: the Debt Guarantee Program (FDIC will guarantee the payment of certain newly issued senior unsecured debt) and the Transaction Account Guarantee (“TAG”) (the FDIC will guarantee certain noninterest-bearing transaction accounts).
The Community Banks are participating in the FDIC’s TAG and the Debt Guarantee Program. Under the TAG, all noninterest-bearing transaction accounts are fully guaranteed by the FDIC for the entire amount in the account. Coverage is in addition to and separate from the coverage available under the FDIC’s general deposit insurance rules. The Company was initially assessed a 10 basis points fee (annualized) on the balance of each covered account in excess of $250 thousand.
On October 1, 2009, the TAG was extended an additional six months through June 30, 2010 for those institutions that choose not to opt out. The Community Banks elected to participate and are assessed at the revised rate of 15 basis points (annualized) on the balance of each covered account in excess of $250 thousand. The additional expense is not material.
New regulations and statutes are regularly proposed that contain wide-ranging proposals that may or will alter the structures, regulations, and competitive relationships of the nation’s financial institutions. The Company cannot predict whether or in what form any proposed regulation or statute will be adopted or the extent to which the Company’s business may be affected by any new regulation or statute.
Other Safety and Soundness Regulations
The federal banking agencies have broad powers under current federal law to make prompt corrective action to resolve problems of insured depository institutions. The extent of these powers depends upon whether the institutions in question are “well capitalized,” “adequately capitalized,” “undercapitalized,” “significantly undercapitalized,” or “critically undercapitalized.” All such terms are defined under uniform regulations issued by each of the federal banking agencies. Each of the Community Banks meets the definition of being “well capitalized” as of December 31, 2009.
The Gramm-Leach-Bliley Act
Effective March 11, 2001, the Gramm-Leach Bliley Act (the “GLB Act”) allows a bank holding company or other company to certify its status as a financial holding company, thereby allowing such company to engage in activities that are financial in nature, that are incidental to such activities, or are complementary to such activities. The GLB Act enumerates certain activities deemed financial in nature, such as underwriting insurance or acting as an insurance principal, agent or broker; underwriting; dealing in or making markets in securities; and engaging in merchant banking under certain restrictions. It also authorizes the Federal Reserve to determine by regulation what other activities are financial in nature, or incidental or complementary thereto.
8
Table of Contents
USA Patriot Act of 2001
In October 2001, the USA Patriot Act of 2001 (“Patriot Act”) was enacted in response to the September 11, 2001 terrorist attacks in New York, Pennsylvania and Northern Virginia. The Patriot Act is intended to strengthen U. S. law enforcement and the intelligence communities’ abilities to work cohesively to combat terrorism. The continuing impact on financial institutions of the Patriot Act and related regulations and policies is significant and wide ranging. The Patriot Act contains sweeping anti-money laundering and financial transparency laws, and imposes various regulations, including standards for verifying customer identification at account opening, and rules to promote cooperation among financial institutions, regulators and law enforcement entities to identify persons who may be involved in terrorism or money laundering.
Check 21
In October 2003, the Check Clearing for the 21st Century Act, also known as Check 21, became law. Check 21 gives “substitute checks,” such as a digital image of a check and copies made from that image, the same legal standing as the original paper check. Some major provisions of Check 21 include:
| • | allowing check truncation without making it mandatory; |
| • | demanding that every financial institution communicate to accountholders in writing a description of its substitute check processing program and their rights under the law; |
| • | legalizing substitutions for and replacements of paper checks without agreement from consumers; |
| • | retaining in place the previously mandated electronic collection and return of checks between financial institutions only when individual agreements are in place; |
| • | requiring that when accountholders request verification, financial institutions produce the original check (or a copy that accurately represents the original) and demonstrate that the account debit was accurate and valid; and |
| • | requiring recrediting of funds to an individual’s account on the next business day after a consumer proves the financial institution has erred. |
Effect of Governmental Monetary Policies
The Company’s operations are affected not only by general economic conditions, but also by the policies of various regulatory authorities. In particular, the Federal Reserve regulates money and credit conditions and interest rates to influence general economic conditions. These policies have a significant impact on overall growth and distribution of loans, investments and deposits; they affect interest rates charged on loans or paid for time and savings deposits. Federal Reserve monetary policies have had a significant effect on the operating results of commercial banks, including the Company, in the past and are expected to do so in the future. In October 2008, Congress enacted the Emergency Economic Stabilization Act of 2008 (“EESA”), which provided the U. S. Department of the Treasury (the “Treasury”) with broad authority to implement action intended to help restore stability and liquidity to the U. S. financial markets. There can be no assurances that any programs initiated in the future will be effective in restoring stability and providing sufficient liquidity to the U. S financial markets. As a result, the Company is unable to predict the effects of possible changes in monetary policies upon its future operating results.
Filings with the SEC
The Company files annual, quarterly and other reports under the Securities Exchange Act of 1934 with the Securities and Exchange Commission (“SEC”). These reports are posted and are available at no cost on the Company’s website, www.ubsh.com, through the Investor Relations link, as soon as reasonably practicable after the Company files such documents with the SEC. This Form 10-K is directly available at http://www.ubsh.com/site/2009AnnualReport_10-K.pdf. The Company’s filings are also available through the SEC’s website at www.sec.gov.
9
Table of Contents
Recent negative developments in the financial services industry and U.S. credit markets may adversely impact the Company’s operations and results.
Negative developments in the credit and capital markets over the last two years have created significant volatility in the financial markets and have resulted in higher unemployment and deterioration of the U. S. economy. Commercial as well as consumer loan portfolio performances have deteriorated at many institutions and the competition for deposits and quality loans has increased significantly. In addition, the values of real estate collateral supporting many commercial loans and home mortgages have declined and may continue to decline. Stock prices of financial institutions and their holding companies have declined, increasing the cost of raising capital and borrowing in the debt markets compared to recent years. As a result, there is a significant potential for new federal or state laws and regulations regarding lending and funding practices and liquidity and capital standards, and bank regulatory agencies are being aggressive in responding to concerns and trends identified in examinations, including the issuance of many formal enforcement orders. Negative developments in the financial industry and the impact of new legislation in response to those developments could negatively impact the Company’s operations by restricting its business operations, including its ability to originate or sell loans, and adversely impact its financial performance.
The Obama administration has proposed, and Congress is considering, a series of proposals to reform the federal regulatory structure for insured depository institutions and other financial organizations. Under these proposals, Congress and the regulators could adopt sweeping changes to financial sector regulation and oversight, dramatically increasing the federal government’s role in nearly every aspect of the financial markets. The proposals also could lead to an imposition of higher capital requirements on all banks, which could adversely affect the Company’s earnings. Another proposal would reduce federal preemption and authorize state attorneys general and state regulators to impose local laws on banks. Such a development could require the Company to deal with a large number of regulators and would increase compliance and administrative costs.
The Company’s allowance for loan losses may prove to be insufficient to absorb losses in its loan portfolio.
Like all financial institutions, the Company maintains an allowance for loan losses to provide for loans that its borrowers may not repay in their entirety. The Company believes that it maintains an allowance for loan losses at a level adequate to absorb probable losses inherent in the loan portfolio as of the corresponding balance sheet date and in compliance with applicable accounting and regulatory guidance. However, the allowance for loan losses may not be sufficient to cover actual loan losses, and future provisions for loan losses could materially and adversely affect the Company’s operating results. The Company has seen an increase in the level of potential problem loans in its loan portfolio with higher than normal risk. The Company expects to receive more frequent requests from borrowers to modify loans. The related accounting measurements related to impairment and the loan loss allowance require significant estimates that are subject to uncertainty and changes relating to new information and changing circumstances. The significant uncertainties surrounding the Company’s borrowers’ abilities to execute their business models successfully through changing economic environments, competitive challenges and other factors complicate the Company’s estimates of the risk of loss and amount of loss on any loan. Because of the degree of uncertainty and susceptibility of these factors to change, the actual losses may vary from current estimates. The Company expects fluctuations in the loan loss provisions due to the uncertain economic conditions.
10
Table of Contents
The Company’s regulators, as an integral part of their examination process, periodically review the allowance for loan losses and may require the Company to increase its allowance for loan losses by recognizing additional provisions for loan losses charged to expense, or to decrease the allowance for loan losses by recognizing loan charge-offs, net of recoveries. Any such required additional provisions for loan losses or charge-offs could have a material adverse effect on the Company’s financial condition and results of operations.
Nonperforming assets take significant time to resolve and adversely affect the Company’s results of operations and financial condition.
The Company’s nonperforming assets adversely affect its net income in various ways. Until economic and market conditions improve, the Company expects to continue to incur additional losses relating to an increase in nonperforming loans. The Company does not record interest income on non-accrual loans, thereby adversely affecting its income and increasing loan administration costs. When the Company receives collateral through foreclosures and similar proceedings, it is required to mark the related loan to the then fair market value of the collateral less estimated selling costs, which may result in a loss. An increase in the level of nonperforming assets also increases the Company’s risk profile and may impact the capital levels regulators believe are appropriate in light of such risks. The Company utilizes various techniques such as workouts, restructurings and loan sales to manage problem assets. Decreases in the value of these problem assets, the underlying collateral, or in the borrowers’ performance or financial condition, could adversely affect the Company’s business, results of operations and financial condition. In addition, the resolution of nonperforming assets requires significant commitments of time from management and staff, which can be detrimental to the performance of their other responsibilities. There can be no assurance that the Company will avoid further increases in nonperforming loans in the future.
Changes in interest rates could adversely affect the Company’s income and cash flows.
The Company’s income and cash flows depend to a great extent on the difference between the interest rates earned on interest-earning assets, such as loans and investment securities, and the interest rates paid on interest-bearing liabilities, such as deposits and borrowings. These rates are highly sensitive to many factors beyond the Company’s control, including general economic conditions and the policies of the Federal Reserve and other governmental and regulatory agencies. Changes in monetary policy, including changes in interest rates, will influence the origination of loans, the prepayment of loans, the purchase of investments, the generation of deposits, and the rates received on loans and investment securities and paid on deposits or other sources of funding. The impact of these changes may be magnified if the Company does not effectively manage the relative sensitivity of its assets and liabilities to changes in market interest rates. In addition, the Company’s ability to reflect such interest rate changes in pricing its products is influenced by competitive pressures. Fluctuations in these areas may adversely affect the Company and its shareholders. Community banks are often at a competitive disadvantage in managing their costs of funds compared to the large regional, super-regional or national banks that have access to the national and international capital markets.
The Company generally seeks to maintain a neutral position in terms of the volume of assets and liabilities that mature or re-price during any period so that it may reasonably maintain its net interest margin; however, interest rate fluctuations, loan prepayments, loan production, deposit flows and competitive pressures are constantly changing and influence the ability to maintain a neutral position. Generally, the Company’s earnings will be more sensitive to fluctuations in interest rates depending upon the variance in volume of assets and liabilities that mature and re-price in any period. The extent and duration of the sensitivity will depend on the cumulative variance over time, the velocity and direction of interest rates, shape and slope of the yield curve, and whether the Company is more asset sensitive or liability sensitive. Accordingly, the Company may not be successful in maintaining a neutral position and, as a result, the Company’s net interest margin may be impacted.
11
Table of Contents
The Company faces substantial competition that could adversely affect the Company’s growth and/or operating results.
The Company operates in a competitive market for financial services and faces intense competition from other financial institutions both in making loans and attracting deposits. Many of these financial institutions have been in business for many years, are significantly larger, have established customer bases, and have greater financial resources and higher lending limits.
The inability of the Company to successfully manage its growth or implement its growth strategy may adversely affect the results of operations and financial conditions.
The Company may not be able to successfully implement its growth strategy if it is unable to identify attractive markets, locations or opportunities to expand in the future. The ability to manage growth successfully depends on whether the Company can maintain adequate capital levels, maintain cost controls, asset quality and successfully integrate any businesses acquired into the organization.
As the Company continues to implement its growth strategy by opening new branches or acquiring branches or banks, it expects to incur increased personnel, occupancy and other operating expenses. In the case of new branches, the Company must absorb those higher expenses while it begins to generate new deposits; there is also further time lag involved in redeploying new deposits into attractively priced loans and other higher yielding earning assets. Thus, the Company’s plans to branch could depress earnings in the short run, even if it efficiently executes a branching strategy leading to long-term financial benefits.
Difficulties in combining the operations of acquired entities with the Company’s own operations may prevent the Company from achieving the expected benefits from acquisitions.
The Company may not be able to achieve fully the strategic objectives and operating efficiencies in an acquisition. Inherent uncertainties exist in integrating the operations of an acquired entity. In addition, the markets and industries in which the Company and its potential acquisition targets operate are highly competitive. The Company may lose customers or the customers of acquired entities as a result of an acquisition; the Company also may lose key personnel, either from the acquired entity or from itself. These factors could contribute to the Company’s not achieving the expected benefits from its acquisitions within desired time frames, if at all. Future business acquisitions could be material to the Company and it may issue additional shares of common stock to pay for those acquisitions, which would dilute current shareholders’ ownership interests. Acquisitions also could require the Company to use substantial cash or other liquid assets or to incur debt; the Company could therefore become more susceptible to economic downturns and competitive pressures.
The Company’s exposure to operational, technological and organizational risk may adversely affect the Company.
Similar to other financial institutions, the Company is exposed to many types of operational and technological risk, including reputation, legal and compliance risk. The Company’s ability to grow and compete is dependent on its ability to build or acquire the necessary operational and technological infrastructure and to manage the cost of that infrastructure while it expands and integrates acquired businesses. Similar to other financial institutions, operational risk can manifest itself in many ways, such as errors related to failed or inadequate processes, faulty or disabled computer systems, fraud by employees or persons outside of the Company and exposure to external events. The Company is dependent on its operational infrastructure to help manage these risks. From time to time, it may need to change or upgrade its technology infrastructure. The Company may experience disruption, and it may face additional exposure to these risks during the course of making such changes. As the Company acquires other financial institutions, it faces additional challenges when integrating different operational platforms. Such integration efforts may be more disruptive to the business and/or more costly than anticipated.
12
Table of Contents
The Company’s dependency on its management team and the unexpected loss of any of those personnel could adversely affect operations.
The Company is a customer-focused and relationship-driven organization. Future growth is expected to be driven in large part by the relationships maintained with customers. While the Company has assembled an experienced management team, is building the depth of that team, and has management development plans in place, the unexpected loss of key employees could have a material adverse effect on the Company’s business and may result in lower revenues or greater expenses.
The Company’s concentration in loans secured by real estate may adversely impact earnings due to changes in the real estate markets.
The Company offers a variety of secured loans, including commercial lines of credit, commercial term loans, real estate, construction, home equity, consumer and other loans. Many of the Company’s loans are secured by real estate (both residential and commercial) in the Company’s market areas. A major change in the real estate markets, resulting in deterioration in the value of this collateral, or in the local or national economy, could adversely affect customers’ ability to pay these loans, which in turn could impact the Company. Risks of loan defaults and foreclosures are unavoidable in the banking industry; the Company tries to limit its exposure to these risks by monitoring carefully extensions of credit. The Company cannot fully eliminate credit risk; thus, credit losses may occur in the future.
Legislative or regulatory changes or actions, or significant litigation, could adversely impact the Company or the businesses in which the Company is engaged.
The Company is subject to extensive state and federal regulation, supervision and legislation that govern almost all aspects of its operations. Laws and regulations may change from time to time and are primarily intended for the protection of consumers, depositors and the FDIC Deposit Insurance Funds. The impact of any changes to laws and regulations or other actions by regulatory agencies may negatively impact the Company or its ability to increase the value of its business. Actions by regulatory agencies or significant litigation against the Company could cause it to devote significant time and resources to defend itself and may lead to liability or penalties that materially affect the Company and its shareholders. Future changes in the laws or regulations or their interpretations or enforcement could be materially adverse to the Company and its shareholders.
Changes in accounting standards could impact reported earnings.
The bodies that promulgate accounting standards, including the Financial Accounting Standards Board, SEC, and other regulatory bodies, periodically change the financial accounting and reporting standards that govern the preparation of the Company’s consolidated financial statements. These changes are difficult to predict and can materially impact how the Company records and reports its financial condition and results of operations. In some cases, the Company could be required to apply a new or revised standard retroactively, resulting in the restatement of financial statements for prior periods.
Limited availability of financing or inability to raise capital could adversely impact the Company.
The amount, type, source, and cost of the Company’s funding directly impacts the ability to grow assets. The ability to raise capital in the future could become more difficult, more expensive, or altogether unavailable. A number of factors could make such financing more difficult, more expensive or unavailable including: the financial condition of the Company at any given time; rate disruptions in the capital markets; the reputation for soundness and security of the financial services industry as a whole; competition for funding from other banks or similar financial service companies, some of which could be substantially larger, or be more favorably rated.
13
Table of Contents
The FDIC has increased deposit insurance premiums to restore and maintain the federal deposit insurance fund, which has increased the Company’s costs and could adversely affect its business.
FDIC insurance premiums increased substantially in 2009, and the Company expects to pay significantly higher FDIC premiums in the future as compared to premiums paid in 2008 and prior years. As recent bank failures continued to deplete the DIF, the FDIC adopted a revised risk-based deposit insurance assessment schedule in February 2009, which raised deposit insurance premiums. The FDIC also levied a special assessment in May 2009 and issued a rule in November 2009 requiring institutions to prepay their estimated quarterly risk-based assessments for the fourth quarter of 2009 and for all of 2010, 2011 and 2012. The FDIC also adopted a uniform three-basis point increase in assessment rates effective on January 1, 2011. The DIF may suffer additional losses in the future due to bank failures. There can be no assurance that there will not be additional significant deposit insurance premium increases in order to restore the insurance fund’s reserve ratio.
The Company cannot predict the effect of recently enacted and possible future federal legislation on the U. S. economy and the banking industry; there can be no assurance that these measures will improve market conditions.
Pursuant to EESA, the Treasury has the ability to purchase or insure up to $700 billion in troubled assets held by financial institutions under the Troubled Asset Relief Program (“TARP”). In October 2008, the Treasury announced that it would initially purchase equity stakes in financial institutions under the Capital Purchase Program of up to $350 billion of the $700 billion authorized under TARP. EESA also increased the amount of deposit account insurance from $100,000 to $250,000 effective until December 31, 2009. This increase was subsequently extended through December 31, 2013 by the Helping Families Save Their Home Act on May 20, 2009.
In early 2009, the Treasury announced the Financial Stability Plan which, among other things, provides a new capital program called the Capital Assistance Program, establishing a public-private investment fund for the purchase of troubled assets, and expands the Term Asset-Backed Securities Loan Facility. The Treasury also recently announced plans to create a federal Consumer Financial Protection Agency. This proposed legislation is in the early stages and it is not possible to predict whether such legislation will be enacted. Due to the recent recessionary condition of the national economy, it is possible that additional legislation affecting the banking industry may be enacted in the near future. The full effects of legislation recently enacted and broad legislation that may be enacted in the near future on the national economy and financial institutions cannot now be predicted. There can be no assurance that these measures will improve market conditions.
The Company’s ability to pay dividends depends upon the results of operations of its subsidiaries.
The Company is a bank holding company that conducts substantially all of its operations through its Community Banks and other subsidiaries. As a result, the Company’s ability to make dividend payments on its common stock depends primarily on certain federal regulatory considerations and the receipt of dividends and other distributions from its subsidiaries. There are various regulatory restrictions on the ability of the Company’s banking subsidiaries to pay dividends or make other payments to the Company.
The Company’s governing documents and Virginia law contain anti-takeover provisions that could negatively impact its shareholders.
The Company’s Articles of Incorporation and Bylaws and the Virginia Stock Corporation Act contain certain provisions designed to enhance the ability of the board of directors to deal with attempts to acquire control of the Company. These provisions and the ability to set the voting rights, preferences and other terms of any series of preferred stock that may be issued, may be deemed to have an anti-takeover effect and may discourage takeovers (which certain shareholders may deem to be in their best interest). To the extent that such takeover attempts are discouraged, temporary fluctuations in the market price of the Company’s common stock resulting from actual or rumored takeover attempts may be inhibited. These provisions also could discourage or make more difficult a merger, tender offer or proxy contest, even though such transactions may be favorable to the interests of shareholders, and could potentially adversely affect the market price of the Company’s common stock.
14
Table of Contents
In connection with the Company’s acquisition of First Market Bank, FSB and the assumption of its Fixed Rate Non-Cumulative Perpetual Preferred Stock, Series B and Series C, the Company issued 35,595 shares of Series B preferred stock (the “Preferred Stock”) to the Treasury. This is treated as equity and is subordinate to all of its existing and future indebtedness; regulatory and contractual restrictions may limit or prevent the Company from paying dividends on the Preferred Stock; and the Preferred Stock places no limitations on the amount of indebtedness the Company may incur in the future.
The shares of Preferred Stock are equity interests in the Company and do not constitute indebtedness. As such, the Preferred Stock, like the Company’s common stock, ranks junior to all indebtedness and other non-equity claims on the Company with respect to assets available to satisfy claims on the Company, including in a liquidation of the Company. Additionally, unlike indebtedness, where principal and interest would customarily be payable on specified due dates, in the case of the Preferred Stock, (a) dividends are payable only when, as and if authorized and declared by the Company’s board of directors and depend on, among other things, the results of operations, financial condition, debt service requirements, other cash needs and any other factors the Company’s board deems relevant, (b) as a Virginia corporation, the Company may not pay dividends if, after giving effect thereto, the Company would not be able to pay debts as they come due in the usual course of business, or total assets would be less than total liabilities and the amount needed to satisfy the liquidity preferences of any preferred stock, and (c) the Company may not pay dividends on capital stock if it is in default on certain indebtedness or elected to defer payments of interest on subordinated indebtedness. The Company is unable to pay any dividends on its common stock unless it is current in the dividend payments on the Preferred Stock.
The Company derives substantially all of its revenue in the form of dividends from its subsidiaries. The Company is and will be dependent upon dividends from its subsidiaries to pay the principal and interest on its indebtedness, to satisfy its other cash needs, and to pay dividends on the Preferred Stock and its common stock. The ability of each subsidiary to pay dividends is subject to its ability to earn net income and to meet certain regulatory requirements. In the event the subsidiaries are unable to pay dividends, the Company may not be able to pay dividends on the Preferred Stock. The Company’s right to participate in a distribution of assets upon a subsidiary’s liquidation or reorganization is subject to the prior claims of such subsidiary’s creditors.
The Preferred Stock does not limit the amount of debt or other obligations the Company may incur in the future. The Company may incur substantial amounts of additional debt and other obligations that will rank senior to the Preferred Stock or to which the Preferred Stock will be structurally subordinated.
If the Company is unable to redeem the Preferred Stock after five years, the cost of this capital will increase substantially.
If the Company is unable to redeem the Preferred Stock prior to February 15, 2014, the cost of this capital to the Company will increase substantially on that date, from 5.0% per annum to 9.0% per annum. Depending on the Company’s financial condition at the time, this increase in the annual dividend rate on the Preferred Stock could have a material negative effect on the Company’s liquidity.
The agreement between the Company and Treasury limits the Company’s ability to pay dividends on and repurchase its common stock.
The agreement between the Company and Treasury provides that until the earlier of February 6, 2012 or the date on which all shares of the Preferred Stock have been redeemed by the Company or transferred by Treasury to third parties, the Company may not, without the consent of Treasury, (a) increase the cash dividend on its common stock or (b) subject to limited exceptions, redeem, repurchase or otherwise acquire shares of its common stock or preferred stock (other than the Preferred Stock) or trust preferred securities. In addition, the Company is unable to pay any dividends on its common stock unless it is current in the dividend payments on the Preferred Stock. These restrictions could have a negative effect on the value of the Company’s common stock. Moreover, holders of the Company’s common stock are entitled to receive dividends only when, as and if declared by its board of directors.
15
Table of Contents
If the Company and First Market Bank do not successfully integrate, the Company may not realize the expected benefits from the acquisition.
Integration in connection with an acquisition is sometimes difficult, and there is a risk that integrating the two entities may take more time and resources than the Company expects. The Company’s ability to successfully integrate First Market Bank depends in large part on the ability of members of the Company’s board, including its three new members, to work together effectively. The Company is governed by a board of directors comprised of twelve directors, of which three are former directors of First Market Bank, James E. Ukrop, Steven A. Markel, and David J. Fairchild. Mr. Fairchild is also serving as president of the Company. Disagreements among board members of the Company could arise in connection with integration issues, strategic considerations and other matters. As a result, there is a risk that the Company’s board of directors may not be able to operate effectively, which would affect adversely its ability to integrate successfully the operations of the Company and First Market Bank.
Combining the Company and First Market Bank may be more difficult, costly or time-consuming than the Company expects.
Until the completion of the acquisition of First Market Bank on February 1, 2010, the Company and First Market Bank operated independently. The integration process post-acquisition may result in the loss of key employees, the disruption of the Company’s ongoing business and inconsistencies in standards, controls, procedures and policies that affect adversely the Company’s ability to maintain relationships with customers and employees or achieve the anticipated benefits of the acquisition. As with any merger of financial institutions, there also may be disruptions that cause the Company to lose customers or cause customers to withdraw their deposits from the Company’s banking subsidiaries, or other unintended consequences that could have a material adverse affect on the business and earnings of the Company.
The future operating performance of the Company will depend, in part, on the success of the merger of its two largest subsidiary banks, First Market Bank and Union Bank.
The Company expects to merge Union Bank and First Market Bank to form Union First Market Bank in the first quarter of 2010. The success of this merger will depend on a number of factors, including: the Union First Market Bank’s ability to (i) integrate the operations and branches of First Market Bank and Union Bank; (ii) retain the deposits and customers of First Market Bank and Union Bank; (iii) control the incremental increase in noninterest expense arising from the merger in a manner that enables the bank to improve its overall operating efficiencies; and (iv) retain and integrate the appropriate personnel of First Market Bank and Union Bank into the operations of Union First Market Bank, and reduce overlapping bank personnel. The integration of First Market Bank and Union Bank will require the dedication of the time and resources of the banks’ management, and may temporarily distract management’s attention from the day-to-day business of the banks. If the integration is unsuccessful, Union First Market Bank may not be able to realize expected operating efficiencies and eliminate redundant costs.
A significant majority of First Market Bank branches are located in Ukrop’s Super Markets’ grocery stores and the recent sale of Ukrop’s Super Markets could aversely affect the business of those branches.
On February 8, 2010, Royal Ahold N.V., a Netherlands company and international group of leading supermarket companies based in the United States and Europe, announced that Giant-Carlisle, a division of Ahold USA, had acquired Ukrop’s Super Markets. Twenty-four of First Market Bank’s thirty-eight branches are located in Ukrop’s Super Markets’ grocery stores. The sale will result in the rebranding of Ukrop’s Super Markets and changes in various operational aspects of the business. These changes may or may not be widely accepted by Ukrop’s Super Markets’ grocery stores’ current customers. If business declines in the grocery stores, First Market Bank customers may no longer find the grocery store branch locations to be convenient, which could have a materially adverse effect on the earnings of the First Market Bank branches.
16
Table of Contents
The Company has been sued in a class action lawsuit under the Maryland Secondary Mortgage Loan Law, and it is possible that it will suffer losses as a result of this lawsuit.
On September 2, 2009, Union Mortgage Group, Inc., a wholly owned subsidiary of the Company, received notice that it has been sued in Maryland state court in a class action lawsuit under the Maryland Secondary Mortgage Loan Law (the “SMLL”). In general, the lawsuit alleges that Union Mortgage, in connection with making second mortgage loans to customers, violated the SMLL by charging certain fees, closing costs and interest in excess of the limitations established by the SMLL, and by making unauthorized payments to brokers, and while doing so did not provide the mandatory disclosure forms required by the Maryland Commissioner of Financial Regulations.
Under the SMLL, statutory remedies for violations include the refunding of closing fees and costs and all interest payments made on the second mortgage loans to date, as well as permitting the lender to collect only the principal amount of the loans going forward. The law allows additional civil penalties to be assessed for knowing violations of the SMLL.
While Union Mortgage will contest the lawsuit vigorously and assert a number of defenses, because of the recent nature of this lawsuit the Company cannot adequately assess its merits at this time or predict the number of potential class actions members. The Company also cannot predict when the lawsuit will be resolved, and it is likely that the lawsuit will remain pending for the foreseeable future. Any possible loss is not probable, reasonably assured nor estimable and accordingly, no liability has been accrued. It is possible that the plaintiffs ultimately may prevail in the litigation. Any such adverse judgment could materially and adversely affect the financial condition of the Company.
ITEM 1B. – UNRESOLVED STAFF COMMENTS.
The Company does not have any unresolved staff comments to report for the year ended December 31, 2009.
The Company, through its subsidiaries, owns or leases buildings that are used in the normal course of business. Effective with the February 1, 2010 acquisition of First Market Bank, the corporate headquarters was relocated from 211 North Main Street, Bowling Green, Virginia, to 111 Virginia Street, Suite 200, Richmond, Virginia. The Company’s subsidiaries own or lease various other offices in the counties and cities in which they operate. At December 31, 2009, the Company’s subsidiary banks operated 94 branches throughout Virginia. Some of the Company’s non-banking subsidiaries include Union Mortgage and Union Investment Services, Inc. All of the offices of Union Mortgage are leased. The vast majority of the offices for Union Investment Services, Inc. are within retail branch locations. In May 2007, the Company completed construction of a 70,000 square foot operations center in Caroline County, Virginia. The Company sold its former operations center in the third quarter of 2007. See the Note 1 “Summary of Significant Accounting Policies” and Note 5 “Bank Premises and Equipment” in the “Notes to the Consolidated Financial Statements” of this Form 10-K for information with respect to the amounts at which bank premises and equipment are carried and commitments under long-term leases.
In the ordinary course of its operations, the Company and its subsidiaries are parties to various legal proceedings. Based on the information presently available, and after consultation with legal counsel, management believes that the ultimate outcome in such proceedings, in the aggregate, will not have a material adverse effect on the business or the financial condition or results of operations of the Company.
17
Table of Contents
ITEM 5. – MARKET FOR REGISTRANT’S COMMON EQUITY, RELATED STOCKHOLDER MATTERS AND ISSUER PURCHASES OF EQUITY SECURITIES.
The following performance graph does not constitute soliciting material and should not be deemed filed or incorporated by reference into any other Company filing under the Securities Act of 1933 or the Securities Exchange Act of 1934, except to the extent the Company specifically incorporates the performance graph by reference therein.
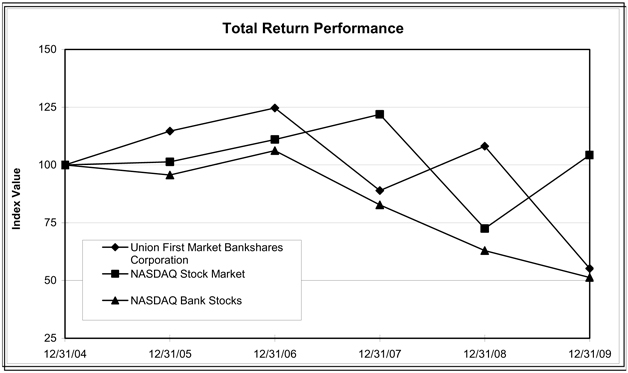
Five-Year Stock Performance Graph
The following chart compares the yearly percentage change in the cumulative shareholder return on the Company’s common stock during the five years ended December 31, 2009, with (1) the Total Return Index for the NASDAQ Stock Market and (2) the Total Return Index for NASDAQ Bank Stocks. This comparison assumes $100 was invested on December 31, 2004, in the Company’s common stock and the comparison groups and assumes the reinvestment of all cash dividends prior to any tax effect and retention of all stock dividends.
Union First Market Bankshares Corporation
| Period Ending | ||||||||||||||||||
| Index |
12/31/04 | 12/31/05 | 12/31/06 | 12/31/07 | 12/31/08 | 12/31/09 | ||||||||||||
| Union First Market Bankshares Corporation |
$ | 100.00 | $ | 114.66 | $ | 124.68 | $ | 88.94 | $ | 108.17 | $ | 55.21 | ||||||
| NASDAQ Stock Market |
100.00 | 101.37 | 111.03 | 121.92 | 72.49 | 104.31 | ||||||||||||
| NASDAQ Bank Stocks |
100.00 | 95.67 | 106.20 | 82.76 | 62.96 | 51.31 | ||||||||||||
18
Table of Contents
Information on Common Stock, Market Prices and Dividends
There were 18,419,567 shares of the Company’s common stock outstanding at the close of business on December 31, 2009, which were held by 2,401 shareholders of record. The closing price of the Company’s common stock on December 31, 2009 was $12.39 per share compared to $24.80 on December 31, 2008.
The Company completed a follow-on equity raise on September 16, 2009 of 4,725,000 shares of common stock at a price of $13.25 per share. On February 1, 2010, the Company issued 7,477,273 shares of common stock in connection with the acquisition of First Market Bank.
On September 7, 2006, the Company’s Board declared a three-for-two stock split to shareholders of record as of the close of business on October 2, 2006. Share and per share amounts for periods prior to the stock split have been retroactively adjusted to reflect the effect of the three-for-two split.
The following table summarizes the high and low closing sales prices and dividends declared for quarterly periods during the years ended December 31, 2009 and 2008.
| Market Values | Dividends Declared | |||||||||||||||||
| 2009 | 2008 | 2009 | 2008 | |||||||||||||||
| High | Low | High | Low | |||||||||||||||
| First Quarter |
$ | 24.71 | $ | 9.01 | $ | 21.90 | $ | 16.05 | $ | 0.120 | $ | 0.185 | ||||||
| Second Quarter |
20.70 | 14.34 | 20.38 | 14.89 | 0.060 | 0.185 | ||||||||||||
| Third Quarter |
16.81 | 12.26 | 29.20 | 14.25 | 0.060 | 0.185 | ||||||||||||
| Fourth Quarter |
13.03 | 11.11 | 25.00 | 16.02 | 0.060 | 0.185 | ||||||||||||
| $ | 0.300 | $ | 0.740 | |||||||||||||||
Regulatory restrictions on the ability of the Community Banks to transfer funds to the Company at December 31, 2009 are set forth in Note 17, “Parent Company Financial Information”, contained in the “Notes to the Consolidated Financial Statements” of this Form 10-K. A discussion of certain limitations on the ability of the Community Banks to pay dividends to the Company and the ability of the Company to pay dividends on its common stock, is set forth in Part I., Item 1 - Business, of this Form 10-K under the headings “Supervision and Regulation - Limits on Dividends and Other Payments” and “Supervision and Regulation - The Community Banks.”
In 2006, the Company began paying its dividend on a quarterly basis instead of semi-annually. It is anticipated the dividends will continue to be paid near the end of February, May, August and November. In making its decision on the payment of dividends on the Company’s common stock, the Board considers operating results, financial condition, capital adequacy, regulatory requirements, shareholder returns and other factors.
Stock Repurchase Program
The Board of Directors authorized management of the Company to buy up to 150,000 shares of its outstanding common stock in the open market at prices that management determines to be prudent. No shares were repurchased during the year ended December 31, 2009. In March 2008, management repurchased 15,000 shares at a price of $16.87 per share.
19
Table of Contents
ITEM 6. – SELECTED FINANCIAL DATA.
The following table sets forth selected financial data for the Company over each of the past five years ended December 31 (dollars in thousands, except per share amounts):
| 2009 | 2008 | 2007 | 2006 | 2005 | ||||||||||||||||
| Results of Operations |
||||||||||||||||||||
| Interest and dividend income |
$ | 128,587 | $ | 135,095 | $ | 140,996 | $ | 129,156 | $ | 102,317 | ||||||||||
| Interest expense |
48,771 | 57,222 | 65,251 | 52,441 | 32,967 | |||||||||||||||
| Net interest income |
79,816 | 77,873 | 75,745 | 76,715 | 69,350 | |||||||||||||||
| Provision for loan losses |
18,246 | 10,020 | 1,060 | 1,450 | 1,172 | |||||||||||||||
| Net interest income after provision for loan losses |
61,570 | 67,853 | 74,685 | 75,265 | 68,178 | |||||||||||||||
| Noninterest income |
32,967 | 30,555 | 25,105 | 28,245 | 25,510 | |||||||||||||||
| Noninterest expenses |
85,287 | 79,636 | 73,550 | 67,567 | 58,275 | |||||||||||||||
| Income before income taxes |
9,250 | 18,772 | 26,240 | 35,943 | 35,413 | |||||||||||||||
| Income tax expense |
890 | 4,258 | 6,484 | 9,951 | 10,591 | |||||||||||||||
| Net income |
$ | 8,360 | $ | 14,514 | $ | 19,756 | $ | 25,992 | $ | 24,822 | ||||||||||
| Financial Condition |
||||||||||||||||||||
| Assets |
$ | 2,587,272 | $ | 2,551,932 | $ | 2,301,397 | $ | 2,092,891 | $ | 1,824,958 | ||||||||||
| Loans, net of unearned income |
1,874,224 | 1,874,088 | 1,747,820 | 1,549,445 | 1,362,254 | |||||||||||||||
| Deposits |
1,916,364 | 1,926,999 | 1,659,578 | 1,665,908 | 1,456,515 | |||||||||||||||
| Stockholders’ equity |
282,088 | 273,798 | 212,082 | 199,416 | 179,358 | |||||||||||||||
| Ratios |
||||||||||||||||||||
| Return on average assets |
0.32 | % | 0.61 | % | 0.91 | % | 1.30 | % | 1.43 | % | ||||||||||
| Return on average equity |
2.90 | % | 6.70 | % | 9.61 | % | 13.64 | % | 14.49 | % | ||||||||||
| Cash basis return on average assets (1) |
0.38 | % | 0.68 | % | 1.00 | % | 1.40 | % | 1.51 | % | ||||||||||
| Cash basis return on average tangible common equity (1) |
5.54 | % | 10.69 | % | 14.88 | % | 20.31 | % | 19.57 | % | ||||||||||
| Efficiency ratio (2) |
75.62 | % | 73.45 | % | 72.93 | % | 64.37 | % | 61.43 | % | ||||||||||
| Equity to assets |
10.90 | % | 10.73 | % | 9.22 | % | 9.53 | % | 9.82 | % | ||||||||||
| Tangible Common Equity / Tangible Assets |
8.64 | % | 6.10 | % | 6.45 | % | 6.75 | % | 7.82 | % | ||||||||||
| Asset Quality |
||||||||||||||||||||
| Allowance for loan losses |
$ | 30,484 | $ | 25,496 | $ | 19,336 | $ | 19,148 | $ | 17,116 | ||||||||||
| Allowance for loan losses / total outstanding loans |
1.63 | % | 1.36 | % | 1.11 | % | 1.24 | % | 1.26 | % | ||||||||||
| Allowance for loan losses / nonperforming loans |
136.41 | % | 176.91 | % | 204.92 | % | 176.11 | % | 152.07 | % | ||||||||||
| Net charge-offs / gross loans |
0.71 | % | 0.21 | % | 0.05 | % | 0.01 | % | 0.02 | % | ||||||||||
| Per Share Data |
||||||||||||||||||||
| Earnings per share, basic |
$ | 0.19 | $ | 1.08 | $ | 1.48 | $ | 1.97 | $ | 1.89 | ||||||||||
| Earnings per share, diluted |
0.19 | 1.07 | 1.47 | 1.94 | 1.87 | |||||||||||||||
| Cash basis earnings per share, diluted (1) |
0.63 | 1.16 | 1.56 | 2.03 | 1.93 | |||||||||||||||
| Cash dividends paid |
0.300 | 0.740 | 0.725 | 0.630 | 0.520 | |||||||||||||||
| Market value per share |
12.39 | 24.80 | 21.14 | 30.59 | 28.73 | |||||||||||||||
| Book value per tangible common share |
15.34 | 16.03 | 15.82 | 14.99 | 13.59 | |||||||||||||||
| Price to earnings ratio, diluted |
65.21 | 23.18 | 14.38 | 15.77 | 15.34 | |||||||||||||||
| Price to book value ratio |
80.8 | % | 154.7 | % | 133.7 | % | 204.1 | % | 211.4 | % | ||||||||||
| Dividend payout ratio |
157.89 | % | 69.16 | % | 49.32 | % | 31.98 | % | 27.21 | % | ||||||||||
| Weighted average shares outstanding, basic |
15,160,619 | 13,477,760 | 13,341,741 | 13,233,101 | 13,142,999 | |||||||||||||||
| Weighted average shares outstanding, diluted |
15,201,993 | 13,542,948 | 13,422,139 | 13,361,773 | 13,275,074 | |||||||||||||||
| (1) | Refer to “Item 7. Management’s Discussion and Analysis of Financial Condition and Results of Operations”, section “Non GAAP Measures” for a reconciliation. |
| (2) | The efficiency ratio is calculated by dividing noninterest expense over the sum of net interest income plus noninterest income. |
20
Table of Contents
ITEM 7. – MANAGEMENT’S DISCUSSION AND ANALYSIS OF FINANCIAL CONDITION AND RESULTS OF OPERATIONS.
The following discussion and analysis provides information about the major components of the results of operations and financial condition, liquidity and capital resources of the Company and its subsidiaries. This discussion and analysis should be read in conjunction with the “Consolidated Financial Statements” and the “Notes to the Consolidated Financial Statements” presented in Item 8 “Financial Statements and Supplementary Data” of this Form 10-K.
CRITICAL ACCOUNTING POLICIES
General
The accounting and reporting policies of the Company and its subsidiaries are in accordance with accounting principles generally accepted in the United States of America (“GAAP”) and conform to general practices within the banking industry. The Company’s financial position and results of operations are affected by management’s application of accounting policies, including estimates, assumptions and judgments made to arrive at the carrying value of assets and liabilities, and amounts reported for revenues, expenses and related disclosures. Different assumptions in the application of these policies could result in material changes in the Company’s consolidated financial position and/or results of operations.
The more critical accounting and reporting policies include the Company’s accounting for the allowance for loan losses, mergers and acquisitions and goodwill and intangible assets. The Company’s accounting policies are fundamental to understanding the Company’s consolidated financial position and consolidated results of operations. Accordingly, the Company’s significant accounting policies are discussed in detail in Note 1 “Summary of Significant Accounting Policies” in the “Notes to the Consolidated Financial Statements” in the Company’s Annual Report on Form 10-K for the year ended December 31, 2009. The Company adopted Accounting Standards Codification (“ASC”) 105, The FASB Accounting Standards Codification and the Hierarchy of Generally Accepted Accounting Principles—a replacement of FASB Statement No. 162 (“ASC 105”), during the third quarter 2009.
The following is a summary of the Company’s critical accounting policies that are highly dependent on estimates, assumptions and judgments.
Allowance for Loan Losses
The allowance for loan losses is an estimate of the losses that may be sustained in the loan portfolio. The allowance is based on two basic principles of accounting: (i) ASC 450 Contingencies, which requires that losses be accrued when occurrence is probable and can be reasonably estimated, and (ii) ASC 310 Receivables, which requires that losses be accrued based on the differences between the value of collateral, present value of future cash flows or values that are observable in the secondary market and the loan balance.
The Company’s allowance for loan losses is the accumulation of various components that are calculated based on independent methodologies. All components of the allowance represent an estimation performed pursuant to applicable GAAP. Management’s estimate of each homogenous pool component is based on certain observable data that management believes are most reflective of the underlying credit losses being estimated. This evaluation includes credit quality trends; collateral values; loan volumes; geographic, borrower and industry concentrations; seasoning of the loan portfolio; the findings of internal credit quality assessments and results from external bank regulatory examinations. These factors, as well as historical losses and current economic and business conditions, are used in developing estimated loss factors used in the calculations.
21
Table of Contents
Applicable GAAP requires that the impairment of loans that have been separately identified for evaluation are measured based on the present value of expected future cash flows or, alternatively, the observable market price of the loans or the fair value of the collateral. However, for those loans that are collateral dependent (that is, if repayment of those loans is expected to be provided solely by the underlying collateral) and for which management has determined foreclosure is probable, the measure of impairment is to be based on the net realizable value of the collateral. This statement also requires certain disclosures about investments in impaired loans and the allowance for loan losses and interest income recognized on impaired loans.
Reserves for commercial loans are determined by applying estimated loss factors to the portfolio based on historical loss experience and management’s evaluation and “risk grading” of the commercial loan portfolio. Reserves are provided for noncommercial loan categories using historical loss factors applied to the total outstanding loan balance of each loan category. Additionally, environmental factors based on national and local economic conditions, as well as portfolio-specific attributes, are considered in estimating the allowance for loan losses.
While management uses the best information available to establish the allowance for loan and lease losses, future adjustments to the allowance may be necessary if future economic conditions differ substantially from the assumptions used in making the valuations or, if required by regulators, based upon information available to them at the time of their examinations. Such adjustments to original estimates, as necessary, are made in the period in which these factors and other relevant considerations indicate that loss levels may vary from previous estimates.
Mergers and Acquisitions
The Company’s merger and acquisition strategy focuses on high-growth areas with strong market demographics and targets organizations that have a comparable corporate culture, strong performance and good asset quality, among other factors.
The Company has accounted for its previous business combinations under the purchase method of accounting, a cost allocation process which required the cost of an acquisition to be allocated to the individual assets acquired and liabilities assumed based on their estimated fair values. Beginning January 1, 2009, business combinations must be accounted for under ASC 805 Business Combinations, using the acquisition method of accounting. The acquisition method of accounting requires an acquirer to recognize the assets acquired and the liabilities assumed at the acquisition date measured at their fair values as of that date. To determine the fair values, the Company will continue to rely on third party valuations, such as appraisals, or internal valuations based on discounted cash flow analyses or other valuation techniques. Under the acquisition method of accounting, the Company will identify the acquirer and the closing date and apply applicable recognition principles and conditions. Costs that the Company expects, but is not obligated to incur in the future, to effect its plan to exit an activity of an acquiree or to terminate the employment of or relocate an acquiree’s employees are not liabilities at the acquisition date. The Company will not recognize these costs as part of applying the acquisition method. Instead, the Company will recognize these costs as expenses in its post-combination financial statements in accordance with other applicable GAAP.
Acquisition-related costs are costs the Company incurs to effect a business combination. Those costs include advisory, legal, accounting, valuation, and other professional or consulting fees. Some other examples for the Company include systems conversions, integration planning consultants and advertising costs. The Company will account for acquisition-related costs as expenses in the periods in which the costs are incurred and the services are received, with one exception. The costs to issue debt or equity securities will be recognized in accordance with other applicable GAAP. These acquisition-related costs are included within the Consolidated Statements of Income classified within the noninterest expense caption.
22
Table of Contents
Goodwill and Intangible Assets
Beginning January 1, 2009, business combinations must be accounted for under ASC 805, Business Combinations, using the acquisition method of accounting. The Company has accounted for its previous business combinations under the purchase method of accounting, a cost allocation process which required the cost of an acquisition to be allocated to the individual assets acquired and liabilities assumed based on their estimated fair values. The Company follows ASC 350 Goodwill and Other Intangible Assets, which prescribes the accounting for goodwill and intangible assets subsequent to initial recognition. The provisions of this guidance discontinued the amortization of goodwill and intangible assets with indefinite lives but require an impairment review at least annually and more frequently if certain impairment indicators are evident. Based on the annual testing for impairment of goodwill and intangible assets, the Company has recorded no impairment charges to date.
Goodwill totaled $56.5 million for both years ended December 31, 2009 and 2008. Based on the testing of goodwill for impairment, there were no impairment charges for 2009, 2008 or 2007. Core deposit intangible assets are being amortized over the periods of expected benefit, which range from 5 to 15 years. Core deposit intangibles, net of amortization, amounted to $7.7 million and $9.6 million at the years ended December 31, 2009 and 2008, respectively. Amortization expense of core deposit intangibles for the years ended December 31, 2009, 2008 and 2007 totaled $1.9 million, $2.0 million and $1.9 million, respectively.
RESULTS OF OPERATIONS
Net Income
For the year ended December 31, 2009 compared to the year ended December 31, 2008, net income decreased $6.1 million, or 42.4%, from $14.5 million to $8.4 million. Net income available to common shareholders, which deducts from net income the dividends and discount accretion on preferred stock, was $2.9 million for the year ended December 31, 2009 compared to $14.5 million a year ago. This represents a decrease in earnings per share, on a diluted basis, of $0.88, to $0.19 from $1.07. Of this decline, $0.36 was attributable to dividends and acceleration of the discount accretion associated with the redemption of the Treasury’s investment in the Company. Return on average common equity (using net income in the numerator) for the year ended December 31, 2009 was 2.90%, while return on average assets was 0.32%, compared to 6.70% and 0.61%, respectively, for the year ended 2008.
Drivers of the decline in net income included increased credit costs, lower yields on earning assets, increased FDIC assessments and costs associated with the acquisition of First Market Bank. These declines were partially offset by a favorable reduction in the Company’s cost of funds and increased revenue from the mortgage segment.
Net Interest Income
Net interest income, which represents the principal source of earnings for the Company, is the amount by which interest income exceeds interest expense. The net interest margin is net interest income expressed as a percentage of average earning assets. Changes in the volume and mix of interest-earning assets and interest-bearing liabilities, as well as their respective yields and rates, have a significant impact on the level of net interest income, the net interest margin and net income.
During 2009, the Federal Open Market Committee of the Federal Reserve (“FOMC”) maintained the target range for the Federal funds rate at 0% to 0.25% and reiterated its intent to hold the Federal funds rate exceptionally low for an extended period. Additionally, the FOMC used liquidity and asset-purchase programs to support the financial markets and to stimulate the economy throughout 2009 but anticipates that, in light of recent ongoing improvements in the functioning of the financial markets, these programs will end as planned in 2010.
23
Table of Contents
The decline in the target Federal funds rate throughout the last two years had placed downward pressure on the Company’s earning asset yields and related net interest income. During the third and fourth quarters of 2009, however, repricing of money market accounts and certificates of deposit provided significant relief from this trend. The Company also expects net interest margin to be relatively stable over the next several quarters based on the current yield curve.
For the year ended December 31, 2009, tax-equivalent net interest income increased $2.2 million, or 2.8%, to $83.5 million. The tax-equivalent net interest margin decreased 24 basis points to 3.55% from 3.79% compared to the year ended December 31, 2008. The net interest margin decrease was partially attributable to a steeper decline in yields on interest-earning assets as compared to the costs of interest-bearing liabilities. Yields on interest-earning assets declined 84 basis points to 5.62% while the costs of interest-bearing liabilities declined only 60 basis points to 2.46% for the year. The decline in interest-earning asset yields was attributable to loan and investment balances repricing at lower rates, and to a lesser extent, an increase in nonaccrual loans. The decline in the cost of interest-bearing liabilities was attributable to declines in the cost of certificates of deposit and lower volumes and costs of advances from the Federal Home Loan Bank of Atlanta (“FHLB”), partially offset by increased volumes in promotional money market accounts during the last half of the year.
24
Table of Contents
The following table shows interest income on earning assets and related average yields, as well as interest expense on interest-bearing liabilities and related average rates paid for the years ended December 31, (dollars in thousands):
| 2009 | 2008 | 2007 | ||||||||||||||||||||||||||||
| Average Balance |
Interest Income / Expense |
Yield / Rate |
Average Balance |
Interest Income / Expense |
Yield / Rate |
Average Balance |
Interest Income / Expense |
Yield / Rate |
||||||||||||||||||||||
| Assets: |
||||||||||||||||||||||||||||||
| Securities: |
||||||||||||||||||||||||||||||
| Taxable |
$ | 261,078 | $ | 10,606 | 4.06 | % | $ | 178,221 | $ | 9,068 | 5.09 | % | $ | 173,942 | $ | 8,945 | 5.14 | % | ||||||||||||
| Tax-exempt |
118,676 | 8,506 | 7.17 | % | 111,027 | 7,997 | 7.20 | % | 100,944 | 7,272 | 7.20 | % | ||||||||||||||||||
| Total securities |
379,754 | 19,112 | 5.03 | % | 289,248 | 17,065 | 5.90 | % | 274,886 | 16,217 | 5.90 | % | ||||||||||||||||||
| Loans, net (1) |
1,873,606 | 111,139 | 5.93 | % | 1,817,755 | 119,898 | 6.60 | % | 1,637,573 | 125,628 | 7.67 | % | ||||||||||||||||||
| Loans held for sale |
46,454 | 1,931 | 4.16 | % | 24,320 | 1,370 | 5.63 | % | 21,991 | 1,346 | 6.12 | % | ||||||||||||||||||
| Federal funds sold |
313 | 1 | 0.20 | % | 8,217 | 98 | 1.19 | % | 2,852 | 614 | 5.53 | % | ||||||||||||||||||
| Money market investments |
135 | — | 0.00 | % | 153 | 1 | 0.40 | % | 217 | 4 | 1.94 | % | ||||||||||||||||||
| Interest-bearing deposits in other banks |
50,994 | 135 | 0.26 | % | 1,355 | 39 | 1.73 | % | 1,116 | 57 | 5.12 | % | ||||||||||||||||||
| Other interest-bearing deposits |
2,598 | — | 0.00 | % | 2,598 | 49 | 1.87 | % | 2,596 | 135 | 5.18 | % | ||||||||||||||||||
| Total earning assets |
2,353,854 | 132,318 | 5.62 | % | 2,143,646 | 138,520 | 6.46 | % | 1,941,231 | 144,001 | 7.42 | % | ||||||||||||||||||
| Allowance for loan losses |
(29,553 | ) | (21,830 | ) | (18,666 | ) | ||||||||||||||||||||||||
| Total non-earning assets |
254,507 | 257,587 | 244,558 | |||||||||||||||||||||||||||
| Total assets |
$ | 2,578,808 | $ | 2,379,403 | $ | 2,167,123 | ||||||||||||||||||||||||
| Liabilities and Stockholders’ Equity: |
||||||||||||||||||||||||||||||
| Interest-bearing deposits: |
||||||||||||||||||||||||||||||
| Checking |
$ | 201,520 | 314 | 0.16 | % | $ | 218,349 | $ | 1,352 | 0.62 | % | $ | 206,748 | $ | 1,316 | 0.64 | % | |||||||||||||
| Money market savings |
429,501 | 7,905 | 1.84 | % | 238,540 | 5,708 | 2.39 | % | 158,461 | 3,708 | 2.34 | % | ||||||||||||||||||
| Regular savings |
99,914 | 384 | 0.38 | % | 100,782 | 584 | 0.58 | % | 104,507 | 820 | 0.78 | % | ||||||||||||||||||
| Certificates of deposit: |
||||||||||||||||||||||||||||||
| $100,000 and over |
456,644 | 15,063 | 3.30 | % | 435,807 | 17,363 | 3.98 | % | 446,662 | 22,024 | 4.93 | % | ||||||||||||||||||
| Under $100,000 |
492,186 | 15,786 | 3.21 | % | 499,591 | 19,291 | 3.86 | % | 451,224 | 20,366 | 4.51 | % | ||||||||||||||||||
| Total interest-bearing deposits |
1,679,765 | 39,452 | 2.35 | % | 1,493,069 | 44,298 | 2.97 | % | 1,367,602 | 48,234 | 3.53 | % | ||||||||||||||||||
| Other borrowings |
300,739 | 9,319 | 3.10 | % | 377,601 | 12,924 | 3.42 | % | 291,742 | 17,017 | 5.83 | % | ||||||||||||||||||
| Total interest-bearing liabilities |
1,980,504 | 48,771 | 2.46 | % | 1,870,670 | 57,222 | 3.06 | % | 1,659,344 | 65,251 | 3.93 | % | ||||||||||||||||||
| Noninterest-bearing liabilities: |
||||||||||||||||||||||||||||||
| Demand deposits |
289,769 | 272,764 | 283,877 | |||||||||||||||||||||||||||
| Other liabilities |
20,292 | 19,347 | 18,377 | |||||||||||||||||||||||||||
| Total liabilities |
2,290,565 | 2,162,781 | 1,961,598 | |||||||||||||||||||||||||||
| Stockholders’ equity |
288,243 | 216,622 | 205,525 | |||||||||||||||||||||||||||
| Total liabilities and stockholders’ equity |
$ | 2,578,808 | $ | 2,379,403 | $ | 2,167,123 | ||||||||||||||||||||||||
| Net interest income |
$ | 83,547 | $ | 81,298 | $ | 78,750 | ||||||||||||||||||||||||
| Interest rate spread (2) |
3.16 | % | 3.40 | % | 3.49 | % | ||||||||||||||||||||||||
| Interest expense as a percent of average earning assets |
2.07 | % | 2.67 | % | 3.36 | % | ||||||||||||||||||||||||
| Net interest margin |
3.55 | % | 3.79 | % | 4.06 | % | ||||||||||||||||||||||||
| (1) | Nonaccrual loans are included in average loans outstanding. |
| (2) | Income and yields are reported on a taxable equivalent basis using the statutory federal corporate tax rate of 35%. |
25
Table of Contents
The Volume Rate Analysis table presents changes in interest income and interest expense and distinguishes between the changes related to increases or decreases in average outstanding balances of interest-earning assets and interest-bearing liabilities (volume), and the changes related to increases or decreases in average interest rates on such assets and liabilities (rate). Changes attributable to both volume and rate have been allocated proportionally. Results, on a taxable equivalent basis, are as follows in this Volume Rate Analysis table for the years ended December 31, (dollars in thousands):
| 2009 vs. 2008 Increase (Decrease) Due to Change in: | 2008 vs. 2007 Increase (Decrease) Due to Change in: | |||||||||||||||||||||||
| Volume | Rate | Total | Volume | Rate | Total | |||||||||||||||||||
| Earning Assets: |
||||||||||||||||||||||||
| Securities: |
||||||||||||||||||||||||
| Taxable |
$ | 1,813 | $ | (275 | ) | $ | 1,538 | $ | 214 | $ | (91 | ) | $ | 123 | ||||||||||
| Tax-exempt |
517 | (8 | ) | 509 | 725 | — | 725 | |||||||||||||||||
| Total securities |
2,330 | (283 | ) | 2,047 | 939 | (91 | ) | 848 | ||||||||||||||||
| Loans, net |
3,730 | (12,489 | ) | (8,759 | ) | 12,925 | (18,639 | ) | (5,714 | ) | ||||||||||||||
| Loans held for sale |
1,130 | (569 | ) | 561 | 136 | (112 | ) | 24 | ||||||||||||||||
| Federal funds sold |
(49 | ) | (48 | ) | (97 | ) | 266 | (782 | ) | (516 | ) | |||||||||||||
| Money market investments |
(1 | ) | — | (1 | ) | — | (3 | ) | (3 | ) | ||||||||||||||
| Interest-bearing deposits in other banks |
105 | (9 | ) | 96 | 10 | (44 | ) | (34 | ) | |||||||||||||||
| Other interest-bearing deposits |
— | (49 | ) | (49 | ) | — | (86 | ) | (86 | ) | ||||||||||||||
| Total earning assets |
$ | 7,245 | $ | (13,447 | ) | $ | (6,202 | ) | $ | 14,276 | $ | (19,757 | ) | $ | (5,481 | ) | ||||||||
| Interest Bearing Liabilities: |
||||||||||||||||||||||||
| Interest-bearing deposits: |
||||||||||||||||||||||||
| Checking |
$ | (99 | ) | $ | (939 | ) | $ | (1,038 | ) | $ | 75 | $ | (39 | ) | $ | 36 | ||||||||
| Money market savings |
3,628 | (1,431 | ) | 2,197 | 1,916 | 84 | 2,000 | |||||||||||||||||
| Regular savings |
(11 | ) | (189 | ) | (200 | ) | (31 | ) | (205 | ) | (236 | ) | ||||||||||||
| Certificates of deposit: |
||||||||||||||||||||||||
| $100,000 and over |
1,001 | (3,301 | ) | (2,300 | ) | (516 | ) | (4,145 | ) | (4,661 | ) | |||||||||||||
| Under $100,000 |
(296 | ) | (3,209 | ) | (3,505 | ) | 2,043 | (3,118 | ) | (1,075 | ) | |||||||||||||
| Total interest-bearing deposits |
4,223 | (9,069 | ) | (4,846 | ) | 3,487 | (7,423 | ) | (3,936 | ) | ||||||||||||||
| Other borrowings |
(2,437 | ) | (1,167 | ) | (3,604 | ) | 4,150 | (8,243 | ) | (4,093 | ) | |||||||||||||
| Total interest-bearing liabilities |
1,786 | (10,236 | ) | (8,450 | ) | 7,637 | (15,666 | ) | (8,029 | ) | ||||||||||||||
| Change in net interest income |
$ | 5,459 | $ | (3,211 | ) | $ | 2,248 | $ | 6,639 | $ | (4,091 | ) | $ | 2,548 | ||||||||||
Interest Sensitivity
An important element of earnings performance and the maintenance of sufficient liquidity is proper management of the interest sensitivity gap and liquidity gap. The interest sensitivity gap is the difference between interest-sensitive assets and interest-sensitive liabilities in a specific time interval. This gap can be managed by repricing assets or liabilities, which are variable rate instruments, by replacing an asset or liability at maturity or by adjusting the interest rate during the life of the asset or liability. Matching the amounts of assets and liabilities maturing in the same time interval helps to hedge interest rate risk and to minimize the impact of rising or falling interest rates on net interest income.
The Company determines the overall magnitude of interest sensitivity risk and then formulates policies and practices governing asset generation and pricing, funding sources and pricing, and off-balance sheet commitments. These decisions are based on management’s expectations regarding future interest rate movements, the states of the national, regional and local economies, and other financial and business risk factors. The Company uses computer simulation modeling to measure and monitor the effect of various interest rate scenarios and business strategies on net interest income. This modeling reflects interest rate changes and the related impact on net interest income and net income over specified time horizons.
26
Table of Contents
At December 31, 2009 and 2008, the Company was in an asset-sensitive position. As described in the table below, management’s earnings simulation model indicates net interest income will increase as rates increase. An asset-sensitive company generally will be impacted favorably by increasing interest rates while a liability-sensitive company’s net interest margin and net interest income generally will be impacted favorably by declining interest rates.
Earnings Simulation Analysis
Management uses simulation analysis to measure the sensitivity of net interest income to changes in interest rates. The model calculates an earnings estimate based on current and projected balances and rates. This method is subject to the accuracy of the assumptions that underlie the process, but it provides a better analysis of the sensitivity of earnings to changes in interest rates than other analyses, such as the static gap analysis discussed above.
Assumptions used in the model are derived from historical trends and management’s outlook and include loan and deposit growth rates and projected yields and rates. Such assumptions are monitored and periodically adjusted as appropriate. All maturities, calls and prepayments in the securities portfolio are assumed to be reinvested in like instruments. Mortgage loans and mortgage backed securities prepayment assumptions are based on industry estimates of prepayment speeds for portfolios with similar coupon ranges and seasoning. Different interest rate scenarios and yield curves are used to measure the sensitivity of earnings to changing interest rates. Interest rates on different asset and liability accounts move differently when the prime rate changes and are reflected in the different rate scenarios.
The Company uses its simulation model to estimate earnings in rate environments where rates ramp up or down around a “most likely” rate scenario, based on implied forward rates. The analysis assesses the impact on net interest income over a 12 month time horizon by applying 12 month rate ramps, with interest rates rising gradually versus an immediate increase or “shock” in rates, of 100 basis points up to 200 basis points. The ramp down 200 basis points scenario is not meaningful as interest rates are at historic lows and can not decrease another 200 basis points from current levels. The model, under all scenarios, does not drop any rate index below zero. The following table represents the interest rate sensitivity on net interest income for the Company across the rate paths modeled for the year ended December 31, 2009 (dollars in thousands):
| Change In Net Interest Income | ||||||
| % | $ | |||||
| Change in Yield Curve: |
||||||
| +200 basis points |
3.80 | % | 3,797 | |||
| +100 basis points |
1.96 | % | 1,960 | |||
| Most likely rate scenario |
0.00 | % | — | |||
| -100 basis points |
-1.09 | % | (1,085 | ) | ||
| -200 basis points |
-2.18 | % | (2,176 | ) | ||
Economic Value Simulation
Economic value simulation is used to calculate the estimated fair value of assets and liabilities in different interest rate environments. Economic values are calculated based on discounted cash flow analysis. The net economic value of equity is the economic value of all assets minus the economic value of all liabilities. The change in net economic value in different rate environments is an indication of the longer term earnings capability of the balance sheet. The same assumptions are used in the economic value simulation as in the earnings simulation. The economic value simulation uses instantaneous rate shocks to the balance sheet while the earnings simulation uses rate ramps over 12 months. The shock down 200 basis points scenario is not meaningful as interest rates are at historic lows and can not decrease 200 basis points from current levels.
27
Table of Contents
The following chart reflects the estimated change in net economic value in different rate environments using economic value simulation (dollars in thousands):
| Change In Economic Value Of Equity | ||||||
| % | $ | |||||
| Change in Yield Curve: |
||||||
| +200 basis points |
1.09 | % | 4,374 | |||
| +100 basis points |
1.61 | % | 6,454 | |||
| Most likely rate scenario |
0.00 | % | — | |||
| -100 basis points |
-5.72 | % | (22,882 | ) | ||
| -200 basis points |
-13.83 | % | (55,351 | ) | ||
Noninterest Income
For the year ended December 31, 2009, noninterest income increased $2.4 million, or 7.9%, to $33.0 million from $30.6 million for 2008. Of this increase, gains on sales of loans in the mortgage segment accounted for $5.5 million and related to higher origination volume and a surge in refinance activity. These increases were partially offset by declines in account service charges and other fee income of $902 thousand and $634 thousand, respectively, as well as gains on sales of bank property of $1.9 million from 2008. The decline in service charges and other fee income was primarily the result of decreased overdraft fees and returned check charges of $984 thousand, annuity sales of $207 thousand and brokerage commissions of $341 thousand. During 2008, the Company recorded gains of $1.9 million from the sale of bank property and $198 thousand relating to the mandatory redemption of certain classes of common stock to financial institution members of Visa U.S.A. Excluding the contribution of the mortgage segment and prior period gain transactions, noninterest income declined $1.0 million, or 5.7%.
For the year ended December 31, 2008, noninterest income increased $5.5 million, or 21.7%, to $30.6 million from $25.1 million for 2007. This increase included increased gains on the sale of mortgage loans of approximately $2.3 million, increased revenue of $1.8 million from deposit account service charges and other fees and increases in gains from sales of bank owned property totaling approximately $1.6 million over 2007. These increases were partially offset by lower gains on securities transactions of $557 thousand related to securities that were called by the issuers in the prior year.
Noninterest Expense
For the year ended December 31, 2009, noninterest expense increased $5.7 million, or 7.1 %, to $85.3 million compared to $79.6 million for the year ended December 31, 2008. Other operating expenses increased $5.8 million. Of this increase, FDIC insurance assessment premiums accounted for $3.4 million and were comprised of a special insurance assessment of $1.2 million during the second quarter and an increase in the regular insurance assessment of $2.2 million. Merger and conversion costs, which included costs associated with the acquisition of First Market Bank increased $1.0 million to $1.5 million in 2009. Other costs contributing to the increase were higher professional fees of $1.1 million which included legal expenses of $665 thousand relating to the Company’s problem loan workouts and collection activities and an accelerated contract payment of $420 thousand. Costs related to other real estate owned and loan expenses increased to $1.6 million from $754 thousand last year. Marketing and advertising costs increased $125 thousand primarily related to the Company’s Loyalty BankingSM and other campaigns. These increases in other operating expenses were partially offset by a decrease in costs of approximately $600 thousand related administrative expenses. Salary and benefits costs increased $189 thousand, related to higher mortgage segment commissions of $2.6 million, partially offset by lower salary expenses of $942 thousand, profit sharing expense of $809 thousand and incentive compensation of $959 thousand. In addition, furniture and equipment expenses declined $415 thousand, or 8.3%, primarily related to declining depreciation and amortization expense and rental costs. Occupancy expenses increased $91 thousand, or 1.3%. Excluding mortgage segment operations, increased FDIC special insurance assessment, the accelerated contract payment discussed above, acquisition related expenses and prior year conversion costs, noninterest expense increased approximately $388 thousand, or 0.5 %.
28
Table of Contents
During the first quarter of 2009, to replenish the FDIC’s DIF, the FDIC issued a final rule to impose a special insurance assessment of 5 basis points calculated on each bank’s total assets minus Tier 1 capital. The special insurance assessment was billed on June 30, payable on September 30 and recorded as a second quarter expense. During the second quarter of 2009, the Company expensed $1.2 million related to the FDIC special insurance assessment. The special insurance assessment was in addition to the regular quarterly risk-based assessment. The assessment base for regular quarterly insurance assessments was not changed. On November 12, 2009, the FDIC issued a final rule to require institutions to prepay their estimated quarterly risk-based assessments for the fourth quarter of 2009 and for all of 2010, 2011, and 2012. The FDIC also adopted a uniform three-basis point increase in assessment rates effective January 1, 2011, and extended the restoration period from seven to eight years. The Company made a prepayment of $12.6 million during the fourth quarter, of which $3.3 million is expected to be expensed over the next 12 months.
For the year ended December 31, 2009, acquisition costs associated with the pending acquisition of First Market Bank, were $1.5 million and are reported as a component of “Other operating expenses” within the Company’s “Consolidated Statements of Income.” These costs were predominantly legal and due diligence costs. The Company is incurring additional acquisition costs both prior to and after the close date of February 1, 2010.
For the year ended December 31, 2008, noninterest expense increased $6.1 million, or 8.3 %, to $79.6 million compared to the year ended December 31, 2007. Increases in salaries and benefits of $4.4 million, or 11.2%, were primarily attributable to increased mortgage segment commissions of $1.5 million as well as costs associated with personnel in the new branches and normal compensation increases. Occupancy expenses increased $875 thousand, or 14.4%, and were principally attributable to increased facilities costs associated with the Company’s new operations center and the new branches. Some of these increased costs included depreciation, rental expenses, real estate taxes, and, to a lesser extent, utility costs. Other operating expenses increased $678 thousand, or 2.8%, and principally related to ongoing infrastructure enhancements to support the Company’s continued growth, conversion expenses related to merging affiliate banks, as well as higher FDIC insurance costs due to exhausting assessment credits. Infrastructure enhancements included Voice-over Internet Protocol and the associated hardware and software to support this technology. Approximately $515 thousand of operating expenses were incurred to combine two affiliate banks. Furniture and equipment expenses increased $172 thousand, or 3.6%, and were attributable to the related depreciation of the new branches and the new operations center.
SEGMENT INFORMATION
Community Bank Segment
For the year ended December 31, 2009, net income for the community banking segment decreased approximately $8.6 million, or 59.1%, to $5.9 million compared to $14.5 million at December 31, 2008. Net interest income increased $1.0 million, or 1.4%, principally as a result of lower interest expense on deposits and borrowings. Provision for loan loss increased $8.2 million during 2009. Net interest income after the provision for loan losses decreased $7.2 million, or 10.7%.
Noninterest income decreased $3.2 million, or 15.8%, to $16.7 million for the year ended December 31, 2009 compared to 2008. Contributing to this decrease were declines in gains on sales of bank property of $1.9 million and service charges on deposit accounts and other fee income of $902 thousand and $634
29
Table of Contents
thousand, respectively. The decline in service charges and fees was primarily the result of decreased overdraft fees and returned check charges, annuity and brokerage commissions. During the same period in 2008, the Company recorded gains of $1.9 million from the sale of bank property and $198 thousand relating to the mandatory redemption of certain classes of common stock to financial institution members of Visa U.S.A.
Noninterest expense increased $2.9 million, or 4.3 %, to $71.2 million for the year ended December 31, 2009 compared to 2008. Other operating expenses increased $5.6 million compared to a year ago. Of this increase, FDIC insurance assessment premiums accounted for $3.4 million and were comprised of a special insurance assessment of $1.2 million during the second quarter and an increase in the regular insurance assessment of $2.2 million. Costs associated with the acquisition of First Market Bank were $1.5 million in 2009. Other costs contributing to the increase were higher professional fees of $1.1 million which included legal expenses of $665 thousand relating to the Company’s problem loan workouts and collection activities and an accelerated contract payment of $420 thousand. Costs related to other real estate owned and loan expenses increased to $1.6 million from $754 thousand a year ago.
Salary and benefits costs decreased $2.6 million thousand, related to lower incentive compensation of $967 thousand, salary expenses of $964 thousand and profit sharing expense of $852 thousand. In addition, furniture and equipment expenses decreased $348 thousand, or 7.6%, primarily related to declining depreciation and amortization expense. Occupancy expenses increased $285 thousand, or 4.7%. Excluding the costs related to the First Market Bank acquisition, the special FDIC insurance assessment premium in 2009, and the prior year’s affiliate banks’ conversion costs in 2008, noninterest expense increased $338 thousand, or 0.5%, when compared to the year ended December 31, 2008.
For the year ended December 31, 2008, net income for the community banking segment decreased approximately $6.1 million, or 29.6%, from $20.6 million to $14.5 million compared to the same period in 2007. Net interest income increased $1.8 million, or 2.3%, principally as a result of increased interest-earning asset volumes and declining cost of funds. Provision for loan loss increased $9.0 million during 2008. Net interest income after the provision for loan losses decreased $7.2 million, or 9.7%, from a year ago. Reflected in this net decrease are specific loan loss reserves of $750 thousand that were recaptured during the first quarter of 2007.
Noninterest income increased $3.2 million, or 19.2%, to $19.8 million for the year ended December 31, 2008 compared to 2007. This increase included increased revenue of $1.8 million from deposit account service charges and other fees and increases in gains from sales of bank owned real estate totaling approximately $1.6 million.
Noninterest expense increased $4.8 million, or 7.6 %, to $68.3 million for the year ended December 31, 2008 compared to 2007. Increases in salaries and benefits of $3.1 million, or 9.8%, were primarily attributable to the costs associated with personnel in the new branches and normal compensation increases. Occupancy expenses increased $837 thousand, or 16.0%, and were largely related to increased facilities costs associated with the Company’s new operations center and the new branches. Other operating expenses increased $788 thousand, or 3.5%, and principally related to ongoing infrastructure enhancements to support the Company’s continued growth, conversion expenses related to merging affiliate banks, as well as higher FDIC insurance costs due to exhausting assessment credits.
Mortgage Segment
For the year ended December 31, 2009, mortgage segment net income increased $2.4 million, to $2.4 million from $39 thousand in 2008. Originations increased $279.0 million, or 65.7%, to $703.7 million from 2008 to 2009, resulting in an increase in loan revenue of $5.5 million, or 49.6%. Salaries and benefits increased $2.8 million principally due to commission expenses related to increased loan
30
Table of Contents
originations. Occupancy costs decreased $194 thousand and furniture and equipment costs decreased $66 thousand due to the nonrenewal of certain leased office locations and lower equipment rental expense, partially offset by the addition of two new office locations. Other operating expenses increased $168 thousand, principally due to increased underwriting fees related to loan volume and marketing costs.
For the year ended December 31, 2008, mortgage segment net income increased by $842 thousand from a net loss of $803 thousand to net income of $39 thousand. Gains on the sale of loans increased $2.3 million, or 26.2%, as a result of revised fee schedules, increased volume in government (FHA/VA) loans and an increase in originations of 14.2%. Expenses related to loan payoff and early payment defaults amounted to $503 thousand, which reduced the gain on sale of loans for the period due to the volatile state of residential mortgage lending. Salaries and benefits increased $1.3 million, principally due to commissions and other expenses related to increased loan originations. Occupancy and furniture and equipment costs increased $38 thousand and $9 thousand, respectively, largely driven by origination growth and additions to the branch office network. Other operating costs declined $62 thousand to $1.6 million, or 3.6%, and were principally related to lower loan related losses.
BALANCE SHEET
Balance Sheet Overview
At December 31, 2009, total assets increased slightly to $2.59 billion from $2.55 billion at December 31, 2008. Net loans decreased $4.9 million, or 0.3%, compared to December 31, 2008. The Company’s mortgage segment increased loans held for sale by $24.9 million from December 31, 2008 related to higher origination volume. As of December 31, 2009, total cash and cash equivalents were $45.9 million, a decrease of $102.6 million from $148.5 million at December 31, 2008. Total cash and cash equivalents at December 31, 2009 included proceeds of approximately $58.8 million from the Company’s third quarter follow-on equity raise, net of underwriting costs, legal and accounting fees. During the fourth quarter 2009, the Company redeemed the Series A Preferred Stock issued to the Treasury by repaying $59 million received in December 2008 under the Capital Purchase Program. In addition, the Company also did not reissue its brokered certificates of deposit, which totaled $66.7 million at December 31, 2008. The decline in total cash and cash equivalents from December 31, 2008 resulted from redeploying cash into higher yielding investment securities. Deposits decreased $10.6 million, or 0.6%, from a year ago primarily due to decreases in both regular and brokered certificates of deposit, partially offset by increases in money market accounts.
Total borrowings, including repurchase agreements, increased $32.5 million to $366.1 million at December 31, 2009, from a year ago, principally as a result of a net increase in wholesale funding. The Company’s equity to assets ratios were 10.90% and 10.73% at December 31, 2009 and 2008, respectively. The Company’s tangible common equity to assets ratio was 8.64% and 6.10% at December 31, 2009 and 2008, respectively.
The Company completed a follow-on equity raise on September 16, 2009, which generated cash and capital of approximately $58.8 million, net of underwriting discounts, commissions and estimated offering expenses from the issuance of 4,725,000 shares of common stock at a price of $13.25 per share. It is anticipated that the proceeds of this offering will be used for general corporate purposes, including organic and opportunistic acquisition-based growth.
The Company’s management remains focused on maintaining adequate levels of liquidity and capital during this challenging environment of weakened economic conditions, and believes sound risk management practices in underwriting and lending will enable it to successfully weather this period of economic uncertainty.
31
Table of Contents
The following table presents the Company’s contractual obligations and scheduled payment amounts due at the various intervals over the next five years and beyond as of December 31, 2009 (dollars in thousands):
| Total | Less than 1 year |
1-3 years | 4-5 years | More than 5 years | |||||||||||
| Long-term debt |
$ | 200,310 | $ | — | $ | — | $ | — | $ | 200,310 | |||||
| Operating leases |
8,784 | 1,830 | 3,697 | 559 | 2,698 | ||||||||||
| Other short-term borrowings |
90,000 | 90,000 | — | — | — | ||||||||||
| Repurchase agreements |
50,550 | 50,550 | — | — | — | ||||||||||
| Total contractual obligations |
$ | 349,644 | $ | 142,380 | $ | 3,697 | $ | 559 | $ | 203,008 | |||||
For more information pertaining to the previous table, reference Note 5 “Bank Premise and Equipment” and Note 8 “Borrowings” in the “Notes to the Consolidated Financial Statements.”
Loan Portfolio
Loans, net of unearned income were both $1.9 billion at December 31, 2009 and 2008. Loans secured by real estate continue to represent the Company’s largest category, comprising 82.4% of the total loan portfolio.
The following table presents the composition of the Company’s loans, net of unearned income, and as a percentage of the Company’s total gross loans as of December 31, (dollars in thousands):
| 2009 | 2008 | 2007 | 2006 | 2005 | ||||||||||||||||||||||||||
| Mortgage loans on real estate: |
||||||||||||||||||||||||||||||
| Residential 1-4 family |
$ | 349,277 | 18.6 | % | $ | 292,003 | 15.6 | % | $ | 281,847 | 16.1 | % | $ | 263,770 | 17.0 | % | $ | 271,721 | 19.9 | % | ||||||||||
| Commercial |
596,773 | 31.8 | % | 550,680 | 29.4 | % | 500,118 | 28.6 | % | 448,691 | 29.0 | % | 394,094 | 28.9 | % | |||||||||||||||
| Construction, land development and other land loans |
307,726 | 16.4 | % | 403,502 | 21.5 | % | 396,928 | 22.7 | % | 324,606 | 20.9 | % | 273,262 | 20.1 | % | |||||||||||||||
| Second mortgages |
34,942 | 1.9 | % | 38,060 | 2.0 | % | 37,875 | 2.2 | % | 35,584 | 2.3 | % | 24,088 | 1.8 | % | |||||||||||||||
| Equity lines of credit |
182,449 | 9.7 | % | 162,740 | 8.7 | % | 128,897 | 7.4 | % | 112,079 | 7.2 | % | 96,490 | 7.1 | % | |||||||||||||||
| Multifamily |
46,581 | 2.5 | % | 37,321 | 2.0 | % | 32,970 | 1.9 | % | 29,263 | 1.9 | % | 14,648 | 1.1 | % | |||||||||||||||
| Agriculture |
26,191 | 1.4 | % | 30,727 | 1.6 | % | 18,958 | 1.1 | % | 12,903 | 0.8 | % | 11,145 | 0.8 | % | |||||||||||||||
| Total real estate loans |
1,543,939 | 82.4 | % | 1,515,033 | 80.8 | % | 1,397,593 | 80.0 | % | 1,226,896 | 79.2 | % | 1,085,448 | 79.7 | % | |||||||||||||||
| Commercial Loans |
126,157 | 6.7 | % | 146,827 | 7.8 | % | 136,317 | 7.8 | % | 136,617 | 8.8 | % | 127,048 | 9.3 | % | |||||||||||||||
| Consumer installment loans |
||||||||||||||||||||||||||||||
| Personal |
148,811 | 7.9 | % | 160,161 | 8.5 | % | 173,650 | 9.9 | % | 153,865 | 9.9 | % | 126,174 | 9.3 | % | |||||||||||||||
| Credit cards |
17,743 | 0.9 | % | 15,723 | 0.8 | % | 13,108 | 0.7 | % | 9,963 | 0.6 | % | 9,388 | 0.7 | % | |||||||||||||||
| Total consumer installment loans |
166,554 | 8.8 | % | 175,884 | 9.3 | % | 186,758 | 10.6 | % | 163,828 | 10.6 | % | 135,562 | 10.0 | % | |||||||||||||||
| All other loans |
37,574 | 2.0 | % | 36,344 | 1.9 | % | 27,152 | 1.6 | % | 22,104 | 1.4 | % | 14,196 | 1.0 | % | |||||||||||||||
| Gross loans |
1,874,224 | 100.0 | % | 1,874,088 | 100.0 | % | 1,747,820 | 100.0 | % | 1,549,445 | 100.0 | % | 1,362,254 | 100.0 | % | |||||||||||||||
The following table presents the remaining maturities and type of rate (variable or fixed) on commercial and real estate constructions loans as of December 31, 2009 (dollars in thousands):
| Variable Rate | Fixed Rate | |||||||||||||||||||||||
| Total Maturities |
Less than 1 year |
Total | 1-5 years | More than 5 years |
Total | 1-5 years | More than 5 years | |||||||||||||||||
| Real Estate Construction |
$ | 307,726 | $ | 262,777 | $ | 6,178 | $ | 6,162 | $ | 16 | $ | 38,771 | $ | 30,842 | $ | 7,929 | ||||||||
| Commercial |
$ | 126,157 | $ | 78,479 | $ | 3,877 | $ | 3,877 | $ | — | $ | 43,801 | $ | 37,704 | $ | 6,097 | ||||||||
32
Table of Contents
While the current economic environment is challenging, the Company remains committed to originating soundly underwritten loans to qualifying borrowers within its markets. The Company is focused on providing community-based financial services and discourages the origination of portfolio loans outside of its principal trade areas. The Company maintains a policy not to originate or purchase loans from foreign entities or loans classified by regulators as highly leveraged transactions. To manage the growth of the real estate loans in the loan portfolio, facilitate asset/liability management and generate additional fee income, the Company sells a portion of conforming first mortgage residential real estate loans to the secondary market as they are originated. Union Mortgage serves as a mortgage brokerage operation, selling the majority of its loan production in the secondary market or selling loans to the Community Banks that meet the banks’ current asset/liability management needs. This venture has provided the Community Banks’ customers with enhanced mortgage products and the Company with improved efficiencies through the consolidation of this function.
Asset Quality
Industry concerns regarding asset quality and softness in commercial real estate continued throughout 2009. These issues are impacting the markets in which the Company operates, mainly by slowing real estate activity and adding to the general economic uncertainty. The risk and performance of the Company’s loan portfolio are reflective of the relatively stable markets in which it operates. While these markets have experienced slow economic activity, they remain in much better condition than the well-publicized markets in Arizona, Florida, Nevada, California and other states where the Company does not lend and does not have loan loss exposure. The Company’s loan portfolio also does not include exposure to option adjustable rate mortgage products, high loan-to-value ratio mortgages, interest only loans, subprime mortgage loans and loans with initial teaser rates. The Company does have junior lien mortgages (“second mortgages”), primarily home equity lines of credit. The Company’s second mortgage portfolio is originated within the Company’s footprint and represented approximately 1.9% of the total loan portfolio at December 31, 2009. The Company has low loss experience within this portfolio and is prompted to perform updated valuations upon identification of a borrower weakness. The sources of valuations are appraisals, broker price opinions and automated valuation models.
During the year the Company continued to experience deterioration in asset quality. While all economic indicators suggest the recession has technically ended, there could be additional softening in asset quality in the near-term, with the magnitude depending upon the potential lagging impact on commercial real estate, unemployment and the pace at which the local economy recovers. The Company sees indications that the housing markets and unemployment rate in Virginia are improving; however, the commercial real estate market may weaken further as continued job losses negatively affect both consumer spending and occupancy needs by employers. The Company’s loan portfolio has a significant concentration in real estate loans. Residential acquisition and development lending and builder/construction lending have been scaled back as housing activity across the Company’s markets has declined. While this softening negatively impacts delinquency and nonperforming asset levels, the collateralized nature of real estate loans serves to better protect the Company from loss. Necessary resources continue to be devoted to the ongoing review of the loan portfolio and the workouts of problem assets to minimize any losses to the Company. Management will continue to monitor delinquencies, risk rating changes, charge-offs, market trends and other indicators of risk in the Company’s portfolio, particularly those tied to residential and commercial real estate, and adjust the allowance for loan losses accordingly.
For the year ended December 31, 2009, net charge-offs were $13.3 million, or 0.71%, of total loans. Net charge-offs for the year included real estate loans of $7.9 million, consumer loans of $3.4 million and commercial loans of $2.0 million. At December 31, 2009, total past due loans were $29.2 million, or 1.56% of total loans, nearly flat from 1.57% a year ago.
At December 31, 2009, nonperforming assets totaled $44.9 million, a marginal increase compared to $43.4 million at September 30, 2009 and an increase of $23.3 million from December 31, 2008. The overall increases in the trailing 12 months relate principally to loans in the real estate development and housing sectors. At December 31, 2009 the coverage ratio of allowance for loan losses to nonperforming loans was 136.4%, down from 176.9% a year earlier.
33
Table of Contents
Nonperforming assets at December 31, 2009 include $22.3 million in nonperforming loans. This total includes residential real estate loans of $9.6 million, commercial and industrial loans of $5.8 million, commercial real estate loans of $2.2 million, land loans of $2.1 million, land development loans of $1.3 million and other loans totaling $1.3 million. Historically, and particularly in the current economic environment, the Company seeks to work with its customers on loan collection matters while taking appropriate actions to improve the Company’s position and minimize any losses. These loans are closely monitored and evaluated for collection with appropriate loss reserves established whenever necessary. The Company has in place a special assets loan committee, which includes the Company’s CEO, Senior Credit Officer and other senior lenders that address significant potential problem loans and develop action plans related to such assets.
Additionally, nonperforming assets also include $22.5 million in other real estate owned. This total includes land development of $10.3 million, land of $7.0 million, residential real estate of $2.6 million, commercial real estate of $1.6 million and land held for development of bank branch sites of $1.0 million. Included in land development is $8.7 million related to a residential community in the Northern Neck region of Virginia which includes developed residential lots, a golf course and undeveloped land. Foreclosed properties have been adjusted to their fair values at the time of foreclosure and any losses have been taken as loan charge-offs against the allowance for loan losses. Other real estate owned asset valuations are also evaluated at least quarterly and any necessary write down to fair value is recorded as impairment (i.e. valuation adjustment) under the caption “Gains (losses) on sales of other real estate and bank premises, net” in the Company’s Consolidated Statements of Income. The following table shows activity for the year ended December 31, 2009 related to other real estate owned (dollars in thousands):
| Beginning Balance - 12/31/2008 |
$ | 7,140 | ||
| Additions |
19,594 | |||
| Capitalized Improvements |
374 | |||
| Valuation Adjustments |
(61 | ) | ||
| Proceeds from sales |
(4,452 | ) | ||
| Losses from sales |
(86 | ) | ||
| Ending Balance - 12/31/2009 |
$ | 22,509 | ||
Approximately $643.4 million, or 34.3%, of the Company’s loan portfolio is comprised of amortizing commercial real estate loans, of which approximately 42% is owner-occupied real estate and which typically carries a lower risk of loss. While there are industry concerns over possible softening in the commercial real estate sector, the Company’s portfolio is not highly speculative or concentrated in large credits. In addition, $307.7 million of the loan portfolio is concentrated in real estate construction loans, including raw land, land development, residential lots, speculative and presold residential construction and commercial construction loans (both owner-occupied and non-owner occupied). Of this amount, $153.9 million, or 50.0%, represents land and lot loans; $64.6 million, or 21.0%, represents land development loans; $44.9 million, or 14.6%, represents speculative and presold residential construction loans and $38.4 million, or 12.5%, is commercial construction. The Company’s real estate lending is conducted within its operating footprint in markets it understands and monitors.
34
Table of Contents
The following table summarizes activity in the allowance for loan losses over the past five years ended December 31, (dollars in thousands):
| 2009 | 2008 | 2007 | 2006 | 2005 | ||||||||||||||||
| Balance, beginning of year |
$ | 25,496 | $ | 19,336 | $ | 19,148 | $ | 17,116 | $ | 16,384 | ||||||||||
| Allowance from acquired bank |
— | — | — | 785 | — | |||||||||||||||
| Loans charged-off: |
||||||||||||||||||||
| Commercial |
2,039 | 1,638 | 207 | 22 | 25 | |||||||||||||||
| Real estate |
8,702 | 18 | — | — | 6 | |||||||||||||||
| Consumer |
3,667 | 2,544 | 1,005 | 600 | 809 | |||||||||||||||
| Total loans charged-off |
14,408 | 4,200 | 1,212 | 622 | 840 | |||||||||||||||
| Recoveries: |
||||||||||||||||||||
| Commercial |
71 | 52 | 30 | 102 | 43 | |||||||||||||||
| Real estate |
807 | — | — | — | — | |||||||||||||||
| Consumer |
272 | 288 | 310 | 317 | 357 | |||||||||||||||
| Total recoveries |
1,150 | 340 | 340 | 419 | 400 | |||||||||||||||
| Net charge-offs |
13,258 | 3,860 | 872 | 203 | 440 | |||||||||||||||
| Provision for loan losses |
18,246 | 10,020 | 1,060 | 1,450 | 1,172 | |||||||||||||||
| Balance, end of year |
$ | 30,484 | $ | 25,496 | $ | 19,336 | $ | 19,148 | $ | 17,116 | ||||||||||
| Allowance for loan losses to loans |
1.63 | % | 1.36 | % | 1.11 | % | 1.24 | % | 1.26 | % | ||||||||||
| Net charge-offs to average loans |
0.71 | % | 0.21 | % | 0.05 | % | 0.01 | % | 0.03 | % | ||||||||||
The following table shows an allocation of the allowance for loan losses among loan categories based upon analysis of the loan portfolio’s composition, historical loan loss experience and other factors, as well as, the ratio of the related outstanding loan balances to total loans as of December 31, (dollars in thousands).
| 2009 | 2008 | 2007 | 2006 | 2005 | ||||||||||||||||||||||||||
| $ | % (1) | $ | % (1) | $ | % (1) | $ | % (1) | $ | % (1) | |||||||||||||||||||||
| Commercial, financial and agriculture |
$ | 7,200 | 6.7 | % | $ | 6,022 | 8.1 | % | $ | 4,567 | 8.0 | % | $ | 4,523 | 8.9 | % | $ | 4,320 | 9.3 | % | ||||||||||
| Real estate construction |
$ | 16,931 | 16.4 | % | 14,161 | 21.5 | % | 10,740 | 22.7 | % | 10,635 | 20.9 | % | 9,229 | 20.1 | % | ||||||||||||||
| Real estate mortgage |
$ | 964 | 66.0 | % | 806 | 59.3 | % | 611 | 57.3 | % | 605 | 58.2 | % | 541 | 59.7 | % | ||||||||||||||
| Consumer & other |
$ | 5,389 | 10.9 | % | 4,507 | 11.1 | % | 3,418 | 12.0 | % | 3,385 | 11.9 | % | 3,026 | 10.9 | % | ||||||||||||||
| Total |
$ | 30,484 | 100.0 | % | $ | 25,496 | 100.0 | % | $ | 19,336 | 100.0 | % | $ | 19,148 | 100.0 | % | $ | 17,116 | 100.0 | % | ||||||||||
| (1) | The percent represents the loan balance divided by total loans. |
The provision for loan losses for the year ended December 31, 2009 was $18.2 million, an increase of $8.2 million from December 31, 2008. The allowance for loan losses as a percentage of the loan portfolio was 1.63% at December 31, 2009 and 1.31% for the period ended December 31, 2008. The increase in the provision for loan losses and the current levels of the allowance for loan losses reflect specific reserves related to nonperforming loans, changes in risk rating on loans, net charge-off activity, loan growth, delinquency trends and other credit risk factors that the Company considers in assessing the adequacy of the allowance for loan losses.
35
Table of Contents
The following table presents a five-year comparison of nonperforming assets as of December 31, (dollars in thousands):
| 2009 | 2008 | 2007 | 2006 | 2005 | ||||||||||||||||
| Nonaccrual loans |
$ | 22,348 | $ | 14,412 | $ | 9,436 | $ | 10,873 | $ | 11,255 | ||||||||||
| Foreclosed properties |
21,489 | 6,511 | 217 | — | — | |||||||||||||||
| Real estate investment |
1,020 | 629 | 476 | — | — | |||||||||||||||
| Total nonperforming assets |
$ | 44,857 | $ | 21,552 | $ | 10,129 | $ | 10,873 | $ | 11,255 | ||||||||||
| Loans past due 90 days and accruing interest |
$ | 7,296 | $ | 3,082 | $ | 905 | $ | 208 | $ | 150 | ||||||||||
| Nonperforming assets to loans, foreclosed properties & real estate investments |
2.36 | % | 1.15 | % | 0.58 | % | 0.70 | % | 0.83 | % | ||||||||||
| Allowance for loan losses to nonaccrual loans |
136.41 | % | 176.91 | % | 204.92 | % | 176.11 | % | 152.07 | % | ||||||||||
Securities Available for Sale
At December 31, 2009, the Company had securities available for sale, at fair value, in the amount of $400.6 million, or 15.5% of total assets, as compared to $309.7 million, or 12.1%, of total assets as of December 31, 2008. The Company seeks to diversify its portfolio to minimize risk and to maintain a large amount of securities issued by states and political subdivisions due to the tax benefits. It also focuses on purchasing mortgage-backed securities because of the reinvestment opportunities from the cash flows and the higher yield offered from these securities. All of the Company’s mortgage-backed securities are investment grade. The investment portfolio has a high percentage of municipals and mortgage-backed securities; therefore a higher taxable equivalent yield exists on the portfolio compared to its peers. The Company does not engage in structured derivative or hedging activities. The following table sets forth a summary of the securities available for sale, at fair value as of December 31, (dollars in thousands):
| 2009 | 2008 | 2007 | |||||||
| U.S. government and agency securities |
$ | 5,763 | $ | — | $ | — | |||
| Obligations of states and political subdivisions |
124,126 | 120,257 | 112,596 | ||||||
| Corporate and other bonds |
15,799 | 12,136 | 15,996 | ||||||
| Mortgage-backed securities |
236,005 | 160,531 | 136,220 | ||||||
| Federal Reserve Bank stock |
3,683 | 3,383 | 3,337 | ||||||
| Federal Home Loan Bank stock |
14,958 | 13,171 | 13,800 | ||||||
| Other securities |
257 | 233 | 750 | ||||||
| Total securities available for sale, at fair value |
$ | 400,591 | $ | 309,711 | $ | 282,699 | |||
During each quarter and at year end the Company conducts an assessment of the securities portfolio for other-than-temporary-impairment (“OTTI”) consideration. The assessment considers factors such as external credit ratings, delinquency coverage ratios, market price, management’s judgment, expectations of future performance and relevant industry research and analysis. Based on the assessment and in accordance with the revised guidance, no OTTI was recognized at December 31, 2009. The Company monitors the portfolio, which is subject to liquidity needs, market rate changes and credit risk changes, to see if adjustments are needed. The primary cause of temporary impairments was the increase in spreads over comparable Treasury bonds. The Company did not own any the Fannie Mae or Freddie Mac preferred stock on which many institutions incurred significant writedowns.
Expected maturities may differ from contractual maturities because borrowers may have the right to call or prepay obligations with or without call or prepayment penalties.
36
Table of Contents
The following table summarizes the contractual maturity of securities available for sale, at fair value and their weighted average yields as of December 31, 2009 (dollars in thousands):
| 1 Year or Less | 1 - 5 Years | 5 - 10 Years | Over 10 Years and Equity Securities |
Total | ||||||||||||||||
| U.S. government and agency securities: |
||||||||||||||||||||
| Amortized cost |
$ | — | $ | 5,515 | $ | — | $ | — | $ | 5,515 | ||||||||||
| Fair value |
— | 5,763 | — | — | 5,763 | |||||||||||||||
| Weighted average yield (1) |
— | 3.88 | % | — | — | 3.88 | % | |||||||||||||
| Mortgage backed securities: |
||||||||||||||||||||
| Amortized cost |
$ | 350 | $ | 29,361 | $ | 59,207 | $ | 139,849 | $ | 228,767 | ||||||||||
| Fair value |
353 | 30,292 | 61,501 | 143,859 | 236,005 | |||||||||||||||
| Weighted average yield (1) |
3.91 | % | 4.30 | % | 4.24 | % | 4.20 | % | 4.22 | % | ||||||||||
| Obligations of states and political subdivisions: |
||||||||||||||||||||
| Amortized cost |
$ | 380 | $ | 14,475 | $ | 26,272 | $ | 82,446 | $ | 123,573 | ||||||||||
| Fair value |
383 | 14,726 | 27,055 | 81,962 | 124,126 | |||||||||||||||
| Weighted average yield (1) |
5.29 | % | 4.66 | % | 4.79 | % | 4.49 | % | 4.58 | % | ||||||||||
| Other securities: |
||||||||||||||||||||
| Amortized cost |
$ | — | $ | 3,020 | $ | 2,063 | $ | 30,739 | $ | 35,822 | ||||||||||
| Fair value |
— | 3,018 | 2,008 | 29,672 | 34,698 | |||||||||||||||
| Weighted average yield (1) |
— | 5.60 | % | 4.74 | % | 5.69 | % | 5.63 | % | |||||||||||
| Total securities available for sale: |
||||||||||||||||||||
| Amortized cost |
$ | 730 | $ | 52,371 | $ | 87,542 | $ | 253,034 | $ | 393,677 | ||||||||||
| Fair value |
736 | 53,799 | 90,564 | 255,492 | 400,591 | |||||||||||||||
| Weighted average yield (1) |
4.63 | % | 4.43 | % | 4.41 | % | 4.47 | % | 4.46 | % | ||||||||||
| (1) | Yields on tax-exempt securities have been computed on a tax-equivalent basis. |
Deposits
As of December 31, 2009, total deposits were $1.9 billion, unchanged from December 31, 2008. Total interest-bearing deposits consist principally of certificates of deposit and money market account balances. Total certificates of deposit and money market accounts were $856.9 million and $446.9 million, respectively, or 80.3% of total interest-bearing deposits. Money market account balances increased approximately $85.8 million, from $361.1 million at December 31, 2008, principally as a result of the Company’s successful marketing campaign targeting this product. Additionally, the Company did not reissue brokered certificates of deposit. Brokered certificates of deposit were zero and $66.7 million at December 31, 2009 and 2008, respectively.
The average deposits and rates paid for the past three years and maturities of certificates of deposit of $100,000 and over as of December 31 are as follows (dollars in thousands):
| 2009 | 2008 | 2007 | ||||||||||||||||||
| Amount | Rate | Amount | Rate | Amount | Rate | |||||||||||||||
| Noninterest-bearing demand deposits |
$ | 289,769 | $ | 272,764 | $ | 283,877 | ||||||||||||||
| Interest-bearing deposits: |
||||||||||||||||||||
| NOW accounts |
201,520 | 0.16 | % | 218,349 | 0.62 | % | 206,748 | 0.64 | % | |||||||||||
| Money market accounts |
429,501 | 1.84 | % | 238,540 | 2.39 | % | 158,461 | 2.34 | % | |||||||||||
| Savings accounts |
99,914 | 0.38 | % | 100,782 | 0.58 | % | 104,507 | 0.78 | % | |||||||||||
| Time deposits of $100,000 and over |
447,659 | 3.36 | % | 435,807 | 3.98 | % | 446,662 | 4.93 | % | |||||||||||
| Brokered CDs |
8,985 | 2.75 | % | 57,100 | 3.59 | % | — | 0.00 | % | |||||||||||
| Other time deposits |
492,186 | 3.16 | % | 442,491 | 3.90 | % | 451,224 | 4.51 | % | |||||||||||
| Total interest-bearing |
1,679,765 | 2.35 | % | 1,493,069 | 2.97 | % | 1,367,602 | 3.53 | % | |||||||||||
| Total average deposits |
$ | 1,969,533 | $ | 1,765,833 | $ | 1,651,478 | ||||||||||||||
| Within 3 Months |
3 - 6 Months | 6 - 12 Months | Over 12 Months |
Total | Percent Of Total Deposits |
|||||||||||||||
| Maturities of time deposits of $100,000 and over |
$ | 89,536 | $ | 46,676 | $ | 105,697 | $ | 165,985 | $ | 407,894 | 21.28 | % | ||||||||
37
Table of Contents
Capital Resources
Capital resources represent funds, earned or obtained, over which financial institutions can exercise greater or longer control in comparison with deposits and borrowed funds. The adequacy of the Company’s capital is reviewed by management on an ongoing basis with reference to size, composition, and quality of the Company’s resources and consistency with regulatory requirements and industry standards. Management seeks to maintain a capital structure that will assure an adequate level of capital to support anticipated asset growth and to absorb potential losses, yet allow management to effectively leverage its capital to maximize return to shareholders.
The Federal Reserve, along with the OCC and the FDIC, has adopted capital guidelines to supplement the existing definitions of capital for regulatory purposes and to establish minimum capital standards. Specifically, the guidelines categorize assets and off-balance sheet items into four risk-weighted categories. The minimum ratio of qualifying total assets is 8.0%, of which 4.0% must be Tier 1 capital, consisting of common equity, retained earnings and a limited amount of perpetual preferred stock, less certain intangible items. The Company had a ratio of total capital to risk-weighted assets of 14.70% and 14.56% on December 31, 2009 and 2008, respectively. The Company’s ratio of Tier 1 capital to risk-weighted assets was 13.45% and 13.31% at December 31, 2009 and 2008, respectively, allowing the Company to meet the definition of “well-capitalized” for regulatory purposes. Both of these ratios exceeded the fully phased-in capital requirements in 2009 and 2008. The Company’s equity to asset ratio at December 31, 2009, 2008 and 2007 were 10.90%, 10.73% and 9.22%, respectively.
In connection with two bank acquisitions, Prosperity and Guaranty, the Company has issued trust preferred capital notes to fund the cash portion of those acquisitions, collectively totaling $58.5 million. The total of the trust preferred capital notes currently qualify for Tier 1 capital of the Company for regulatory purposes. The Acquired Bank Branches were financed through normal operations.
On December 19, 2008, the Company entered into a Letter Agreement (the “Purchase Agreement”) with Treasury, pursuant to which it issued 59,000 shares of the Company’s Fixed Rate Cumulative Perpetual Preferred Stock, Series A (the “Preferred Stock”) for $59 million. The issuance was made pursuant to the Treasury’s Capital Purchase Program under the Troubled Asset Relief Program. In November 2009, the Company redeemed the Preferred Stock, by repaying, with accumulated dividends, the $59 million it received in December 2008. Additionally, in December 2009, the Company entered into a Warrant Repurchase Letter Agreement (“Warrant Repurchase”) with the Treasury to repurchase a warrant to purchase 211,318 shares of the Company’s common stock that was issued in connection with the Company’s sale of Preferred Stock. As a result of the Warrant Repurchase, the Company has no securities issued or outstanding to the Treasury and was no longer participating in the Treasury’s CPP as of November 18, 2009.
38
Table of Contents
The following summarizes the Company’s regulatory capital and related ratios over the past three years ended December 31, (dollars in thousands):
| 2009 | 2008 | 2007 | ||||||||||
| Tier 1 capital: |
||||||||||||
| Preferred stock—par value |
$ | — | $ | 590 | $ | — | ||||||
| Common stock—par value |
24,462 | 18,055 | 17,879 | |||||||||
| Surplus |
98,136 | 101,719 | 40,758 | |||||||||
| Retained earnings |
155,047 | 155,140 | 152,238 | |||||||||
| Warrant |
— | 2,808 | — | |||||||||
| Discount on preferred stock |
— | (2,790 | ) | — | ||||||||
| Total equity |
277,645 | 275,522 | 210,875 | |||||||||
| Plus: qualifying trust preferred capital notes |
58,500 | 58,500 | 58,500 | |||||||||
| Less: core deposit intangibles/goodwill/unrealized gain(loss) on AFS |
63,797 | 65,896 | 68,024 | |||||||||
| Total Tier 1 capital |
272,348 | 268,126 | 201,351 | |||||||||
| Tier 2 capital: |
||||||||||||
| Allowance for loan losses |
25,374 | 25,191 | 19,336 | |||||||||
| Total Tier 2 capital |
25,374 | 25,191 | 19,336 | |||||||||
| Total risk-based capital |
$ | 297,722 | $ | 293,317 | $ | 220,687 | ||||||
| Risk-weighted assets |
$ | 2,024,824 | $ | 2,015,008 | $ | 1,890,569 | ||||||
| Capital ratios: |
||||||||||||
| Tier 1 risk-based capital ratio |
13.45 | % | 13.31 | % | 10.65 | % | ||||||
| Total risk-based capital ratio |
14.70 | % | 14.56 | % | 11.67 | % | ||||||
| Leverage ratio (Tier 1 capital to average adjusted assets) |
10.86 | % | 11.14 | % | 9.20 | % | ||||||
| Equity to total assets |
10.90 | % | 10.73 | % | 9.22 | % | ||||||
Commitments and off-balance sheet obligations
In the normal course of business, the Company is a party to financial instruments with off-balance sheet risk to meet the financing needs of its customers and to reduce its own exposure to fluctuations in interest rates. These financial instruments include commitments to extend credit and standby letters of credit. These instruments involve elements of credit and interest rate risk in excess of the amount recognized in the consolidated balance sheets. The contractual amounts of these instruments reflect the extent of the Company’s involvement in particular classes of financial instruments. For more information pertaining to these commitments, reference Note 11 “Financial Instruments with Off-Balance Sheet Risk” in the “Notes to the Consolidated Financial Statements.”
The Company’s exposure to credit loss in the event of nonperformance by the other party to the financial instruments for commitments to extend credit and letters of credit written is represented by the contractual amount of these instruments. The Company uses the same credit policies in making commitments and conditional obligations as it does for on-balance sheet instruments. Unless noted otherwise, the Company does not require collateral or other security to support off-balance sheet financial instruments with credit risk.
At December 31, 2009, Union Mortgage had rate lock commitments to originate mortgage loans amounting to $111.1 million and loans held for sale of $54.3 million. Union Mortgage has entered into corresponding mandatory commitments on a best-efforts basis to sell loans on a servicing-released basis totaling approximately $165.4 million. These commitments to sell loans are designed to eliminate the mortgage company’s exposure to fluctuations in interest rates in connection with rate lock commitments and loans held for sale.
39
Table of Contents
The following table represents the Company’s other commitments with balance sheet or off-balance sheet risk as of December 31, 2009 (dollars in thousands):
| Amount | |||
| Commitments with off-balance sheet risk: |
|||
| Commitments to extend credit(1) |
$ | 462,541 | |
| Standby letters of credit |
25,449 | ||
| Commitments to purchase securities |
— | ||
| Mortgage loan rate lock commitments |
111,123 | ||
| Total commitments with off-balance sheet risk |
599,113 | ||
| Commitments with balance sheet risk: |
|||
| Loans held for sale |
54,280 | ||
| Total commitments with balance sheet risk |
54,280 | ||
| Total other commitments |
$ | 653,393 | |
| (1) | Includes unfunded overdraft protection. |
Liquidity
Liquidity represents an institution’s ability to meet present and future financial obligations through either the sale or maturity of existing assets or the acquisition of additional funds through liability management. Liquid assets include cash, interest-bearing deposits with banks, money market investments, Federal funds sold, securities available for sale, loans held for sale and loans maturing or re-pricing within one year. Additional sources of liquidity available to the Company include its capacity to borrow additional funds when necessary through Federal Funds lines with several correspondent banks, a line of credit with the FHLB and a corporate line of credit with a large correspondent bank. The Company completed a follow-on equity raise on September 16, 2009, which generated cash and capital of approximately $58.8 million, net of underwriting discounts, commissions and estimated offering expenses from the issuance of 4,725,000 shares of common stock at a price of $13.25 per share. It is anticipated that the proceeds of this offering will be used for general corporate purposes, including organic and opportunistic acquisition-based growth. During the fourth quarter of 2009, the Company redeemed the Preferred Stock and warrant issued to the Treasury by repaying $59 million received in December 2008 under the Capital Purchase Program. Management considers the Company’s overall liquidity to be sufficient to satisfy its depositors’ requirements and to meet its customers’ credit needs.
At December 31, 2009, cash and cash equivalents and securities classified as available for sale comprised 17.3% of total assets, compared to 18.0% at December 31, 2008. Asset liquidity is also provided by managing loan and securities maturities and cash flows.
Additional sources of liquidity available to the Company include its capacity to borrow additional funds when necessary. The Community Banks maintain Federal funds lines with several regional banks totaling $92.0 million as of December 31, 2009. Under these lines $25.2 million was outstanding at December 31, 2009. The Company had outstanding borrowings pursuant to securities sold under agreements to repurchase transactions with a maturity of one day of $50.6 million as of December 31, 2009 compared to $68.3 million as of December 31, 2008. Lastly, the Company had a collateral dependent line of credit with the FHLB for up to $755.5 million as of December 31, 2009. There was approximately $230 million outstanding under this line at December 31, 2009.
40
Table of Contents
NON GAAP MEASURES
Beginning January 1, 2009, business combinations must be accounted for under ASC 805, Business Combinations, using the acquisition method of accounting. The Company has accounted for its previous business combinations under the purchase method of accounting. The acquisitions of the Acquired Bank Branches, Prosperity and Guaranty are the three business combinations accounted for using the purchase method of accounting. At December 31, 2009, core deposit intangible assets and goodwill totaled $7.7 million and $56.5, respectively, compared to $9.6 million and $56.5 million, respectively, in 2008.
In reporting the results of 2009 and 2008, the Company has provided supplemental performance measures on an operating or tangible basis. Such measures exclude amortization expense related to intangible assets, such as core deposit intangibles. The Company believes these measures are useful to investors as they exclude non-operating adjustments resulting from acquisition activity and allow investors to see the combined economic results of the organization. Cash basis operating earnings per share was $0.63 for the year ended December 31, 2009 compared to $1.16 in 2008. Cash basis return on average tangible common equity and assets for the year ended December 31, 2009 was 5.54% and 0.38%, respectively, compared to 10.69% and 0.68%, respectively, in 2008.
These measures are a supplement to GAAP used to prepare the Company’s financial statements and should not be viewed as a substitute for GAAP measures. In addition, the Company’s non-GAAP measures may not be comparable to non-GAAP measures of other companies. The following table reconciles these non-GAAP measures from their respective GAAP basis measures for the years ended December 31, (dollars in thousands):
| 2009 | 2008 | |||||||
| Net income |
$ | 8,360 | $ | 14,514 | ||||
| Plus: core deposit intangible amortization, net of tax |
1,251 | 1,259 | ||||||
| Cash basis operating earnings |
9,611 | 15,773 | ||||||
| Average assets |
2,578,808 | 2,379,403 | ||||||
| Less: average goodwill |
56,474 | 56,474 | ||||||
| Less: average core deposit intangibles |
8,639 | 10,568 | ||||||
| Average tangible assets |
2,513,695 | 2,312,361 | ||||||
| Average equity |
288,243 | 216,622 | ||||||
| Less: average goodwill |
56,474 | 56,474 | ||||||
| Less: average core deposit intangibles |
8,639 | 10,568 | ||||||
| Less: average preferred equity |
49,512 | 1,993 | ||||||
| Average tangible common equity |
$ | 173,618 | $ | 147,587 | ||||
| Weighted average shares outstanding, diluted |
15,201,993 | 13,542,948 | ||||||
| Cash basis earnings per share, diluted |
$ | 0.63 | $ | 1.16 | ||||
| Cash basis return on average tangible assets |
0.38 | % | 0.68 | % | ||||
| Cash basis return on average tangible common equity |
5.54 | % | 10.69 | % | ||||
41
Table of Contents
QUARTERLY RESULTS
The following table presents the Company’s quarterly performance for the years ended December 31, 2009 and 2008 (dollars in thousands, except per share amounts):
| Quarter | |||||||||||||||||
| First | Second | Third | Fourth | Total (1) | |||||||||||||
| For the Year 2009 |
|||||||||||||||||
| Interest and dividend income |
$ | 31,364 | $ | 31,977 | $ | 32,502 | $ | 32,744 | $ | 128,587 | |||||||
| Interest expense |
13,650 | 13,273 | 11,685 | 10,163 | 48,771 | ||||||||||||
| Net interest income |
17,714 | 18,704 | 20,817 | 22,581 | 79,816 | ||||||||||||
| Provision for loan losses |
3,130 | 4,855 | 4,517 | 5,744 | 18,246 | ||||||||||||
| Net interest income after provision for loan losses |
14,584 | 13,849 | 16,300 | 16,837 | 61,570 | ||||||||||||
| Noninterest income |
7,333 | 9,278 | 7,911 | 8,445 | 32,967 | ||||||||||||
| Noninterest expenses |
19,927 | 22,351 | 21,105 | 21,904 | 85,287 | ||||||||||||
| Income before income taxes |
1,990 | 776 | 3,106 | 3,378 | 9,250 | ||||||||||||
| Income tax expense (benefit) |
237 | (177 | ) | 301 | 529 | 890 | |||||||||||
| Net income |
$ | 1,753 | $ | 953 | $ | 2,805 | $ | 2,849 | $ | 8,360 | |||||||
| Dividends paid and accumulated on preferred stock |
738 | 738 | 737 | 483 | 2,696 | ||||||||||||
| Accretion of discount on preferred stock |
123 | 124 | 125 | 2,418 | 2,790 | ||||||||||||
| Net income (loss) available to common shareholders |
$ | 892 | $ | 91 | $ | 1,943 | $ | (52 | ) | $ | 2,874 | ||||||
| Earnings per share, basic |
$ | 0.07 | $ | 0.01 | $ | 0.13 | $ | — | $ | 0.19 | |||||||
| Earnings per share, diluted |
$ | 0.07 | $ | 0.01 | $ | 0.13 | $ | — | $ | 0.19 | |||||||
| For the Year 2008 |
|||||||||||||||||
| Interest and dividend income |
$ | 34,870 | $ | 33,308 | $ | 34,012 | $ | 32,905 | $ | 135,095 | |||||||
| Interest expense |
15,745 | 13,480 | 13,758 | 14,239 | 57,222 | ||||||||||||
| Net interest income |
19,125 | 19,828 | 20,254 | 18,666 | 77,873 | ||||||||||||
| Provision for loan losses |
1,600 | 1,676 | 3,667 | 3,077 | 10,020 | ||||||||||||
| Net interest income after provision for loan losses |
17,525 | 18,152 | 16,587 | 15,589 | 67,853 | ||||||||||||
| Noninterest income |
7,348 | 7,656 | 9,113 | 6,438 | 30,555 | ||||||||||||
| Noninterest expenses |
19,933 | 20,034 | 20,109 | 19,560 | 79,636 | ||||||||||||
| Income before income taxes |
4,940 | 5,774 | 5,591 | 2,467 | 18,772 | ||||||||||||
| Income tax expense |
1,288 | 1,441 | 1,336 | 193 | 4,258 | ||||||||||||
| Net income |
$ | 3,652 | $ | 4,333 | $ | 4,255 | $ | 2,274 | $ | 14,514 | |||||||
| Dividends paid and accumulated on preferred stock |
— | — | — | — | — | ||||||||||||
| Accretion of discount on preferred stock |
— | — | — | 18 | 18 | ||||||||||||
| Net income available to common shareholders |
$ | 3,652 | $ | 4,333 | $ | 4,255 | $ | 2,256 | $ | 14,496 | |||||||
| Earnings per share, basic |
$ | 0.27 | $ | 0.32 | $ | 0.32 | $ | 0.17 | $ | 1.08 | |||||||
| Earnings per share, diluted |
$ | 0.27 | $ | 0.32 | $ | 0.31 | $ | 0.17 | $ | 1.07 | |||||||
| (1) | The sum of quarterly financial information may vary from year-to-date financial information due to rounding. |
ITEM 7A. – QUANTITATIVE AND QUALITATIVE DISCLOSURES ABOUT MARKET RISK.
This information is incorporated herein by reference from Item 7 “Management’s Discussion and Analysis of Financial Condition and Results of Operations” of this Form 10-K.
42
Table of Contents
ITEM 8. – FINANCIAL STATEMENTS AND SUPPLEMENTARY DATA.

REPORT OF INDEPENDENT REGISTERED PUBLIC ACCOUNTING FIRM
To the Board of Directors and Stockholders
Union Bankshares Corporation
Bowling Green, Virginia
We have audited the accompanying consolidated balance sheets of Union Bankshares Corporation and subsidiaries as of December 31, 2009 and 2008, and the related consolidated statements of income, changes in stockholders’ equity, and cash flows for each of the three years in the period ended December 31, 2009. These financial statements are the responsibility of the Company’s management. Our responsibility is to express an opinion on these financial statements based on our audits.
We conducted our audits in accordance with the standards of the Public Company Accounting Oversight Board (United States). Those standards require that we plan and perform the audit to obtain reasonable assurance about whether the financial statements are free of material misstatement. An audit includes examining, on a test basis, evidence supporting the amounts and disclosures in the financial statements. An audit also includes assessing the accounting principles used and significant estimates made by management, as well as evaluating the overall financial statement presentation. We believe that our audits provide a reasonable basis for our opinion.
In our opinion, the consolidated financial statements referred to above present fairly, in all material respects, the financial position of Union Bankshares Corporation and subsidiaries as of December 31, 2009 and 2008, and the results of their operations and their cash flows for each of the three years in the period ended December 31, 2009, in conformity with U.S. generally accepted accounting principles.
We have also audited, in accordance with the standards of the Public Company Accounting Oversight Board (United States), Union Bankshares Corporation and subsidiaries’ internal control over financial reporting as of December 31, 2009, based on criteria established in Internal Control — Integrated Framework issued by the Committee of Sponsoring Organizations of the Treadway Commission, and our report dated March 5, 2010 expressed an unqualified opinion on the effectiveness of Union Bankshares Corporation and subsidiaries’ internal control over financial reporting.

Winchester, Virginia
March 16, 2010
43
Table of Contents
REPORT OF INDEPENDENT REGISTERED PUBLIC ACCOUNTING FIRM
To the Board of Directors and Stockholders
Union Bankshares Corporation
Bowling Green, Virginia
We have audited Union Bankshares Corporation and subsidiaries’ internal control over financial reporting as of December 31, 2009, based on criteria established in Internal Control — Integrated Framework issued by the Committee of Sponsoring Organizations of the Treadway Commission. Union Bankshares Corporation and subsidiaries’ management is responsible for maintaining effective internal control over financial reporting and for its assessment of the effectiveness of internal control over financial reporting included in the accompanying Management’s Report on Internal Control over Financial Reporting. Our responsibility is to express an opinion on the Company’s internal control over financial reporting based on our audit.
We conducted our audit in accordance with the standards of the Public Company Accounting Oversight Board (United States). Those standards require that we plan and perform the audit to obtain reasonable assurance about whether effective internal control over financial reporting was maintained in all material respects. Our audit included obtaining an understanding of internal control over financial reporting, assessing the risk that a material weakness exists, and testing and evaluating the design and operating effectiveness of internal control based on the assessed risk. Our audit also included performing such other procedures as we considered necessary in the circumstances. We believe that our audit provides a reasonable basis for our opinion.
A company’s internal control over financial reporting is a process designed to provide reasonable assurance regarding the reliability of financial reporting and the preparation of financial statements for external purposes in accordance with generally accepted accounting principles. A company’s internal control over financial reporting includes those policies and procedures that (a) pertain to the maintenance of records that, in reasonable detail, accurately and fairly reflect the transactions and dispositions of the assets of the company; (b) provide reasonable assurance that transactions are recorded as necessary to permit preparation of financial statements in accordance with generally accepted accounting principles, and that receipts and expenditures of the company are being made only in accordance with authorizations of management and directors of the company; and (c) provide reasonable assurance regarding prevention or timely detection of unauthorized acquisition, use, or disposition of the company’s assets that could have a material effect on the financial statements.
Because of its inherent limitations, internal control over financial reporting may not prevent or detect misstatements. Also, projections of any evaluation of effectiveness to future periods are subject to the risk that controls may become inadequate because of changes in conditions, or that the degree of compliance with the policies or procedures may deteriorate.
44
Table of Contents
In our opinion, Union Bankshares Corporation and subsidiaries maintained, in all material respects, effective internal control over financial reporting as of December 31, 2009, based on criteria established in Internal Control — Integrated Framework issued by the Committee of Sponsoring Organizations of the Treadway Commission.
We have also audited, in accordance with the standards of the Public Company Accounting Oversight Board (United States), the consolidated balance sheets as of December 31, 2009 and 2008, and the related consolidated statements of income, changes in stockholders’ equity and cash flows for each of the three years in the period ended December 31, 2009 of Union Bankshares Corporation and subsidiaries and our report dated March 5, 2010 expressed an unqualified opinion.

Winchester, Virginia
March 16, 2010
45
Table of Contents
UNION BANKSHARES CORPORATION AND SUBSIDIARIES
CONSOLIDATED BALANCE SHEETS
AS OF DECEMBER 31, 2009 AND 2008
(Dollars in thousands, except share amounts)
| 2009 | 2008 | ||||||
| ASSETS |
|||||||
| Cash and cash equivalents: |
|||||||
| Cash and due from banks |
$ | 38,725 | $ | 144,625 | |||
| Interest-bearing deposits in other banks |
4,106 | 903 | |||||
| Money market investments |
127 | 122 | |||||
| Other interest-bearing deposits |
2,598 | 2,598 | |||||
| Federal funds sold |
355 | 289 | |||||
| Total cash and cash equivalents |
45,911 | 148,537 | |||||
| Securities available for sale, at fair value |
400,591 | 309,711 | |||||
| Loans held for sale |
54,280 | 29,424 | |||||
| Loans, net of unearned income |
1,874,224 | 1,874,088 | |||||
| Less allowance for loan losses |
30,484 | 25,496 | |||||
| Net loans |
1,843,740 | 1,848,592 | |||||
| Bank premises and equipment, net |
78,722 | 77,425 | |||||
| Other real estate owned |
22,509 | 7,140 | |||||
| Core deposit intangibles, net |
7,690 | 9,613 | |||||
| Goodwill |
56,474 | 56,474 | |||||
| Other assets |
77,355 | 65,016 | |||||
| Total assets |
$ | 2,587,272 | $ | 2,551,932 | |||
| LIABILITIES |
|||||||
| Noninterest-bearing demand deposits |
$ | 294,222 | $ | 274,829 | |||
| Interest-bearing deposits: |
|||||||
| NOW accounts |
215,327 | 201,317 | |||||
| Money market accounts |
446,980 | 361,138 | |||||
| Savings accounts |
102,852 | 93,559 | |||||
| Time deposits of $100,000 and over |
407,894 | 452,297 | |||||
| Other time deposits |
449,089 | 477,150 | |||||
| Brokered time deposits |
— | 66,709 | |||||
| Total interest-bearing deposits |
1,622,142 | 1,652,170 | |||||
| Total deposits |
1,916,364 | 1,926,999 | |||||
| Securities sold under agreements to repurchase |
50,550 | 68,282 | |||||
| Other short-term borrowings |
115,201 | 55,000 | |||||
| Long-term borrowings |
140,000 | 150,000 | |||||
| Trust preferred capital notes |
60,310 | 60,310 | |||||
| Other liabilities |
22,759 | 17,543 | |||||
| Total liabilities |
2,305,184 | 2,278,134 | |||||
| Commitments and contingencies |
|||||||
| STOCKHOLDERS’ EQUITY |
|||||||
| Preferred stock, $10.00 par value, shares authorized 59,000; issued and outstanding, none at December 31, 2009 and 59,000 shares at December 31, 2008 |
— | 590 | |||||
| Common stock, $1.33 par value, shares authorized 36,000,000; issued and outstanding, 18,419,567 shares at December 31, 2009 and 13,570,970 shares at December 31, 2008 |
24,462 | 18,055 | |||||
| Surplus |
98,136 | 101,719 | |||||
| Retained earnings |
155,047 | 155,140 | |||||
| Warrant |
— | 2,808 | |||||
| Discount on preferred stock |
— | (2,790 | ) | ||||
| Accumulated other comprehensive income (loss) |
4,443 | (1,724 | ) | ||||
| Total stockholders’ equity |
282,088 | 273,798 | |||||
| Total liabilities and stockholders’ equity |
$ | 2,587,272 | $ | 2,551,932 | |||
See accompanying notes to consolidated financial statements.
46
Table of Contents
UNION BANKSHARES CORPORATION AND SUBSIDIARIES
CONSOLIDATED STATEMENTS OF INCOME
YEARS ENDED DECEMBER 31, 2009, 2008 AND 2007
(Dollars in thousands, except per share amounts)
| 2009 | 2008 | 2007 | ||||||||
| Interest and dividend income: |
||||||||||
| Interest and fees on loans |
$ | 112,316 | $ | 120,642 | $ | 126,514 | ||||
| Interest on Federal funds sold |
1 | 98 | 614 | |||||||
| Interest on deposits in other banks |
135 | 39 | 57 | |||||||
| Interest on money market investments |
— | 1 | 4 | |||||||
| Interest on other interest-bearing deposits |
— | 49 | 135 | |||||||
| Interest and dividends on securities: |
||||||||||
| Taxable |
10,606 | 9,068 | 8,945 | |||||||
| Nontaxable |
5,529 | 5,198 | 4,727 | |||||||
| Total interest and dividend income |
128,587 | 135,095 | 140,996 | |||||||
| Interest expense: |
||||||||||
| Interest on deposits |
39,451 | 44,298 | 48,234 | |||||||
| Interest on Federal funds purchased |
27 | 380 | 1,224 | |||||||
| Interest on short-term borrowings |
2,261 | 4,407 | 6,618 | |||||||
| Interest on long-term borrowings |
7,032 | 8,137 | 9,175 | |||||||
| Total interest expense |
48,771 | 57,222 | 65,251 | |||||||
| Net interest income |
79,816 | 77,873 | 75,745 | |||||||
| Provision for loan losses |
18,246 | 10,020 | 1,060 | |||||||
| Net interest income after provision for loan losses |
61,570 | 67,853 | 74,685 | |||||||
| Noninterest income: |
||||||||||
| Service charges on deposit accounts |
8,252 | 9,154 | 7,793 | |||||||
| Other service charges, commissions and fees |
6,003 | 6,637 | 6,157 | |||||||
| Gains on securities transactions, net |
163 | 29 | 586 | |||||||
| Gains on sales of loans |
16,654 | 11,120 | 8,817 | |||||||
| Gains (losses) on sales of other real estate owned and bank premises, net |
(37 | ) | 1,826 | 187 | ||||||
| Other operating income |
1,932 | 1,789 | 1,565 | |||||||
| Total noninterest income |
32,967 | 30,555 | 25,105 | |||||||
| Noninterest expenses: |
||||||||||
| Salaries and benefits |
43,315 | 43,126 | 38,765 | |||||||
| Occupancy expenses |
7,051 | 6,960 | 6,085 | |||||||
| Furniture and equipment expenses |
4,573 | 4,988 | 4,816 | |||||||
| Other operating expenses |
30,348 | 24,562 | 23,884 | |||||||
| Total noninterest expenses |
85,287 | 79,636 | 73,550 | |||||||
| Income before income taxes |
9,250 | 18,772 | 26,240 | |||||||
| Income tax expense |
890 | 4,258 | 6,484 | |||||||
| Net income |
$ | 8,360 | $ | 14,514 | $ | 19,756 | ||||
| Dividends paid on preferred stock |
2,696 | — | — | |||||||
| Amortization of discount on preferred stock |
2,790 | 18 | — | |||||||
| Net income available to common stockholders |
$ | 2,874 | $ | 14,496 | $ | 19,756 | ||||
| Earnings per common share, basic |
$ | 0.19 | $ | 1.08 | $ | 1.48 | ||||
| Earnings per common share, diluted |
$ | 0.19 | $ | 1.07 | $ | 1.47 | ||||
See accompanying notes to consolidated financial statements.
47
Table of Contents
UNION BANKSHARES CORPORATION AND SUBSIDIARIES
CONSOLIDATED STATEMENTS OF CHANGES IN STOCKHOLDERS’ EQUITY
YEARS ENDED DECEMBER 31, 2009, 2008 AND 2007
(Dollars in thousands, except share amounts)
| Preferred Stock |
Common Stock |
Surplus | Retained Earnings |
Warrant | Discount on Preferred Stock |
Accumulated Other Comprehensive Income |
Comprehensive Income (Loss) |
Total | ||||||||||||||||||||||||||||
| Balance - December 31, 2006 |
$ | — | $ | 17,716 | $ | 38,047 | $ | 142,168 | $ | — | $ | — | $ | 1,485 | $ | 199,416 | ||||||||||||||||||||
| Comprehensive income: |
||||||||||||||||||||||||||||||||||||
| Net income |
19,756 | $ | 19,756 | 19,756 | ||||||||||||||||||||||||||||||||
| Unrealized holding gains arising during the period (net of tax, $55) |
103 | |||||||||||||||||||||||||||||||||||
| Reclassification adjustment for gains included in net income (net of tax, $205) |
(381 | ) | ||||||||||||||||||||||||||||||||||
| Other comprehensive loss (net of tax, $150) |
(278 | ) | (278 | ) | (278 | ) | ||||||||||||||||||||||||||||||
| Total comprehensive income |
$ | 19,478 | ||||||||||||||||||||||||||||||||||
| Cash dividends common stock ($.73 per share) |
(9,686 | ) | (9,686 | ) | ||||||||||||||||||||||||||||||||
| Tax benefit from exercise of stock awards |
22 | 22 | ||||||||||||||||||||||||||||||||||
| Issuance of common stock under Dividend Reinvestment Plan (47,769 shares) |
64 | 994 | 1,058 | |||||||||||||||||||||||||||||||||
| Issuance of common stock under Incentive Stock Option Plan (46,743 shares) |
62 | 582 | 644 | |||||||||||||||||||||||||||||||||
| Issuance of common stock for services rendered (27,933 shares) |
37 | 568 | 605 | |||||||||||||||||||||||||||||||||
| Stock-based compensation expense |
545 | 545 | ||||||||||||||||||||||||||||||||||
| Balance - December 31, 2007 |
— | 17,879 | 40,758 | 152,238 | — | — | 1,207 | 212,082 | ||||||||||||||||||||||||||||
| Comprehensive income: |
||||||||||||||||||||||||||||||||||||
| Net income |
14,514 | $ | 14,514 | 14,514 | ||||||||||||||||||||||||||||||||
| Unrealized holding losses arising during the period (net of taxes, $1,568) |
(2,912 | ) | ||||||||||||||||||||||||||||||||||
| Reclassification adjustment for gains included in net income (net of taxes, $10) |
(19 | ) | ||||||||||||||||||||||||||||||||||
| Other comprehensive loss (net of taxes, $1,578) |
(2,931 | ) | (2,931 | ) | (2,931 | ) | ||||||||||||||||||||||||||||||
| Total comprehensive income |
$ | 11,583 | ||||||||||||||||||||||||||||||||||
| Cash dividends common stock ($.74 per share) |
(9,990 | ) | (9,990 | ) | ||||||||||||||||||||||||||||||||
| Tax benefit from exercise of stock awards |
58 | 58 | ||||||||||||||||||||||||||||||||||
| Cumulative-effect of a change in accounting principle |
(1,604 | ) | (1,604 | ) | ||||||||||||||||||||||||||||||||
| Issuance of preferred stock |
590 | 58,334 | 2,808 | (2,808 | ) | 58,924 | ||||||||||||||||||||||||||||||
| Amortization of preferred stock discount |
(18 | ) | 18 | — | ||||||||||||||||||||||||||||||||
| Stock purchased under stock repurchase plan (15,000 shares) |
(20 | ) | (234 | ) | (254 | ) | ||||||||||||||||||||||||||||||
| Issuance of common stock under Dividend Reinvestment Plan (57,747 shares) |
78 | 1,010 | 1,088 | |||||||||||||||||||||||||||||||||
| Issuance of common stock under Incentive Stock Option Plan (57,419 shares) |
77 | 698 | 775 | |||||||||||||||||||||||||||||||||
| Issuance of restricted stock under Incentive Stock Option Plan (3,282 shares) |
4 | (4 | ) | — | ||||||||||||||||||||||||||||||||
| Issuance of common stock for services rendered (27,721 shares) |
37 | 521 | 558 | |||||||||||||||||||||||||||||||||
| Stock-based compensation expense |
578 | 578 | ||||||||||||||||||||||||||||||||||
| Balance - December 31, 2008 |
590 | 18,055 | 101,719 | 155,140 | 2,808 | (2,790 | ) | (1,724 | ) | 273,798 | ||||||||||||||||||||||||||
| Comprehensive income: |
||||||||||||||||||||||||||||||||||||
| Net income |
8,360 | $ | 8,360 | 8,360 | ||||||||||||||||||||||||||||||||
| Unrealized holding gains arising during the period (net of taxes, $3,378) |
6,273 | |||||||||||||||||||||||||||||||||||
| Reclassification adjustment for gains included in net income (net of taxes, $57) |
(106 | ) | ||||||||||||||||||||||||||||||||||
| Other comprehensive income (net of taxes, $3,321) |
6,167 | 6,167 | 6,167 | |||||||||||||||||||||||||||||||||
| Total comprehensive income |
$ | 14,527 | ||||||||||||||||||||||||||||||||||
| Cash dividends common stock ($.30 per share) |
(4,372 | ) | (4,372 | ) | ||||||||||||||||||||||||||||||||
| Tax benefit from exercise of stock awards |
4 | 4 | ||||||||||||||||||||||||||||||||||
| Repurchase of preferred stock (59,000 shares) |
(590 | ) | (57,439 | ) | (971 | ) | (59,000 | ) | ||||||||||||||||||||||||||||
| Issuance costs of preferred stock |
(67 | ) | (67 | ) | ||||||||||||||||||||||||||||||||
| Dividend on preferred stock |
(2,696 | ) | (2,696 | ) | ||||||||||||||||||||||||||||||||
| Amortization of preferred stock discount |
(414 | ) | 2,790 | 2,376 | ||||||||||||||||||||||||||||||||
| Repurchase of warrant |
(2,808 | ) | (2,808 | ) | ||||||||||||||||||||||||||||||||
| Issuance of Common Stock (4,725,000 shares) |
6,284 | 52,644 | 58,928 | |||||||||||||||||||||||||||||||||
| Issuance of common stock under Dividend Reinvestment Plan (32,344 shares) |
43 | 402 | 445 | |||||||||||||||||||||||||||||||||
| Issuance of common stock under Incentive Stock Option Plan (1,800 shares) |
2 | 15 | 17 | |||||||||||||||||||||||||||||||||
| Issuance of restricted stock under Incentive Stock Option Plan (14,474 shares) |
20 | (20 | ) | — | ||||||||||||||||||||||||||||||||
| Issuance of common stock for services rendered (43,516 shares) |
58 | 458 | 516 | |||||||||||||||||||||||||||||||||
| Stock-based compensation expense |
420 | 420 | ||||||||||||||||||||||||||||||||||
| Balance - December 31, 2009 |
$ | — | $ | 24,462 | $ | 98,136 | $ | 155,047 | $ | — | $ | — | $ | 4,443 | $ | 282,088 | ||||||||||||||||||||
See accompanying notes to consolidated financial statements.
48
Table of Contents
UNION BANKSHARES CORPORATION AND SUBSIDIARIES
CONSOLIDATED STATEMENTS OF CASH FLOWS
YEARS ENDED DECEMBER 31, 2009, 2008 AND 2007
(Dollars in thousands)
| 2009 | 2008 | 2007 | ||||||||||
| Operating activities: |
||||||||||||
| Net income |
$ | 8,360 | $ | 14,514 | $ | 19,756 | ||||||
| Adjustments to reconcile net income to net cash and cash equivalents provided by operating activities: |
||||||||||||
| Depreciation of bank premises and equipment |
5,067 | 5,293 | 4,690 | |||||||||
| Amortization, net |
4,407 | 2,512 | 2,455 | |||||||||
| Provision for loan losses |
18,246 | 10,020 | 1,060 | |||||||||
| Gains on the sale of investment securities |
(163 | ) | (29 | ) | (586 | ) | ||||||
| Tax benefit from exercise of stock-based awards |
4 | 58 | 22 | |||||||||
| Deferred tax (benefit) expense |
(2,425 | ) | (1,313 | ) | 238 | |||||||
| Origination of loans held for sale |
(703,477 | ) | (424,601 | ) | (371,873 | ) | ||||||
| Proceeds from sales of loans held for sale |
678,621 | 420,425 | 366,709 | |||||||||
| (Gains) loss on sales of other real estate owned and bank premises, net |
37 | (1,826 | ) | (187 | ) | |||||||
| Stock-based compensation expenses |
420 | 578 | 545 | |||||||||
| Issuance of common stock grants for services |
516 | 558 | 605 | |||||||||
| Prepayment of FDIC insurance assessment |
(11,805 | ) | — | — | ||||||||
| Increase in other assets |
(1,893 | ) | (6,932 | ) | (7,718 | ) | ||||||
| Increase (decrease) in other liabilities |
5,216 | (1,102 | ) | 1,330 | ||||||||
| Net cash and cash equivalents provided by operating activities |
1,131 | 18,155 | 17,046 | |||||||||
| Investing activities: |
||||||||||||
| Purchases of securities available for sale |
(181,219 | ) | (68,254 | ) | (55,080 | ) | ||||||
| Proceeds from sales of securities available for sale |
14,005 | 881 | 100 | |||||||||
| Proceeds from maturities, calls and paydowns of securities available for sale |
83,964 | 35,895 | 55,289 | |||||||||
| Net increase in loans |
(33,301 | ) | (130,128 | ) | (199,247 | ) | ||||||
| Net increase in bank premises and equipment |
(6,315 | ) | (5,151 | ) | (14,573 | ) | ||||||
| Proceeds from sales of other real estate owned |
4,452 | — | — | |||||||||
| Cash acquired in bank and branch acquisitions |
— | — | 35,636 | |||||||||
| Net cash and cash equivalents used in investing activities |
(118,414 | ) | (166,757 | ) | (177,875 | ) | ||||||
| Financing activities: |
||||||||||||
| Net increase (decrease) in noninterest-bearing deposits |
19,393 | (6,576 | ) | (19,443 | ) | |||||||
| Net increase (decrease) in interest-bearing deposits |
(30,028 | ) | 273,997 | (30,195 | ) | |||||||
| Net increase (decrease) in short-term borrowings |
42,469 | (159,604 | ) | 220,190 | ||||||||
| Net increase (decrease) in long-term borrowings |
(10,000 | ) | 80,500 | (19,350 | ) | |||||||
| Cash dividends paid - common stock |
(4,372 | ) | (9,990 | ) | (9,686 | ) | ||||||
| Cash dividends paid - preferred stock |
(2,696 | ) | — | — | ||||||||
| (Repurchase) Issuance of preferred stock and warrant |
(59,499 | ) | 58,924 | — | ||||||||
| Repurchase of common stock |
— | (254 | ) | — | ||||||||
| Issuance of common stock |
59,390 | 1,863 | 1,702 | |||||||||
| Net cash and cash equivalents provided by financing activities |
14,657 | 238,860 | 143,218 | |||||||||
| Increase (decrease) in cash and cash equivalents |
(102,626 | ) | 90,258 | (17,611 | ) | |||||||
| Cash and cash equivalents at beginning of the period |
148,537 | 58,279 | 75,890 | |||||||||
| Cash and cash equivalents at end of the period |
$ | 45,911 | $ | 148,537 | $ | 58,279 | ||||||
| Supplemental Disclosure of Cash Flow Information |
||||||||||||
| Cash payments for: |
||||||||||||
| Interest |
$ | 49,854 | $ | 57,520 | $ | 65,103 | ||||||
| Income taxes |
2,173 | 7,470 | 7,909 | |||||||||
| Supplemental schedule of noncash investing and financing activities |
||||||||||||
| Unrealized gain (loss) on securities available for sale |
$ | 9,488 | $ | (4,509 | ) | $ | (378 | ) | ||||
| Transfers from loans to other real estate owned |
19,906 | 6,376 | — | |||||||||
| Cumulative-effect of a change in accounting principle |
— | (1,604 | ) | — | ||||||||
| Transactions related to bank and branch acquisitions |
||||||||||||
| Increase in assets and liabilities: |
||||||||||||
| Other assets |
$ | — | $ | — | $ | 7,672 | ||||||
| Noninterest bearing deposits |
— | — | 8,586 | |||||||||
| Interest bearing deposits |
— | — | 34,722 | |||||||||
See accompanying notes to consolidated financial statements.
49
Table of Contents
UNION BANKSHARES CORPORATION AND SUBSIDIARIES
NOTES TO THE CONSOLIDATED FINANCIAL STATEMENTS
YEARS ENDED DECEMBER 31, 2009, 2008 and 2007
1. SUMMARY OF SIGNIFICANT ACCOUNTING POLICIES
The accounting policies and practices of Union Bankshares Corporation and subsidiaries (the “Company”) conform to accounting principles generally accepted in the United States of America (U. S.) and follow general practice within the banking industry. Major policies and practices are described below. Effective February 1, 2010, the Company acquired First Market Bank, FSB, a privately held federally chartered savings bank (“First Market Bank”). The acquisition of First Market Bank is discussed in Note 21 “Subsequent Event” in the “Notes to the Consolidated Financial Statements.” With the exception of Note 21, the following footnotes do not contain any financial results of First Market Bank.
As more fully described in the section labeled Recent Accounting Pronouncements, the Company adopted Accounting Standards Codification (“ASC”) 105, The FASB Accounting Standards Codification and the Hierarchy of Generally Accepted Accounting Principles—a replacement of FASB Statement No. 162 (“ASC 105”), during the third quarter 2009. ASC 105 establishes a single source of authoritative, nongovernmental U.S. generally accepted accounting principles (“GAAP”), except for rules and interpretive releases of the Securities and Exchange Commission (“SEC”). The effective date of ASC 105 was for interim and annual reporting periods ending after September 15, 2009.
(A) Principles of Consolidation
The consolidated financial statements include the accounts of the Company, which is a bank holding company that owns all of the outstanding common stock of its banking subsidiaries, Union Bank and Trust Company (“Union Bank”), Northern Neck State Bank, Rappahannock National Bank, and of Union Investment Services Inc. Two affiliates, Prosperity Bank & Trust Company (“Prosperity”) and Bay Community Bank, were merged into the largest affiliate, Union Bank, in March and October 2008, respectively. Union Mortgage Group, Inc. (“Union Mortgage”) is a wholly owned subsidiary of Union Bank. Union Bank also has a non-controlling interest in Johnson Mortgage Company, LLC, which is accounted for under the equity method of accounting. The Company’s Statutory Trust I and II, wholly owned subsidiaries of the Company, were formed for the purpose of issuing redeemable Trust Preferred Capital Notes in connection with the Company’s acquisitions of Guaranty Financial Corporation in May 2004 and its wholly owned subsidiary, Guaranty Bank (“Guaranty”) and Prosperity in April 2006. ASC 860, Transfers and Servicing, precludes the Company from consolidating Statutory Trusts I and II. The subordinated debts payable to the trusts are reported as liabilities of the Company. All significant inter-company balances and transactions have been eliminated. The accompanying consolidated financial statements for prior periods reflect certain reclassifications in order to conform to the current presentation.
(B) Investment Securities
Debt securities that the Company has the positive intent and ability to hold to maturity are classified as held-to-maturity and reported at amortized cost. The Company has no securities in this category.
Securities classified as available for sale are those debt and equity securities that management intends to hold for an indefinite period of time, including securities used as part of the Company’s asset/liability strategy, and that may be sold in response to changes in interest rates, liquidity needs or other similar factors. Securities available for sale are reported at fair value, with unrealized gains or losses, net of deferred taxes, included in accumulated other comprehensive income in stockholders’ equity.
50
Table of Contents
Securities classified as held for trading are those debt and equity securities that are bought and held principally for the purpose of selling them in the near term and reported at fair value, with unrealized gains and losses included in earnings. The Company has no securities in this category.
Purchased premiums and discounts are recognized in interest income using the interest method over the terms of the securities. Declines in the fair value of held to maturity and available for sale securities below their cost that are deemed to be other than temporary are reflected in earnings as realized losses. In estimating other-than-temporary impairment losses, an impairment is other-than-temporary if any of the following conditions exists: the entity intends to sell the security; it is more likely than not that the entity will be required to sell the security before recovery of its amortized cost basis; or, the entity does not expect to recover the security’s entire amortized cost basis (even if the entity does not intend to sell). If a credit loss exists, but an entity does not intend to sell the impaired debt security and is not more likely than not to be required to sell before recovery, the impairment is other-than-temporary and should be separated into a credit portion to be recognized in earnings and the remaining amount relating to all other factors recognized as other comprehensive loss. The Company has recognized no other-than-temporary losses. Gains and losses on the sale of securities are recorded on the trade date and are determined using the specific identification method.
(C) Loans Held For Sale
Loans originated and intended for sale in the secondary market are sold servicing released and carried at the lower of cost or estimated fair value, which is determined in the aggregate based on sales commitments to permanent investors or on current market rates for loans of similar quality and type. In addition, the Company requires a firm purchase commitment from a permanent investor before a loan can be closed, thus limiting interest rate risk. As a result, loans held for sale are stated at fair value. Net unrealized losses, if any, are recognized through a valuation allowance by charges to income.
(D) Loans
The Company originates mortgage, commercial and consumer loans to customers. A substantial portion of the loan portfolio is represented by mortgage loans and commercial real estate loans (including acquisition and development and residential construction) throughout its market area. The ability of the Company’s debtors to honor their contracts is dependent upon the real estate and general economic conditions in this area.
Loans that management has the intent and ability to hold for the foreseeable future or until maturity or pay-offs generally are reported at their outstanding unpaid principal balances adjusted for charge-offs, the allowance for loan losses, and any deferred fees or costs on originated loans. Interest income is accrued on the unpaid principal balance. Loan origination fees, net of certain direct origination costs, are deferred and recognized as an adjustment of the related loan yield using the interest method.
The accrual of interest on mortgage and commercial loans is discontinued at the time the loan is 90 days delinquent unless the credit is well secured and in process of collection. Credit card loans and other personal loans are typically charged-off no later than 180 days past due. In all cases, loans are placed on non-accrual status or charged-off at an earlier date if collection of principal and interest is considered doubtful.
All interest accrued but not collected for loans that are placed on non-accrual status or charged-off is reversed against interest income. The interest on these loans is accounted for on the cash-basis or cost-recovery method, until qualifying for return to accrual. Loans are returned to accrual status when all the principal and interest amounts contractually due are brought current and future payments are reasonably assured.
51
Table of Contents
(E) Allowance For Loan Losses
The provision for loan losses charged to operations is an amount sufficient to bring the allowance for loan losses to an estimated balance that management considers adequate to absorb potential losses in the portfolio. Loans are charged against the allowance when management believes the collectibility of the principal is unlikely. Recoveries of amounts previously charged-off are credited to the allowance. Management’s determination of the adequacy of the allowance is based on an evaluation of the composition of the loan portfolio, the value and adequacy of collateral, current economic conditions, historical loan loss experience, and other risk factors. Management believes that the allowance for loan losses is adequate. While management uses available information to recognize losses on loans, future additions to the allowance may be necessary based on changes in economic conditions, particularly those affecting real estate values. In addition, regulatory agencies, as an integral part of their examination process, periodically review the Company’s allowance for loan losses. Such agencies may require the Company to recognize additions to the allowance based on their judgments about information available to them at the time of their examination.
The allowance consists of specific, general and unallocated components. The specific component relates to loans that are classified as impaired, and on which an allowance is established when the discounted cash flows (or collateral value or observable market price) of the impaired loan is lower than the carrying value of that loan. The general component covers non-impaired loans and is based on historical loss experience adjusted for various qualitative and environmental factors. An unallocated component is maintained to cover uncertainties that could affect management’s estimate of probable losses. The unallocated component of the allowance reflects the margin of imprecision inherent in the underlying assumptions used in the methodologies for estimating specific and general losses in the portfolio. At December 31, 2009 and 2008, there were no amounts considered unallocated as part of the allowance for loan losses.
A loan is considered impaired when, based on current information and events, it is probable that the Company will be unable to collect the scheduled payments of principal or interest when due according to the contractual terms of the loan agreement. Factors considered by management in determining impairment include payment status, collateral value, and the probability of collecting scheduled principal and interest payments when due. Loans that experience insignificant payment delays and payment shortfalls generally are not classified as impaired. Generally, a loan that is classified substandard or worse is considered impaired. Management determines the significance of payment delays and payment shortfalls on a case-by-case basis, taking into consideration all of the circumstances surrounding the loan and the borrower, including the length of the delay, the reasons for the delay, the borrower’s prior payment record, and the amount of the shortfall in relation to the principal and interest owed. Impairment is measured on a loan by loan basis by either the present value of expected future cash flows discounted at the loan’s effective interest rate, the loan’s obtainable market price, or the fair value of the collateral if the loan is collateral dependent.
Large groups of smaller balance homogeneous loans are collectively evaluated for impairment. Accordingly, the Company generally does not separately identify individual consumer and residential loans for impairment disclosures.
(F) Bank Premises and Equipment
Land is carried at cost. Bank premises and equipment is stated at cost less accumulated depreciation and amortization. Depreciation and amortization are computed using the straight-line method based on the type of asset involved. The Company’s policy is to capitalize additions and improvements and to depreciate the cost thereof over their estimated useful lives ranging from 3 to 40 years. Maintenance, repairs and renewals are expensed as they are incurred.
52
Table of Contents
(G) Goodwill and Intangible Assets
ASC 350 Intangibles-Goodwill and Other (“ASC 350”) prescribes the accounting for goodwill and intangible assets subsequent to initial recognition. The provisions of ASC 350 discontinue the amortization of goodwill and intangible assets with indefinite lives but require at least an annual impairment review and more frequently if certain impairment indicators are in evidence. The Company adopted ASC 350-30 General Intangibles Other Than Goodwill, on January 1, 2002 and determined that core deposit intangibles will continue to be amortized over the estimated useful life. ASC 805 Business Combinations requires that the acquisition method of accounting be used for all business combinations initiated after January 1, 2009. The acquisition method of accounting requires an acquirer to recognize the assets acquired and the liabilities assumed at the acquisition date measured at their fair values as of that date, which in many instances involves estimates based on third party valuations, such as appraisals, or internal valuations based on discounted cash flow analysis or other valuation techniques.
(H) Income Taxes
Deferred income tax assets and liabilities are determined using the liability (or balance sheet) method. Under this method, the net deferred tax asset or liability is determined based on the tax effects of the temporary differences between the book and tax bases of the various balance sheet assets and liabilities and gives current recognition to changes in tax rates and laws. Deferred taxes are reduced by a valuation allowance when, in the opinion of management, it is more likely than not that some portion or all of the deferred tax assets will not be realized.
When tax returns are filed, it is highly certain that some positions taken would be sustained upon examination by the taxing authorities, while others are subject to uncertainty about the merits of the position taken or the amount of the position that would be ultimately sustained. The benefit of a tax position is recognized in the financial statements in the period during which, based on all available evidence, management believes it is more likely than not that the position will be sustained upon examination, including the resolution of appeals or litigation processes, if any. Tax positions taken are not offset or aggregated with other positions. Tax positions that meet the more-likely-than-not recognition threshold are measured as the largest amount of tax benefit that is more than 50 percent likely of being realized upon settlement with the applicable taxing authority. The portion of the benefits associated with tax positions taken that exceeds the amount measured as described above is reflected as a liability for unrecognized tax benefits in the accompanying consolidated balance sheet along with any associated interest and penalties that would be payable to the taxing authorities upon examination.
Interest and penalties associated with unrecognized tax benefits are classified as additional income taxes in the consolidated statement of income. The Company did not have any of these for the periods ending December 31, 2009, 2008 or 2007.
(I) Other Real Estate Owned
Assets acquired through, or in lieu of, loan foreclosure are held for sale and are initially recorded at the lower of the carrying amount or fair value at the date of foreclosure, establishing a new cost basis. Subsequent to foreclosure, valuations are periodically performed by management and the assets are carried at the lower of carrying amount or fair value less cost to sell. Revenue and expenses from operations and changes in the valuation allowance are included in net expenses from foreclosed assets.
(J) Consolidated Statements of Cash Flows
For purposes of reporting cash flows, the Company defines cash and cash equivalents as cash, cash due from banks, interest-bearing deposits in other banks, money market investments, other interest-bearing deposits, and Federal funds sold.
53
Table of Contents
(K) Earnings Per Share
Basic earnings per share (“EPS”) is computed by dividing net income available to common stockholders by the weighted average number of common shares outstanding during the year. Net income available to common stockholders deducts from net income the dividends and discount accretion on preferred stock. Diluted earnings per share reflects additional common shares that would have been outstanding if dilutive potential common shares had been issued, as well as any adjustment to income that would result from the assumed issuance. Potential common shares that may be issued by the Company relate solely to outstanding stock options, nonvested stock and warrants and are determined using the treasury stock method.
(L) Comprehensive Income (Loss)
Comprehensive income (loss) represents all changes in equity that result from recognized transactions and other economic events of the period. Other comprehensive income (loss) refers to revenues, expenses, gains and losses under GAAP that are included in comprehensive income, but excluded from net income, such as unrealized gains and losses on certain investments in debt and equity securities.
(M) Use of Estimates
The preparation of the consolidated financial statements in conformity with accounting principles generally accepted in the U.S. requires management to make estimates and assumptions that affect the reported amounts of assets and liabilities at the date of the financial statements and the reported amounts of revenue and expenses during the reporting period. Actual results could differ from these estimates. Material estimates that are particularly susceptible to significant change in the near term relate to the determination of the allowance for loan losses, the valuation of goodwill and intangible assets, other real estate owned, deferred tax assets and liabilities, other-than-temporary impairment of securities and the fair value of financial instruments.
(N) Advertising Costs
The Company follows a policy of charging the cost of advertising to expense as incurred. Advertising costs are disclosed in Note 19 “Other Operating Expenses” in the “Notes to the Consolidated Financial Statements.”
(O) Off Balance Sheet Credit Related Financial Instruments
In the ordinary course of business, the Company has entered into commitments to extend credit and standby letters of credit. Such financial instruments are recorded when they are funded.
(P) Rate Lock Commitments
The Company enters into commitments to originate mortgage loans whereby the interest rate on the loan is determined prior to funding (rate lock commitments). Rate lock commitments on mortgage loans that are intended to be sold are considered to be derivatives. The period of time between issuance of a loan commitment and closing and sale of the loan generally ranges from 30 to 120 days. The Company protects itself from changes in interest rates through the use of best efforts forward delivery commitments, whereby the Company commits to sell a loan at the time the borrower commits to an interest rate with the intent that the buyer has assumed interest rate risk on the loan. As a result, the Company is not exposed to losses and will not realize significant gains related to its rate lock commitments due to changes in interest rates. The correlation between the rate lock commitments and the best efforts contracts is very high due to their similarity.
The market value of rate lock commitments and best efforts contracts is not readily ascertainable with precision because rate lock commitments and best efforts contracts are not actively traded in stand-alone markets. The Company determines the fair value of rate lock commitments and best efforts contracts by measuring the change in the value of the underlying asset while taking into consideration the probability that the rate lock commitments will close. Because of the high correlation between rate lock commitments and best efforts contracts, no gain or loss occurs on the rate lock commitments.
54
Table of Contents
(Q) Variable Interest Entities
Current accounting guidance states that if a business enterprise is the primary beneficiary of a variable interest entity, the assets, liabilities and results of the activities of the variable interest entity should be included in the consolidated financial statements of the business enterprise. This interpretation explains how to identify variable interest entities and how an enterprise assesses its interest in a variable interest entity to decide whether to consolidate the entity. It also requires existing unconsolidated variable interest entities to be consolidated by their primary beneficiaries if the entities do not effectively disperse risks among parties involved. Variable interest entities that effectively disperse risks will not be consolidated unless a single party holds an interest or combination of interests that effectively recombines risks that were previously dispersed. Management has evaluated the Company’s investment in variable interest entities. The Company’s primary exposure to variable interest entities are the trust preferred securities structures.
Currently, other than the impact described above from the deconsolidation of the trust preferred capital notes, this accounting guidance has not had a material impact on the financial condition or the operating results of the Company.
(R) Asset Prepayment Rates
The Company purchases amortizing loan pools and investment securities in which the underlying assets are residential mortgage loans subject to prepayments. The actual principal reduction on these assets varies from the expected contractual principal reduction due to principal prepayments resulting from the borrowers’ election to refinance the underlying mortgage based on market and other conditions. The purchase premiums and discounts associated with these assets are amortized or accreted to interest income over the estimated life of the related assets. The estimated life is calculated by projecting future prepayments and the resulting principal cash flows until maturity. Prepayment rate projections utilize actual prepayment speed experience and available market information on similar instruments. The prepayment rates form the basis for income recognition of premiums and discounts on the related assets. Changes in prepayment estimates may cause the earnings recognized on these assets to vary over the term that the assets are held, creating volatility in the net interest margin. Prepayment rate assumptions are monitored monthly and updated periodically to reflect actual activity and the most recent market projections.
(S) Concentrations of Credit Risk
Most of the Company’s activities are with customers located in portions of Central and Tidewater Virginia. Securities Available for Sale and Loans also represent concentrations of credit risk and are discussed in Note 2 “Securities Available for Sale” and Note 3 “Loans” in the “Notes to the Consolidated Financial Statements,” respectively.
(T) Stock Compensation Plan
The Company has adopted ASC 718 Compensation – Stock Compensation, which requires the costs resulting from all share-based payments to employees be recognized in the financial statements. Stock-based compensation is estimated at the date of grant, using the Black-Scholes option valuation model for determining fair value of stock options. The market price of the Company’s common stock at the date of grant is used for nonvested stock awards. The model employs the following assumptions:
| • | Dividend yield - calculated as the ratio of historical dividends paid per share of common stock to the stock price on the date of grant; |
55
Table of Contents
| • | Expected life (term of the option) - based on the average of the contractual life and vesting schedule for the respective option; |
| • | Expected volatility - based on the monthly historical volatility of the Company’s stock price over the expected life of the options; |
| • | Risk-free interest rate - based upon the U. S. Treasury bill yield curve, for periods within the contractual life of the option, in effect at the time of grant. |
For the year ended December 31, 2009, the Company recognized stock-based compensation expense of approximately $211 thousand, net of tax, or approximately $.02 per share, in accordance with ASC 718.
ASC 718 requires the Company to estimate forfeitures when recognizing compensation expense and that this estimate of forfeitures be adjusted over the requisite service period or vesting schedule based on the extent to which actual forfeitures differ from such estimates. Changes in estimated forfeitures are recognized through a cumulative catch-up adjustment, which is recognized in the period of change, and also will impact the amount of estimated unamortized compensation expense to be recognized in future periods.
The Company’s 2003 Stock Incentive Plan provides for the granting of incentive stock options, non-statutory stock options, and nonvested stock awards to key employees of the Company and its subsidiaries. The Company’s 2003 Stock Incentive Plan replaced the 1993 Stock Incentive Plan, and became effective on July 1, 2003, after shareholders approved the plan at the annual meeting of shareholders held in 2003. The 2003 Stock Incentive Plan makes available 525,000 shares (adjusted for any stock splits), which may be awarded to employees of the Company and its subsidiaries in the form of incentive stock options intended to comply with the requirements of Section 422 of the Internal Revenue Code of 1986 (“incentive stock options”), non-statutory stock options, and nonvested stock. Under the plan, the option price cannot be less than the fair market value of the stock on the grant date. The stock option’s maximum term is ten years from the date of grant and vests in equal annual installments of twenty percent over a five year vesting schedule. The Company issues new shares to satisfy share-based awards. As of December 31, 2009, approximately 273,700 shares were available for issuance under the Company’s 2003 Stock Incentive Plan.
For more information and tables refer to Note 10 “Employee Benefits” within the “Notes to the Consolidated Financial Statements.”
(U) Recent Accounting Pronouncements
The Company adopted new guidance impacting Financial Accounting Standards Board (“FASB”) Topic 805: Business Combinations (“Topic 805”) on January 1, 2009. This guidance requires the acquiring entity in a business combination to recognize the full fair value of assets acquired and liabilities assumed in the transaction (whether a full or partial acquisition); establishes the acquisition-date fair value as the measurement objective for all assets acquired and liabilities assumed; requires expensing of most transaction and restructuring costs; and requires the acquirer to disclose to investors and other users all of the information needed to evaluate and understand the nature and financial effect of the business combination. The adoption of the new guidance will have an impact on the Company’s consolidated financial statements as it relates to the acquisition of First Market Bank. Refer to Note 21 “Subsequent Event” within the “Notes to the Consolidated Financial Statements” for additional disclosure.
In April 2009, the FASB issued new guidance impacting Topic 805. This guidance addresses application issues raised by preparers, auditors, and members of the legal profession on initial recognition and measurement, subsequent measurement and accounting, and disclosure of assets and liabilities arising from contingencies in a business combination. This guidance was effective for business combinations entered into on or after January 1, 2009. The adoption of the standard did not have a material impact on the Company’s consolidated financial statements.
56
Table of Contents
In April 2009, the FASB issued new guidance impacting FASB Topic 820: Fair Value Measurements and Disclosures. This interpretation provides additional guidance for estimating fair value when the volume and level of activity for the asset or liability have significantly decreased. This also includes guidance on identifying circumstances that indicate a transaction is not orderly and requires additional disclosures of valuation inputs and techniques in interim periods and defines the major security types that are required to be disclosed. This guidance was effective for interim and annual periods ending after June 15, 2009, and should be applied prospectively. The adoption of the standard did not have a material impact on the Company’s consolidated financial statements.
In April 2009, the FASB issued new guidance impacting FASB Topic 320-10: Investments – Debt and Equity Securities. This guidance amends generally accepted accounting principles for debt securities to make the guidance more operational and to improve the presentation and disclosure of other-than-temporary impairments on debt and equity securities in the financial statements. This guidance was effective for interim and annual periods ending after June 15, 2009, with earlier adoption permitted for periods ending after March 15, 2009. The adoption of the standard did not have a material impact on the Company’s consolidated financial statements.
In May 2009, the FASB issued new guidance impacting FASB Topic 855: Subsequent Events. This update provides guidance on management’s assessment of subsequent events that occur after the balance sheet date through the date that the financial statements are issued. This guidance is generally consistent with current accounting practice. In addition, it requires certain additional disclosures. This guidance was effective for periods ending after June 15, 2009 and had no impact on the Company’s consolidated financial statements. For the Company, this is the date of financial statement issuance.
In June 2009, the FASB issued new guidance relating to the accounting for transfers of financial assets. The new guidance, which was issued as SFAS No. 166, Accounting for Transfers of Financial Assets, an amendment to SFAS No. 140, was adopted into Codification in December 2009 through the issuance of Accounting Standards Update (“ASU”) 2009-16. The new standard provides guidance to improve the relevance, representational faithfulness, and comparability of the information that an entity provides in its financial statements about a transfer of financial assets; the effects of a transfer on its financial position, financial performance, and cash flows; and a transferor’s continuing involvement, if any, in transferred financial assets. The Company will adopt the new guidance in 2010 and is evaluating the impact it will have, if any, on its consolidated financial statements.
In June 2009, the FASB issued new guidance relating to the variable interest entities. The new guidance, which was issued as SFAS No. 167, Amendments to FASB Interpretation No. 46(R), was adopted into Codification in December 2009. The objective of the guidance is to improve financial reporting by enterprises involved with variable interest entities and to provide more relevant and reliable information to users of financial statements. SFAS No. 167 is effective as of January 1, 2010. The Company does not expect the adoption of the new guidance to have a material impact on its consolidated financial statements.
In September 2009, the FASB issued new guidance impacting Topic 820. This update creates a practical expedient to measure the fair value of an alternative investment that does not have a readily determinable fair value. This guidance also requires certain additional disclosures. This guidance is effective for interim and annual periods ending after December 15, 2009. The Company does not expect the adoption of the new guidance to have a material impact on its consolidated financial statements.
In January 2010, the FASB issued ASU 2010-04, Accounting for Various Topics – Technical Corrections to SEC Paragraphs (“ASU 2010-04”). This update makes technical corrections to existing SEC guidance including the following topics: accounting for subsequent investments, termination of an interest rate swap, issuance of financial statements - subsequent events, use of residential method to value acquired assets other than goodwill, adjustments in assets and liabilities for holding gains and losses, and selections of discount rate used for measuring defined benefit obligation. The Company does not expect the adoption of ASU 2010-04 to have a material impact on its consolidated financial statements.
57
Table of Contents
In January 2010, the FASB issued ASU No. 2010-06, Fair Value Measurements and Disclosures (Topic 820): Improving Disclosures about Fair Value Measurements (“ASU 2010-06”). ASU 2010-06 amends Subtopic 820-10 to clarify existing disclosures, requires new disclosures, and includes conforming amendments to guidance on employers’ disclosures about postretirement benefit plan assets. ASU 2010-06 is effective for interim and annual periods beginning after December 15, 2009, except for disclosures about purchases, sales, issuances, and settlements in the roll forward of activity in Level 3 fair value measurements. Those disclosures are effective for fiscal years beginning after December 15, 2010 and for interim periods within those fiscal years. The Company does not expect the adoption of ASU 2010-06 to have a material impact on its consolidated financial statements.
In February 2010, the FASB issued ASU 2010-08, Technical Corrections to Various Topics (“ASU 2010-08”). ASU 2010-08 clarifies guidance on embedded derivatives and hedging. ASU 2010-08 is effective for interim and annual periods beginning after December 15, 2009. The Company does not expect the adoption of ASU 2010-08 to have a material impact on its consolidated financial statements.
(V) Business Combinations
The Company’s merger and acquisition strategy focuses on high-growth areas with strong market demographics and targets organizations that have a comparable corporate culture, strong performance and good asset quality, among other factors.
Beginning January 1, 2009, business combinations must be accounted for under ASC 805 Business Combinations, using the acquisition method of accounting. The Company has accounted for its previous business combinations under the purchase method of accounting, a cost allocation process which required the cost of an acquisition to be allocated to the individual assets acquired and liabilities assumed based on their estimated fair values. The acquisition method of accounting requires an acquirer to recognize the assets acquired and the liabilities assumed at the acquisition date measured at their fair values as of that date. To determine the fair values, the Company will continue to rely on third party valuations, such as appraisals, or internal valuations based on discounted cash flow analyses or other valuation techniques. Under the acquisition method of accounting, the Company will identify the acquirer and the closing date and apply applicable recognition principles and conditions. Costs that the Company expects, but is not obligated to incur in the future, to effect its plan to exit an activity of an acquiree or to terminate the employment of or relocate an acquiree’s employees are not liabilities at the acquisition date. The Company will not recognize these costs as part of applying the acquisition method. Instead, the Company will recognize these costs in its post-combination financial statements in accordance with other applicable accounting guidance.
Acquisition-related costs are costs the Company incurs to effect a business combination. Those costs include advisory, legal, accounting, valuation, and other professional or consulting fees. Some other examples for the Company include systems conversions, integration planning consultants and advertising costs. The Company will account for acquisition-related costs as expenses in the periods in which the costs are incurred and the services are received, with one exception. The costs to issue debt or equity securities will be recognized in accordance with other applicable accounting guidance. These acquisition-related costs are included within the Consolidated Statements of Income classified within the noninterest expense caption.
58
Table of Contents
2. SECURITIES AVAILABLE FOR SALE
The amortized cost, gross unrealized gains and losses and estimated fair value of securities available for sale at December 31, 2009 and 2008 are summarized as follows (dollars in thousands):
| Gross Unrealized | |||||||||||||
| Amortized Cost |
Gains | (Losses) | Estimated Fair Value | ||||||||||
| December 31, 2009 |
|||||||||||||
| U.S. government and agency securities |
$ | 5,516 | $ | 247 | $ | — | $ | 5,763 | |||||
| Obligations of states and political subdivisions |
123,573 | 2,928 | (2,375 | ) | 124,126 | ||||||||
| Corporate and other bonds |
16,924 | 225 | (1,350 | ) | 15,799 | ||||||||
| Mortgage-backed securities |
228,766 | 7,415 | (176 | ) | 236,005 | ||||||||
| Federal Reserve Bank stock - restricted |
3,683 | — | — | 3,683 | |||||||||
| Federal Home Loan Bank stock - restricted |
14,958 | — | — | 14,958 | |||||||||
| Other securities |
257 | 14 | (14 | ) | 257 | ||||||||
| $ | 393,677 | $ | 10,829 | $ | (3,915 | ) | $ | 400,591 | |||||
| December 31, 2008 |
|||||||||||||
| Obligations of states and political subdivisions |
$ | 124,090 | $ | 1,331 | $ | (5,164 | ) | $ | 120,257 | ||||
| Corporate and other bonds |
14,242 | 8 | (2,114 | ) | 12,136 | ||||||||
| Mortgage-backed securities |
157,098 | 3,576 | (143 | ) | 160,531 | ||||||||
| Federal Reserve Bank stock - restricted |
3,383 | — | — | 3,383 | |||||||||
| Federal Home Loan Bank stock - restricted |
13,171 | — | — | 13,171 | |||||||||
| Other securities |
255 | — | (22 | ) | 233 | ||||||||
| $ | 312,239 | $ | 4,915 | $ | (7,443 | ) | $ | 309,711 | |||||
The following table presents the amortized cost and estimated fair value of securities available for sale as of December 31, 2009, by contractual maturity (dollars in thousands). Expected maturities may differ from contractual maturities because borrowers may have the right to call or prepay obligations with or without call or prepayment penalties.
| Amortized Cost |
Estimated Fair Value | |||||
| Due in one year or less |
$ | 730 | $ | 736 | ||
| Due after one year through five years |
52,371 | 53,799 | ||||
| Due after five years through ten years |
87,542 | 90,564 | ||||
| Due after ten years |
234,136 | 236,594 | ||||
| 374,779 | 381,693 | |||||
| Federal Reserve Bank stock - restricted |
3,683 | 3,683 | ||||
| Federal Home Loan Bank stock - restricted |
14,958 | 14,958 | ||||
| Other securities |
257 | 257 | ||||
| Total securities available for sale |
$ | 393,677 | $ | 400,591 | ||
Securities with an amortized cost of $129.3 million and $129.6 million as of December 31, 2009 and 2008 were pledged to secure public deposits, repurchase agreements and for other purposes.
59
Table of Contents
Sales, calls, maturities and paydowns of securities available for sale produced the following results for the years ended December 31, 2009, 2008 and 2007 (dollars in thousands):
| 2009 | 2008 | 2007 | ||||||||
| Proceeds from sales |
$ | 14,005 | $ | 881 | $ | 100 | ||||
| Proceeds from calls, maturities and paydowns |
83,964 | 35,895 | 55,289 | |||||||
| Total proceeds |
$ | 97,969 | $ | 36,776 | $ | 55,389 | ||||
| Gross realized gains |
$ | 163 | $ | 29 | $ | 587 | ||||
| Gross realized losses |
— | — | (1 | ) | ||||||
| Net realized gains |
$ | 163 | $ | 29 | $ | 586 | ||||
The primary purpose of the investment portfolio is to generate income and meet liquidity needs of the Company through readily saleable financial instruments. The portfolio includes fixed rate bonds, whose prices move inversely with rates. At the end of any accounting period, the investment portfolio has unrealized gains and losses. The Company monitors the portfolio, which is subject to liquidity needs, market rate changes and credit risk changes, to see if adjustments are needed. The primary cause of temporary impairments was the increase in spreads over comparable Treasury bonds. As of December 31, 2009, there were $41.0 million of individual securities that had been in a continuous loss position for more than 12 months. Additionally, these securities had an unrealized loss of $3.5 million and consisted primarily of municipal obligations and corporate bonds. In the second quarter of 2009, the Company adopted ASC 320-10-65 Transition Related to FSP FAS 115-2 and FAS 124-2, Recognition and Presentation of Other-Than-Temporary Impairments that amended other-than-temporary impairment (“OTTI”) guidance for debt securities regarding recognition and disclosure. The major change in the guidance was that an impairment is other-than-temporary if any of the following conditions exists: the entity intends to sell the security; it is more likely than not that the entity will be required to sell the security before recovery of its amortized cost basis; or the entity does not expect to recover the security’s entire amortized cost basis (even if the entity does not intend to sell). If a credit loss exists, but an entity does not intend to sell the impaired debt security and is not more likely than not to be required to sell before recovery, the impairment is other-than-temporary and should be separated into a credit portion to be recognized in earnings and the remaining amount relating to all other factors recognized as other comprehensive loss.
During each quarter and at year end, the Company conducts an assessment of the securities portfolio for OTTI consideration. The assessment considers factors such as external credit ratings, delinquency coverage ratios, market price, management’s judgment, expectations of future performance and relevant industry research and analysis. Based on the assessment and in accordance with the revised guidance, no OTTI was recognized during the years ended December 31, 2009, 2008 or 2007.
The following tables present the gross unrealized losses and fair values as of December 31, 2009 and 2008, aggregated by investment category and length of time that the individual securities have been in a continuous unrealized loss position (dollars in thousands):
| Less than 12 months | More than 12 months | Total | |||||||||||||||||||
| Fair value |
Unrealized Losses |
Fair value |
Unrealized Losses |
Fair value |
Unrealized Losses |
||||||||||||||||
| As of December 31, 2009 | |||||||||||||||||||||
| Obligations of states and political subdivisions |
$ | 9,597 | $ | (174 | ) | $ | 35,898 | $ | (2,201 | ) | $ | 45,495 | $ | (2,375 | ) | ||||||
| Mortgage-backed securities |
23,815 | (176 | ) | — | — | 23,815 | (176 | ) | |||||||||||||
| Corporate and other bonds |
1,836 | (45 | ) | 5,118 | (1,319 | ) | 6,954 | (1,364 | ) | ||||||||||||
| $ | 35,248 | $ | (395 | ) | $ | 41,016 | $ | (3,520 | ) | $ | 76,264 | $ | (3,915 | ) | |||||||
| As of December 31, 2008 | |||||||||||||||||||||
| Obligations of states and political subdivisions |
$ | 54,345 | $ | (4,497 | ) | $ | 5,057 | $ | (667 | ) | $ | 59,402 | $ | (5,164 | ) | ||||||
| Mortgage-backed securities |
25,481 | (116 | ) | 2,597 | (27 | ) | 28,078 | (143 | ) | ||||||||||||
| Corporate and other bonds |
9,464 | (1,954 | ) | 1,609 | (182 | ) | 11,073 | (2,136 | ) | ||||||||||||
| $ | 89,290 | $ | (6,567 | ) | $ | 9,263 | $ | (876 | ) | $ | 98,553 | $ | (7,443 | ) | |||||||
60
Table of Contents
3. LOANS
Loans are stated at their face amount, net of unearned income, and consist of the following at December 31, 2009 and 2008 (dollars in thousands):
| 2009 | 2008 | |||||
| Mortgage loans on real estate: |
||||||
| Residential 1-4 family |
$ | 349,277 | $ | 292,003 | ||
| Commercial |
643,354 | 588,001 | ||||
| Construction |
307,726 | 403,502 | ||||
| Second mortgages |
34,942 | 38,060 | ||||
| Equity lines of credit |
182,449 | 162,740 | ||||
| Agriculture |
26,191 | 30,727 | ||||
| Total real estate loans |
1,543,939 | 1,515,033 | ||||
| Commercial Loans | 126,157 | 146,827 | ||||
| Consumer installment loans | ||||||
| Personal |
148,811 | 160,161 | ||||
| Credit cards |
17,743 | 15,723 | ||||
| Total consumer installment loans |
166,554 | 175,884 | ||||
| All other loans | 37,574 | 36,344 | ||||
| Gross loans |
$ | 1,874,224 | $ | 1,874,088 | ||
At December 31, 2009 and 2008, the recorded investment in loans that have been identified as impaired loans, totaled $129.4 million and $53.7 million, respectively. The valuation allowance related to $62.1 million and $24.1 million of impaired loans at December 31, 2009 and 2008 was $7.6 million and $3.8 million, respectively. The remaining impaired loans of $67.3 million and 29.6 million at December 31, 2009 and 2008 did not require a valuation allowance. For the years ended December 31, 2009, 2008 and 2007, the average investment in impaired loans was $109.7 million, $38.6 million and $8.9 million, respectively. The interest income recorded on impaired loans was approximately $3.4 million, 1.9 million and zero in 2009, 2008 and 2007, respectively.
Nonaccrual loans totaled $22.2 million and $14.4 million at December 31, 2009 and 2008, respectively. Had these loans performed in accordance with their original terms, interest income of approximately $566 thousand, $560 thousand and $422 thousand would have been recorded in 2009, 2008 and 2007, respectively. There were no non-accrual loans excluded from impaired loan disclosure at December 31, 2009 and 2008. Loans past due 90 days or more and accruing interest totaled $7.3 million and $3.1 million at December 31, 2009 and 2008, respectively.
61
Table of Contents
4. ALLOWANCE FOR LOAN LOSSES
Activity in the allowance for loan losses for the years ended December 31, 2009, 2008 and 2007 is summarized below (dollars in thousands):
| 2009 | 2008 | 2007 | ||||||||||
| Balance, beginning of year | $ | 25,496 | $ | 19,336 | $ | 19,148 | ||||||
| Recoveries credited to allowance | 1,150 | 340 | 340 | |||||||||
| Loans charged off | (14,408 | ) | (4,200 | ) | (1,212 | ) | ||||||
| Provision charged to operations | 18,246 | 10,020 | 1,060 | |||||||||
| Balance, end of year |
$ | 30,484 | $ | 25,496 | $ | 19,336 | ||||||
5. BANK PREMISES AND EQUIPMENT
Bank premises and equipment as of December 31, 2009 and 2008 are as follows (dollars in thousands):
| 2009 | 2008 | |||||
| Land | $ | 19,739 | $ | 17,467 | ||
| Land improvements and buildings | 58,519 | 56,508 | ||||
| Leasehold improvements | 1,703 | 1,739 | ||||
| Furniture and equipment | 28,723 | 27,921 | ||||
| Construction in progress | 8,140 | 7,126 | ||||
| Total |
116,824 | 110,761 | ||||
| Less accumulated depreciation and amortization |
38,102 | 33,336 | ||||
| Bank premises and equipment, net |
$ | 78,722 | $ | 77,425 | ||
Depreciation expense for 2009, 2008 and 2007 was $5.1 million, $5.3 million, and $4.7 million, respectively. Future minimum rental payments required under non-cancelable operating leases for bank premises that have initial or remaining terms in excess of one year as of December 31, 2009 are as follows (dollars in thousands):
| 2010 |
$ | 1,830 | |
| 2011 |
1,606 | ||
| 2012 |
1,308 | ||
| 2013 |
783 | ||
| 2014 |
559 | ||
| Thereafter |
2,698 | ||
| Total of future payments |
$ | 8,784 | |
The leases contain options to extend for periods up to 20 years. Rental expense for years ended December 31, 2009, 2008 and 2007 totaled $2.2 million, $2.3 million, and $2.0 million, respectively.
6. GOODWILL AND INTANGIBLE ASSETS
The Company has adopted ASC 350 Intangibles - Goodwill and Other (“ASC 350”), which prescribes the accounting for goodwill and intangible assets subsequent to initial recognition. The provisions of ASC 350 discontinue the amortization of goodwill and intangible assets with indefinite lives but require at least an annual impairment review and more frequently if certain impairment indicators are in evidence. Based on the testing for impairment of goodwill and intangible assets, there were no impairment charges for 2009, 2008 or 2007. Core deposit intangible assets are being amortized over the periods of expected benefit, which range from 5 to 15 years.
62
Table of Contents
Information concerning goodwill and intangible assets for years ended December 31, 2009 and 2008 is presented in the following table (dollars in thousands):
| Gross Carrying Value |
Accumulated Amortization |
Net Carrying Value | |||||||
| December 31, 2009 | |||||||||
| Amortizable core deposit intangibles |
$ | 20,215 | $ | 12,525 | $ | 7,690 | |||
| Unamortizable goodwill |
56,816 | 342 | 56,474 | ||||||
| December 31, 2008 | |||||||||
| Amortizable core deposit intangibles |
$ | 20,215 | $ | 10,602 | $ | 9,613 | |||
| Unamortizable goodwill |
56,816 | 342 | 56,474 | ||||||
Amortization expense of core deposit intangibles for the years ended December 31, 2009, 2008 and 2007 totaled $1.9 million, $2.0 million and $1.9 million, respectively. As of December 31, 2009, the estimated amortization expense of core deposit intangibles are as follows (dollars in thousands):
| 2010 |
$ | 1,924 | |
| 2011 |
1,874 | ||
| 2012 |
1,687 | ||
| 2013 |
924 | ||
| 2014 |
536 | ||
| Thereafter |
745 | ||
| Total estimated amortization expense |
$ | 7,690 | |
7. DEPOSITS
The aggregate amount of time deposits in denominations of $100,000 or more as of December 31, 2009 and 2008 was $407.9 million and $452.3 million, respectively. As of December 31, 2009, the scheduled maturities of time deposits are as follows (dollars in thousands):
| 2010 |
$ | 541,860 | |
| 2011 |
190,389 | ||
| 2012 |
24,917 | ||
| 2013 |
39,206 | ||
| 2014 |
51,450 | ||
| Thereafter |
9,161 | ||
| Total scheduled maturities of time deposits |
$ | 856,983 | |
63
Table of Contents
8. BORROWINGS
Total short-term borrowings consist of securities sold under agreements to repurchase, which are secured transactions with customers and generally mature the day following the date sold. Also included in total short-term borrowings are Federal funds purchased, which are unsecured overnight borrowings from other financial institutions, and advances from the Federal Home Loan Bank of Atlanta (“FHLB”), which are secured by mortgage-related assets. The carrying value of the loans pledged as collateral for FHLB advances total $782.1 million as of December 31, 2009. Total short-term borrowings consist of the following as of December 31, 2009 and 2008 (dollars in thousands):
| 2009 | 2008 | |||||||
| Securities sold under agreements to repurchase |
$ | 50,550 | $ | 68,282 | ||||
| Other short-term borrowings |
115,201 | 55,000 | ||||||
| Total short-term borrowings |
$ | 165,751 | $ | 123,282 | ||||
| Maximum month-end outstanding balance |
$ | 165,751 | $ | 267,311 | ||||
| Average outstanding balance during the year |
99,095 | 188,442 | ||||||
| Average interest rate during the year |
2.31 | % | 2.54 | % | ||||
| Average interest rate at end of year |
0.90 | % | 1.73 | % | ||||
At December 31, 2009, the Company’s fixed-rate long-term debt totaling $140.0 million, is made up of FHLB advances and matures on various dates through 2018 at interest rates that range from 3.60% to 3.84%. At December 31, 2008, the Company’s fixed-rate long-term debt totaled $150.0 million and matured on various dates through 2018.
As of December 31, 2009, the contractual maturities of long-term debt are as follows (dollars in thousands):
| Fixed Rate | Adjustable Rate |
Total | |||||||
| 2010 |
$ | — | $ | — | $ | — | |||
| 2011 |
— | — | — | ||||||
| 2012 |
— | — | — | ||||||
| 2013 |
— | — | — | ||||||
| 2014 |
— | — | — | ||||||
| Thereafter |
140,000 | 60,310 | 200,310 | ||||||
| Total long-term debt |
$ | 140,000 | $ | 60,310 | $ | 200,310 | |||
During the first quarter of 2004, the Company’s Statutory Trust I, a wholly owned subsidiary, was formed for the purpose of issuing redeemable capital securities in connection with the acquisition of Guaranty Financial Corporation. A Trust Preferred Capital Note of $22.5 million was issued through a pooled underwriting. The securities have a LIBOR-indexed floating rate (three month LIBOR plus 2.75%) which adjusts and is payable quarterly. The interest rate at December 31, 2009 was 3.0%. The capital securities were redeemable at par beginning on June 17, 2009 and each quarterly anniversary of such date until the securities mature on June 17, 2034. The principal asset of the Statutory Trust I is $23.2 million of the Company’s junior subordinated debt securities with like maturities and like interest rates to the capital notes, while $696 thousand is reflected as the Company’s investment in Statutory Trust I reported as “Other assets” within the consolidated balance sheet.
During the first quarter of 2006, the Company’s Statutory Trust II, a wholly owned subsidiary, was formed for the purpose of issuing redeemable capital securities in connection with the acquisition of Prosperity that was completed on April 1, 2006. A Trust Preferred Capital Note of $36.0 million was issued through a pooled underwriting. The securities have a LIBOR-indexed floating rate (three month
64
Table of Contents
LIBOR plus 1.40%) which adjusts and is payable quarterly. The interest rate at December 31, 2009 was 1.65%. The redeemable securities may be called at par after five years on March 31, 2011 and each quarterly anniversary of such date until the securities mature in 30 years on March 31, 2036. The principal asset of the Statutory Trust II is $37.1 million of the Company’s junior subordinated debt securities with like maturities and like interest rates to the capital notes, while $1.1 million is reflected as the Company’s investment in Statutory Trust II reported as “Other assets” within the consolidated balance sheet.
The obligations of the Company with respect to the issuance of the capital securities constitute a full and unconditional guarantee by the Company of the trust’s obligations with respect to the capital securities. Subject to certain exceptions and limitations, the Company may elect from time to time to defer interest payments on the junior subordinated debt securities, which would result in a deferral of distribution payments on the related capital securities and require a deferral of common dividends.
The subsidiary banks maintain Federal funds lines with several correspondent banks totaling $92 million for both years ended December 31, 2009 and 2008, respectively. Additionally, the Company had a collateral dependent line of credit with the FHLB of up to $755.5 million and $676.0 million for the years ended December 31, 2009 and 2008, respectively.
9. INCOME TAXES
The Company files income tax returns in the U. S. and the Commonwealth of Virginia. With few exceptions, the Company is no longer subject to U. S. federal, state and local income tax examinations by tax authorities for years prior to 2006.
Net deferred tax assets and liabilities consist of the following components as of December 31, 2009 and 2008 (dollars in thousands):
| 2009 | 2008 | |||||
| Deferred tax assets: |
||||||
| Allowance for loan losses |
$ | 10,669 | $ | 9,044 | ||
| Benefit plans |
996 | 891 | ||||
| Nonaccrual loans |
357 | 286 | ||||
| Securities available for sale |
— | 911 | ||||
| Other |
829 | 400 | ||||
| Total deferred tax assets |
12,851 | 11,532 | ||||
| Deferred tax liabilities: |
||||||
| Depreciation |
2,694 | 2,593 | ||||
| Purchase accounting intangibles |
1,846 | 2,364 | ||||
| Other |
772 | 550 | ||||
| Securities available for sale |
2,410 | — | ||||
| Total deferred tax liabilities |
7,722 | 5,507 | ||||
| Net deferred tax asset |
$ | 5,129 | $ | 6,025 | ||
In assessing the ability to realize deferred tax assets, management considers the scheduled reversal of temporary differences, projected future taxable income, and tax planning strategies. Management believes it is more likely than not the Company will realize its deferred tax assets and, accordingly, no valuation allowance has been established.
65
Table of Contents
The provision for income taxes charged to operations for the years ended December 31, 2009, 2008 and 2007 consists of the following (dollars in thousands):
| 2009 | 2008 | 2007 | |||||||||
| Current tax expense |
$ | 3,315 | $ | 5,571 | $ | 6,246 | |||||
| Deferred tax expense (benefit) |
(2,425 | ) | (1,313 | ) | 238 | ||||||
| Income tax expense |
$ | 890 | $ | 4,258 | $ | 6,484 | |||||
The income tax expense differs from the amount of income tax determined by applying the U. S. federal income tax rate to pretax income for the years ended December 31, 2009, 2008, and 2007, due to the following (dollars in thousands):
| 2009 | 2008 | 2007 | ||||||||||
| Computed “expected” tax expense |
$ | 3,238 | $ | 6,570 | $ | 9,184 | ||||||
| (Decrease) in taxes resulting from: |
||||||||||||
| Tax-exempt interest income, net |
(2,180 | ) | (1,978 | ) | (1,698 | ) | ||||||
| Other, net |
(168 | ) | (334 | ) | (1,002 | ) | ||||||
| Income tax expense |
$ | 890 | $ | 4,258 | $ | 6,484 | ||||||
The effective tax rates were 9.6%, 22.7%, and 24.7% for years ended December 31, 2009, 2008, and 2007, respectively. Tax credits totaled $172 thousand, $158 thousand, and $172 thousand, for the years ended December 31, 2009, 2008, and 2007, respectively.
10. EMPLOYEE BENEFITS
The Company has a 401(k) Plan that allows employees to make pre-tax contributions for retirement. The 401(k) Plan provides for matching contributions by the Company for employee contributions up to 3% of each employee’s compensation. The Company also has an Employee Stock Ownership Plan (“ESOP”). The Company makes discretionary profit sharing contributions into the 401(k) Plan, ESOP and in cash. Company discretionary contributions to both the 401(k) Plan and the ESOP are allocated to participant accounts in proportion to each participant’s compensation and vested over a six year period. Employee contributions to the ESOP are not allowed. The 401(k) Plan does provide for limited investment in the Company’s common stock. Company discretionary profit sharing payments made in 2009, 2008, and 2007 were as follows (dollars in thousands):
| 2009 | 2008 | 2007 | |||||||
| 401(k) Plan |
$ | 1,115 | $ | 1,355 | $ | 1,780 | |||
| ESOP |
289 | 586 | 1,061 | ||||||
| Cash |
226 | 373 | 296 | ||||||
| Total |
$ | 1,630 | $ | 2,314 | $ | 3,137 | |||
The Company has an obligation to certain members of the subsidiary banks’ Boards of Directors under deferred compensation plans in the amount of $1.0 million at December 31, 2009 and $1.1 million at December 31, 2008. The expenses related to the deferred compensation plans were $102 thousand, $85 thousand and $89 thousand for the years ended December 31, 2009, 2008 and 2007, respectively. These benefits will be fully funded by life insurance proceeds.
66
Table of Contents
The Company’s Board of Directors have approved an annual incentive compensation plan as a means of attracting, rewarding and retaining key executives. Each annual plan, as it may be amended from time to time, is based on both corporate and individual objectives established annually for each participant. Each participant is evaluated within these two categories to determine eligibility and rate of incentive compensation based on performance. Salaries and benefits expense were zero, $366 thousand, and $310 thousand for the years ended December 31, 2009, 2008, and 2007, respectively, for incentive compensation under this plan.
The Company’s 2003 Stock Incentive Plan provides for the granting of incentive stock options, non-statutory stock options, and nonvested stock awards to key employees of the Company and its subsidiaries. The Company’s 2003 Stock Incentive Plan replaced the 1993 Stock Incentive Plan, and became effective on July 1, 2003, after shareholders approved the plan at the annual meeting of shareholders held in 2003. The Stock Incentive Plan makes available 525,000 shares (adjusted for any stock splits), which may be awarded to employees of the Company and its subsidiaries in the form of incentive stock options intended to comply with the requirements of Section 422 of the Internal Revenue Code of 1986 (“incentive stock options”), non-statutory stock options, and nonvested stock. Under the plan, the option price cannot be less than the fair market value of the stock on the grant date. The stock option’s maximum term is ten years from the date of grant and vests in equal annual installments of twenty percent over a five year vesting schedule. The Company issues new shares to satisfy share-based awards. As of December 31, 2009, approximately 273,700 shares were available for issuance under the Company’s 2003 Stock Incentive Plan.
Stock Options
The following table summarizes the stock option activity for the last three years:
| Number of Stock Options |
Weighted Average Exercise Price |
Options Exercisable |
Weighted Average Exercise Price | ||||||||
| Balance, December 31, 2006 |
304,536 | $ | 18.28 | 247,438 | $ | 16.71 | |||||
| Granted |
22,400 | 27.62 | |||||||||
| Exercised |
(46,743 | ) | 14.19 | ||||||||
| Forfeited |
(2,830 | ) | 26.65 | ||||||||
| Balance, December 31, 2007 |
277,363 | 19.64 | 219,875 | 17.62 | |||||||
| Granted |
4,750 | 20.41 | |||||||||
| Exercised |
(59,461 | ) | 13.83 | ||||||||
| Forfeited |
(6,575 | ) | 22.41 | ||||||||
| Balance, December 31, 2008 |
216,077 | 21.12 | 175,278 | 19.62 | |||||||
| Granted |
3,490 | 12.59 | |||||||||
| Exercised |
(1,800 | ) | 9.67 | ||||||||
| Forfeited |
(1,587 | ) | 26.48 | ||||||||
| Balance, December 31, 2009 |
216,180 | 21.03 | 187,224 | 20.24 | |||||||
67
Table of Contents
A summary of options outstanding at December 31, 2009 is as follows:
| Range of Exercise Prices |
Options Outstanding |
Options Exercisable | ||||||||||||||
| Number Outstanding |
Weighted Average Remaining Contractual Life |
Weighted Average Exercise Price |
Number Exercisable |
Weighted Average Exercise Price | ||||||||||||
| $ 8.54 |
- | $ 8.67 |
13,398 | 0.76 yrs | $ | 8.58 | 13,398 | $ | 8.58 | |||||||
| 10.67 |
23,385 | 2.00 | 10.67 | 23,385 | 10.67 | |||||||||||
| 12.59 |
3,490 | 9.15 | 12.59 | — | — | |||||||||||
| 18.58 |
47,940 | 3.06 | 18.58 | 47,940 | 18.58 | |||||||||||
| 18.98 |
- | 20.41 |
10,000 | 5.87 | 20.17 | 6,200 | 20.02 | |||||||||
| 22.65 |
46,699 | 4.08 | 22.65 | 46,699 | 22.65 | |||||||||||
| 23.50 |
- | 27.51 |
24,338 | 5.15 | 24.12 | 24,338 | 24.12 | |||||||||
| 27.62 |
20,470 | 7.15 | 27.62 | 8,188 | 27.62 | |||||||||||
| 31.57 |
23,460 | 6.15 | 31.57 | 14,076 | 31.57 | |||||||||||
| 31.84 |
3,000 | 5.96 | 31.84 | 3,000 | 31.84 | |||||||||||
| $ 8.54 |
- | $ 31.84 |
216,180 | 4.25 yrs | $ | 21.03 | 187,224 | $ | 20.24 | |||||||
The fair value of each stock option grant was estimated on the date of grant using the Black-Scholes option valuation model that uses the assumptions noted in the following table for the years ended December 31, 2009, 2008 and 2007:
| 2009 | 2008 | 2007 | ||||||||||
| Dividend yield |
2.45 | % | 2.29 | % | 1.99 | % | ||||||
| Expected life in years |
7.2 | 7.8 | 7.5 | |||||||||
| Expected volatility |
34.84 | % | 29.89 | % | 25.23 | % | ||||||
| Risk-free interest rate |
2.80 | % | 3.68 | % | 4.68 | % | ||||||
| Weighted average fair value per option granted |
$ | 3.89 | $ | 6.15 | $ | 8.07 | ||||||
The following table summarizes information concerning stock options issued to the Company’s employees that are vested or are expected to vest and stock options exercisable as of December 31, 2009 (dollars in thousands, except share and per share amounts):
| Stock Options Vested or Expected to Vest |
Exercisable | |||||
| Stock options |
210,869 | 187,224 | ||||
| Weighted average remaining contractual life in years |
4.18 | 3.79 | ||||
| Weighted average exercise price per share on shares above water |
$ | 10.01 | $ | 10.04 | ||
| Aggregate intrinsic value |
$ | 91 | $ | 91 | ||
The total intrinsic value for stock options exercised during the year ended December 31, 2009 was $15 thousand. The total intrinsic values of stock options outstanding and exercisable at December 31, 2009 and December 31, 2008 were $91 thousand and $1.0 million, respectively. The fair value of stock options vested during the year ended December 31, 2009 was approximately $173 thousand. Cash received from the exercise of stock options for the year ended December 31, 2009 was approximately $17 thousand. The tax benefits realized from tax deductions associated with options exercised during the year ended December 31, 2009 was $4 thousand.
68
Table of Contents
Nonvested Stock
The 2003 Stock Incentive Plan permits the granting of nonvested stock, but is limited to one-third of the aggregate number of total awards granted. This equity component of compensation is divided between restricted (time-based) stock grants and performance-based stock grants. Generally, the restricted stock vests fifty percent on each of the third and fourth anniversaries from the date of the grant. The performance-based stock is subject to vesting on the fourth anniversary of the date of the grant based on the performance of the Company’s stock price. The value of the nonvested stock awards was calculated by multiplying the fair market value of the Company’s common stock on grant date by the number of shares awarded. Employees have the right to vote the shares and to receive cash or stock dividends (restricted stock), if any, except for the nonvested stock under the performance-based component (performance stock).
The following table summarizes nonvested stock activity for the year ended December 31, 2009:
| Restricted Stock | Weighted Average Grant-Date Fair Value | |||||
| Balance, December 31, 2008 |
58,954 | $ | 26.95 | |||
| Granted |
36,172 | 12.63 | ||||
| Vested |
(14,474 | ) | 25.68 | |||
| Forfeited |
(1,133 | ) | 27.55 | |||
| Balance, December 31, 2009 |
79,520 | 20.66 | ||||
The estimated unamortized compensation expense, net of estimated forfeitures, related to nonvested stock and stock options issued and outstanding as of December 31, 2009 will be recognized in future periods is as follows (dollars in thousands):
| Stock Options | Restricted Stock | Total | |||||||
| For year ended December 31, 2010 |
$ | 92 | $ | 288 | $ | 380 | |||
| For year ended December 31, 2011 |
54 | 114 | 168 | ||||||
| For year ended December 31, 2012 |
16 | 120 | 136 | ||||||
| For year ended December 31, 2013 |
2 | 95 | 97 | ||||||
| Total |
$ | 164 | $ | 617 | $ | 781 | |||
At December 31, 2009, there was $781 thousand of total unrecognized compensation cost related to nonvested stock-based compensation arrangements granted under the plan. The cost is expected to be recognized through 2013.
11. FINANCIAL INSTRUMENTS WITH OFF-BALANCE SHEET RISK
The Company is a party to financial instruments with off-balance sheet risk in the normal course of business to meet the financing needs of its customers and to reduce its own exposure to fluctuations in interest rates. These financial instruments include commitments to extend credit and standby letters of credit. These instruments involve elements of credit and interest rate risk in excess of the amount recognized in the consolidated balance sheets. The contractual amounts of these instruments reflect the extent of the Company’s involvement in particular classes of financial instruments.
69
Table of Contents
The Company’s exposure to credit loss in the event of nonperformance by the other party to the financial instruments for commitments to extend credit and letters of credit written is represented by the contractual amount of these instruments. The Company uses the same credit policies in making commitments and conditional obligations as it does for on-balance sheet instruments. Unless noted otherwise, the Company does not require collateral or other security to support off-balance sheet financial instruments with credit risk.
Commitments to extend credit are agreements to lend to customers as long as there are no violations of any conditions established in the contracts. Commitments generally have fixed expiration dates or other termination clauses and may require payment of a fee. Because many of the commitments may expire without being completely drawn upon, the total commitment amounts do not necessarily represent future cash requirements. The Company evaluates each customer’s creditworthiness on a case by case basis. At December 31, 2009 and 2008, the Company had outstanding loan commitments approximating $462.5 million and $538.6 million, respectively.
Letters of credit written are conditional commitments issued by the Company to guarantee the performance of customers to third parties. The credit risk involved in issuing letters of credit is essentially the same as that involved in extending loans to customers. The amount of standby letters of credit whose contract amounts represent credit risk totaled $24.4 million and $28.0 million at December 31, 2009 and 2008, respectively.
At December 31, 2009, Union Mortgage had rate lock commitments to originate mortgage loans amounting to $111.1 million and loans held for sale of $54.3 million. Union Mortgage has entered into corresponding mandatory commitments on a best-efforts basis to sell loans on a servicing released basis totaling approximately $165.4 million. These commitments to sell loans are designed to eliminate Union Mortgage’s exposure to fluctuations in interest rates in connection with rate lock commitments and loans held for sale.
12. RELATED PARTY TRANSACTIONS
The Company has entered into transactions with its directors, principal officers and affiliated companies in which they are principal stockholders. Such transactions were made in the ordinary course of business on substantially the same terms, including interest rates and collateral, as those prevailing at the same time for comparable transactions with other customers, and did not, in the opinion of management, involve more than normal credit risk or present other unfavorable features. The aggregate amount of loans to such related parties totaled $21.9 million and $22.7 million at December 31, 2009 and 2008, respectively. During 2009, new advances to such related parties amounted to $14.1 million and repayments amounted to $14.9 million.
13. EARNINGS PER SHARE
The basic EPS calculation was computed by dividing net income available to common stockholders by the weighted average number of common shares outstanding during the period. Diluted EPS is computed using the weighted average number of common shares outstanding during the period, including the effect of dilutive potential common shares outstanding attributable to stock awards and warrant. Amortization of discount and dividends on the preferred stock is treated as a reduction of the numerator in calculating basic and diluted EPS.
There were approximately 176,531; 131,301 and 98,126 shares underlying anti-dilutive options as of December 31, 2009, 2008, and 2007, respectively, which were excluded from the calculation of diluted EPS.
70
Table of Contents
The following is a reconciliation of the denominators of the basic and diluted EPS computations for the years ended December 31, 2009, 2008 and 2007 (in thousands except per share data):
| Net Income Available to Common Stockholders (Numerator) |
Weighted Average Shares (Denominator) |
Per Share Amount |
|||||||
| For the Year Ended December 31, 2009 |
|||||||||
| Basic EPS |
$ | 2,874 | 15,161 | $ | 0.19 | ||||
| Effect of dilutive stock awards |
— | 41 | — | ||||||
| Diluted EPS |
$ | 2,874 | 15,202 | $ | 0.19 | ||||
| For the Year Ended December 31, 2008 |
|||||||||
| Basic EPS |
$ | 14,496 | 13,478 | $ | 1.08 | ||||
| Effect of dilutive stock awards |
— | 52 | (0.01 | ) | |||||
| Effect of dilutive warrant |
— | 13 | — | ||||||
| Diluted EPS |
$ | 14,496 | 13,543 | $ | 1.07 | ||||
| For the Year Ended December 31, 2007 |
|||||||||
| Basic EPS |
$ | 19,756 | 13,342 | $ | 1.48 | ||||
| Effect of dilutive stock awards |
— | 80 | (0.01 | ) | |||||
| Diluted EPS |
$ | 19,756 | 13,422 | $ | 1.47 | ||||
14. COMMITMENTS AND LIABILITIES
In the ordinary course of its operations, the Company and its subsidiaries are parties to various legal proceedings. Based on the information presently available, and after consultation with legal counsel, management believes that the ultimate outcome in such proceedings, in the aggregate, will not have a material adverse effect on the business or the financial condition or results of operations of the Company.
The Company must maintain a reserve against its deposits in accordance with Regulation D of the Federal Reserve Act. For the final weekly reporting period in the years ended December 31, 2009 and 2008, the aggregate amount of daily average required reserves was approximately $5.6 million and $6.8 million, respectively.
The Company has approximately $1.9 million in deposits in other financial institutions in excess of amounts insured by the FDIC at December 31, 2009.
15. REGULATORY MATTERS AND CAPITAL
The Company and its subsidiary banks are subject to various regulatory capital requirements administered by the federal banking agencies. Failure to meet minimum capital requirements can initiate certain mandatory - and possibly additional discretionary - actions by regulators that, if undertaken, could have a direct material effect on financial statements of the Company and the subsidiary banks. Under capital adequacy guidelines and the regulatory framework for prompt corrective action, the Company and the subsidiary banks must meet specific capital guidelines that involve quantitative measures of their assets, liabilities and certain off-balance sheet items as calculated under regulatory accounting practices. The capital amounts and classification are also subject to qualitative judgments by the regulators about components, risk weightings and other factors. Prompt corrective action provisions are not applicable to bank holding companies.
71
Table of Contents
Quantitative measures established by regulation to ensure capital adequacy require the Company and subsidiary banks to maintain minimum amounts and ratios of Total to Risk-Weighted Assets (as defined) and Tier I capital (as defined) to Average Assets (as defined) and Risk-Weighted Assets. Management believes, as of December 31, 2009, that the Company met all capital adequacy requirements to which it is subject.
As of December 31, 2009, the most recent notification from their federal regulators categorized the subsidiary banks as well capitalized under the regulatory framework for prompt corrective action. To be categorized as well-capitalized, an institution must maintain minimum total risk-based, Tier I risk-based and Tier I leverage ratios as set forth in the following tables. There are no conditions or events since that notification that management believes have changed the subsidiary banks’ category.
On December 19, 2008, the Company entered into a Letter Agreement (the “Purchase Agreement”) with the United States Department of the Treasury (“Treasury”), pursuant to which it issued 59,000 shares of the Company’s Fixed Rate Cumulative Perpetual Preferred Stock, Series A (the “Preferred Stock”) for $59 million. The issuance was made pursuant to the Treasury’s Capital Purchase Program (“CPP”) under the Troubled Asset Relief Program. In November 2009, the Company redeemed the Preferred Stock, by repaying, with accumulated dividends, the $59 million it received in December 2008. Additionally, in December 2009, the Company entered into a Warrant Repurchase Letter Agreement (“Warrant Repurchase”) with the Treasury to repurchase a warrant to purchase 211,318 shares of the Company’s common stock that was issued in connection with the Company’s sale of Preferred Stock. As a result of the Warrant Repurchase, the Company had no securities issued or outstanding to the Treasury and was no longer participating in the Treasury’s CPP as of November 18, 2009.
The Company and its principal banking subsidiaries’ actual capital amounts and ratios are also presented in the following table at December 31, 2009 and 2008 (dollars in thousands):
| Actual | Required for Capital Adequacy Purposes |
Required in Order to Be Well Capitalized Under PCA |
||||||||||||||||
| Amount | Ratio | Amount | Ratio | Amount | Ratio | |||||||||||||
| As of December 31, 2009 |
||||||||||||||||||
| Total capital to risk weighted assets: |
||||||||||||||||||
| UBSH Consolidated |
$ | 297,722 | 14.70 | % | $ | 161,986 | 8.00 | % | NA | NA | ||||||||
| Union Bank and Trust |
188,928 | 11.41 | % | 132,513 | 8.00 | % | $ | 165,642 | 10.00 | % | ||||||||
| Northern Neck State Bank |
31,490 | 13.46 | % | 18,720 | 8.00 | % | 23,400 | 10.00 | % | |||||||||
| Tier 1 capital to risk weighted assets: |
||||||||||||||||||
| UBSH Consolidated |
272,348 | 13.45 | % | 80,993 | 4.00 | % | NA | NA | ||||||||||
| Union Bank and Trust |
168,484 | 10.17 | % | 66,257 | 4.00 | % | 99,385 | 6.00 | % | |||||||||
| Northern Neck State Bank |
29,497 | 12.61 | % | 9,360 | 4.00 | % | 14,040 | 6.00 | % | |||||||||
| Tier 1 capital to average adjusted assets: |
||||||||||||||||||
| UBSH Consolidated |
272,348 | 10.86 | % | 100,315 | 4.00 | % | NA | NA | ||||||||||
| Union Bank and Trust |
168,484 | 8.57 | % | 78,660 | 4.00 | % | 98,324 | 5.00 | % | |||||||||
| Northern Neck State Bank |
29,497 | 8.40 | % | 14,047 | 4.00 | % | 17,558 | 5.00 | % | |||||||||
| As of December 31, 2008 |
||||||||||||||||||
| Total capital to risk weighted assets: |
||||||||||||||||||
| UBSH Consolidated |
$ | 293,317 | 14.56 | % | $ | 161,201 | 8.00 | % | NA | NA | ||||||||
| Union Bank and Trust |
185,582 | 11.26 | % | 131,806 | 8.00 | % | $ | 164,758 | 10.00 | % | ||||||||
| Northern Neck State Bank |
30,428 | 12.29 | % | 19,808 | 8.00 | % | 24,760 | 10.00 | % | |||||||||
| Tier 1 capital to risk weighted assets: |
||||||||||||||||||
| UBSH Consolidated |
268,126 | 13.31 | % | 80,600 | 4.00 | % | NA | NA | ||||||||||
| Union Bank and Trust |
164,964 | 10.01 | % | 65,903 | 4.00 | % | 98,855 | 6.00 | % | |||||||||
| Northern Neck State Bank |
28,428 | 11.48 | % | 9,904 | 4.00 | % | 14,856 | 6.00 | % | |||||||||
| Tier 1 capital to average adjusted assets: |
||||||||||||||||||
| UBSH Consolidated |
268,126 | 11.14 | % | 96,294 | 4.00 | % | NA | NA | ||||||||||
| Union Bank and Trust |
164,964 | 8.87 | % | 74,426 | 4.00 | % | 93,032 | 5.00 | % | |||||||||
| Northern Neck State Bank |
28,428 | 8.24 | % | 13,807 | 4.00 | % | 17,258 | 5.00 | % | |||||||||
72
Table of Contents
16. FAIR VALUE MEASUREMENTS
The Company adopted ASC 820 Fair Value Measurements and Disclosures (“ASC 820”), on January 1, 2008 to record fair value adjustments to certain assets and liabilities and to determine fair value disclosures. This statement clarifies that fair value of certain assets and liabilities is an exit price, representing the amount that would be received to sell an asset or paid to transfer a liability in an orderly transaction between willing market participants.
ASC 820 specifies a hierarchy of valuation techniques based on whether the inputs to those valuation techniques are observable or unobservable. Observable inputs reflect market data obtained from independent sources, while unobservable inputs reflect the Company’s market assumptions. The three levels of the fair value hierarchy under ASC 820 based on these two types of inputs are as follows:
| Level 1 | Valuation is based on quoted prices in active markets for identical assets and liabilities. | |||
| Level 2 | Valuation is based on observable inputs including quoted prices in active markets for similar assets and liabilities, quoted prices for identical or similar assets and liabilities in less active markets, and model-based valuation techniques for which significant assumptions can be derived primarily from or corroborated by observable data in the markets. | |||
| Level 3 | Valuation is based on model-based techniques that use one or more significant inputs or assumptions that are unobservable in the market. These unobservable inputs reflect the Company’s assumptions about what market participants would use and information that is reasonably available under the circumstances without undue cost and effort. | |||
The following describes the valuation techniques used by the Company to measure certain financial assets and liabilities recorded at fair value on a recurring basis in the financial statements:
Securities available for sale
Securities available for sale are recorded at fair value on a recurring basis. Fair value measurement is based upon quoted market prices, when available (Level 1). If quoted market prices are not available, fair values are measured utilizing independent valuation techniques of identical or similar securities for which significant assumptions are derived primarily from or corroborated by observable market data. Third party vendors compile prices from various sources and may determine the fair value of identical or similar securities by using pricing models that consider observable market data (Level 2). If the inputs used to provide the evaluation for certain securities are unobservable and/or there is little, if any, market activity then the security would fall to the lowest level of the hierarchy (Level 3). The carrying value of restricted Federal Reserve Bank and FHLB stock approximates fair value based on the redemption provisions of each entity and is therefore excluded from the following table.
73
Table of Contents
The following table presents the balances of financial assets and liabilities measured at fair value on a recurring basis at December 31, 2009 and 2008 (dollars in thousands):
| Fair Value Measurements using | ||||||||||||
| Quoted Prices in Active Markets for Identical Assets |
Significant Other Observable Inputs |
Significant Unobservable Inputs |
||||||||||
| Level 1 | Level 2 | Level 3 | Balance | |||||||||
| ASSETS |
||||||||||||
| 2009 |
||||||||||||
| Securities available for sale |
$ | — | $ | 381,950 | $ | — | $ | 381,950 | ||||
| Total |
$ | — | $ | 381,950 | $ | — | $ | 381,950 | ||||
| ASSETS |
||||||||||||
| 2008 |
||||||||||||
| Securities available for sale |
$ | — | $ | 293,157 | $ | — | $ | 293,157 | ||||
| Total |
$ | — | $ | 293,157 | $ | — | $ | 293,157 | ||||
Certain financial assets are measured at fair value on a nonrecurring basis in accordance with GAAP. Adjustments to the fair value of these assets usually result from the application of lower-of-cost-or-market accounting or write-downs of individual assets.
The following describes the valuation techniques used by the Company to measure certain financial assets recorded at fair value on a nonrecurring basis in the financial statements (dollars in thousands):
Loans held for sale
Loans held for sale are carried at the lower of cost or market value. These loans currently consist of residential loans originated for sale in the secondary market. Fair value is based on the price secondary markets are currently offering for similar loans using observable market data which is not materially different than cost due to the short duration between origination and sale (Level 2). As such, the Company records any fair value adjustments on a nonrecurring basis. No nonrecurring fair value adjustments were recorded on loans held for sale during the year ended December 31, 2009. Gains and losses on the sale of loans are recorded within income from the mortgage segment on the Consolidated Statements of Income.
Impaired Loans
Loans are designated as impaired when, in the judgment of management based on current information and events, it is probable that all amounts due according to the contractual terms of the loan agreements will not be collected. The measurement of loss associated with impaired loans can be based on either the observable market price of the loan or the fair value of the collateral. Fair value is measured based on the value of the collateral securing the loans. Collateral may be in the form of real estate or business assets including equipment, inventory, and accounts receivable. The vast majority of the Company’s collateral is real estate. The value of real estate collateral is determined utilizing an income or market valuation approach based on an appraisal conducted by an independent, licensed appraiser using observable market data (Level 2). However, if the collateral is a house or building in the process of construction or if an appraisal of the property is more than two years old, then a Level 3 valuation is considered to measure the fair value. The value of business equipment is based upon an outside appraisal if deemed significant, or the net book value on the applicable business’s financial statements if not considered significant using observable market data. Likewise, values for inventory and accounts receivables collateral are based on financial statement balances or aging reports (Level 3). Impaired
74
Table of Contents
loans allocated to the allowance for loan losses are measured at fair value on a nonrecurring basis. Any fair value adjustments are recorded in the period incurred as provision for loan losses on the Consolidated Statements of Income. At December 31, 2009 the Company’s Level 3 loans consisted of three relationships secured by commercial real estate of $5.7 million with a $350 thousand valuation reserve; three relationships secured by residential real estate and lots of $3.4 million with a valuation reserve of $746 thousand; six relationships secured by inventory, receivables or equipment of $1.9 million with a $933 thousand valuation reserve; one relationship secured by investment real estate of $1.8 million with a $28 thousand valuation reserve; and one relationship unsecured of $117 thousand fully reserved.
The following table summarizes the Company’s financial assets that were measured at fair value on a nonrecurring basis at December 31, 2009 and 2008 (dollars in thousands):
| Fair Value Measurements using | ||||||||||||
| Quoted Prices in Active Markets for Identical Assets |
Significant Other Observable Inputs |
Significant Unobservable Inputs |
||||||||||
| Level 1 | Level 2 | Level 3 | Balance | |||||||||
| ASSETS |
||||||||||||
| 2009 |
||||||||||||
| Loans held for sale |
$ | — | $ | 54,280 | $ | — | $ | 54,280 | ||||
| Impaired Loans |
— | 111,095 | 10,707 | 121,802 | ||||||||
| Total |
$ | — | $ | 165,375 | $ | 10,707 | $ | 176,082 | ||||
| ASSETS |
||||||||||||
| 2008 |
||||||||||||
| Loans held for sale |
$ | — | $ | 29,424 | $ | — | $ | 29,424 | ||||
| Impaired Loans |
— | 13,899 | 6,371 | 20,270 | ||||||||
| Total |
$ | — | $ | 43,323 | $ | 6,371 | $ | 49,694 | ||||
The Company’s nonfinancial assets and nonfinancial liabilities that are recognized or disclosed at fair value on a nonrecurring basis relate to other real estate owned (“OREO”), goodwill and core deposit intangibles. There were no valuation allowances related to OREO or impairment charges related to goodwill and intangible assets as of December 31, 2009.
The fair value of a financial instrument is the current amount that would be exchanged between willing parties, other than in a forced liquidation. Fair value is best determined based on quoted market prices. However, in many instances, there are no quoted market prices for the Company’s various financial instruments. In cases where quoted market prices are not available, fair values are based on estimates using present value or other valuation techniques. Those techniques are significantly affected by the assumptions used, including the discount rate and estimates of future cash flows. Accordingly, the fair value estimates may not be realized in an immediate settlement of the instruments. ASC 825 Financial Instruments excludes certain financial instruments and all non-financial instruments from its disclosure requirements. Accordingly, the aggregate fair value amounts presented may not necessarily represent the underlying fair value of the Company.
Cash and Cash Equivalents
For those short-term instruments, the carrying amount is a reasonable estimate of fair value.
75
Table of Contents
Loans
The fair value of performing loans is estimated by discounting the future cash flows using the current rates at which similar loans would be made to borrowers with similar credit ratings and for the same remaining maturities. Fair value for significant nonperforming loans is based on recent external appraisals. If appraisals are not available, estimated cash flows are discounted using a rate commensurate with the risk associated with the estimated cash flows.
Deposits
The fair value of demand deposits, savings accounts, and certain money market deposits is the amount payable on demand at the reporting date. The fair value of certificates of deposit is estimated by discounting the future cash flows using the rates currently offered for deposits of similar remaining maturities.
Borrowings
The carrying value of short-term borrowings is a reasonable estimate of fair value. The fair value of long-term borrowings is estimated based on interest rates currently available for debt with similar terms and remaining maturities.
Accrued Interest
The carrying amounts of accrued interest approximate fair value.
Commitments to Extend Credit and Standby Letters of Credit
The fair value of commitments is estimated using the fees currently charged to enter into similar agreements, taking into account the remaining terms of the agreements and the present creditworthiness of the counterparties. For fixed-rate loan commitments, fair value also considers the difference between current levels of interest rates and the committed rates. The fair value of letters of credit is based on fees currently charged for similar agreements or on the estimated cost to terminate them or otherwise settle the obligations with the counterparties at the reporting date. At December 31, 2009 and 2008, the carrying value and fair value of loan commitments and standby letters of credit was immaterial.
The carrying values and estimated fair values of the Company’s financial instruments as of December 31, 2009 and 2008 are as follows (dollars in thousands):
| December 31, 2009 | December 31, 2008 | |||||||||||
| Carrying Amount |
Fair Value |
Carrying Amount |
Fair Value | |||||||||
| Financial assets: |
||||||||||||
| Cash and cash equivalents |
$ | 45,911 | $ | 45,911 | $ | 148,537 | $ | 148,537 | ||||
| Securities available for sale |
400,591 | 400,591 | 309,711 | 309,711 | ||||||||
| Loans held for sale |
54,280 | 54,280 | 29,424 | 29,424 | ||||||||
| Net loans |
1,843,740 | 1,843,419 | 1,848,592 | 1,849,240 | ||||||||
| Accrued interest receivable |
11,546 | 11,546 | 10,230 | 10,230 | ||||||||
| Financial liabilities: |
||||||||||||
| Deposits |
1,916,364 | 1,923,918 | 1,926,999 | 1,953,527 | ||||||||
| Borrowings |
366,061 | 356,282 | 333,592 | 334,622 | ||||||||
| Accrued interest payable |
2,012 | 2,012 | 3,572 | 3,572 | ||||||||
The Company assumes interest rate risk (the risk that general interest rate levels will change) as a result of its normal operations. As a result, the fair values of the Company’s financial instruments will change when interest rate levels change and that change may be either favorable or unfavorable to the Company. Management attempts to match maturities of assets and liabilities to the extent believed necessary to
76
Table of Contents
minimize interest rate risk. However, borrowers with fixed rate obligations are less likely to prepay in a rising rate environment and more likely to prepay in a falling rate environment. Conversely, depositors who are receiving fixed rates are more likely to withdraw funds before maturity in a rising rate environment and less likely to do so in a falling rate environment. Management monitors rates and maturities of assets and liabilities and attempts to minimize interest rate risk by adjusting terms of new loans and deposits and by investing in securities with terms that mitigate the Company’s overall interest rate risk.
17. PARENT COMPANY FINANCIAL INFORMATION
The primary sources of funds for the dividends paid by Union Bankshares Corporation (the “Parent Company”) are dividends received from its subsidiary banks. The payments of dividends by the subsidiary banks to the Parent Company are subject to certain statutory limitations which contemplate that the current year earnings and earnings retained for the two preceding years may be paid to the Parent Company without regulatory approval. As of December 31, 2009, the aggregate amount of unrestricted funds, which could be transferred from the Company’s subsidiaries to the Parent Company, without prior regulatory approval, totaled approximately $13.1 million, or 4.6%, of the consolidated net assets. Financial information for the Parent Company is as follows:
PARENT COMPANY
BALANCE SHEETS
AS OF DECEMBER 31, 2009 and 2008
(Dollars in thousands)
| 2009 | 2008 | ||||||
| ASSETS |
|||||||
| Cash |
$ | 32,739 | $ | 50,465 | |||
| Securities available for sale, at fair value |
17,054 | 100 | |||||
| Bank premises and equipment, net |
16,606 | 17,113 | |||||
| Other assets |
4,301 | 3,856 | |||||
| Investment in subsidiaries |
285,245 | 276,357 | |||||
| Total assets |
$ | 355,945 | $ | 347,891 | |||
| LIABILITIES & STOCKHOLDERS’ EQUITY |
|||||||
| Long-term borrowings |
$ | 11,250 | $ | 11,875 | |||
| Trust preferred capital notes |
60,310 | 60,310 | |||||
| Other liabilities |
2,297 | 1,908 | |||||
| Total liabilities |
73,857 | 74,093 | |||||
| Preferred stock |
— | 590 | |||||
| Common stock |
24,462 | 18,055 | |||||
| Surplus |
98,136 | 101,719 | |||||
| Retained earnings |
155,047 | 155,140 | |||||
| Warrant |
— | 2,808 | |||||
| Discount on preferred stock |
— | (2,790 | ) | ||||
| Accumulated other comprehensive income (loss) |
4,443 | (1,724 | ) | ||||
| Total stockholders’ equity |
282,088 | 273,798 | |||||
| Total liabilities and stockholders’ equity |
$ | 355,945 | $ | 347,891 | |||
77
Table of Contents
PARENT COMPANY
STATEMENTS OF INCOME
YEARS ENDED DECEMBER 31, 2009, 2008 and 2007
(Dollars in thousands)
| 2009 | 2008 | 2007 | |||||||||
| Income: |
|||||||||||
| Interest and dividend income |
$ | 141 | $ | 5 | $ | 6 | |||||
| Management fee received from subsidiaries |
17,297 | 17,297 | 14,966 | ||||||||
| Dividends received from subsidiaries |
7,318 | 9,876 | 20,618 | ||||||||
| Equity in undistributed net income from subsidiaries |
3,142 | 7,358 | 2,594 | ||||||||
| Gains on sale of securities, net |
— | — | 91 | ||||||||
| Gains (losses) on sale of fixed assets, net |
(9 | ) | (7 | ) | 307 | ||||||
| Other operating income |
— | 8 | 38 | ||||||||
| Total income |
27,889 | 34,537 | 38,620 | ||||||||
| Expenses: |
|||||||||||
| Interest expense |
1,711 | 3,855 | 4,821 | ||||||||
| Salaries and benefits |
10,005 | 10,445 | 9,472 | ||||||||
| Occupancy expenses |
959 | 955 | 643 | ||||||||
| Furniture and equipment expenses |
1,422 | 1,479 | 1,423 | ||||||||
| Other operating expenses |
5,432 | 3,289 | 2,505 | ||||||||
| Total expenses |
19,529 | 20,023 | 18,864 | ||||||||
| Net income |
8,360 | 14,514 | 19,756 | ||||||||
| Dividends paid on preferred stock |
2,696 | — | — | ||||||||
| Amortization of discount on preferred stock |
2,790 | 18 | — | ||||||||
| Net income available to common stockholders |
$ | 2,874 | $ | 14,496 | $ | 19,756 | |||||
PARENT COMPANY
CONDENSED STATEMENTS OF CASH FLOWS
YEARS ENDED DECEMBER 31, 2009, 2008 and 2007
(Dollars in thousands)
| 2009 | 2008 | 2007 | ||||||||||
| Operating activities: |
||||||||||||
| Net income |
$ | 8,360 | $ | 14,514 | $ | 19,756 | ||||||
| Adjustments to reconcile net income to net cash provided by operating activities: |
||||||||||||
| Equity in undistributed net income of subsidiaries |
(3,142 | ) | (7,358 | ) | (2,594 | ) | ||||||
| Gains on sale of investment securities |
— | — | (91 | ) | ||||||||
| Tax benefit from exercise of equity-based awards |
4 | 58 | 22 | |||||||||
| Decrease (increase) in other assets |
4,741 | (2,782 | ) | (1,501 | ) | |||||||
| Other, net |
2,743 | 848 | 1,961 | |||||||||
| Net cash and cash equivalents provided by operating activities |
12,706 | 5,280 | 17,553 | |||||||||
| Investing activities: |
||||||||||||
| Purchases of investment securities |
(16,315 | ) | — | — | ||||||||
| Proceeds from sales of investment securities |
— | — | 123 | |||||||||
| Net increase in bank premises and equipment |
(569 | ) | (160 | ) | (9,360 | ) | ||||||
| Payments for investments in and advances to subsidiaries |
(5,746 | ) | (7,308 | ) | (8,080 | ) | ||||||
| Net cash and cash equivalents used in investing activities |
(22,630 | ) | (7,468 | ) | (17,317 | ) | ||||||
| Financing activities: |
||||||||||||
| Net increase (decrease) in long-term borrowings |
(625 | ) | (625 | ) | 10,150 | |||||||
| Cash dividends paid |
(7,068 | ) | (9,990 | ) | (9,686 | ) | ||||||
| (Repurchase) Issuance of preferred stock |
(59,499 | ) | 58,924 | — | ||||||||
| Repurchase of common stock |
— | (254 | ) | — | ||||||||
| Issuance of common stock |
59,390 | 1,863 | 1,702 | |||||||||
| Net cash and cash equivalents (used in) provided by financing activities |
(7,802 | ) | 49,918 | 2,166 | ||||||||
| Increase (decrease) in cash and cash equivalents |
(17,726 | ) | 47,730 | 2,402 | ||||||||
| Cash and cash equivalents at beginning of the period |
50,465 | 2,735 | 333 | |||||||||
| Cash and cash equivalents at end of the period |
$ | 32,739 | $ | 50,465 | $ | 2,735 | ||||||
78
Table of Contents
18. SEGMENT REPORTING
The Company has two reportable segments: traditional full service community banks and a mortgage loan origination business. The community bank business for 2009 includes three banks, which provide loan, deposit, investment, and trust services to retail and commercial customers throughout their 56 retail locations in Virginia and the Washington D.C. metro area. The mortgage segment provides a variety of mortgage loan products principally in Virginia, Maryland and Washington D.C metro area. These loans are originated and sold primarily in the secondary market through purchase commitments from investors, which subject the Company to only de minimus risk.
Profit and loss is measured by net income after taxes including realized gains and losses on the Company’s investment portfolio. The accounting policies of the reportable segments are the same as those described in the summary of significant accounting policies. Inter-segment transactions are recorded at cost and eliminated as part of the consolidation process.
Both of the Company’s reportable segments are service based. The mortgage business is a fee-based business while the banks are driven principally by net interest income. The banks provide a distribution and referral network through their customers for the mortgage loan origination business. The mortgage segment offers a more limited referral network for the banks, due largely to the minimal degree of overlapping geographic markets.
The community bank segment provides the mortgage segment with the short-term funds needed to originate mortgage loans through a warehouse line of credit and charges the mortgage banking segment interest at the three month LIBOR rate plus 25 basis points. These transactions are eliminated in the consolidation process. A management fee for operations and administrative support services is charged to all subsidiaries and eliminated in the consolidated totals.
79
Table of Contents
Information about reportable segments and reconciliation of such information to the consolidated financial statements for the years ended December 31, 2009, 2008 and 2007 are as follows (dollars in thousands):
| Community Banks |
Mortgage | Eliminations | Consolidated Totals | ||||||||||||
| For the Year Ended December 31, 2009 |
|||||||||||||||
| Net interest income |
$ | 78,308 | $ | 1,508 | $ | — | $ | 79,816 | |||||||
| Provision for loan losses |
18,246 | — | — | 18,246 | |||||||||||
| Net interest income after provision for loan losses |
60,062 | 1,508 | — | 61,570 | |||||||||||
| Noninterest income |
16,647 | 16,643 | (322 | ) | 32,967 | ||||||||||
| Noninterest expenses |
71,219 | 14,390 | (322 | ) | 85,287 | ||||||||||
| Income before income taxes |
5,490 | 3,761 | — | 9,250 | |||||||||||
| Income tax expense (benefit) |
(431 | ) | 1,321 | — | 890 | ||||||||||
| Net income |
$ | 5,921 | $ | 2,440 | $ | — | $ | 8,360 | |||||||
| Total assets |
$ | 2,577,394 | $ | 60,051 | $ | (50,173 | ) | $ | 2,587,272 | ||||||
| Capital expenditures (1) |
$ | 7,511 | $ | 366 | $ | — | $ | 7,877 | |||||||
| For the Year Ended December 31, 2008 |
|||||||||||||||
| Net interest income |
$ | 77,248 | $ | 625 | $ | — | $ | 77,873 | |||||||
| Provision for loan losses |
10,020 | — | — | 10,020 | |||||||||||
| Net interest income after provision for loan losses |
67,228 | 625 | — | 67,853 | |||||||||||
| Noninterest income |
19,764 | 11,116 | (325 | ) | 30,555 | ||||||||||
| Noninterest expenses |
68,284 | 11,677 | (325 | ) | 79,636 | ||||||||||
| Income before income taxes |
18,708 | 64 | — | 18,772 | |||||||||||
| Income tax expense |
4,234 | 24 | — | 4,258 | |||||||||||
| Net income |
$ | 14,474 | $ | 40 | $ | — | $ | 14,514 | |||||||
| Total assets |
$ | 2,546,330 | $ | 33,077 | $ | (27,475 | ) | $ | 2,551,932 | ||||||
| Capital expenditures (1) |
$ | 5,033 | $ | 117 | $ | — | $ | 5,150 | |||||||
| For the Year Ended December 31, 2007 |
|||||||||||||||
| Net interest income |
$ | 75,497 | $ | 248 | $ | — | $ | 75,745 | |||||||
| Provision for loan losses |
1,060 | — | — | 1,060 | |||||||||||
| Net interest income after provision for loan losses |
74,437 | 248 | — | 74,685 | |||||||||||
| Noninterest income |
16,586 | 8,796 | (278 | ) | 25,105 | ||||||||||
| Noninterest expenses |
63,437 | 10,391 | (278 | ) | 73,550 | ||||||||||
| Income (loss) before income taxes |
27,586 | (1,347 | ) | — | 26,240 | ||||||||||
| Income tax expense (benefit) |
7,027 | (544 | ) | — | 6,484 | ||||||||||
| Net income (loss) |
$ | 20,559 | $ | (803 | ) | $ | — | $ | 19,756 | ||||||
| Total assets |
$ | 2,300,528 | $ | 28,852 | $ | (27,983 | ) | $ | 2,301,397 | ||||||
| Capital expenditures (1) |
$ | 14,573 | $ | 114 | $ | — | $ | 14,687 | |||||||
| (1) | Capital expenditures include purchase of property, furniture and equipment. |
80
Table of Contents
19. OTHER OPERATING EXPENSES
The following table presents the consolidated statement of income line “Other Operating Expenses” broken into greater detail for the years ended December 31, 2009, 2008 and 2007 (dollars in thousands):
| 2009 | 2008 | 2007 | |||||||
| Communication expenses |
$ | 6,594 | $ | 6,822 | $ | 6,598 | |||
| Professional services |
3,466 | 2,378 | 2,063 | ||||||
| Data processing fees |
1,456 | 1,340 | 1,366 | ||||||
| Marketing & advertising expense |
2,530 | 2,405 | 2,526 | ||||||
| FDIC assessment premiums |
4,585 | 1,245 | 333 | ||||||
| Other taxes |
1,801 | 1,662 | 1,692 | ||||||
| Loan & OREO expenses |
1,595 | 754 | 608 | ||||||
| Amortization of core deposit premuims |
1,929 | 1,957 | 1,889 | ||||||
| Other expenses (1) |
6,392 | 5,999 | 6,809 | ||||||
| Total other operating expenses |
$ | 30,348 | $ | 24,562 | $ | 23,884 | |||
| (1) | Includes acquisition costs of $1.5 million related to First Market Bank for 2009. Includes internal conversion costs related to merging affiliate banks of $515 thousand and $211 thousand for the years 2008 and 2007, respectively. |
20. CUMULATIVE-EFFECT OF A CHANGE IN ACCOUNTING PRINCIPLE
During the first quarter of 2008, certain accounting guidance in ASC 715 Compensation -Retirement Benefits became effective. This guidance requires the Company to recognize a liability (offset as a reduction to capital) and related compensation costs for endorsement split-dollar life insurance arrangements that provide benefits to employees during post-retirement periods. The Company recorded a reduction to retained earnings and corresponding increase to liabilities of $1.6 million. This reduction to retained earnings has been reflected in the Company’s Consolidated Statements of Changes in Stockholders’ Equity.
21. SUBSEQUENT EVENT
On March 30, 2009, the Company and First Market Bank announced the signing of an agreement, as amended and restated on June 19, 2009, pursuant to which the Company would acquire First Market Bank in an all stock transaction valued at approximately $105.4 million. At December 31, 2009, First Market Bank, then a privately held federally chartered savings bank with over $1.3 billion in assets, operated 38 branches throughout central Virginia with 31 locations in the greater Richmond metropolitan area. The primary reasons for the business combination were identified in the Company’s definitive proxy statement filed with the SEC on September 21, 2009. No revenues or expenses of First Market Bank have been included in the Company’s financial statements for the annual period ending December 31, 2009. This acquisition will be accounted for under the acquisition method of accounting. The combined Company is the largest Virginia based community banking organization with approximately 94 branch locations and total assets of approximately $4.0 billion as a result of the acquisition. As of December 31, 2009, approximately $1.5 million in acquisition-related costs have been recorded in the Company’s consolidated statements of income under the caption “Other Operating Expenses.” On February 1, 2010, Union First Market Bankshares Corporation, formerly known as Union Bankshares Corporation, announced it had completed the acquisition of First Market Bank and changed the name of the holding company to Union First Market Bankshares Corporation.
81
Table of Contents
ITEM 9. – CHANGES IN AND DISAGREEMENTS WITH ACCOUNTANTS ON ACCOUNTING AND FINANCIAL DISCLOSURE.
During the past two years, there have been no changes in or reportable disagreement with the independent registered public accountants for the Company or any of its subsidiaries.
ITEM 9A. – CONTROLS AND PROCEDURES.
Evaluation of Disclosure Controls and Procedures. The Company maintains “disclosure controls and procedures,” as such term is defined in Rule 13a-15(e) under the Securities Exchange Act of 1934 (the “Exchange Act”), that are designed to ensure that information required to be disclosed in reports that it files or submits under the Exchange Act is recorded, processed, summarized, and reported within the time periods specified in Securities and Exchange Commissions rules and forms, and that such information is accumulated and communicated to management, including the Chief Executive Officer and Chief Financial Officer, as appropriate, to allow timely decisions regarding required disclosure. In designing and evaluating its disclosure controls and procedures, management recognized that disclosure controls and procedures, no matter how well conceived and operated, can provide only reasonable assurance that the objectives of the disclosure controls and procedures are met. Additionally, in designing disclosure controls and procedures, management necessarily was required to apply its judgment in evaluating the cost-benefit relationship of possible disclosure controls and procedures. The design of any disclosure controls and procedures also is based in part upon certain assumptions about the likelihood of future events, and there can be no assurance that any design will succeed in achieving its stated goals under all potential future conditions.
Based on their evaluation as of the end of the period covered by this Annual Report on Form 10-K, the Company’s Chief Executive Officer and Chief Financial Officer have concluded that the disclosure controls and procedures were effective at the reasonable assurance level.
Management’s Report on Internal Control over Financial Reporting. Management is responsible for establishing and maintaining adequate internal control over financial reporting as defined in Rule 13a-15(f) of the Exchange Act. Because of its inherent limitations, internal control over financial reporting may not prevent or detect misstatements. Also, projections of any evaluation of effectiveness to future periods are subject to the risk that controls may become inadequate because of changes in conditions, or that the degree of compliance with the policies or procedures may deteriorate.
Management assessed the effectiveness of the Company’s internal control over financial reporting as of December 31, 2009. In making this assessment, management used the criteria set forth by the Committee of Sponsoring Organizations of the Treadway Commission in Internal Control - Integrated Framework. Based on the assessment using those criteria, management concluded that the internal control over financial reporting was effective as of December 31, 2009.
The effectiveness of the Company’s internal control over financial reporting as of December 31, 2009 has been audited by Yount, Hyde & Barbour, P.C., the independent registered public accounting firm which also audited the Company’s consolidated financial statements included in this Annual Report on Form 10-K. Yount, Hyde & Barbour, P.C.’s attestation report on the Company’s internal control over financial reporting appears on pages 43 through 45 hereof.
Changes in Internal Control over Financial Reporting. There was no change in the internal control over financial reporting that occurred during the quarter ended December 31, 2009 that has materially affected, or is reasonably likely to materially affect, the internal control over financial reporting.
82
Table of Contents
Not applicable.
ITEM 10. – DIRECTORS, EXECUTIVE OFFICERS AND CORPORATE GOVERNANCE.
Information regarding directors, executive officers, the Company’s audit committee and the audit committee financial expert is incorporated by reference from the Company’s definitive proxy statement for the Company’s 2010 Annual Meeting of Shareholders to be held April 20, 2010 (“Proxy Statement”), under the captions “Election of Directors,” “Corporate Governance, Board Leadership, and Board Diversity,” and “Senior Executive Officers.”
Information on Section 16(a) beneficial ownership reporting compliance for the directors and executive officers of the Company is incorporated by reference from the Proxy Statement under the caption “Ownership of Company Common Stock.”
The Company has adopted a broad based code of ethics for all employees and directors. The Company has also adopted a code of ethics tailored for directors and senior officers who have financial responsibilities. A copy of the codes may be obtained without charge by request to the Company’s corporate secretary.
ITEM 11. – EXECUTIVE COMPENSATION.
This information is incorporated by reference from the Proxy Statement under the captions “Corporate Governance, Board Leadership, and Board Diversity,” “Compensation Discussion and Analysis,” “Report of the Compensation Committee,” “Executive Compensation,” and “Director Compensation.”
ITEM 12. – SECURITY OWNERSHIP OF CERTAIN BENEFICIAL OWNERS AND MANAGEMENT AND RELATED STOCKHOLDER MATTERS.
Other than as set forth below, this information is incorporated by reference from the Proxy Statement under the caption “Ownership of Company Common Stock” and from Note 10 “Employee Benefits” contained in the “Notes to the Consolidated Financial Statements” of this Form10-K.
83
Table of Contents
The following table summarizes information, as of December 31, 2009, relating to the Company’s 2003 Stock Incentive Plan, pursuant to which grants of option to acquire shares of common stock may be awarded from time to time.
| Number of securities to be issued upon exercise of outstanding options, warrants and rights (A) |
Weighted-average exercise price of outstanding options, warrants and rights (B) |
Number of securities remaining available for future issuance under equity compensation plans (excluding securities reflected in column (A)) (C)1 | |||||
| Equity compensation plans approved by security holders |
216,180 | $ | 21.03 | 273,700 | |||
| Equity compensation plans not approved by security holders |
— | — | — | ||||
| Total |
216,180 | $ | 21.03 | 273,700 | |||
| 1 | Consists of shares available for future issuance under the Company’s 2003 Stock Incentive Plan. |
ITEM 13. – CERTAIN RELATIONSHIPS AND RELATED TRANSACTIONS, AND DIRECTOR INDEPENDENCE.
This information is incorporated by reference from the Proxy Statement under the captions “Corporate Governance, Board Leadership, and Board Diversity” and “Interest of Directors and Officers in Certain Transactions.”
ITEM 14. – PRINCIPAL ACCOUNTING FEES AND SERVICES.
This information is incorporated by reference from the Proxy Statement under the caption “Principal Accounting Fees.”
ITEM 15. – EXHIBITS, FINANCIAL STATEMENT SCHEDULES.
The following documents are filed as part of this report:
(a)(1) Financial Statements
The following consolidated financial statements and reports of independent registered public accountants of the Company are in Part II, Item 8:
| • | Reports of Independent Registered Public Accounting Firm; |
| • | Consolidated Balance Sheets - December 31, 2009 and 2008; |
| • | Consolidated Statements of Income - Years ended December 31, 2009, 2008, and 2007; |
84
Table of Contents
| • | Consolidated Statements of Changes in Stockholders’ Equity - Years ended December 31, 2009, 2008 and 2007; and |
| • | Consolidated Statements of Cash Flows -Years ended December 31, 2009, 2008 and 2007; |
| • | Notes to Consolidated Financial Statements. |
(a)(2) Financial Statement Schedules
All schedules are omitted since they are not required, are not applicable, or the required information is shown in the consolidated financial statements or notes thereto.
(a)(3) Exhibits
The following exhibits are filed as part of this Form 10-K and this list includes the Exhibit Index.
| Exhibit No. |
Description | |
| 2.01 | First Amended and Restated Agreement and Plan of Reorganization, entered into on June 19, 2009 and dated and made effective as of March 30, 2009, by and between Union Bankshares Corporation and First Market Bank, FSB (incorporated by reference to Exhibit 2.1 to Current Report on Form 8-K filed on June 22, 2009) | |
| 3.01 | Articles of Incorporation of Union First Market Bankshares Corporation, as amended (incorporated by reference to Exhibit 3.1 to Current Report on Form 8-K filed on February 5, 2010) | |
| 3.02 | Bylaws of Union First Market Bankshares Corporation, as amended (incorporated by reference to Exhibit 3.2 to Current Report on Form 8-K filed on February 5, 2010) | |
| 4.01 | Warrant to Purchase up to 422,636 shares of Common Stock (incorporated by reference to Exhibit 4.1 to Current Report on Form 8-K filed on December 23, 2008) | |
| 10.01 | Amended and Restated Management Continuity Agreement of G. William Beale (incorporated by reference to Exhibit 10.01 to Annual Report on Form 10-K filed on March 16, 2009) | |
| 10.02 | Amended and Restated Employment Agreement of G. William Beale (incorporated by reference to Exhibit 10.02 to Annual Report on Form 10-K filed on March 16, 2009) | |
| 10.03 | Amended and Restated Management Continuity Agreement of D. Anthony Peay (incorporated by reference to Exhibit 10.03 to Annual Report on Form 10-K filed on March 16, 2009) | |
| 10.04 | Amended and Restated Management Continuity of John C. Neal (incorporated by reference to Exhibit 10.04 to Annual Report on Form 10-K filed on March 16, 2009) | |
| 10.05 | Amended and Restated Management Continuity Agreement of N. Byrd Newton (incorporated by reference to Exhibit 10.05 to Annual Report on Form 10-K filed on March 16, 2009) | |
| 10.06 | Amended and Restated Management Continuity Agreement of Rawley H. Watson, III (incorporated by reference to Exhibit 10.06 to Annual Report on Form 10-K filed on March 16, 2009) | |
| 10.07 | Amended and Restated Management Continuity Agreement of Janis Orfe (incorporated by reference to Exhibit 10.07 to Annual Report on Form 10-K filed on March 16, 2009) | |
| 10.08 | Amended and Restated Employment Agreement of John C. Neal (incorporated by reference to Exhibit 10.08 to Annual Report on Form 10-K filed on March 16, 2009) | |
| 10.09 | Amended and Restated Employment Agreement of D. Anthony Peay (incorporated by reference to Exhibit 10.09 to Annual Report on Form 10-K filed on March 16, 2009) | |
85
Table of Contents
| 10.10 |
Amended and Restated Management Continuity Agreement of Michael T. Leake (incorporated by reference to Exhibit 10.10 to Annual Report on Form 10-K filed on March 16, 2009) | |
| 10.11 |
Amended and Restated Management Continuity Agreement of Robert L. Bailey (incorporated by reference to Exhibit 10.11 to Annual Report on Form 10-K filed on March 16, 2009) | |
| 10.12 |
Employment Agreement of David J. Fairchild (incorporated by reference to Exhibit 10.2 to Current Report on Form 8-K filed on February 5, 2010) | |
| 10.13 |
Management Continuity Agreement of David J. Fairchild (incorporated by reference to Exhibit 10.3 to Current Report on Form 8-K filed on February 5, 2010) | |
| 10.14 |
Union Bankshares Corporation 2003 Stock Incentive Plan (incorporated by reference to Form S-8 Registration Statement; SEC file no. 333-113839) | |
| 10.15 |
Union Bankshares Corporation Non-Employee Directors’ Stock Plan (incorporated by reference to Exhibit 99.0 on Form S-8 Registration Statement; SEC file no. 333-113842) | |
| 10.16 |
Letter Agreement, dated December 19, 2008, including the Securities Purchase Agreement – Standard Terms incorporated by reference therein, between Union Bankshares Corporation and the United States Department of the Treasury (incorporated by reference to Exhibit 10.1 to Current Report on Form 8-K filed on December 23, 2008) | |
| 10.17 |
Registration Rights Agreement, dated February 1, 2010, by and among Union First Market Bankshares Corporation and the shareholders of First Market Bank, FSB (incorporated by reference to Exhibit 10.1 to Current Report on Form 8-K filed on February 5, 2010) | |
| 11.03 |
Statement re: Computation of Per Share Earnings (incorporated by reference to Note 13 of the Notes to Consolidated Financial Statements included in this Annual Report) | |
| 21.01 |
Subsidiaries of the Registrant | |
| 23.01 |
Consent of Yount, Hyde & Barbour, P.C. | |
| 31.01 |
Certification of Chief Executive Officer pursuant to Section 302 of the Sarbanes-Oxley Act of 2002 | |
| 31.02 |
Certification of Chief Financial Officer pursuant to Section 302 of the Sarbanes-Oxley Act of 2002 | |
| 32.01 |
Certification of Chief Executive Officer and Chief Financial Officer pursuant to Section 906 of the Sarbanes-Oxley Act of 2002 | |
| 99.01 |
Certification of Chief Executive Officer pursuant to Section 111(b)(4) of the Emergency Economic Stabilization Act of 2008 | |
| 99.02 |
Certification of Executive Vice President and Chief Financial Officer pursuant to Section 111(b)(4) of the Emergency Economic Stabilization Act of 2008 | |
86
Table of Contents
SIGNATURES
Pursuant to the requirements of Section 13 or 15(d) of the Securities Exchange Act of 1934, the registrant has duly caused this report to be signed on its behalf by the undersigned, thereunto duly authorized.
| Union First Market Bankshares Corporation | ||||
| By: | /s/ G. William Beale |
Date: March 16, 2010 | ||
| G. William Beale | ||||
| Chief Executive Officer | ||||
Pursuant to the requirements of the Securities Exchange Act of 1934, this report has been signed below by the following persons on behalf of the registrant and in the capacities indicated on March 16, 2010.
| Signature |
Title | |
| /s/ G. William Beale G. William Beale |
Chief Executive Officer and Director (principal executive officer) | |
| /s/ Douglas E. Caton Douglas E. Caton |
Director | |
| /s/ David J. Fairchild David J. Fairchild |
President and Director | |
| /s/ Daniel I. Hansen Daniel I. Hansen |
Director | |
| /s/ Ronald L. Hicks Ronald L. Hicks |
Chairman of the Board of Directors | |
| /s/ Steven A. Markel Steven A. Markel |
Director | |
| /s/ Patrick J. McCann Patrick J. McCann |
Director | |
| /s/ Hullihen W. Moore Hullihen W. Moore |
Director | |
| /s/ R. Hunter Morin R. Hunter Morin |
Director | |
| /s/ W. Tayloe Murphy, Jr. W. Tayloe Murphy, Jr. |
Vice Chairman of the Board of Directors | |
| /s/ D. Anthony Peay D. Anthony Peay |
Executive Vice President and Chief Financial Officer (principal financial and accounting officer) | |
| /s/ Ronald L. Tillett Ronald L. Tillett |
Director | |
| /s/ James E. Ukrop James E. Ukrop |
Director | |
87