Attached files
| file | filename |
|---|---|
| 8-K - 8-K - Moelis & Co | a14-14279_18k.htm |
Exhibit 99.1
|
|
May 2014 |
|
|
[ 1 ] This Presentation contains forward-looking statements, which reflect the Company’s current views with respect to, among other things, its operations and financial performance. You can identify these forward-looking statements by the use of words such as “outlook,” “believes,” “expects,” “potential,” “continues,” “may,” “will,” “should,” “seeks,” “target,” “approximately,” “predicts,” “intends,” “plans,” “estimates,” “anticipates” or the negative version of these words or other comparable words. Such forward-looking statements are subject to various risks and uncertainties. Accordingly, there are or will be important factors that could cause actual outcomes or results to differ materially from those indicated in these statements. For a further discussion of such factors, you should read the Company’s filings with the Securities and Exchange Commission. The Company undertakes no obligation to publicly update or review any forward-looking statement, whether as a result of new information, future developments or otherwise. Forward Looking Statements |
|
|
I. Moelis & Company Overview |

|
|
Moelis & Company is a Premier Global Independent Investment Bank [ 3 ] Entrepreneurial, growth-oriented advisory firm founded in 2007 Global footprint with 15 offices in North and South America, Europe, the Middle East, Asia and Australia 89 MDs 1 with average of 20 years of experience Focus on M&A, Restructuring and Capital Markets advisory Broad and diverse client base (corporations, financial sponsors, government entities) Fast growing market share and $466mm of LTM 2 revenue Strong balance sheet: debt-free and substantial cash IPO in April 2014 (NYSE: MC) Notes: Includes two Managing Director hires in Brazil (subject to regulatory approval); as of 3/31/2014 As of 3/31/2014 |
|
|
Moelis & Company Milestones [ 4 ] Founded (July) and Raised Growth Capital from Global Institutional Investors 2007 Hired Restructuring Team (April) 2008 Established European Business 2009 Formed Joint Venture in Australia Established Middle East Presence 2010 Entered Hong Kong and China 2011 Japan Alliance with SMBC / SMBC Nikko & $93mm Investment Launched in India 2012 Expanded into Brazil IPO in April 2014 (NYSE: MC) 2013 – 2014 |
|
|
Our Business: Relationships, Judgment and Experience [ 5 ] Global Footprint to Serve Client Needs with 320 Bankers 1 Note: 1. Includes recent hires in Brazil (subject to regulatory approval) and excludes Australia JV; as of 3/31/2014 LOS ANGELES, US LONDON, UK HONG KONG, CN JAPAN Strategic Alliance with SMBC / SMBC Nikko BOSTON, US DUBAI, UAE CHICAGO, US HOUSTON, US NEW YORK, US PALO ALTO, US BEIJING, CN FRANKFURT, DE MUMBAI, IN PARIS, FR SÃO PAULO, BR SYDNEY, AUS Joint Venture |
|
|
[ 6 ] Premier Brand for World Class Advice Sale to Berkshire Hathaway and 3G Capital $28bn Sale to The Blackstone Group $26.5bn Sale to IntercontinentalExchange, Inc. $10.7bn Acquisition of Foster’s Group Limited A$11.7bn Chapter 11 Reorganization $5.0bn Merger with Brookdale Senior Living Inc. $5.3bn Acquisition of Alabama Gas Corporation $1.6bn |
|
|
We are driving value by creating the premier global investment bank Market Trends Differentiated Approach [ 7 ] Why Moelis & Company? Strong Financial Discipline and Ownership Mentality |
|
|
We are driving value by creating the premier global investment bank Market Trends Differentiated Approach [ 8 ] Why Moelis & Company? Strong Financial Discipline and Ownership Mentality |
|
|
Market Dynamics Create an Extraordinary Opportunity [ 9 ] Client demand for unconflicted advice continues to grow Regulatory, political and social pressures on financial conglomerates limit their ability to compete Improving global economy and CEO confidence should fuel an M&A market uptick Recapitalization and restructuring environment should benefit from record new debt issuance |
|
|
ADVISORY REVENUE AS A PERCENTAGE OF FEE POOL Source: Public filings Notes: Includes only advisory revenue Independents consist of Evercore, Greenhill, Lazard and Moelis Total advisory fee pool consists of Bank of America Merrill Lynch, Citi, Credit Suisse, Deutsche Bank, Evercore, Goldman Sachs, Greenhill, JP Morgan, Lazard, Moelis, Morgan Stanley and UBS [ 10 ] Demand for Independent Advisors Continues to Grow With Moelis Gaining Market Share 1 2 1 14.9% 17.0% 16.0% 19.7% 21.2% 10.7% 15.9% 13.6% 17.1% 17.9% 0.0% 5.0% 10.0% 15.0% 20.0% 25.0% 2009 2010 2011 2012 2013 Independents / Total Advisory Fee Pool Moelis / Independents |
|
|
Source: Thomson Reuters Notes: Global announced transactions greater than $100 million Represents Q1 2014 annualized Moelis & Company Should Benefit From an M&A Market Upswing GLOBAL ANNOUNCED M&A 1 [ 11 ] Moelis & Company Founded 2 |
|
|
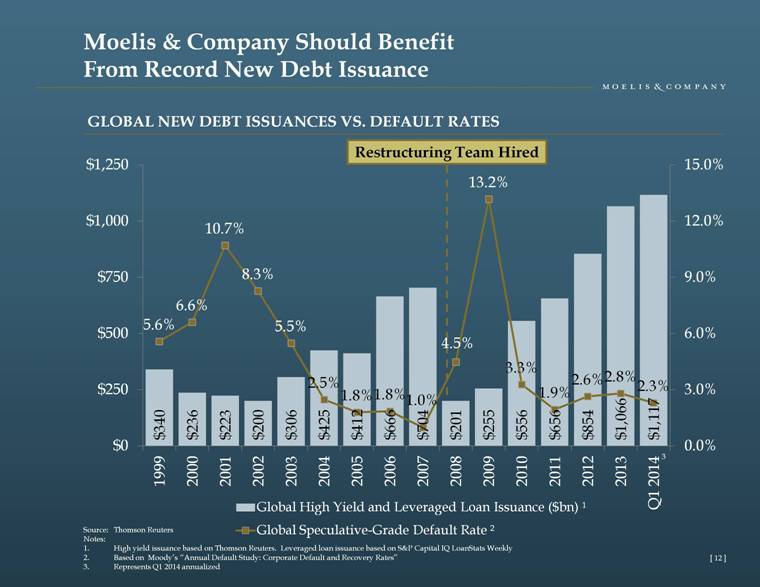
GLOBAL NEW DEBT ISSUANCES VS. DEFAULT RATES Source: Thomson Reuters Notes: High yield issuance based on Thomson Reuters. Leveraged loan issuance based on S&P Capital IQ LoanStats Weekly Based on Moody’s “Annual Default Study: Corporate Default and Recovery Rates” Represents Q1 2014 annualized [ 12 ] Moelis & Company Should Benefit From Record New Debt Issuance Restructuring Team Hired 3 |
|
|
We are driving value by creating the premier global investment bank Market Trends Differentiated Approach [ 13 ] Why Moelis & Company? Strong Financial Discipline and Ownership Mentality |
|
|
[ 14 ] Our Differentiated “One Firm” Approach Global connectivity and integrated advice Compensation philosophy and culture Intense focus on transaction execution Internal talent development grows franchise value |
|
|
M&A / GENERAL ADVISORY ü ü ü ü ü RESTRUCTURING ü ü ü ü ü CAPITAL MARKETS ADVISORY ü ü ü MULTI-REGIONAL TEAM ü ü INDUSTRY EXPERTISE ü ü ü ü ü Exclusive Investment Banker to Official Committee of Unsecured Creditors of AMR $17.0bn Merger with US Airways Group $29.6bn Chapter 11 Reorganization Integrated Approach Delivers Value for Clients Financial Advisor Litigation support, related to solvency analysis of AIG, Inc., in connection with the termination of a derivative between Brookfield and AIG $1.4bn Financial Advisor $1bn Sale to LIN TV Corp. $409mm Chapter 11 Reorganization [ 15 ] Financial Advisor US$9.4bn sale of U.S. assets and platform to Blackstone Real Estate Partners VI, L.P. A$9.3bn restructuring and merger of Australian interests Exclusive Financial Advisor Disposal of most of its complex credit derivative portfolio €30bn+ |
|
|
Metric Moelis Greenhill 1 Evercore 2 Lazard Years Since Inception 6+ 17+ 17+ 165+ 2013 Investment Banking Revenue ($mm) $411 $287 $667 $981 2013 # of MDs 86 69 142 132 Notes: Figures as of 12/31/2013 Greenhill # of MDs excludes Senior Advisors Evercore # of MDs includes Senior MDs and MDs (per company website) Successfully Managed Unprecedented Historical Growth [ 16 ] |
|
|
Experienced Global Team Drives Innovative Solutions [ 17 ] 8 PRODUCT HEADS 28 INDUSTRY HEADS 9 REGIONAL HEADS 4 M&A HEADS 52 FORMER SECTOR & PRODUCT HEADS 3 R&R HEADS |
|
|
[ 18 ] Enhanced Global Brand Recognition Leads to New Clients NUMBER OF FEE-PAYING CLIENTS |
|
|
[ 19 ] Our Growth Opportunities Going Forward Note: As of 3/31/2014 Enhanced global brand recognition Upside in Europe Over 60 advisory professionals in Europe Maturation of new MDs and internal talent 42% have been Moelis MDs for 3 years or less 1 Recent sector build outs / targeted future hiring Regional expansion |
|
|
We are driving value by creating the premier global investment bank Market Trends Differentiated Approach [ 20 ] Why Moelis & Company? Strong Financial Discipline and Ownership Mentality |
|
|
Financial Discipline Evidenced in Key Decisions [ 21 ] Acquiring and developing talent Entering new markets Compensation philosophy |
|
|
II. Financial Overview |

|
|
Attractive Financial Profile STRONG GROWTH PROFILE Strong growth trajectory VARIABLE EXPENSE STRUCTURE Compensation expense is the primary operating expense ATTRACTIVE FREE CASH FLOW PROFILE AND STRONG BALANCE SHEET Minimal capital requirements Healthy margins with scalable platform Substantial cash position and no debt ROBUST EARNINGS GROWTH Significant operating leverage Return excess cash flow to shareholders through dividends and share repurchases [ 23 ] |
|
|
Ability to Grow Revenue and Earnings Despite Challenged Market REVENUE AND OPERATING MARGIN M&A Y-o-Y Change 2 (29.2)% 29.8% 0.4% (4.2)% (2.5)% 19.3% 4 Default Rates 3 13.2% 3.3% 1.9% 2.6% 2.8% 2.3% Source: Thomson Reuters Notes: US GAAP revenue and operating margin LTM as of 3/31/2014 Global announced transactions greater than $100 million Based on Moody’s “Annual Default Study: Corporate Default and Recovery Rates” Represents Q1 2014 annualized M&A volume growth as a percentage of 2013 announced M&A volume [ 24 ] Revenue ($mm) Operating Margin 1 |
|
|
[ 25 ] Strong Balance Sheet Strong cash position No debt No balance sheet lending Minimal capital requirements Notes: Unaudited pro-forma for the Company’s initial public offering. Numbers may not tie due to rounding Includes investment in joint venture Cash & cash equivalents $78.4 Restricted cash 0.8 Receivables 34.9 Investments 2 15.7 Other assets 93.7 Total assets $223.4 Compensation payable $35.1 Other liabilities 79.5 Total liabilities $114.6 Total equity $108.8 AS OF MARCH 31, 2014 ($mm) 1 |
|
|
Investment Highlights [ 26 ] Preeminent global independent investment bank Strong secular and cyclical tailwinds Differentiated culture and economic model Ownership mentality drives long-term shareholder value |
|
|
Appendix |

|
|
Lock-Up Summary [ 28 ] Holders Number of Class A Shares / Exchangeable Units Lock-Up Terms All Executive Officers and Managing Directors 1 38.4 million 4 to 6 year lock-up (3 equal installments on each of the fourth, fifth and sixth anniversary of the IPO closing date) Pre-IPO Outside Investors and Non-MD Employees 1 4.6 million 50% transferable 180 days after IPO pricing date and the remainder transferable following the one year anniversary of the IPO closing date Pre-IPO Strategic Investor 2.6 million Ability to sell a limited number of shares during strategic alliance Charitable Organizations 1.2 million 25% transferable 6 months after IPO pricing date and the remainder transferable in 3 equal installments on each of the 12th, 18th and 24th month anniversary of the IPO closing date Public Shareholders 7.5 million None Total Class A Shares / Exchangeable Units 54.3 million Note: Includes former Managing Directors and Employees |