Attached files
| file | filename |
|---|---|
| EX-10.22 - EX-10.22 - Moelis & Co | mc-20171231ex1022ad295.htm |
| EX-32.2 - EX-32.2 - Moelis & Co | mc-20171231ex322bd0a94.htm |
| EX-32.1 - EX-32.1 - Moelis & Co | mc-20171231ex321934164.htm |
| EX-31.2 - EX-31.2 - Moelis & Co | mc-20171231ex3126e809a.htm |
| EX-31.1 - EX-31.1 - Moelis & Co | mc-20171231ex31119de38.htm |
| EX-23.1 - EX-23.1 - Moelis & Co | mc-20171231ex2312db4a7.htm |
| EX-21.1 - EX-21.1 - Moelis & Co | mc-20171231ex211524bf3.htm |
UNITED STATES
SECURITIES AND EXCHANGE COMMISSION
Washington, D.C. 20549
FORM 10‑K
|
(Mark One) |
|
|
☒ |
ANNUAL REPORT PURSUANT TO SECTION 13 OR 15(d) OF THE SECURITIES EXCHANGE ACT OF 1934 |
|
|
|
|
For the fiscal year ended December 31, 2017 |
|
|
|
|
|
Or |
|
|
|
|
|
☐ |
TRANSITION REPORT PURSUANT TO SECTION 13 OR 15(d) OF THE SECURITIES EXCHANGE ACT OF 1934 |
|
|
|
|
For the transition period from to |
|
Commission File Number: 001‑36418

(Exact name of registrant as specified in its charter)
|
Delaware |
46‑4500216 |
|
|
|
|
399 Park Avenue, 5th Floor, New York NY |
10022 |
(212) 883‑3800
(Registrant’s telephone number, including area code)
Securities registered pursuant to Section 12(b) of the Act:
|
Title of each class |
|
Name of each exchange on which registered |
|
Class A common stock, par value $0.01 |
|
New York Stock Exchange |
Securities registered pursuant to Section 12(g) of the Act: None
Indicate by check mark if the Registrant is a well‑known seasoned issuer, as defined in Rule 405 of the Securities Act. Yes ☒ No ☐
Indicate by check mark if the Registrant is not required to file reports pursuant to Section 13 or 15(d) of the Act. Yes ☐ No ☒
Indicate by check mark whether the registrant (1) has filed all reports required to be filed by Section 13 or 15(d) of the Securities and Exchange Act of 1934 during the preceding 12 months (or for such shorter period that the registrant was required to file such reports), and (2) has been subject to such filing requirements for the past 90 days. Yes ☒ No ☐
Indicate by check mark whether the registrant has submitted electronically and posted on its corporate Web site, if any, every Interactive Data File required to be submitted and posted pursuant to Rule 405 of Regulation S‑T (§ 232.405 of this chapter) during the preceding 12 months (or for such shorter period that the registrant was required to submit and post such files). Yes ☒ No ☐
Indicate by check mark if disclosure of delinquent filers pursuant to Item 405 of Regulation S‑K (§229.405 of this chapter) is not contained herein, and will not be contained, to the best of Registrant’s knowledge, in definitive proxy or information statements incorporated by reference in Part III of this Form 10‑K or any amendment to this Form 10‑K. ☒
Indicate by check mark whether the registrant is a large accelerated filer, an accelerated filer, non‑accelerated filer or a smaller reporting company. See definitions of “large accelerated filer”, “accelerated filer” and “smaller reporting company” in Rule 12b‑2 of the Exchange Act. (Check one):
|
Large accelerated filer ☒ |
Accelerated filer ☐ |
Non‑accelerated filer ☐ |
Smaller reporting company ☐ |
Emerging growth company ☐ |
If an emerging growth company, indicate by check mark if the registrant has elected not to use the extended transition period for complying with any new or revised financial accounting standards provided pursuant to Section 13(a) of the Exchange Act ☐
Indicate by check mark whether the registrant is a shell company (as defined in rule 12b‑2 of the Exchange Act). Yes ☐ No ☒
The aggregate market value of the voting and nonvoting common equity held by non‑affiliates of the Registrant as of June 30, 2017 was $1,000 million.
As of February 14, 2018, there were 33,525,277 shares of Class A common stock, par value $0.01 per share, and 19,912,230 shares of Class B common stock, par value $0.01 per share, outstanding.
DOCUMENTS INCORPORATED BY REFERENCE
Portions of the Registrant’s definitive proxy statement for its 2018 annual meeting of stockholders are incorporated by reference in Part III of this Form 10‑K.
When we use the terms “Company,” “we,” “our,” or “us,” we mean Moelis & Company, a Delaware corporation (incorporated in January 2014), and its consolidated subsidiaries. “Old Holdings” refers solely to Moelis Asset Management LP (formerly Moelis & Company Holdings LP). References to the “IPO” refer to our initial public offering in April 2014 where Old Holdings reorganized its business in connection with the offering of 7,475,000 shares of Moelis & Company Class A common stock. Following the reorganization, the advisory business is now held under Moelis & Company Group LP (“Group LP”), a Delaware limited partnership, and Group LP is controlled by Moelis & Company.
SPECIAL NOTE REGARDING FORWARD‑LOOKING STATEMENTS
This Form 10‑K contains forward‑looking statements, which reflect our current views with respect to, among other things, our operations and financial performance. You can identify these forward‑looking statements by the use of words such as “may,” “might,” “will,” “should,” “expect,” “plan,” “anticipate,” “believe,” “estimate,” “intend,” “predict,” “potential” or “continue,” the negative of these terms and other comparable terminology. These forward‑looking statements, which are subject to risks, uncertainties, and assumptions about us, may include projections of our future financial performance, based on our growth strategies and anticipated trends in our business. These statements are only predictions based on our current expectations and projections about future events. There are important factors that could cause our actual results, level of activity, performance or achievements to differ materially from the results, level of activity, performance or achievements expressed or implied by the forward‑looking statements. In particular, you should consider the numerous risks outlined in Item 1A.
Although we believe the expectations reflected in the forward‑looking statements are reasonable, we cannot guarantee future results, level of activity, performance or achievements. Moreover, neither we nor any other person assumes responsibility for the accuracy or completeness of any of these forward‑looking statements. You should not rely upon forward‑looking statements as a prediction of future events. We are under no duty to and we do not undertake any obligation to update or review any of these forward‑looking statements after the date of this filing to conform our prior statements to actual results or revised expectations whether as a result of new information, future developments or otherwise.
Overview
Moelis & Company is a leading global independent investment bank that provides innovative strategic and financial advice to a diverse client base, including corporations, governments and financial sponsors. We assist our clients in achieving their strategic goals by offering comprehensive, globally integrated financial advisory services across all major industry sectors. Our team of experienced professionals advises clients on their most critical decisions, including mergers and acquisitions (“M&A”), recapitalizations and restructurings, capital markets transactions and other corporate finance matters.
Moelis & Company was founded in 2007 by veteran investment bankers to create a global independent investment bank that offers multi disciplinary solutions and exceptional transaction execution combined with the highest standard of confidentiality and discretion. We create lasting client relationships by providing focused innovative advice through a highly collaborative and global approach not limited to specific products or access to particular regions. Our compensation model fosters our holistic approach to clients by emphasizing quality of advice and is not a commission based structure where employees are compensated on a defined percentage of the revenues they generate. We believe our discretionary approach to compensation leads to exceptional advice, strong client impact and enhanced internal collaboration.
Since our inception, we have achieved rapid growth by hiring high‑caliber professionals, expanding the scope and geographic reach of our advisory services, developing new client relationships and cultivating our professionals through training and mentoring. Today we serve our clients with over 500 advisory professionals, including 124 Managing Directors, based in 19 geographical locations around the world. We have demonstrated strong financial performance, achieving revenues of $685 million in 2017, our tenth full year of operations, and have advised on over $2 trillion of transactions since inception.
2
Our Advisory Offering
We offer holistic advisory solutions to clients by integrating our bankers’ deep industry knowledge and broad corporate finance experience with our global capabilities. With 19 geographical locations in the Americas, Europe, the Middle East, Asia and Australia, we combine local and regional expertise with international market knowledge to provide highly integrated information flow and strong cross‑border capabilities. Since our founding, we have rapidly scaled our global platform, as we believe clients value our ability to be relevant in their local market as well as to provide valuable global insights.
We combine our global capabilities with expertise in all major industries including Consumer, Retail & Restaurants; Energy, Power & Infrastructure; Financial Institutions; Financial Sponsors; General Industrials; Healthcare; Real Estate, Gaming, Lodging & Leisure and Technology, Media & Telecommunications. We collaborate globally to bring our deep industry knowledge to the local markets where our clients operate.
We focus on a wide range of clients from large public multinational corporations to middle market private companies to individual entrepreneurs, and we deliver the full resources of our firm and the highest level of senior attention to every client, regardless of size or situation.
We advise our clients through all phases of the business cycle using our strong capabilities in M&A, recapitalization and restructuring, capital markets advisory and other advisory services.
We have established a premier M&A franchise advising clients on mergers, acquisitions, sales and divestitures. We counsel our clients through all stages of the process as we evaluate strategic alternatives, assess potential acquirers and targets, provide valuation analyses and advise on transaction terms including valuation, structuring, timing and potential financing. Additionally, we have an exclusive sales franchise with a strong track record in achieving maximum value for clients in their sale processes.
Moelis & Company has substantial expertise in guiding special committees of boards of directors to evaluate strategies and negotiate proposals by leveraging decades of transaction experience. We execute a rigorous process to help special committees synthesize alternatives and develop an appropriate course of action. We bring a strong understanding of key deal points and the interplay between deal terms, value and the various stakeholders involved.
Moelis & Company’s shareholder defense team provides corporate boards with effective solutions to a broad range of contested shareholder situations. We draw from decades of experience working with both public companies, boards and management to advise clients across every industry, at every stage of an activist campaign; from privately engaging with shareholders to stave off a formal campaign, to defending the company’s interests in a proxy fight or hostile media campaign.
For our clients in financial distress, we partner senior recapitalization and restructuring professionals with our industry, M&A and capital markets experts to provide holistic advice. We advise both companies and creditors, utilizing our strong relationship network to access capital, identify potential partners and drive support for our transactions. Since our inception, almost 60% of our recapitalization and restructuring engagements have been on the company or debtor side of a transaction. We understand that during times of financial distress, having a true partner as an advisor is of critical importance, and our partnership and collaboration with our clients during these times has helped us develop long‑lasting company relationships. In addition, our deep relationships throughout the creditor and recapitalization and restructuring communities provide multiple creditor side origination opportunities and allow us to develop a comprehensive perspective from all constituents. We understand that in distressed situations, many creditors become temporary equityholders of businesses, and we help these clients realize value which leads to further M&A activity for us.
As part of our holistic approach to client service, we have substantial experience in advising clients on complex risk exposures. Our team consists of experts in structured products, securitization, derivatives and risk management who are highly qualified to value complex assets and advise on repositioning and divesting underperforming portfolios. These capabilities have been particularly relevant to our financial institutions clients since the global financial crisis.
3
We also advise clients on capital markets matters, providing comprehensive capital structure advice and developing financing solutions tailored to the specific needs of issuers. Our independence and objectivity, coupled with our direct and long‑standing institutional buy‑side relationships, inform our market views and enhance the likelihood of a successful transaction. We advise clients on all aspects of public and private debt and equity transactions.
We provide capital raising, secondary transaction and other advisory services to private fund sponsors and limited partners. Our team’s extensive experience raising capital for a wide variety of fund sponsors located in North America, Europe, Asia and the emerging markets is fully integrated with our global platform, ensuring the broadest possible marketing efforts for our clients. We specialize in private equity fund structures across a wide range of strategies, including buyout, growth capital, distressed, special situations, venture and sector‑specific strategies.
In addition, we provide a broad range of other financial advisory services tailored to the specific circumstances and needs of our clients. For example, we act as defense advisor to boards of directors responding to unsolicited proposals, we act as expert witness for clients in major litigation and we assist private clients and governments in negotiations of significant commercial matters.
We seek to generate repeat business from our clients by becoming long‑term partners with them as opposed to being solely transaction focused. We are also committed to developing new client relationships, and we maintain an active dialogue with a large number of potential clients, as well as with their financial and legal advisors, on an ongoing basis. We continue to penetrate new relationships through our business development initiatives, growing our senior team with professionals who bring additional client relationships and through introductions from our strong network of relationships with senior executives, board members, attorneys and other third parties.
Our Key Competitive Strengths
With 19 geographical locations around the world, capabilities in all major industries and deep advisory expertise, we believe we are well positioned to take advantage of the strong market opportunity for independent investment banks. Furthermore, we believe our business is differentiated from that of our competitors in the following respects:
Globally Integrated Firm with Innovative Advisory Solutions: We provide the high‑touch and conflict free benefits of an independent investment bank with the global reach, sector depth and product expertise more commonly found at larger financial institutions. With 19 geographical locations in the Americas, Europe, the Middle East, Asia and Australia, we combine local and regional expertise with international market knowledge to provide our clients with highly integrated information flow and strong cross‑border capabilities. We harness the deep industry expertise and broad corporate finance experience of our 124 global Managing Directors, which include 69 former sector and product heads from major investment banks. We reinforce our model with a discretionary incentive compensation structure that encourages a high degree of collaboration and our “One Firm” mentality.
Advisory Focus with Strong Intellectual Capital: We primarily focus on advising clients, unlike most of our major competitors who derive a large percentage of their revenues from lending, trading and underwriting securities. We believe this independence allows us to offer advice free from the actual or perceived conflicts associated with lending to clients or trading in their securities. In addition, our focus on advisory services frees us from the pressure of cross‑selling products, which we believe can distract from the dialogue with clients around their long‑term strategy, compromising the advice. We provide intellectual capital based on our judgment, expertise and relationships combined with intense senior level attention to all transactions. The business of delivering intellectual capital allows us to operate a low risk and capital light model with attractive profit margins. We are not exposed to the financial risk and regulatory requirements that arise from, or the capital investments required in, balance sheet lending and trading activities.
Fast Growing Global Independent Investment Bank: Since our inception in 2007, we have achieved rapid growth, earning revenues of $685 million in 2017. In our early years, we took advantage of the dislocation in the financial services industry following the global financial crisis and capitalized on the unique opportunity to hire talent. We currently have 19 offices globally with 754 employees, including 124 Managing Directors who have on average over 20 years of investment banking experience. We believe the quality and scale of our global franchise and the speed at which it has been achieved would be a challenge to replicate today.
4
Strong Financial Discipline: We have remained financially disciplined with an intense focus on managing our organic growth in a profitable manner. We hired aggressively during the global financial crisis to take advantage of the dislocation among our competitors and in recent years have taken a more measured approach to hiring as the markets and compensation levels have stabilized. We are also highly focused on growing our Managing Directors through internal promotions, adding to our talent base with individuals that are engrained in our culture and have proven track records on our platform. Currently, almost 30% of our Managing Directors have been internally promoted. We believe our investment in talent at the junior level creates a self-sustaining pool of Managing Director talent, which in turn helps us manage our growth profitably and allows us to return more capital to shareholders in the long run. We incentivize our bankers as owners by awarding equity compensation in order to align the interests of our employees and equity holders. Additionally, we have focused on entering new regions and sectors through cost effective strategies. We intend to maintain our financial discipline as we continue to grow our revenues, expand into new markets and increase our areas of expertise.
Significant Organic Growth Opportunities: We have made significant investments in our intellectual capital with the hiring or promotion of almost 70 Managing Directors in the last five years. In addition, we have invested time and resources in our recruiting and training and development programs. We established a meaningful presence at the top undergraduate programs in our first year of operations, which has resulted in the hiring of over 400 analysts from campus since our inception. We are poised to continue realizing meaningful organic growth from these investments. We have achieved critical size in key industry sectors and regions around the globe, as well as recognition for advising on innovative transactions, which have enhanced our brand globally. We are positioned to continue to grow revenues as a result of increased individual productivity as our investments in people mature and as we continue to leverage our global platform through enhanced connectivity and idea generation and expanded brand recognition.
High Standard of Confidentiality and Discretion: Due to the highly sensitive nature of M&A discussions where confidentiality is of paramount importance to clients, the M&A business is most effectively operated on a “need to know” basis. We believe that large financial conglomerates with multiple divisions, “Chinese Walls” and layers of management have a significantly greater number of employees who have access to sensitive client information, which can increase the risk of confidential information leaking. Such leaks can materially impair the viability of transactions and other strategic decisions. We have established a high standard of confidentiality and discretion, as well as instituted procedures designed to protect our clients and minimize the risk of sensitive information leaking to the market.
Diversified Advisory Platform: Our business is highly diversified across sectors, types of advisory services and clients. Our broad corporate finance expertise positions us to advise clients through any phase of their life cycle and in any economic environment. We focus on a wide range of clients from large public multinational corporations to middle market private companies to individual entrepreneurs, and we deliver the full resources of our firm and the highest level of senior attention to every client, regardless of size or situation. In addition, we have no meaningful client concentration, with our top 10 transactions representing less than 20% of our revenues in 2017. Our holistic “One Firm” approach also reduces dependence on any one product or banker and allows us to leverage our intellectual capital across the firm as necessary to offer multiple solutions to our clients, increase our client penetration and adapt to changing circumstances.
Partnership Culture: We believe that our momentum and commitment to excellence have created an environment that attracts and retains high quality talent. Our people are our most valuable asset and our goal is to attract, retain and develop the best and brightest talent in our industry across all levels. We strive to foster a collaborative environment, and we seek individuals who are passionate about our business and are a fit with our culture. We have established a compensation philosophy that reinforces our long‑term vision and values by rewarding collaboration, client impact and lasting relationships and encourages employees to put the interests of our clients and our Company first. Above all, our core values nurture a culture of partnership, passion, optimism and hard work, inspiring the highest level of quality and integrity in every interaction with our clients and each other.
5
Our Growth Strategy
Our growth strategy is to continue to take advantage of what we believe are attractive market opportunities to enhance our leadership position as a global independent investment bank, advising our clients on important mergers and acquisitions, recapitalization and restructuring transactions and other strategic matters. We seek to achieve these objectives through the following two primary strategies:
Deepen and Expand our Client Relationships: We seek to continue to deepen and expand our client relationships, which are the foundation of our business. We are tireless in our pursuit of offering the highest quality integrated advice and most innovative solutions that lead to the long‑term success of our clients. We believe this approach has enhanced our reputation as a trusted advisor to our clients, and we intend to leverage this approach further as we increase our touch points with our clients and develop new client relationships.
Broaden our Areas of Expertise Based on Client Needs: We intend to pursue further industry and geographic expansion and introduce new product expertise based on client needs. In addition to hiring high quality professionals who will expand our market share, we will seek to grow through increasing the tenure of our Managing Directors, investing in and training our next generation of Managing Directors and continuing to hire analysts and associates from leading undergraduate and graduate programs. We believe that developing talent internally creates a more sustainable franchise and reinforces the culture of our firm.
Our People
We believe that our people are our most valuable asset. Our goal is to attract, retain and develop the best and brightest talent in our industry across all levels. We strive to foster a collaborative environment, and we seek individuals who are passionate about our business and fit our culture. Our Managing Directors are compensated based on the quality of advice and execution provided to a client, which is predicated on delivering our full suite of advisory services through a high degree of collaboration across different industries, products and regions. This collaborative approach is demonstrated by the fact that on almost all of our transactions, at least two Managing Directors support the client. We reinforce our long‑term vision and values by rewarding for client impact and lasting relationships. Our year‑end evaluation process measures both performance and alignment with our core value system, ensuring that we continue to integrate our expertise to meaningfully enhance the quality of our advice and strengthen our client relationships. We do not compensate on a commission‑based pay model and do not manage our business based on industry, product or regional silos. Our compensation structure for junior bankers is based on a system of meritocracy whereby bankers are rewarded for top performance.
We recruit our junior bankers from the world’s leading undergraduate and graduate programs. Since our inception we have had a dedicated campus recruiting effort through which we have hired over 400 analysts from these undergraduate programs. We devote significant time and resources to training and mentoring our employees and have implemented a generalist program in which our junior professionals receive significant transaction experience across a wide range of products and industries. We believe this exposure enhances the investment banking experience and allows our junior professionals to develop and refine their proficiency in a broad variety of corporate finance matters at an early stage in their career. We are committed to talent retention and our goal is to develop our brightest and most ambitious junior professionals into successful Managing Directors. As of December 31, 2017, we had 749 employees globally, including 512 advisory professionals and 118 Managing Directors.
Moelis Australia
In 2009, we opened our sixth global office in Sydney to provide investment banking services in Australia and expand our coverage of the Asia Pacific region. Following the establishment of this office and the hiring of what we believed to be a strong executive team, we entered into a 50%-50% joint venture with Moelis Australia Holdings PTY Limited on April 1, 2010 (“Moelis Australia”). Moelis Australia operates a financial advisory services business, an equity capital markets and research, sales and trading business covering Australian public equity securities and asset management businesses.
On April 10, 2017, Moelis Australia consummated its initial public offering and became listed on the Australian Securities Exchange as Moelis Australia Limited (ASX: MOE). We continue to hold our original position of 50 million shares of MOE; however, as a result of the initial public offering and subsequent follow-on offerings, the Company’s
6
ownership interest has been diluted to less than 50%. In connection with Moelis Australia’s initial public offering, the Company and Moelis Australia entered into a Strategic Alliance Agreement for Moelis Australia to continue to conduct its investment banking advisory business in Australia and New Zealand as an integrated part of the global advisory business of the Company consistent with the manner in which Moelis Australia and the Company have partnered together since 2010.
As of December 31, 2017, Moelis Australia had 90 employees, including 76 revenue producing professionals and 21 Managing Directors.
Our Strategic Alliances
Sumitomo Mitsui Banking Corporation and its Subsidiary, SMBC Nikko Securities Inc.
Effective January 1, 2012, we entered into a strategic alliance with Sumitomo Mitsui Banking Corporation (“SMBC”) and its subsidiary, SMBC Nikko Securities Inc. (“Nikko”) to provide advisory services, including advising on mergers, acquisitions, divestitures, restructurings and other corporate finance matters, to Japanese companies in regions where our firms conduct business. The alliance has provided us and our clients with access to the Japanese market as well as provided us with opportunities to advise Japanese clients on the full suite of our advisory services, with a particular focus on cross‑border M&A. Established in 1876 as Mitsui Bank, SMBC is the second largest bank in Japan based on market capitalization. Nikko is one of the five major securities companies in Japan.
Alfaro, Dávila y Scherer, S.C.
Effective September 2, 2016, we entered into a strategic alliance with Alfaro, Dávila y Scherer, S.C. (“ADS”), the leading independent strategic and financial advisory firm in Mexico, to provide advisory services to our global client base with a focus on cross-border transactions. We expect ADS’s successful track record of developing long-term relationships and advising multinational corporations and privately held companies in strategic transactions will be beneficial to our global clients looking to expand into Mexico or for Mexican corporates eager to grow internationally. With this strategic alliance, coupled with our office in Brazil, Moelis & Company has a presence in the two largest markets in Latin America.
Competition
The financial services industry is intensely competitive, and we expect it to remain so. Our competitors are other investment banking and financial advisory firms. We compete on both a global and a regional basis, and on the basis of a number of factors, including depth of client relationships, industry knowledge, transaction execution skills, our range of products and services, innovation, reputation and price.
We believe our primary competitors in securing advisory engagements include the investment banking businesses of Bank of America Corporation, Citigroup Inc., Credit Suisse Group AG, The Goldman Sachs Group, Inc., JPMorgan Chase & Co., Morgan Stanley and other large investment banking firms as well as independent investment banking firms such as Evercore Partners Inc., Greenhill & Co., Inc., Houlihan Lokey, Inc., Lazard Ltd, NM Rothschild & Sons Limited, PJT Partners, Inc., and many closely held boutique firms.
We compete to attract and retain qualified employees. Our ability to continue to compete effectively in our business will depend upon our ability to attract new employees and retain and motivate our existing employees.
In past years there has been substantial consolidation in the financial services industry. In particular, a number of large commercial banks and other broad‑based financial services firms have established or acquired broker‑dealers or have merged with other financial institutions. Many of these firms have the ability to offer a wider range of products, from loans, deposit‑taking and insurance to brokerage, asset management and investment banking services, which may enhance their competitive position. They also have the ability to support investment banking and securities products with commercial lending and other financial services revenues in an effort to gain market share, which could result in pricing pressure in our business or loss of opportunities for us. In addition, we may be at a competitive disadvantage relative to certain of our competitors who are able to, and regularly do, provide financing or market making services that are often instrumental in effecting transactions. The trend toward consolidation has significantly increased the capital base and geographic reach of our competitors as well as the potential for actual or perceived conflicts of these firms.
7
Regulation
Our business, as well as the financial services industry generally, is subject to extensive regulation in the U.S. and across the globe. As a matter of public policy, regulatory bodies in the U.S. and the rest of the world are charged with safeguarding the integrity of the securities and other financial markets and with protecting the interests of customers participating in those markets, not with protecting the interests of our stockholders or creditors. In the U.S., the SEC is the federal agency responsible for the administration of the federal securities laws. Moelis & Company LLC, our wholly‑owned subsidiary through which we conduct our financial advisory business in the U.S., is registered as a broker‑dealer with the SEC. Moelis & Company LLC is subject to regulation and oversight by the SEC. In addition, the Financial Industry Regulatory Authority, Inc. (“FINRA”), a self‑regulatory organization that is subject to oversight by the SEC, adopts and enforces rules governing the conduct, and examines the activities, of its member firms, including Moelis & Company LLC. State securities regulators also have regulatory or oversight authority over Moelis & Company LLC.
Broker‑dealers are subject to regulations that cover all aspects of the securities business, including capital structure, record‑keeping and the conduct and qualifications of directors, officers and employees. In particular, as a registered broker‑dealer and member of a self‑regulatory organization, we are subject to the SEC’s uniform net capital rule, Rule 15c3‑1. Rule 15c3‑1 specifies the minimum level of net capital a broker‑dealer must maintain and also requires that a significant part of a broker‑dealer’s assets be kept in relatively liquid form. The SEC and various self‑regulatory organizations impose rules that require notification when net capital falls below certain predefined criteria, limit the ratio of subordinated debt to equity in the regulatory capital composition of a broker‑dealer and constrain the ability of a broker‑dealer to expand its business under certain circumstances. Additionally, the SEC’s uniform net capital rule imposes certain requirements that may have the effect of prohibiting a broker‑dealer from distributing or withdrawing capital and requiring prior notice to the SEC for certain withdrawals of capital.
In addition to the regulation we are subject to in the United States, we are also subject to regulation internationally by the Financial Conduct Authority in the United Kingdom, the Securities and Futures Commission in Hong Kong, the Australian Securities and Investments Commission and the Dubai Financial Services Authority.
Certain parts of our business are subject to compliance with laws and regulations of U.S. federal and state governments, non‑U.S. governments, their respective agencies and/or various self‑regulatory organizations or exchanges relating to, among other things, the privacy of client information, and any failure to comply with these regulations could expose us to liability and/or reputational damage.
The U.S. and non‑U.S. government agencies and self‑regulatory organizations, as well as state securities commissions in the United States, are empowered to conduct periodic examinations and initiate administrative proceedings that can result in censure, fines, the issuance of cease‑and‑desist orders or the suspension or expulsion of a broker‑dealer or its directors, officers or employees.
Federal anti‑money‑laundering laws make it a criminal offense to own or operate a money transmitting business without the appropriate state licenses, which we maintain, and registration with the U.S. Department of the Treasury’s Financial Crimes Enforcement Network (FinCEN). In addition, the USA PATRIOT Act of 2001 and the Treasury Department’s implementing federal regulations require us, as a “financial institution,” to establish and maintain an anti‑money‑laundering program.
In connection with its administration and enforcement of economic and trade sanctions based on U.S. foreign policy and national security goals, the Treasury Department’s Office of Foreign Assets Control, or OFAC, publishes a list of individuals and companies owned or controlled by, or acting for or on behalf of, targeted countries. It also lists individuals, groups and entities, such as terrorists and narcotics traffickers, designated under programs that are not country‑specific. Collectively, such individuals and companies are called “Specially Designated Nationals,” or SDNs. Assets of SDNs are blocked, and we are generally prohibited from dealing with them. In addition, OFAC administers a number of comprehensive sanctions and embargoes that target certain countries, governments and geographic regions. We are generally prohibited from engaging in transactions involving any country, region or government that is subject to such comprehensive sanctions.
8
The Foreign Corrupt Practices Act (the “FCPA”) and the UK 2010 Bribery Act (the “UK Bribery Act”) prohibit the payment of bribes to foreign government officials and political figures. The FCPA has a broad reach, covering all U.S. companies and citizens doing business abroad, among others, and defining a foreign official to include not only those holding public office but also local citizens acting in an official capacity for or on behalf of foreign government‑run or ‑owned organizations or public international organizations. The FCPA also requires maintenance of appropriate books and records and maintenance of adequate internal controls to prevent and detect possible FCPA violations. Similarly, the UK Bribery Act prohibits us from bribing, being bribed or making other prohibited payments to government officials or other persons to obtain or retain business or gain some other business advantage.
Executive Officers and Directors
Board of Directors
Kenneth Moelis,
Chairman and Chief Executive Officer of the Company
Navid Mahmoodzadegan,
Co‑President and Managing Director of the Company
Jeffrey Raich,
Co‑President and Managing Director of the Company
Eric Cantor,
Managing Director and Vice Chairman of the Company
J. Richard Leaman III,
Managing Director and Vice Chairman of the Company
John A. Allison,
Chairman of the Executive Advisory Council of the Cato Institute’s Center for Monetary and Financial Alternatives, member of the Cato Institute’s Board of Directors and Former Co‑Chairman and CEO of BB&T Corp.
Yvonne Greenstreet,
Executive Vice President and Chief Operating Officer of Alnylam Pharmaceuticals, a leading RNAi therapeutics company, Former Senior Vice President and Head of Medicines Development, Pfizer Inc.
Kenneth L. Shropshire
Adidas Distinguished Professor of Global Sport and CEO of Global Sport Institute at Arizona State University, David W. Hauck Professor Emeritus, Wharton School, University of Pennsylvania and Former Faculty Director of Wharton Sports Business Initiative
Other Executive Officers
Elizabeth Crain
Chief Operating Officer
Joseph Simon
Chief Financial Officer
Osamu R. Watanabe
General Counsel and Secretary
9
Organizational Structure
Overview
Moelis & Company is a holding company and its only assets are its partnership interests in Group LP, its equity interest in the sole general partner of Group LP, Moelis & Company Group GP LLC, and its interests in its subsidiaries. Moelis & Company operates and controls all of the business and affairs of Group LP and its operating entity subsidiaries indirectly through its equity interest in Moelis & Company Group GP LLC.
10
The simplified diagram below depicts our organizational structure (percentages are as of December 31, 2017).
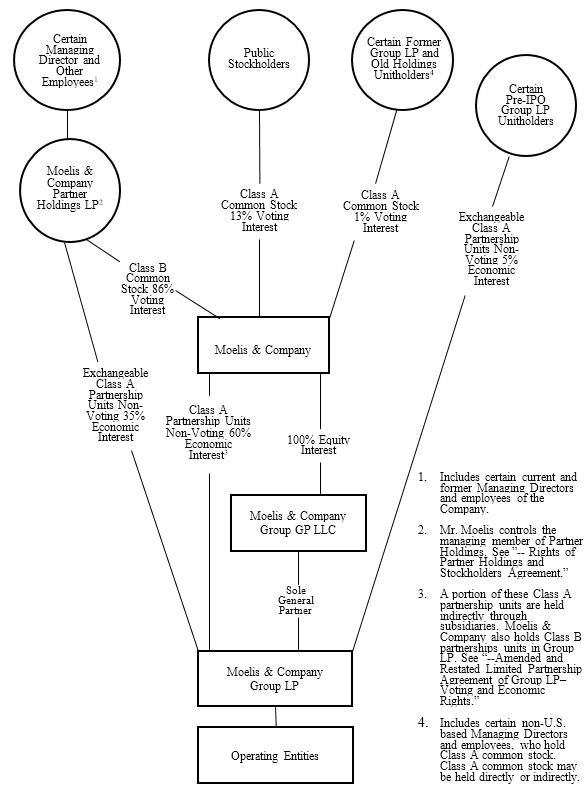
Note: All entities on the chart above are incorporated or formed in Delaware.
11
The Reorganization
Prior to our initial public offering, our business was owned by Old Holdings. In connection with the consummation of our initial public offering, a reorganization of the existing businesses of Old Holdings was effected pursuant to which the advisory business was transferred to Group LP. Old Holdings retained its asset management business, which includes managers of direct lending funds, hedge funds, private equity funds, collateralized loan obligation funds and certain other asset management businesses. Moelis & Company generally does not engage in these activities.
Amended and Restated Limited Partnership Agreement of Group LP
We operate our business through Group LP and its subsidiaries. The provisions governing the operations of Group LP and the rights and obligations of its partners are set forth in the amended and restated limited partnership agreement of Group LP, the material terms of which are described below. The amended and restated limited partnership agreement of Group LP is filed as an exhibit to this Form 10‑K.
Through our control of the general partner of Group LP, we have unilateral control (subject to the consent of Moelis & Company Partner Holdings LP (“Partner Holdings”) on various matters) over the affairs and decisions of Group LP. As such, we, through our officers and directors, are responsible for all operational and administrative decisions of Group LP and the day‑to‑day management of Group LP’s business.
Voting and Economic Rights
Group LP issued Class A partnership units to Moelis & Company and to the holders of Old Holdings units at the time of the reorganization. In addition, Group LP issued Class B partnership units to Moelis & Company. The Group LP Class B partnership units correspond with the economic rights of shares of Moelis & Company’s Class B common stock. Group LP Class A unitholders have no voting rights by virtue of their ownership of Group LP partnership units, except for the right to approve certain amendments to the amended and restated limited partnership agreement of Group LP, certain changes to the capital accounts of the limited partners of Group LP and any conversion of Group LP to a corporation other than for purposes of a sale transaction. Partner Holdings holds all shares of Moelis & Company Class B common stock, enabling it to exercise majority voting control over Moelis & Company and, indirectly, over Group LP.
Pursuant to the Group LP amended and restated limited partnership agreement, we have the right to determine when distributions will be made to the partners of Group LP and the amount of any such distributions. If we authorize a distribution, such distribution will be made, except as required under applicable tax law, to the partners of Group LP (i) in the case of a tax distribution, generally to the holders of partnership units in proportion to the amount of taxable income of Group LP allocated to such holder and (ii) in the case of other distributions, pro rata in accordance with the percentages of their respective partnership units.
Coordination of Moelis & Company and Group LP
At any time we issue a share of Class A common stock for cash, unless we use the proceeds for certain specified permitted purposes (including the acquisition Group LP Class A partnership units or other property), the proceeds received by us will be promptly transferred to Group LP, and Group LP will issue to us one of its Group LP Class A partnership units. At any time we issue a share of Class A common stock pursuant to our equity incentive plan we will contribute to Group LP all of the proceeds that we receive (if any), and Group LP will issue to us one of its Group LP Class A partnership units, having the same restrictions, if any, attached to the shares of Class A common stock issued under the equity incentive plan. Conversely, if we redeem or repurchase any of our shares of Class A common stock, Group LP will, immediately prior to our redemption or repurchase, redeem or repurchase an equal number of Group LP Class A partnership units held by us, upon the same terms and for the same price, as the shares of Class A common stock are redeemed or repurchased. We can only redeem or repurchase shares of Class A common stock if Group LP first redeems or repurchases an equivalent amount of Group LP Class A partnership units that we hold.
12
Exchange Rights
Subject to the terms and conditions of the Group LP amended and restated limited partnership agreement and the lock‑up restrictions described below, each Group LP Class A unitholder (except for Moelis & Company) has the right to exchange Group LP Class A partnership units, either for shares of our Class A common stock on a one‑for‑one basis, or cash (based on the market price of the shares of Class A common stock), at Group LP’s option. If Group LP chooses to exchange such units for our Class A common stock, Moelis & Company will deliver an equivalent number of shares of Class A common stock to Group LP for further delivery to the exchanging holder and receive a corresponding number of newly issued Group LP Class A partnership units. The exchanging holder’s surrendered Group LP Class A partnership units will be cancelled by Group LP. As Group LP Class A unitholders exchange their Group LP Class A partnership units, Moelis & Company’s percentage of economic ownership of Group LP will be correspondingly increased. Following each such exchange, Partner Holdings will be required to surrender to Moelis & Company a corresponding number of shares of Class B common stock, and each such share will be converted into approximately 0.00055 shares of Class A common stock, which will be delivered to Partner Holdings. Group LP will also convert an equivalent number of Class B partnership units held by Moelis & Company into Class A partnership units based on the same conversion rate.
Group LP Class A partnership units and Moelis & Company Class A common stock held by our Managing Directors (including through Partner Holdings) are subject to lock‑up agreements for four years from the date of our initial public offering. After this period, Group LP Class A partnership units held by a Managing Director will become exchangeable into Class A common stock or cash as described above and Moelis & Company Class A common stock held by a Managing Director will become transferable, in each case in three equal installments on each of the fourth, fifth and sixth anniversary of our initial public offering. In connection with the follow-on offerings of Class A common stock in January and July of 2017, the number of Group LP Class A partnership units subject to lock-up decreased and is currently 19,842,414 units. Approximately 1%, 40% and 59% of the outstanding Group LP Class A partnership units held by our managing directors will become transferable on the fourth, fifth and sixth anniversary of our initial public offering, respectively. If a Managing Director terminates his or her employment with the Company prior to the end of the lock‑up period, the Company will be entitled to extend the lock‑up period until up to the tenth anniversary of our initial public offering. We may waive the transfer and exchange restrictions set forth in the Group LP amended and restated limited partnership agreement, including in connection with an offering of shares of our Class A common stock by our Managing Directors. In addition, these restrictions cease to apply upon the death or termination of employment by us due to disability of the applicable Managing Director with respect to such Managing Director’s Group LP Class A partnership units.
Restrictive Covenants of our Managing Directors
Prior to the expiration of the Managing Director lock‑up, our Managing Directors are generally subject to forfeiting their interests in vested Group LP partnership units and Moelis & Company Class A common stock they held as of the initial public offering if they terminate their employment without good reason and compete with the Company within 12 months thereafter, except for a certain limited number of designated units and stock which were awarded to replace equity of a former employer forfeited upon joining. Our Managing Directors have agreed not to solicit our employees during the term of their employment and for 12 months thereafter.
Registration Rights
Moelis & Company has granted certain registration rights in the amended and restated limited partnership agreement of Group LP, the stockholders agreement with Partners Holdings and the strategic alliance agreement with SMBC, each filed as exhibits to this Form 10‑K.
Rights of Partner Holdings and Stockholders Agreement
Moelis & Company is party to a stockholders agreement with Partner Holdings pursuant to which, for so long as the Class B Condition (as defined in our amended and restated certificate of incorporation) is satisfied, Partner Holdings has approval rights over significant corporate actions by Moelis & Company. Our board of directors will nominate individuals designated by Partner Holdings equal to a majority of the board of directors, for so long as the Class B Condition is satisfied.
13
After the Class B Condition ceases to be satisfied, for so long as the Secondary Class B Condition (as defined in the stockholders agreement with Partners Holdings) is satisfied, Partner Holdings will have certain approval rights (including, among others, over the appointment or termination of the Chief Executive Officer) and our board of directors will nominate individuals designated by Partner Holdings equal to one quarter of the board of directors.
MARKET AND INDUSTRY DATA
The industry, market and competitive position data referenced throughout this Form 10‑K are based on research, industry and general publications, including surveys and studies conducted by third parties. Industry publications, surveys and studies generally state that they have been obtained from sources believed to be reliable. We have not independently verified such third party information. While we are not aware of any misstatements regarding any industry, market or similar data presented herein, such data involve uncertainties and are subject to change based on various factors, including those discussed under the headings “Special Note Regarding Forward‑Looking Statements” and “Risk Factors” in this Form 10‑K. The M&A market data for announced and completed transactions in 2017 and 2016 referenced throughout this Form 10‑K was obtained from Thomson Financial as of January 4, 2018 and January 3, 2017, respectively.
In this Form 10‑K, we use the term “independent investment banks” or “independent advisors” to refer to investment banks primarily focused on advisory services and that conduct limited or no commercial banking or sales and trading activities. We use the term “global independent investment banks” to refer to independent investment banks with global coverage capabilities across all major industries and regions. We consider the global independent investment banks to be our publicly traded peers, Evercore Partners Inc., Greenhill & Co., Inc., Houlihan Lokey, Inc., Lazard Ltd, PJT Partners, Inc., and us.
OTHER INFORMATION
Our website address is www.moelis.com. We make available free of charge on the Investor Relations section of our website (http://investors.moelis.com) this Annual Report on Form 10‑K (“Form 10‑K”), Quarterly Reports on Form 10‑Q, Current Reports on Form 8‑K and all amendments to those reports as soon as reasonably practicable after such material is electronically filed or furnished with the Securities and Exchange Commission (the “SEC”) pursuant to Section 13(a) or 15(d) of the Securities Exchange Act of 1934; as amended (the “Exchange Act”). We also make available through our website other reports filed with or furnished to the SEC under the Exchange Act, including our Proxy Statements and reports filed by officers and directors under Section 16(a) of that Act, as well as our Code of Business Conduct and Ethics. From time to time we may use our website as a channel of distribution of material company information. Financial and other material information regarding the Company is routinely posted on and accessible at http://investors.moelis.com. In addition, you may automatically receive email alerts and other information about us by enrolling your email by visiting the “Contact Us” section at http://investors.moelis.com. We do not intend for information contained in our website to be part of this Form 10‑K. The inclusion of our website in this Form 10‑K does not include or incorporate by reference the information on our website into this Form 10‑K.
Any materials we file with the SEC may be inspected without charge at the public reference facilities maintained by the SEC at 100 F. Street, N.E., Washington, D.C. 20549, and copies of all or any part of this Form 10‑K may be obtained from the SEC upon payment of the prescribed fee. Information on the operation of the public reference facilities may be obtained by calling the SEC at 1‑800‑SEC‑0330. The SEC maintains a website that contains reports, proxy and information statements, and other information regarding registrants that file electronically with the SEC. The address of the site is http://www.sec.gov.
Risks Related to Our Business
Our future growth will depend on, among other things, our ability to successfully identify, recruit and develop talent and will require us to commit additional resources.
We have experienced rapid growth over the past several years, which may be difficult to sustain at the same rate. Our future growth will depend on, among other things, our ability to successfully identify and recruit individuals and teams to join our firm. It typically takes time for these professionals to become profitable and effective. During that
14
time, we may incur significant expenses and expend significant time and resources toward training, integration and business development aimed at developing this new talent. If we are unable to recruit and develop profitable professionals, we will not be able to implement our growth strategy and our financial results could be materially adversely affected.
In addition, sustaining growth will require us to commit additional management, operational and financial resources and to maintain appropriate operational and financial systems to adequately support expansion, especially in instances where we open new offices that may require additional resources before they become profitable. See “—Our growth strategy may involve opening or acquiring new offices and expanding internationally and would involve hiring new Managing Directors and other senior professionals for these offices, which would require substantial investment by us and could materially and adversely affect our operating results.” There can be no assurance that we will be able to manage our expanding operations effectively, and any failure to do so could materially adversely affect our ability to grow revenue and control our expenses.
Changing market conditions can adversely affect our business in many ways, including by reducing the volume of the transactions involving our business, which could materially reduce our revenue.
As a financial services firm, we are materially affected by conditions in the global financial markets and economic conditions throughout the world. For example, our revenue is directly related to the volume and value of the transactions in which we are involved. During periods of unfavorable market or economic conditions, the volume and value of M&A transactions may decrease, thereby reducing the demand for our M&A advisory services and increasing price competition among financial services companies seeking such engagements. In addition, during periods of strong market and economic conditions, the volume and value of recapitalization and restructuring transactions may decrease, thereby reducing the demand for our recapitalization and restructuring advisory services and increasing price competition among financial services companies seeking such engagements. Our results of operations would be adversely affected by any such reduction in the volume or value of such advisory transactions. Further, in the period following an economic downturn, the volume and value of M&A transactions typically takes time to recover and lags a recovery in market and economic conditions.
Our profitability may also be adversely affected by our fixed costs and the possibility that we would be unable to scale back other costs within a time frame sufficient to match any decreases in revenue relating to changes in market and economic conditions. The future market and economic climate may deteriorate because of many factors beyond our control, including rising interest rates or inflation, terrorism or political uncertainty.
Our revenue in any given period is dependent on the number of fee‑paying clients in such period, and a significant reduction in the number of fee‑paying clients in any given period could reduce our revenue and adversely affect our operating results in such period.
Our revenue in any given period is dependent on the number of fee‑paying clients in such period. We had 175 clients and 167 clients paying fees equal to or greater than $1 million in 2017 and 2016, respectively. We may lose clients as a result of the sale or merger of a client, a change in a client’s senior management, competition from other financial advisors and financial institutions and other causes. A significant reduction in the number of fee‑paying clients in any given period could reduce our revenue and adversely affect our operating results in such period.
Our ability to retain our Managing Directors and our other professionals, including our executive officers, is critical to the success of our business.
Our future success depends to a substantial degree on our ability to retain qualified professionals within our organization, including our Managing Directors. However, we may not be successful in our efforts to retain the required personnel as the market for qualified investment bankers is extremely competitive. Our investment bankers possess substantial experience and expertise and have strong relationships with our advisory clients. As a result, the loss of these professionals could jeopardize our relationships with clients and result in the loss of client engagements. For example, if any of our Managing Directors or other senior professionals, including our executive officers, or groups of professionals, were to join or form a competing firm, some of our current clients could choose to use the services of that competitor rather than our services. There is no guarantee that our compensation and non‑competition arrangements with our Managing Directors provide sufficient incentives or protections to prevent our Managing Directors from resigning to join our competitors. In addition, some of our competitors have more resources than us which may allow them to attract
15
some of our existing employees through compensation or otherwise. The departure of a number of Managing Directors or groups of professionals could have a material adverse effect on our business and our profitability.
We depend on the efforts and reputations of Mr. Moelis and our other executive officers. Our senior leadership team’s reputations and relationships with clients and potential clients are critical elements in the success of our business. The loss of the services of our senior leadership team, in particular Mr. Moelis, could have a material adverse effect on our business, including our ability to attract clients.
Substantially all of our revenue is derived from advisory fees. As a result, our revenue and profits are highly volatile on a quarterly basis and may cause the price of our Class A common stock to fluctuate and decline.
Our revenue and profits are highly volatile. We derive substantially all of our revenue from advisory fees, generally from a limited number of engagements that generate significant fees at key transaction milestones, such as closing, the timing of which is outside of our control. We expect that we will continue to rely on advisory fees for most of our revenue for the foreseeable future. Accordingly, a decline in our advisory engagements or the market for advisory services would adversely affect our business. In addition, our financial results will likely fluctuate from quarter to quarter based on the timing of when fees are earned, and high levels of revenue in one quarter will not necessarily be predictive of continued high levels of revenue in future periods. Because we lack other, more stable, sources of revenue, which could moderate some of the volatility in our advisory revenue, we may experience greater variations in our revenue and profits than other larger, more diversified competitors in the financial services industry. Fluctuations in our quarterly financial results could, in turn, lead to large adverse movements in the price of our Class A common stock or increased volatility in our stock price generally.
Because in many cases we are not paid until the successful consummation of the underlying transaction, our revenue is highly dependent on market conditions and the decisions and actions of our clients, interested third parties and governmental authorities. For example, we may be engaged by a client in connection with a sale or divestiture, but the transaction may not occur or be consummated because, among other things, anticipated bidders may not materialize, no bidder is prepared to pay our client’s price or because our client’s business experiences unexpected operating or financial problems. We may be engaged by a client in connection with an acquisition, but the transaction may not occur or be consummated for a number of reasons, including because our client may not be the winning bidder, failure to agree upon final terms with the counterparty, failure to obtain necessary regulatory consents or board or stockholder approvals, failure to secure necessary financing, adverse market conditions or because the target’s business experiences unexpected operating or financial problems. In these circumstances, we often do not receive significant advisory fees, despite the fact that we have devoted considerable resources to these transactions.
In addition, we face the risk that certain clients may not have the financial resources to pay our agreed‑upon advisory fees. Certain clients may also be unwilling to pay our advisory fees in whole or in part, in which case we may have to incur significant costs to bring legal action to enforce our engagement agreement to obtain our advisory fees.
Our joint ventures, strategic investments and acquisitions may result in additional risks and uncertainties in our business.
In addition to recruiting and internal expansion, we may grow our core business through joint ventures, strategic investments or acquisitions.
In the case of joint ventures and strategic investments, such as Moelis Australia, we are subject to additional risks and uncertainties relating to governance and controls, in that we may be dependent upon personnel, controls and systems, including management of the business by third parties, and subject to, liability, losses or reputational damage relating to such personnel, controls and systems and the management decisions of third parties that are not under our control. Moelis Australia is a public company listed on the Australian Securities Exchange and the value of the shares held by us at any given time are subject to fluctuation as a result of their performance and prevailing market and business conditions. These fluctuations in value may be material.
In the event we make further strategic investments or acquisitions, we would face numerous risks and would be presented with financial, managerial and operational challenges, including the difficulty of integrating personnel, financial, accounting, technology and other systems and management controls.
16
If the number of debt defaults, bankruptcies or other factors affecting demand for our recapitalization and restructuring advisory services declines, our recapitalization and restructuring business could suffer.
We provide various financial recapitalization and restructuring and related advice to companies in financial distress or to their creditors or other stakeholders. A number of factors affect demand for these advisory services, including general economic conditions, the availability and cost of debt and equity financing, governmental policy and changes to laws, rules and regulations, including those that protect creditors. In addition, providing recapitalization and restructuring advisory services entails the risk that the transaction will be unsuccessful or take considerable time and can be subject to a bankruptcy court’s authority to disallow or discount our fees in certain circumstances. If the number of debt defaults, bankruptcies or other factors affecting demand for our recapitalization and restructuring advisory services declines, our recapitalization and restructuring business would be adversely affected.
Our failure to deal appropriately with actual, potential or perceived conflicts of interest could damage our reputation and materially adversely affect our business.
We confront actual, potential or perceived conflicts of interest in our business. For instance, we face the possibility of an actual, potential or perceived conflict of interest where we represent a client on a transaction in which an existing client is a party. We may be asked by two potential clients to act on their behalf on the same transaction, including two clients as potential buyers in the same acquisition transaction, and we may act for both clients if both clients agree to us doing so. In each of these situations, we face the risk that our current policies, controls and procedures do not timely identify or appropriately manage such conflicts of interest.
It is possible that actual, potential or perceived conflicts could give rise to client dissatisfaction, litigation or regulatory enforcement actions. Appropriately identifying and managing actual or perceived conflicts of interest is complex and difficult, and our reputation could be damaged if we fail, or appear to fail, to deal appropriately with one or more potential or actual conflicts of interest. Regulatory scrutiny of, or litigation in connection with, conflicts of interest could have a material adverse effect on our reputation which could materially adversely affect our business in a number of ways, including a reluctance of some potential clients and counterparties to do business with us.
Employee misconduct, which is difficult to detect and deter, could harm us by impairing our ability to attract and retain clients and by subjecting us to legal liability and reputational harm.
There have been a number of highly-publicized cases involving fraud or other misconduct by employees in the financial services industry, and there is a risk that our employees could engage in misconduct that would adversely affect our business. For example, our business often requires that we deal with confidential matters of great significance to our clients. If our employees were to improperly use or disclose confidential information provided by our clients, we could be subject to regulatory sanctions and suffer serious harm to our reputation, financial position, current client relationships and ability to attract future clients. In addition, our financial professionals and other employees are responsible for following proper measures to maintain the confidentiality of information we hold. If an employee’s failure to do so results in the improper release of confidential information, we could be subject to reputational harm and legal liability, which could impair our ability to attract and retain clients and in turn materially adversely affect our business. It is not always possible to deter employee misconduct, and the precautions we take to detect and prevent misconduct may not be effective in all cases. If our employees engage in misconduct, our business could be materially adversely affected.
We may face damage to our professional reputation if our services are not regarded as satisfactory or for other reasons.
As an advisory service firm, we depend to a large extent on our relationships with our clients and reputation for integrity and high‑caliber professional services to attract and retain clients. As a result, if a client is not satisfied with our services, it may be more damaging in our business than in other businesses.
17
We face strong competition from other financial advisory firms, many of which have the ability to offer clients a wider range of products and services than those we can offer, which could cause us to fail to win advisory mandates and subject us to pricing pressures that could materially adversely affect our revenue and profitability.
The financial services industry is intensely competitive, and we expect it to remain so. Our competitors are other investment banking and financial advisory firms. We compete on both a global and a regional basis, and on the basis of a number of factors, including depth of client relationships, industry knowledge, transaction execution skills, our range of products and services, innovation, reputation and price. In addition, in our business there are usually no long‑term contracted sources of revenue. Each revenue‑generating engagement typically is separately solicited, awarded and negotiated.
We have experienced intense competition over obtaining advisory mandates in recent years, and we may experience further pricing pressures in our business in the future as some of our competitors may seek to obtain increased market share by reducing fees.
Our primary competitors are large financial institutions, many of which have far greater financial and other resources than us and, unlike us, have the ability to offer a wider range of products, from loans, deposit taking and insurance to brokerage and trading, which may enhance their competitive position. They also regularly support investment banking, including financial advisory services, with commercial lending and other financial services and products in an effort to gain market share, which puts us at a competitive disadvantage and could result in pricing pressures or loss of opportunities, which could materially adversely affect our revenue and profitability. In addition, we may be at a competitive disadvantage with regard to certain of our competitors who are able to and often do, provide financing or market making services that are often a crucial component of the types of transactions on which we advise.
In addition to our larger competitors, over the last few years a number of independent investment banks that offer independent advisory services have emerged, with several showing rapid growth. As these independent firms or new entrants into the market seek to gain market share there could be pricing pressures, which would adversely affect our revenues and earnings.
As a member of the financial services industry, we face substantial litigation risks.
Our role as advisor to our clients on important transactions involves complex analysis and the exercise of professional judgment, including rendering “fairness opinions” in connection with mergers and other transactions. Our activities may subject us to the risk of significant legal liabilities to our clients and affected third parties, including shareholders of our clients who could bring securities class actions against us. In recent years, the volume of claims and amount of damages claimed in litigation and regulatory proceedings against financial services companies have been increasing, including claims for aiding and abetting client misconduct. Moreover, judicial scrutiny and criticism of investment banker performance and activities has increased, creating risk that our services in a litigated transaction could be criticized by the court. These risks often may be difficult to assess or quantify and their existence and magnitude often remain unknown for substantial periods of time. Our engagements typically include broad indemnities from our clients and provisions to limit our exposure to legal claims relating to our services, but these provisions may not protect us in all cases, including when a client does not have the financial capacity to pay under the indemnity. As a result, we may incur significant legal expenses in defending against or settling litigation. In addition, we may have to spend a significant amount to adequately insure against these potential claims. Substantial legal liability or significant regulatory action against us or significant criticism by a court of our performance or activities could have material adverse financial effects or cause significant reputational harm to us, which could seriously harm our business prospects.
Extensive and evolving regulation of our business and the business of our clients exposes us to the potential for significant penalties and fines due to compliance failures, increases our costs and may result in limitations on the manner in which our business is conducted.
As a participant in the financial services industry, we are subject to extensive regulation in the U.S. and internationally. We are subject to regulation by governmental and self‑regulatory organizations in the jurisdictions in which we operate. As a result of market volatility and disruption in recent years, the U.S. and other governments have taken unprecedented steps to try to stabilize the financial system including providing assistance to financial institutions and taking certain regulatory actions. The full extent of the effects of these actions and of legislative and regulatory initiatives (including the Dodd‑Frank Wall Street Reform and Consumer Protection Act) effected in connection with,
18
and as a result of, such extraordinary disruption and volatility is uncertain, both as to the financial markets and participants in general, and as to us in particular.
Our ability to conduct business and our operating results, including compliance costs, may be adversely affected as a result of any new requirements imposed by the Securities and Exchange Commission (“SEC”), FINRA or other U.S. or foreign governmental regulatory authorities or self‑regulatory organizations that regulate financial services firms or supervise financial markets. We may be adversely affected by changes in the interpretation or enforcement of existing laws and rules by these governmental authorities and self‑regulatory organizations. In addition, some of our clients or prospective clients may adopt policies that exceed regulatory requirements and impose additional restrictions affecting their dealings with us. Accordingly, we may incur significant costs to comply with U.S. and international regulation. In addition, new laws or regulations or changes in enforcement of existing laws or regulations applicable to our clients may adversely affect our business. For example, changes in antitrust enforcement could affect the level of M&A activity and changes in applicable regulations could restrict the activities of our clients and their need for the types of advisory services that we provide to them.
Our failure to comply with applicable laws or regulations could result in adverse publicity and reputational harm as well as fines, suspensions of personnel or other sanctions, including revocation of the registration of us or any of our subsidiaries as a financial advisor and could impair executive retention or recruitment. In addition, any changes in the regulatory framework could impose additional expenses or capital requirements on us, result in limitations on the manner in which our business is conducted, have an adverse impact upon our financial condition and business and require substantial attention by senior management. In addition, our business is subject to periodic examination by various regulatory authorities, and we cannot predict the outcome of any such examinations.
Our business is subject to various cybersecurity and other operational risks.
We face various cybersecurity and other operational risks related to our business on a day‑to‑day basis. We rely heavily on financial, accounting, communication and other information technology systems, and the people who operate them. These systems, including the systems of third parties on whom we rely, may fail to operate properly or become disabled as a result of tampering or a breach of our network security systems or otherwise, including for reasons beyond our control.
Our clients typically provide us with sensitive and confidential information. We are dependent on information technology networks and systems to securely process, transmit and store such information and to communicate among our locations around the world and with our clients, alliance partners and vendors. We may be subject to attempted security breaches and cyber‑attacks and a successful breach could lead to shutdowns or disruptions of our systems or third‑party systems on which we rely and potential unauthorized disclosure of sensitive or confidential information. Breaches of our or third‑party network security systems on which we rely could involve attacks that are intended to obtain unauthorized access to our proprietary information, destroy data or disable, degrade or sabotage our systems, often through the introduction of computer viruses, cyber‑attacks and other means and could originate from a wide variety of sources, including unknown third parties outside the firm. If our or third‑party systems on which we rely are compromised, do not operate properly or are disabled, we could suffer a disruption of our business, financial losses, liability to clients, regulatory sanctions and damage to our reputation. In addition, our financial professionals and other employees are responsible for following proper measures to maintain the confidentiality of information we hold. If an employee’s failure to do so results in the improper release of confidential information, we could be subject to reputational harm and legal liability, which could impair our ability to attract and retain clients and in turn materially adversely affect our business.
We operate a business that is highly dependent on information systems and technology. Any failure to keep accurate books and records can render us liable to disciplinary action by governmental and self‑regulatory authorities, as well as to claims by our clients. We rely on third‑party service providers for certain aspects of our business. Any interruption or deterioration in the performance of these third parties or failures of their information systems and technology could impair our operations, affect our reputation and adversely affect our business.
In addition, a disaster or other business continuity problem, such as a pandemic, other man‑made or natural disaster or disruption involving electronic communications or other services used by us or third parties with whom we conduct business, could lead us to experience operational challenges, and our inability to timely and successfully recover
19
could materially disrupt our business and cause material financial loss, regulatory actions, reputational harm or legal liability.
Negative publicity regarding our business and our people could adversely impact our reputation and our business.
We depend to a large extent on our reputation for integrity and high‑caliber professional services to attract and retain clients. We may experience negative publicity from time to time relating to our business and our people, regardless of whether the allegations are valid. Such negative publicity may adversely affect our business in a number of ways, including whether potential clients choose to engage us and our ability to attract and retain talent.
We may not be able to generate sufficient cash in the future to service any future indebtedness.
Our ability to make scheduled payments on or to refinance any future debt obligations depends on our financial condition and operating performance. We cannot provide assurance that we will maintain a level of cash flows from operating activities sufficient to permit us to pay the principal of, and interest on, any future indebtedness. If our cash flows and capital resources are insufficient to fund any future debt service obligations, we may be forced to reduce or delay investments and capital expenditures, or to sell assets, seek additional capital or restructure or refinance such indebtedness.
Our international operations are subject to certain risks, which may affect our revenue.
In 2017, we earned approximately 22% of our revenues from our international operations. We intend to grow our non‑U.S. business, and this growth is important to our overall success. In addition, many of our larger clients are non‑U.S. entities seeking to enter into transactions involving U.S. businesses. Our international operations carry special financial and business risks, which could include the following:
|
· |
greater difficulties in managing and staffing foreign operations; |
|
· |
language and cultural differences; |
|
· |
fluctuations in foreign currency exchange rates that could adversely affect our results; |
|
· |
unexpected changes in trading policies, regulatory requirements, tariffs and other barriers; |
|
· |
longer transaction cycles; |
|
· |
higher operating costs; |
|
· |
adverse consequences or restrictions on the repatriation of earnings; |
|
· |
potentially adverse tax consequences, such as trapped foreign losses; |
|
· |
less stable political and economic environments; and |
|
· |
civil disturbances or other catastrophic events that reduce business activity. |
If our international business increases relative to our total business, these factors could have a more pronounced effect on our operating results.
Our growth strategy may involve opening or acquiring new offices and expanding internationally and would involve hiring new Managing Directors and other senior professionals for these offices, which would require substantial investment by us and could materially and adversely affect our operating results.
Our ability to grow our advisory business organically depends in part on our ability to open or acquire new offices, expand internationally and hire new Managing Directors and other senior professionals for these offices. We may not be successful in any efforts to open new offices, expand internationally or hire new Managing Directors and other senior professionals for these offices. The costs of opening a new office, expanding internationally and hiring the
20
necessary personnel to staff the office are substantial. If we are not successful in these efforts, we may not be able to recover our investments or our substantial cost outlays, and new international operations may not achieve profitability.
We may enter into new lines of business which may result in additional risks and uncertainties in our business.
We currently generate substantially all of our revenue from advisory transactions. However, we may grow our business by entering into new lines of business. To the extent we enter into new lines of business, we will face numerous risks and uncertainties, including risks associated with actual or perceived conflicts of interest because we would no longer be limited to the advisory business, the possibility that we have insufficient expertise to engage in such activities profitably or without incurring inappropriate amounts of risk, the required investment of capital and other resources and the loss of clients due to the perception that we are no longer focusing on our core business.
Entry into certain lines of business may subject us to new laws and regulations with which we are not familiar, or from which we are currently exempt, and may lead to increased litigation and regulatory risk. In addition, certain aspects of our cost structure, such as costs for compensation, occupancy and equipment rentals, communication and information technology services, and depreciation and amortization will be largely fixed, and we may not be able to timely adjust these costs to match fluctuations in revenue related to our entering into new lines of business. If a new business generates insufficient revenues or if we are unable to efficiently manage our expanded operations, our results of operations could be materially adversely affected.
Fluctuations in foreign currency exchange rates could adversely affect our results.
Because our financial statements are denominated in U.S. dollars and we receive a portion of our net revenue in other currencies (including euros and pound sterling), we are exposed to fluctuations in foreign currencies. In addition, we pay certain of our expenses in such currencies. We have not entered into any transactions to hedge our exposure to these foreign exchange fluctuations through the use of derivative instruments or otherwise. An appreciation or depreciation of any of these currencies relative to the U.S. dollar would result in an adverse or beneficial impact, respectively, to our financial results.
The cost of compliance with international broker‑dealer, employment, labor, benefits and tax regulations may adversely affect our business and hamper our ability to expand internationally.
Since we operate our business both in the U.S. and internationally, we are subject to many distinct broker‑dealer, employment, labor, benefits and tax laws in each country in which we operate, including regulations affecting our employment practices and our relations with our employees and service providers. If we are required to comply with new regulations or new interpretations of existing regulations, or if we are unable to comply with these regulations or interpretations, our business could be adversely affected or the cost of compliance may make it difficult to expand into new international markets. Additionally, our competitiveness in international markets may be adversely affected by regulations requiring, among other things, the awarding of contracts to local contractors, the employment of local citizens and/or the purchase of services from local businesses or favoring or requiring local ownership.
Risks Related to Our Organizational Structure
Moelis & Company’s only assets are its partnership interests in Group LP, its equity interest in the sole general partner of Group LP, Moelis & Company Group GP LLC, and its interests in its subsidiaries, and Moelis & Company is accordingly dependent upon distributions from Group LP to pay dividends, taxes and other expenses.
Moelis & Company is a holding company, and its only assets are its partnership interests in Group LP, its equity interest in the sole general partner of Group LP, Moelis & Company Group GP LLC, and its interests in its subsidiaries. Moelis & Company has no independent means of generating revenue. Moelis & Company intends to cause Group LP to make distributions to its partners in an amount sufficient to cover all applicable taxes payable, other expenses and dividends, if any, declared by us.
Group LP is generally prohibited under Delaware law from making a distribution to a partner to the extent that, at the time of the distribution, after giving effect to the distribution, liabilities of Group LP (with certain exceptions) exceed the fair value of its assets. Furthermore, certain subsidiaries of Group LP may be subject to similar legal
21
limitations on their ability to make distributions to Group LP. Moreover, our regulated subsidiaries may be subject to regulatory capital requirements that limit the distributions that may be made by those subsidiaries.
Deterioration in the financial condition, earnings or cash flow of Group LP and its subsidiaries for any reason could limit or impair their ability to pay such distributions. Additionally, to the extent that Moelis & Company requires funds and Group LP is restricted from making such distributions under applicable law or regulation or under the terms of financing arrangements, or is otherwise unable to provide such funds, our liquidity and financial condition could be materially adversely affected.
A change in relevant income tax laws, regulations, or treaties, or an adverse interpretation of these items by tax authorities, could result in an audit adjustment or revaluation of our deferred tax assets that may cause our effective tax rate and tax liability to be higher than what is currently presented in the consolidated statements of financial condition.
As part of the process of preparing our consolidated statements of financial condition, we are required to estimate income taxes in each of the jurisdictions in which we operate. Significant management judgment is required in determining our provision for income taxes, our deferred tax assets and liabilities, and any valuation allowance recorded against our deferred tax assets. This process requires us to estimate our actual current tax liability and to assess temporary differences resulting from differing book versus tax treatment. Our effective tax rate and tax liability is based on the application of current income tax laws, regulations, and treaties. These laws, regulations, and treaties are complex, and the manner in which they apply to our facts and circumstance is sometimes open to interpretation. We believe our application of current laws, regulations, and treaties to be correct and sustainable upon examination by the tax authorities. However, the tax authorities could challenge our interpretation resulting in additional tax liability or adjustment to our income tax provision that could increase our effective tax rate. In addition, tax laws, regulations, or treaties enacted in the future may cause us to revalue our net deferred tax assets and have a material change to our effective tax rate.
We will be required to pay our Managing Directors for certain tax benefits we may claim as a result of the tax basis step‑up we receive in connection with follow-on offerings and related transactions. In certain circumstances, payments under the tax receivable agreement may be accelerated and/or significantly exceed the actual tax benefits we realize.
Group LP Class A partnership units may be exchanged for shares of Class A common stock. On the date of our initial public offering in April 2014, we were treated for U.S. federal income tax purposes as having directly purchased Class A partnership units in Group LP from the then existing unitholders which resulted in an increase in the tax basis of the assets of Group LP that otherwise would not have been available. The exchange and purchases of Class A partnership units in Group LP in connection with the initial public offering and additional follow-on offerings, may also result in increases in the tax basis of the assets of Group LP that otherwise would not have been available. Such increases in tax basis are likely to increase (for tax purposes) depreciation and amortization deductions and therefore reduce the amount of income tax we would otherwise be required to pay in the future. These increases in tax basis may also decrease gain (or increase loss) on future dispositions of certain capital assets to the extent the increased tax basis is allocated to those capital assets. The Internal Revenue Service (the “IRS”) may challenge all or part of these tax basis increases, and a court could sustain such a challenge.
We have entered into a tax receivable agreement with our Managing Directors that provides for the payment by us to our Managing Directors of 85% of the amount of cash savings, if any, in U.S. federal, state and local income tax or franchise tax that we actually realize as a result of (a) the increases in tax basis attributable to our Managing Directors and (b) tax benefits related to imputed interest deemed to be paid by us as a result of this tax receivable agreement. While the actual increase in tax basis, as well as the amount and timing of any payments under the tax receivable agreement, will vary depending upon a number of factors, including the timing of exchanges, the price of shares of our Class A common stock at the time of the exchange, the extent to which such exchanges are taxable, and the amount and timing of our income, we expect that, as a result of the size of the increases in the tax basis of the tangible and intangible assets of Group LP attributable to our interests in Group LP, during the expected term of the tax receivable agreement, the payments that we may make to our Managing Directors could be substantial.
Although we are not aware of any issue that would cause the IRS to challenge a tax basis increase, our Managing Directors generally will not reimburse us for any payments that may previously have been made under the tax
22
receivable agreement. As a result, in certain circumstances we could make payments to the Managing Directors under the tax receivable agreement in excess of our cash tax savings. Our ability to achieve benefits from any tax basis increase, and the payments to be made under the tax receivable agreement, will depend upon a number of factors, as discussed above, including the timing and amount of our future income.
In addition, the tax receivable agreement provides that, upon a merger, asset sale or other form of business combination or certain other changes of control or if, at any time, we elect an early termination of the tax receivable agreement, our (or our successor’s) obligations with respect to exchanged or acquired Class A partnership units (whether exchanged or acquired before or after such change of control or early termination) would be based on certain assumptions, including that we would have sufficient taxable income to fully utilize the deductions arising from the increased tax deductions and tax basis and other benefits related to entering into the tax receivable agreement, and, in the case of certain early termination elections, that any Class A partnership units that have not been exchanged will be deemed exchanged for the market value of the Class A common stock at the time of termination. Consequently, it is possible, in these circumstances also, that the actual cash tax savings realized by us may be significantly less than the corresponding tax receivable agreement payments.
If Moelis & Company were deemed an “investment company” under the Investment Company Act of 1940 as a result of its ownership of Group LP, applicable restrictions could make it impractical for us to continue our business as contemplated and could materially and adversely affect our operating results.
If Moelis & Company were to cease participation in the management of Group LP, its interests in Group LP could be deemed an “investment security” for purposes of the Investment Company Act of 1940 (the “1940 Act”). Generally, a person is deemed to be an “investment company” if it owns investment securities having a value exceeding 40% of the value of its total assets (exclusive of U.S. government securities and cash items), absent an applicable exemption. Moelis & Company has no assets other than its partnership interests in Group LP and its equity interest in the sole general partner of Group LP, Moelis & Company Group GP LLC and its interests in its subsidiaries. A determination that this interest in Group LP was an investment security could result in Moelis & Company being an investment company under the 1940 Act and becoming subject to the registration and other requirements of the 1940 Act. We intend to conduct our operations so that we will not be deemed an investment company. However, if we were to be deemed an investment company, restrictions imposed by the 1940 Act, including limitations on our capital structure and our ability to transact with affiliates, could make it impractical for us to continue our business as contemplated and have a material adverse effect on our business and operating results and the price of our Class A common stock.
We and Old Holdings have entered into various arrangements, including a master separation agreement, which contains cross‑indemnification obligations of us and Old Holdings.
The master separation agreement that we entered into with Old Holdings provides, among other things, that Old Holdings generally will indemnify us for losses that we incur arising out of, or relating to, the businesses conducted by Old Holdings and losses that we incur arising out of, or relating to, Old Holdings’ breach of the master separation agreement. In addition, we generally will indemnify Old Holdings for losses that Old Holdings incurs arising out of, or relating to, our business and losses Old Holdings’ incurs arising out of, or relating to, our breach of the master separation agreement. We may not be able to recover any or all of the amount of indemnified losses from Old Holdings should it be financially unable to perform under its indemnification obligations. In addition, we may be required to make substantial payments under our indemnity obligations to Old Holdings, which could materially adversely affect our results of operations.
The use of the “Moelis” brand name by either Old Holdings and its subsidiaries or Moelis Australia may expose us to reputational harm that could adversely affect our business should they take actions that damage the brand name.
Old Holdings and Moelis Australia operate as separate legal entities. We have licensed to Old Holdings and its subsidiaries the use of the “Moelis” brand name for certain purposes, including in connection with asset management activities. We have licensed to Moelis Australia the use of the “Moelis” brand name in connection with its financial advisory services business, an equity capital markets and research, sales and trading business covering Australian public equity securities and asset management businesses. As Old Holdings and its subsidiaries and Moelis Australia historically have and will continue to use the “Moelis” brand name, and because we no longer control these entities, there is a risk of reputational harm to us if any of Old Holdings, its subsidiaries or Moelis Australia, among other things, have engaged, or in the future were to engage in poor business practices, or were to experience adverse results or
23
otherwise damage the reputational value of the “Moelis” brand name. These risks could adversely affect our revenue and our business prospects.
Risks Related to Our Class A Common Stock
Control by Mr. Moelis of the voting power in Moelis & Company may give rise to actual or perceived conflicts of interests.
Moelis & Company is controlled by Mr. Moelis, through his control of Partner Holdings. Mr. Moelis’ interests may differ from those of other stockholders. As of December 31, 2017, Mr. Moelis controls approximately 86% of the voting interest in Moelis & Company primarily through his control of Partner Holdings, which currently holds all outstanding Class B common stock. The shares of Class B common stock entitle Partner Holdings to (i) for so long as the Class B Condition is satisfied, ten votes per share and (ii) after the Class B Condition ceases to be satisfied, one vote per share. In addition, Moelis & Company has entered into a stockholders agreement with Partner Holdings, pursuant to which, for so long as the Class B Condition is satisfied, Partner Holdings has certain approval rights over certain transactions. As a result, because Mr. Moelis has a majority of the voting power in Moelis & Company and our amended and restated certificate of incorporation provides for cumulative voting, he has the ability to elect all of the members of our board of directors and thereby to control our management and affairs, including determinations with respect to acquisitions, dispositions, borrowings, issuances of Class A common stock or other securities, and the declaration and payment of dividends. Mr. Moelis is able to determine the outcome of all matters requiring stockholder approval and is able to cause or prevent a change of control of Moelis & Company or a change in the composition of our board of directors and could preclude any unsolicited acquisition of Moelis & Company. Mr. Moelis’ voting control could deprive our stockholders of an opportunity to receive a premium for their Class A common stock as part of a sale of Moelis & Company and might ultimately affect the market price of our Class A common stock. As a result of the control exercised by Mr. Moelis over us, our agreements entered into with him prior to or in connection with our initial public offering may not have been negotiated on “arm’s length” terms. We cannot assure you that we would not have received more favorable terms from an unaffiliated party.
We are a “controlled company” within the meaning of the rules of the New York Stock Exchange and, as a result, qualify for, and intend to rely on, exemptions from certain corporate governance requirements. You do not have the same protections afforded to stockholders of companies that are subject to such requirements.
Mr. Moelis, through his control of Partner Holdings, holds more than 50% of the voting power of our shares eligible to vote. As a result, we are a “controlled company” under the rules of the New York Stock Exchange (“NYSE”). Under these rules, a company of which more than 50% of the voting power in the election of directors is held by an individual, group or another company is a “controlled company” and may elect not to comply with certain corporate governance requirements, including the requirements that (i) a majority of the board of directors consist of independent directors and (ii) that the board of directors have compensation and nominating and corporate governance committees composed entirely of independent directors.
For at least some period, we intend to utilize these exemptions. As a result, we do not have a majority of independent directors on our board of directors. Accordingly, although we may transition to a board with a majority of independent directors prior to the time we cease to be a “controlled company,” for such period of time you will not have the same protections afforded to stockholders of companies that are subject to all of the corporate governance requirements set by the NYSE. In the event that we cease to be a “controlled company” and our shares continue to be listed on the NYSE, we will be required to comply with these provisions within the applicable transition periods. These exemptions do not modify the independence requirements for our audit committee, and we intend to comply with the applicable requirements of the SEC and the NYSE with respect to our audit committee within the applicable time frame.
Failure to maintain effective internal controls in accordance with Section 404 of the Sarbanes‑Oxley Act of 2002 could have a material adverse effect on our business and share price.
As a publicly traded company, we are required to document and test our internal control procedures in order to satisfy the requirements of Section 404(a) of Sarbanes‑Oxley, which requires, beginning with the filing of our second annual report with the SEC, annual management assessments of the effectiveness of our internal control over financial reporting. Our independent registered public accounting firm may not be able or willing to issue an unqualified report on the effectiveness of our internal control over financial reporting. Matters impacting our internal controls may cause us to
24
be unable to report our financial information on a timely basis and thereby subject us to adverse regulatory consequences, including sanctions by the SEC, or violations of applicable stock exchange listing rules. There could also be a negative reaction in the financial markets due to a loss of investor confidence in us and the reliability of our financial statements. Confidence in the reliability of our financial statements is also likely to suffer if our independent registered public accounting firm reports a material weakness in our internal control over financial reporting. This could materially adversely affect us and lead to a decline in the market price of our shares.
If securities analysts do not publish research or reports about our business or if they downgrade our Company or our sector, the price of our Class A common stock could decline.
The trading market for our Class A common stock depends in part on the research and reports that industry or financial analysts publish about us or our business. We do not control these analysts. Furthermore, if one or more of the analysts who do cover us downgrades our Company or our industry, or the stock of any of our competitors, the price of our Class A common stock could decline. If one or more of these analysts ceases coverage of our Company, we could lose visibility in the market, which in turn could cause the price of our Class A common stock to decline.
Our share price may decline due to the large number of shares eligible for future sale and for exchange.
The market price of our Class A common stock could decline as a result of sales of a large number of shares of Class A common stock in the market as a result of and after the offering contemplated by our Registration Statement on Form S‑3 Registration No. 333‑203499 or the perception that such sales could occur. These sales, or the possibility that these sales may occur, also might make it more difficult for us to sell equity securities in the future at a time and at a price that we deem appropriate. As of February 14, 2018, we had outstanding 33,525,277 shares of Class A common stock, most of which may be resold immediately in the public market. In addition, holders of a significant amounts of Group LP Class A partnership units may elect to exchange their units and they may receive shares of our Class A common stock. Further, restrictions on sales of certain shares of Class A common stock by certain of our pre‑IPO equityholders expired on April 22, 2015, and such shares are now eligible for resale from time to time, and employees who have received shares of Class A common stock upon settlement of restricted stock units are currently able to sell such shares, subject to any blackout periods we impose on employees and restrictions under the Securities Act of 1933, as amended (the “Securities Act”). On April 30, 2015, we entered into an agreement with Sumitomo Mitsui Banking Corporation (“SMBC”), our strategic alliance partner, to permit SMBC, subject to the terms of the Group LP limited partnership agreement, to exchange half of its Group LP Class A partnership units (1,280,054 units) into Moelis & Company Class A common stock on or after July 1, 2015 and the remaining 50% (1,280,053 units) on or after April 22, 2016. Existing Group LP Class A partnership unitholders (including certain Managing Directors) owned, as of February 14, 2018, an aggregate of 22,472,337 Class A partnership units. Our amended and restated certificate of incorporation allows the exchange of Class A partnership units in Group LP (other than those held by us) for shares of our Class A common stock on a one‑for‑one basis, subject to customary conversion rate adjustments for stock splits, stock dividends and reclassifications. Further, Partner Holdings held 19,912,230 shares of our Class B common stock, which will be convertible into 11,016 shares of our Class A common stock. Shares of Class A common stock (including those issuable upon exchange of Group LP partnership units) that are held by the Group LP Class A partnership unitholders (including our Managing Directors) will be eligible for resale from time to time, subject to certain contractual restrictions and to restrictions under the Securities Act.
The general partner of Group LP (“General Partner”) has determined that certain holders of Group LP Class A partnership units will be eligible to exchange on a one‑for‑one basis for our Class A common stock in May 2018, subject to the General Partner’s discretion to postpone or cancel the redemption date. The number of units eligible for exchange on such date is up to 2,629,923 units, 2,560,107 of which are Group LP partnership units held by SMBC. Holders who elect to exchange may choose to sell or hold the Class A common stock. Units eligible for exchange exclude 19,842,414 units held by Managing Directors that they received as Managing Directors which units remain subject to lock‑up provisions in three installments (which were equal installments at the time of our initial public offering) through each of the fourth, fifth and sixth anniversary of our initial public offering. In connection with the follow-on offerings of Class A common stock in January and July of 2017, the number of Group LP Class A partnership units subject to lock-up decreased and is currently 19,842,414 units. Approximately 1%, 40% and 59% of the outstanding Group LP Class A partnership units held by our managing directors will become transferable on the fourth, fifth and sixth anniversary of our initial public offering, respectively. The General Partner intends to establish redemption dates from time to time in the ordinary course in accordance with the terms of the Group LP limited partnership agreement and the Company does not intend to disclose future redemption dates.
25
Certain Class A partnership unitholders in Group LP and holders of our Class A common stock are parties to agreements with us pursuant to which we have granted them registration rights. Under those agreements, these persons will have the ability to cause us to register the shares of our Class A common stock (including the shares they could acquire upon exchange of Class A partnership units in Group LP), subject to certain contractual restrictions. See “Exchanges of Group LP Class A Partnership Units For Moelis & Company Class A Common Stock.”
The market price of our Class A common stock may be volatile, which could cause the value of your investment to decline.
Securities markets worldwide experience significant price and volume fluctuations. This market volatility, as well as general economic, market or political conditions, could reduce the market price of our Class A common stock in spite of our operating performance. In addition, our operating results could be below the expectations of public market analysts and investors, and in response, the market price of our Class A common stock could decrease significantly. You may be unable to resell your shares of our Class A common stock at or above the public offering price.
While we currently intend to pay a quarterly cash dividend to our stockholders, we may change our dividend policy at any time. There can be no assurance that we will continue to declare cash dividends.
On February 6, 2018, the Board of Directors of Moelis & Company declared a special dividend of $1.50 per share in addition to a regular quarterly dividend of $0.47 per share. The $1.97 per share will be paid on March 7, 2018 to Class A common stockholders of record on February 20, 2018. Although we currently intend to pay a quarterly cash dividend to our stockholders, we have no obligation to do so, and our dividend policy may change at any time. Returns on stockholders’ investments will primarily depend on the appreciation, if any, in the price of our Class A common stock. Whether we continue and the amount and timing of any dividends are subject to capital availability and periodic determinations by our Board of Directors that cash dividends are in the best interest of our stockholders and are in compliance with all respective laws and agreements of the Company applicable to the declaration and payment of cash dividends. Future dividends, including their timing and amount, may be affected by, among other factors: general economic and business conditions; our financial condition and operating results; our available cash and current anticipated cash needs; capital requirements; contractual, legal, tax and regulatory restrictions and implications on the payment of dividends by us to our stockholders; and such other factors as our board of directors may deem relevant. Our dividend payments may change from time to time, and we cannot provide assurance that we will continue to declare dividends in any particular amounts or at all. The reduction in or elimination of our dividend payments could have a negative effect on our stock price.
Anti‑takeover provisions in our organizational documents and Delaware law could delay or prevent a change in control.
Our amended and restated certificate of incorporation and bylaws may delay or prevent a merger or acquisition that a stockholder may consider favorable by permitting our board of directors to issue one or more series of preferred stock, requiring advance notice for stockholder proposals and nominations and placing limitations on convening stockholder meetings. In addition, there is no cumulative voting in the election of directors, and our amended and restated certificate of incorporation provides that directors may be removed, with or without cause, only with the affirmative vote of at least 80% of the voting interest of stockholders entitled to vote; provided, however, that for so long as the Class B Condition is satisfied, directors may be removed, with or without cause, with the affirmative vote of a majority of the voting interest of stockholders entitled to vote. In addition, we are subject to provisions of the Delaware General Corporation Law that restrict certain business combinations with interested stockholders. These provisions may also discourage acquisition proposals or delay or prevent a change in control, which could harm our stock price. See “Description of Capital Stock.”
Item 1B. Unresolved Staff Comments
Not applicable.
Our principal executive offices are located in leased office space at 399 Park Avenue, 5th Floor, New York,
26
New York 10022. We lease the space for our offices in Beijing, Boston, Chicago, Dubai, Frankfurt, Hong Kong, Houston, London, Los Angeles, Melbourne, Mumbai, Paris, San Francisco, São Paulo, Sydney and Washington DC. We do not own any real property. We consider these arrangements to be adequate for our present needs.
In the ordinary course of business, from time to time the Company and its affiliates are involved in judicial or regulatory proceedings, arbitration or mediation concerning matters arising in connection with the conduct of its businesses, including contractual and employment matters. In addition, government agencies and self‑regulatory organizations conduct periodic examinations and initiate administrative proceedings regarding the Company’s business, including, among other matters, compliance, accounting and operational matters, that can result in censure, fine, the issuance of cease‑and‑desist orders or the suspension or expulsion of a broker‑dealer, investment advisor, or its directors, officers or employees. In view of the inherent difficulty of determining whether any loss in connection with such matters is probable and whether the amount of such loss can be reasonably estimated, particularly in cases where claimants seek substantial or indeterminate damages or where investigations and proceedings are in the early stages, the Company cannot estimate the amount of such loss or range of loss, if any, related to such matters, how or if such matters will be resolved, when they will ultimately be resolved, or what the eventual settlement, fine, penalty or other relief, if any, might be. Subject to the foregoing, the Company believes, based on current knowledge and after consultation with counsel, that it is not currently party to any material pending proceedings, individually or in the aggregate, the resolution of which would have a material effect on the Company.
Item 4. Mine Safety Disclosures
Not applicable.
27
Item 5. Market for Registrant’s Common Equity, Related Stockholder Matters and Issuer Purchases of Equity Securities
Our Class A common stock is traded on the New York Stock Exchange under the symbol “MC.” There is no publicly traded market for our Class B common stock, which is held by Moelis & Company Partner Holdings LP. The following table sets forth, for the fiscal quarters indicated, the high and low sales prices per share of our Class A common stock, as reported in the consolidated transaction reporting system, and the quarterly dividends declared during fiscal 2017 and 2016.
|
|
|
Year Ended December 31, 2017 |
|
|||||||
|
|
|
Sales Price |
|
Dividends per share |
|
|||||
|
|
|
High |
|
Low |
|
of common stock |
|
|||
|
First quarter |
|
$ |
38.70 |
|
$ |
33.60 |
|
$ |
0.37 |
|
|
Second quarter |
|
$ |
38.90 |
|
$ |
34.85 |
|
$ |
1.37 |
|
|
Third quarter |
|
$ |
43.80 |
|
$ |
38.30 |
|
$ |
0.37 |
|
|
Fourth quarter |
|
$ |
49.80 |
|
$ |
41.60 |
|
$ |
0.37 |
|
|
|
|
Year Ended December 31, 2016 |
|
|||||||
|
|
|
Sales Price |
|
Dividends per share |
|
|||||
|
|
|
High |
|
Low |
|
of common stock |
|
|||
|
First quarter |
|
$ |
28.55 |
|
$ |
23.64 |
|
$ |
1.10 |
|
|
Second quarter |
|
$ |
28.87 |
|
$ |
22.02 |
|
$ |
0.30 |
|
|
Third quarter |
|
$ |
27.10 |
|
$ |
22.25 |
|
$ |
0.32 |
|
|
Fourth quarter |
|
$ |
35.35 |
|
$ |
24.05 |
|
$ |
1.57 |
|
Since the IPO in April 2014, the Company has regularly declared and paid quarterly dividends and plans to continue paying regularly quarterly dividends. The Company has increased the quarterly dividend at least annually. The initial quarterly dividend declared in 2014 was $0.20 per share, and the Company most recently declared a quarterly dividend of $0.47 per share in February of 2018.
As of February 14, 2018, there were approximately 101 holders of record of our Class A common stock. This does not include the number of shareholders that hold shares in “street‑name” through banks or broker‑dealers.
Dividend Policy
The Company paid cash dividends as represented in the table above. In addition to cash dividends, the Company generally pays dividend equivalents, in the form of unvested restricted stock units (“RSU”), concurrently with the payment of dividends to the holders of Class A common stock, on RSUs which are typically granted as part of annual incentive compensation and to new hires. The dividend equivalents have the same vesting and delivery terms as the underlying RSUs.
The declaration and payment of any future dividends will be at the sole discretion of our board of directors. Our board of directors will take into account: general economic and business conditions; our financial condition and operating results; our available cash and current anticipated cash needs; capital requirements; contractual, legal, tax and regulatory restrictions and implications on the payment of dividends by us to our stockholders; and such other factors as our board of directors may deem relevant.
Stock Performance
The following performance graph and related information shall not be deemed “soliciting material” or to be “filed” with the Securities and Exchange Commission, nor shall such information be incorporated by reference into any future filing under the Securities Act of 1933, as amended, or the Exchange Act except to the extent we specifically incorporate it by reference into such filing. Our stock price performance shown in the graph below is not indicative of future stock price performance.
28
The stock performance graph below compares the performance of an investment in our Class A common stock, from April 15, 2014 through December 31, 2017, with that of the S&P 500 Index and the S&P Financial Index. The graph assumes $100 was invested in our initial public offering of Class A common stock on April 15, 2014, the S&P 500 Index and the S&P Financial Index. It also assumes that dividends were reinvested on the date of payment without payment of any commissions. The performance shown in the graph represents past performance and should not be considered an indication of future performance.
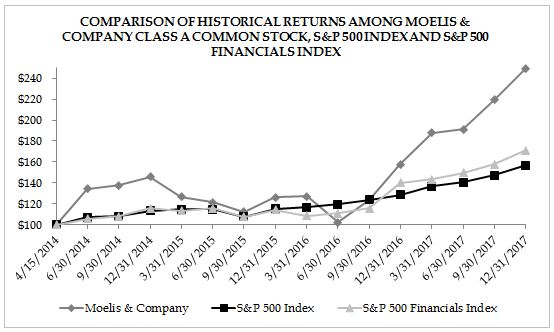
Share Repurchases in the Fourth Quarter of 2017
The following table sets forth information regarding the Company’s purchases of its Class A common stock on a monthly basis during the fourth quarter of 2017. Share repurchases are recorded on a trade date basis.
|
|
|
|
|
|
|
|
|
|
|
Approximate Dollar |
||
|
|
|
|
|
|
|
|
|
|
|
Value of Shares |
||
|
|
|
|
|
|
|
|
Shares Purchased |
|
that May Yet be |
|||
|
|
|
Total Number |
|
|
|
|
as Part of Publicly |
|
Purchased Under |
|||
|
|
|
of Shares |
|
Average Price |
|
Announced Plans |
|
the Plan |
||||
|
Period |
|
Purchased(1) |
|
Paid per Share |
|
or Programs(2) |
|
Or Programs(2) |
||||
|
October 1 - October 31 |
|
36,540 |
|
$ |
42.57 |
|
$ |
— |
|
$ |
20.0 |
million |
|
November 1 - November 30 |
|
12,088 |
|
|
47.45 |
|
|
— |
|
|
20.0 |
million |
|
December 1 - December 31 |
|
6,188 |
|
|
48.00 |
|
|
— |
|
|
20.0 |
million |
|
Total |
|
54,816 |
|
$ |
44.26 |
|
$ |
— |
|
$ |
20.0 |
million |
|
(1) |
These include treasury transactions arising from net settlement of equity awards to satisfy minimum tax obligations. |
|
(2) |
In the first quarter of 2015, the Board of Directors authorized the repurchase of up to $25 million of shares of Class A common stock and/or Class A partnership units of Group LP with no expiration date. Under this share repurchase program, shares may be repurchased from time to time in open market transactions, in privately negotiated transactions or otherwise. The timing and the actual number of shares repurchased will be opportunistic and measured in nature and will depend on a variety of factors, including price and market conditions. |
Equity Compensation Plan Information
See Item 12, “Security Ownership of Certain Beneficial Owners and Management and Related Stockholder
29
Matters—Equity Compensation Plan Information.”
Item 6. Selected Financial Data
The following selected financial and other data should be read together with “Management’s Discussion and Analysis of Financial Condition and Results of Operations” and the historical financial statements and related notes included elsewhere in this Form 10‑K.
The selected historical financial data for the years ended December 31, 2017, 2016 and 2015 and as of December 31, 2017 and 2016 have been derived from our audited consolidated financial statements included this Form 10‑K.
We derived the selected historical financial data for the years ended December 31, 2014 and 2013 and as of December 31, 2015, 2014 and 2013 from our audited consolidated and combined financial statements which are not included in this Form 10‑K.
30
|
|
|
Year Ended December 31, |
|
|||||||||||||
|
($ in thousands, except per share data) |
|
2017(1) |
|
2016(2) |
|
2015(3) |
|
2014(4) |
|
2013 |
|
|||||
|
Statement of Operations Data |
|
|
|
|
|
|
|
|
|
|
|
|
|
|
|
|
|
Revenues |
|
$ |
684,615 |
|
$ |
613,373 |
|
$ |
551,863 |
|
$ |
518,750 |
|
$ |
411,386 |
|
|
Expenses: |
|
|
|
|
|
|
|
|
|
|
|
|
|
|
|
|
|
Compensation and benefits |
|
|
401,384 |
|
|
360,893 |
|
|
311,224 |
|
|
377,219 |
|
|
264,944 |
|
|
Non-compensation expenses |
|
|
118,949 |
|
|
91,391 |
|
|
103,136 |
|
|
93,787 |
|
|
76,333 |
|
|
Total operating expenses |
|
|
520,333 |
|
|
452,284 |
|
|
414,360 |
|
|
471,006 |
|
|
341,277 |
|
|
Operating income (loss) |
|
|
164,282 |
|
|
161,089 |
|
|
137,503 |
|
|
47,744 |
|
|
70,109 |
|
|
Other income and expenses |
|
|
177,728 |
|
|
509 |
|
|
2,085 |
|
|
736 |
|
|
(771) |
|
|
Income (loss) from equity method investments |
|
|
8,341 |
|
|
5,076 |
|
|
4,476 |
|
|
(2,185) |
|
|
3,681 |
|
|
Income (loss) before income taxes |
|
|
350,351 |
|
|
166,674 |
|
|
144,064 |
|
|
46,295 |
|
|
73,019 |
|
|
Provision for income taxes |
|
|
223,827 |
|
|
24,809 |
|
|
23,847 |
|
|
13,740 |
|
|
2,794 |
|
|
Net income (loss) |
|
$ |
126,524 |
|
$ |
141,865 |
|
$ |
120,217 |
|
$ |
32,555 |
|
$ |
70,225 |
|
|
Net income (loss) attributable to noncontrolling interest |
|
|
97,124 |
|
|
103,478 |
|
|
87,113 |
|
|
35,567 |
|
|
|
|
|
Net income (loss) attributable to Moelis & Company |
|
$ |
29,400 |
|
$ |
38,387 |
|
$ |
33,104 |
|
$ |
(3,012) |
|
|
|
|
|
Weighted-average shares of Class A common stock outstanding |
|
|
|
|
|
|
|
|
|
|
|
|
|
|
|
|
|
Basic |
|
|
30,597,058 |
|
|
20,933,757 |
|
|
20,021,652 |
|
|
15,911,819 |
|
|
|
|
|
Diluted |
|
|
37,675,511 |
|
|
24,242,302 |
|
|
21,362,571 |
|
|
15,911,819 |
|
|
|
|
|
Net income (loss) attributable to holders of shares of Class A common stock per share |
|
|
|
|
|
|
|
|
|
|
|
|
|
|
|
|
|
Basic |
|
$ |
0.96 |
|
$ |
1.83 |
|
$ |
1.65 |
|
$ |
(0.19) |
|
|
|
|
|
Diluted |
|
$ |
0.78 |
|
$ |
1.58 |
|
$ |
1.55 |
|
$ |
(0.19) |
|
|
|
|
|
Dividends declared per share of Class A common stock |
|
$ |
2.48 |
|
$ |
3.29 |
|
$ |
1.00 |
|
$ |
1.40 |
|
|
|
|
|
Statement of Financial Condition Data (period end) |
|
|
|
|
|
|
|
|
|
|
|
|
|
|
|
|
|
Total assets |
|
$ |
699,068 |
|
$ |
598,800 |
|
$ |
539,461 |
|
$ |
464,249 |
|
$ |
443,463 |
|
|
Total liabilities |
|
|
354,812 |
|
|
347,359 |
|
|
282,043 |
|
|
289,864 |
|
|
134,093 |
|
|
Equity |
|
|
344,256 |
|
|
251,441 |
|
|
257,418 |
|
|
174,385 |
|
|
309,370 |
|
|
Other Data and Metrics |
|
|
|
|
|
|
|
|
|
|
|
|
|
|
|
|
|
Bankers at period-end |
|
|
512 |
|
|
446 |
|
|
462 |
|
|
381 |
|
|
317 |
|
|
Managing Directors at period-end |
|
|
118 |
|
|
102 |
|
|
105 |
|
|
94 |
|
|
86 |
|
|
Number of fee-paying clients |
|
|
311 |
|
|
305 |
|
|
269 |
|
|
256 |
|
|
263 |
|
|
Number of fee-paying clients ≥ $1M |
|
|
175 |
|
|
167 |
|
|
139 |
|
|
130 |
|
|
109 |
|
|
% of total revenue from top 10 transactions |
|
|
18 |
% |
|
20 |
% |
|
25 |
% |
|
23 |
% |
|
23 |
% |
|
(1) |
Results of operations for the year ended December 31, 2017 include approximately $4.2 million of expense associated with the amortization of restricted stock units and stock options granted in connection with the IPO. In addition, other income and expenses includes a gain of approximately $134.7 million from the reduction in liability pursuant to the tax receivable agreement, and provision for income taxes includes expense of approximately $181.0 million principally from the re-measurement of the Company’s net deferred tax assets, both in connection with the Tax Cuts and Jobs Act enacted on December 22, 2017. Other income and expenses also includes $41.7 million of gains from Moelis Australia’s IPO in April 2017 and subsequent share issuances through the remainder of the year. |
|
(2) |
Results of operations for the year ended December 31, 2016 include approximately $5.2 million of expense associated with the amortization of restricted stock units and stock options granted in connection with the IPO. |
|
(3) |
Results of operations for the year ended December 31, 2015 include approximately $5.8 million of expense associated with the amortization of restricted stock units and stock options granted in connection with the IPO. |
|
(4) |
Results of Operations for the year ended December 31, 2014 include approximately $112.4 million of pre-tax one time charges primarily associated with accelerating the vesting of pre-IPO equity held by Managing Directors in connection with the Company’s IPO completed in April 2014. Following the vesting acceleration, pre-IPO equity held by our Managing Directors is subject to a minimum four to six years lock-up. |
31
Item 7. Management’s Discussion and Analysis of Financial Condition and Results of Operations
This Management’s Discussion and Analysis of Financial Condition and Results of Operations should be read in conjunction with our consolidated financial statements and related notes included elsewhere in this Form 10‑K. Actual results and the timing of events may differ significantly from those expressed or implied in such forward‑looking statements due to a number of factors, including those set forth in the sections entitled “Risk Factors” and “Special Note Regarding Forward‑Looking Statements” and elsewhere in this Form 10‑K.
Executive Overview
Moelis & Company is a leading global independent investment bank that provides innovative strategic advice and solutions to a diverse client base, including corporations, governments and financial sponsors. With 19 geographical locations in the Americas, Europe, the Middle East, Asia and Australia, we advise clients around the world on their most critical decisions, including mergers and acquisitions, recapitalizations and restructurings and other corporate finance matters.
We were founded in July 2007 by veteran investment bankers to create a global independent investment bank that offers multi‑disciplinary solutions and exceptional transaction execution. We opened for business in New York and Los Angeles with a team of top tier advisory professionals. The dislocation in the financial services industry caused by the global financial crisis provided us with a unique opportunity to rapidly build a firm with global scale and broad advisory expertise, and we more than tripled our professional headcount from the end of 2008 through the end of 2011. Since our founding, we have added new Managing Directors with sector, regional or transactional expertise and with strong client relationships. In addition, we have established recruiting programs at top universities to hire talented junior professionals and instituted training programs to help develop them into advisory specialists.
We have added Managing Directors to expand our sector expertise, and currently provide capabilities across all major industries including Consumer, Retail & Restaurants; Energy, Power & Infrastructure; Financial Institutions; Financial Sponsors; General Industrials; Healthcare; Real Estate, Gaming, Lodging & Leisure and Technology, Media & Telecommunications. In addition, we hired professionals to broaden our global reach and opened a network of offices, expanding into London in 2008, Sydney in 2009, Dubai in 2010, Hong Kong and Beijing in 2011, Frankfurt, Mumbai and Paris in 2012 and Melbourne and São Paulo in 2014. In regions where it made more sense to establish a partnership rather than build from the ground up, we entered into strategic alliances, including in Japan with Sumitomo Mitsui Banking Corporation (“SMBC”) and its subsidiary, SMBC Nikko Securities Inc. in 2012 and in Mexico with Alfaro, Dávila y Scherer, S.C. (“ADS”) in 2016. We also added regional capabilities in the U.S., opening offices in Boston in 2007, Chicago in 2008, Houston and San Francisco in 2011 and Washington DC in 2014. We have developed additional areas of advisory expertise to complement our strong M&A capabilities and to meet the changing needs of our clients. Our early investment in recapitalization and restructuring talent in mid-2008 positioned us to capitalize on the significant increase in restructuring volume during the global financial crisis. In 2009, we added expertise in advising clients on capital markets matters and advising financial institutions on complex risk exposures. In 2014, we added capabilities to provide capital raising, secondary transaction and other advisory services to private fund sponsors and limited partners. Our ability to provide services to our clients across sectors and regions and through all phases of the business cycle has led to long-term client relationships and a diversified revenue base.
As of December 31, 2017, we served our clients globally with 512 advisory bankers. We continued to grow our firm across sectors, geographies and products to deliver the most relevant advice and innovative solutions to our clients.
We generate revenues primarily from providing advisory services on transactions that are subject to individually negotiated engagement letters which set forth our fees. We generally generate fees at key transaction milestones, such as closing, the timing of which is outside of our control. As a result, revenues and net income in any period may not be indicative of full year results or the results of any other period and may vary significantly from year to year and quarter to quarter. The performance of our business depends on the ability of our professionals to build relationships with clients over many years by providing trusted advice and exceptional transaction execution.
32
Business Environment and Outlook
Economic and global financial conditions can materially affect our operational and financial performance. See “Risk Factors” elsewhere in this Form 10‑K for a discussion of some of the factors that can affect our performance. Revenues and net income in any period may not be indicative of full year results or the results of any other period and may vary significantly from year to year and quarter to quarter. The M&A market data for announced and completed transactions in 2017 and 2016 referenced throughout this Form 10-K was obtained from Thomson Financial as of January 4, 2018 and January 3, 2017, respectively.
For the year ended December 31, 2017, we earned revenues of $684.6 million, or an increase of 12% from the $613.4 million earned during the same period in 2016. This compares favorably with a 1% decrease in the number of global completed M&A transactions greater than $100 million in the same period. The increase in revenues was primarily driven by growth in M&A where we saw a larger number of completions and earned higher average fees, as well as increased Capital Markets Advisory activity.
In the U.S., which has been a particularly strong driver of our revenues, we are witnessing many companies pursue M&A as they seek to obtain a competitive advantage in their business models. We believe U.S. tax reform will also fuel this trend as companies generate significantly more cash flow to support strategic M&A. In addition, based on historical experience, we believe the current economic backdrop (already high corporate cash balances, relatively low interest rates and availability of credit), provides a solid foundation for M&A. In Europe, we continue to see an improvement in transaction activity.
As our team of investment banking professionals expands and continues to gain traction, we expect our global collaboration will deepen and continue to resonate with clients. Our current conversations with clients remain robust, and we continue to experience a growing global demand for independent advice as clients evaluate a wide range of strategic alternatives.
Results of Operations
The following is a discussion of our results of operations for the years ended December 31, 2017, 2016 and 2015:
|
|
|
|
Year Ended December 31, |
|
Variance |
|||||||||
|
($ in thousands) |
|
|
2017 |
|
2016 |
|
2015 |
|
2017 vs 2016 |
|
2016 vs 2015 |
|||
|
Revenues |
|
|
$ |
684,615 |
|
$ |
613,373 |
|
$ |
551,863 |
|
12% |
|
11% |
|
Expenses: |
|
|
|
|
|
|
|
|
|
|
|
|
|
|
|
Compensation and benefits |
|
|
|
401,384 |
|
|
360,893 |
|
|
311,224 |
|
11% |
|
16% |
|
Non-compensation expenses |
|
|
|
118,949 |
|
|
91,391 |
|
|
103,136 |
|
30% |
|
-11% |
|
Total operating expenses |
|
|
|
520,333 |
|
|
452,284 |
|
|
414,360 |
|
15% |
|
9% |
|
Operating income (loss) |
|
|
|
164,282 |
|
|
161,089 |
|
|
137,503 |
|
2% |
|
17% |
|
Other income and (expenses) |
|
|
|
177,728 |
|
|
509 |
|
|
2,085 |
|
N/M |
|
-76% |
|
Income (loss) from equity method investments |
|
|
|
8,341 |
|
|
5,076 |
|
|
4,476 |
|
64% |
|
13% |
|
Income (loss) before income taxes |
|
|
|
350,351 |
|
|
166,674 |
|
|
144,064 |
|
N/M |
|
16% |
|
Provision for income taxes |
|
|
|
223,827 |
|
|
24,809 |
|
|
23,847 |
|
N/M |
|
4% |
|
Net income (loss) |
|
|
$ |
126,524 |
|
$ |
141,865 |
|
$ |
120,217 |
|
N/M |
|
18% |
N/M = not meaningful
Revenues
We operate in a highly competitive environment. Each revenue‑generating engagement is separately solicited, awarded and negotiated, and there are usually no long‑term contracted sources of revenue. As a consequence, our fee‑paying client engagements are not predictable, and high levels of revenues in one quarter are not necessarily predictive of continued high levels of revenues in future periods. To develop new business, our professionals maintain an active business dialogue with a large number of existing and potential clients. We add new clients each year as our
33
bankers continue to expand their relationships, as we hire senior bankers who bring their client relationships and as we receive introductions from our relationship network of senior executives, board members, attorneys and other third parties. We also lose clients each year as a result of the sale or merger of clients, changes in clients’ senior management, competition from other financial services firms and other causes.
We earn substantially all of our revenues from advisory engagements, and, in many cases, we are not paid until the completion of an underlying transaction. Complications that may terminate or delay a transaction include failure to agree upon final terms with the counterparty, failure to obtain required regulatory consents, failure to obtain board or stockholder approvals, failure to secure financing, adverse market conditions or unexpected operating or financial problems related to either party to the transaction. In these circumstances, we often do not receive advisory fees that would have been received if the transaction had been completed, despite the fact that we may have devoted considerable time and resources to the transaction. Barriers to the completion of a restructuring transaction may include a lack of anticipated bidders for the assets of our client or the inability of our client to restructure its operations or indebtedness due to a failure to reach agreement with its creditors. In these circumstances, our fees are generally limited to monthly retainer fees and reimbursement of certain out‑of‑pocket expenses.
We do not allocate our revenues by the type of advice we provide (M&A, recapitalizations and restructurings or other corporate finance matters) because of the complexity of the transactions on which we may earn revenues and our holistic approach to client service. For example, a restructuring engagement may evolve to require a sale of all or a portion of the client, M&A assignments can develop from relationships established on prior restructuring engagements and capital markets expertise can be instrumental on both M&A and restructuring assignments.
Year Ended December 31, 2017 versus 2016
Revenues were $684.6 million for the year ended December 31, 2017 compared with $613.4 million for the same period in 2016, representing an increase of 12%. This compares favorably with a 1% decrease in the number of globally completed M&A transactions greater than $100 million in the same period. The increase in revenues was primarily driven by growth in M&A where we saw a larger number of completions and earned higher average fees, as well as increased Capital Markets Advisory activity.
The number of clients we advised increased year‑over‑year from 305 clients in 2016 to 311 clients in 2017, and the number of clients who paid fees equal to or greater than $1 million increased from 167 clients in 2016 to 175 clients in 2017.
Year Ended December 31, 2016 versus 2015
Revenues were $613.4 million for the year ended December 31, 2016 compared with $551.9 million for the same period in 2015, representing an increase of 11%. This compares favorably with a 7% decrease in the number of globally completed M&A transactions greater than $100 million in the same period. The increase in revenues was primarily driven by higher fees earned in the U.S. and rest of world, partially offset by decreased fees from Europe.
The number of clients we advised increased year over year from 269 clients in 2015 to 305 clients in 2016, and the number of clients who paid fees equal to or greater than $1 million increased from 139 clients in 2015 to 167 clients in 2016.
34
Operating Expenses
The following table sets forth information relating to our operating expenses, which are reported net of reimbursements by our clients:
|
|
|
Year Ended December 31, |
|
Variance |
|
|||||||||
|
($ in thousands) |
|
2017 |
|
2016 |
|
2015 |
|
2017 vs 2016 |
|
2016 vs 2015 |
|
|||
|
Expenses: |
|
|
|
|
|
|
|
|
|
|
|
|
|
|
|
Compensation and benefits |
|
$ |
401,384 |
|
$ |
360,893 |
|
$ |
311,224 |
|
11 |
% |
16 |
% |
|
% of revenues |
|
|
59 |
% |
|
59 |
% |
|
56 |
% |
|
|
|
|
|
Non-compensation expenses |
|
$ |
118,949 |
|
$ |
91,391 |
|
$ |
103,136 |
|
30 |
% |
-11 |
% |
|
% of revenues |
|
|
17 |
% |
|
15 |
% |
|
19 |
% |
|
|
|
|
|
Total operating expenses |
|
$ |
520,333 |
|
$ |
452,284 |
|
$ |
414,360 |
|
15 |
% |
9 |
% |
|
% of revenues |
|
|
76 |
% |
|
74 |
% |
|
75 |
% |
|
|
|
|
Our operating expenses are classified as compensation and benefits expenses and non‑compensation expenses, and headcount is the primary driver of the level of our expenses. Compensation and benefits expenses account for the majority of our operating expenses. Non‑compensation expenses, which include the costs of professional fees, travel and related expenses, communication, technology and information services, occupancy, depreciation and other expenses, generally have been less significant in comparison with compensation and benefits expenses. Expenses are recorded on the consolidated statements of operations, net of any expenses reimbursed by clients.
Year Ended December 31, 2017 versus 2016
Operating expenses were $520.3 million for the year ended December 31, 2017 and represented 76% of revenues, compared with $452.3 million for the same period in 2016 which represented 74% of revenues. The increase in operating expenses was generally in-line with the growth in revenues and was primarily driven by increased compensation, including higher equity amortization as compared to the prior year, and increased non-compensation expense primarily due to business development and transaction related charges.
Year Ended December 31, 2016 versus 2015
Operating expenses were $452.3 million for the year ended December 31, 2016 and represented 74% of revenues, compared with $414.4 million for the same period in 2015 which represented 75% of revenues. The increase in operating expenses in 2016 was generally in-line with the growth in revenues and was primarily driven by higher compensation expenses due to an additional tranche of equity amortization as compared to the prior year, as well as modified vesting terms associated with that equity which have a five year pro-rata vest for Managing Directors as compared with awards issued in the previous two years which have a five year vest, pro-rata in years three, four and five.
Compensation and Benefits Expenses
Our compensation and benefits expenses are determined by management based on revenues earned, the competitiveness of the prevailing labor market and anticipated compensation requirements for our employees, the level of recruitment of new Managing Directors, the amount of compensation expenses amortized for equity awards and other relevant factors.
Our compensation expenses consist of base salary and benefits, annual incentive compensation payable as cash bonus awards, including certain amounts subject to clawback and contingent upon a required period of service (“contingent cash awards”) and amortization of equity‑based compensation awards. Base salary and benefits are paid ratably throughout the year. Equity awards are amortized into compensation expenses on a graded basis (based upon the fair value of the award at the time of grant) during the service period over which the award vests, which is typically four or five years. The awards are recorded within equity as they are expensed. Contingent cash awards are amortized into compensation expenses over the required service period. Cash bonuses, which are accrued each quarter, are discretionary and dependent upon a number of factors including the performance of the Company and are generally paid during the first two months of each calendar year with respect to prior year performance. The equity component of the annual incentive award is determined with reference to the Company’s estimate of grant date fair value, which in turn determines the number of equity awards granted subject to a vesting schedule.
35
Our compensation expenses are primarily based upon revenues, prevailing labor market conditions and other factors that can fluctuate, including headcount, and as a result, our compensation expenses may fluctuate materially in any particular period. Accordingly, the amount of compensation expenses recognized in any particular period may not be consistent with prior periods or indicative of future periods.
Year Ended December 31, 2017 versus 2016
For the year ended December 31, 2017, compensation‑related expenses of $401.4 million represented 59% of revenues, compared with $360.9 million which represented 59% of revenues in the prior year. The increase in compensation expenses was primarily driven by greater revenue and equity amortization during 2017 as compared with 2016.
Our fixed compensation costs, which are primarily the sum of base salaries, payroll taxes and benefits and the amortization of previously issued equity and contingent cash awards, were $259.2 million and $232.9 million for the years ended December 31, 2017 and 2016, respectively. The increase in fixed compensation expense relates to an increase in headcount (which drives salaries and benefits) and higher equity amortization as compared to the prior year. The aggregate amount of discretionary cash bonus expenses, which generally represents the excess amount of total compensation over base compensation and amortization of equity and contingent cash awards, was $142.2 million and $128.0 million for the years ended December 31, 2017 and 2016, respectively. The combination of the discretionary and fixed compensation expenses represents the overall compensation expense pool. The increase in discretionary cash bonus expense is primarily related to higher revenues earned, partially offset by the increase in fixed compensation expense.
Year Ended December 31, 2016 versus 2015
For the year ended December 31, 2016, compensation related expenses of $360.9 million represented 59% of revenues, compared with $311.2 million of compensation related expenses which represented 56% of revenues in the prior year. The increase in expenses primarily relates to a combination of greater revenue and increased equity amortization during 2016 as compared with 2015.
Our fixed compensation costs, which are primarily the sum of base salaries, payroll taxes and benefits and the amortization of previously issued equity and contingent cash awards, were $232.9 million and $190.1 million for the years ended December 31, 2016 and 2015, respectively. The increase in fixed compensation costs relates to an additional tranche of equity amortization as compared to the prior year. The aggregate amount of discretionary cash bonus expenses, which generally represents the excess amount of total compensation over base compensation and amortization of equity and contingent cash awards, was $128.0 million and $121.1 million for the years ended December 31, 2016 and 2015, respectively. The combination of the discretionary and fixed compensation expenses represents the overall compensation expense pool. The increase in discretionary cash bonus expense is primarily related to higher revenues earned, partially offset by the increase in fixed compensation expense exceeding the growth in the overall compensation pool.
Non‑Compensation Expenses
Our non‑compensation expenses include the costs of occupancy, professional fees, communication, technology and information services, travel and related expenses, depreciation and other expenses. Reimbursed client expenses are netted within the appropriate non‑compensation expense line.
Historically, our non compensation expenses associated with business development have increased as we have increased headcount and the related non compensation support costs which results from growing our business. This trend may continue as we expand into new sectors, geographies and products to serve our clients’ growing needs.
Year Ended December 31, 2017 versus 2016
Non‑compensation expenses were $118.9 million in the year ended December 31, 2017, representing 17% of revenues, compared with $91.4 million, or 15% in the prior year. The increase in non-compensation expense was primarily related to increased travel and related expenses and professional fees, most of which are related to greater transaction related charges and increased business development activities.
36
Year Ended December 31, 2016 versus 2015
Non compensation expenses were $91.4 million in the year ended December 31, 2016, representing 15% of revenues, down from $103.1 million, or 19% in the prior year. The decrease in non compensation expenses was primarily driven by reduced professional fees due to lower consulting and recruiting fees, lower other expenses and increased collections of reimbursable expenses.
Income (Loss) From Equity Method Investments
The Company accounts for its equity method investments under the equity method of accounting as the Company does not control these entities but has the ability to exercise significant influence. The amounts recorded on the consolidated statements of financial condition reflect the Company’s share of contributions made to, distributions received from, and the equity earnings and losses of, the investments. The Company reflects its share of gains and losses of the investment in income (loss) from equity method investments in the consolidated statements of operations. Certain adjustments have been made to account for the Company’s equity method investment in Moelis Australia under US GAAP as Moelis Australia follows local accounting principles under Australian Accounting Standards.
Moelis Australia
On April 1, 2010, we entered into a joint venture in Moelis Australia, investing a combination of cash and certain net assets in exchange for a 50% interest in the venture. The remaining 50% was owned by an Australian trust established by and for the benefit of Australian executives. Moelis Australia’s business is offering advisory services as well as equity capital markets and research business, sales and trading business covering Australian public equity securities and an asset management business. Advisory fees are generally recognized at key transaction milestones, so the revenues earned by Moelis Australia can vary significantly period to period. Moelis Australia has offices in Sydney and Melbourne.
On April 10, 2017, Moelis Australia consummated their initial public offering and became listed on the Australian Securities Exchange (ASX: MOE). As a result of the offering, the Company’s ownership interest in Moelis Australia was diluted to less than 50% and the Company recognized a gain of approximately $15.2 million recorded in other income and expenses on the consolidated statement of operations. Contemporaneous with the offering, Moelis Australia agreed to terminate an asset management related revenue sharing agreement resulting in a payment to a third party, of which the Company recognized a charge of approximately $2.4 million in income (loss) from equity method investments. See Note 4 of the consolidated financial statements included in this Form 10-K for further information.
On September 13, 2017 and October 30, 2017, Moelis Australia completed offerings of 11,940,000 and 10,060,000 shares of common stock, respectively, to raise additional capital. The issuance of shares further reduced Moelis & Company’s ownership interest in Moelis Australia. These shares were issued at a fair value greater than the carrying value of the ownership interest disposed, resulting in gains of approximately $14.4 million and $9.7 million, respectively, recorded in other income on the consolidated statement of operations. Moelis Australia issued additional shares during 2017 related to acquisitions, which further reduced Moelis & Company’s ownership interest in Moelis Australia. The shares were issued at a fair value greater than the carrying value of the ownership interest disposed, resulting in a gain of approximately $2.4 million, recorded in other income and expenses on the consolidated statement of operations.
Year Ended December 31, 2017 versus 2016
Income (loss) from equity method investments related to our share of gains and losses of Moelis Australia, was income of $8.4 million and $3.4 million for the years ended December 31, 2017 and 2016, respectively.
Year Ended December 31, 2016 versus 2015
Income (loss) from equity method investments related to our share of gains and losses of the Moelis Australia, was income of $3.4 million and $0.3 million for the years ended December 31, 2016 and 2015, respectively.
37
Other Equity Method Investment
In June 2014, the Company made an investment into a general partner entity which invests third‑party funds and is controlled by a related party, Moelis Asset Management LP. The Company determined that it should account for this investment as an equity method investment on its consolidated and combined financial statements. The investment was substantially liquidated during the year ended December 31, 2016.
Year Ended December 31, 2016 versus 2015
Income (loss) from equity method investments related to our investment in an entity which invests in funds was $1.7 million and $4.2 million for the years ended December 31, 2016 and 2015, respectively.
Provision for Income Taxes
Prior to the Company’s reorganization and IPO of Moelis & Company, the Company had been primarily subject to the New York City unincorporated business tax (“UBT”) and certain other foreign, state and local taxes. The Company’s operations are comprised of entities that are organized as limited liability companies and limited partnerships. For U.S. federal income tax purposes, taxes related to income earned by these entities represent obligations of their interest holders, which are primarily made up of individual partners and members and have historically not been reflected in the consolidated statements of financial condition. In connection with the Company’s reorganization and IPO, the Company became subject to U.S. corporate federal, state and local income tax on its allocable share of results of operations from Group LP.
Years Ended December 31, 2017 versus 2016
The Company’s provision for income taxes and effective tax rates were $223.8 million and 64% and $24.8 million and 15% for the years ended December 31, 2017 and 2016, respectively. The income tax provision and effective tax rate for the aforementioned periods primarily reflect the Company’s allocable share of earnings from Group LP at the prevailing U.S. federal, state, and local corporate income tax rate and the effect of the allocable earnings to noncontrolling interests being subject to UBT and certain other foreign, state, and local taxes. The increase in the effective tax rate is primarily attributable to the impact of the re-measurement of the Company’s net deferred tax assets principally in connection with the Tax Cuts and Jobs Act enacted on December 22, 2017, which reduced the U.S. corporate federal tax rate for future years. In relation to the re-measurement, the Company recorded a provisional net decrease in its deferred tax assets of $181.0 million. The Company’s liability pursuant to the Tax Receivable Agreement was also re-measured and the estimated impact of $134.7 million was recorded as a component of other income. The increase in the overall effective tax rate is also a function of the increase in the allocable share of earnings subject to corporate income tax rate primarily as a result of the Company’s follow-on offerings in January and July of 2017 which involved Group LP Class A partnership units being exchanged for common stock, partially offset by the recognition of excess tax benefits from equity-based compensation pursuant to ASU 2016-09. See Note 7 of the consolidated financial statements for further discussion.
Years Ended December 31, 2016 versus 2015
The Company’s provision for income taxes and effective tax rates were $24.8 million and 15% and $23.8 million and 17% for the years ended December 31, 2016 and 2015, respectively. The income tax provision and effective tax rate for the aforementioned periods primarily reflect the Company’s allocable share of earnings from Group LP at the prevailing U.S. federal, state, and local corporate income tax rate and the effect of the allocable earnings to noncontrolling interests being subject to UBT and certain other foreign, state, and local taxes. The decrease in effective tax rate is primarily attributable to the reduction in UBT and certain foreign taxes on the allocable earnings to noncontrolling interests.
Liquidity and Capital Resources
Our current assets have historically comprised cash, short‑term liquid investments and receivables related to fees earned from providing advisory services. Our current liabilities are primarily comprised of accrued expenses, including accrued employee compensation. We pay a significant portion of incentive compensation during the first two months of each calendar year with respect to the prior year’s results. We also distribute estimated partner tax payments
38
primarily in the first quarter of each year in respect of the prior year’s operating results. Therefore, levels of cash generally decline during the first quarter of each year after incentive compensation has been paid to our employees and estimated tax payments have been distributed to partners. Cash then typically builds over the remainder of the year.
We evaluate our cash needs on a regular basis in light of current market conditions. Cash and cash equivalents include all short‑term highly liquid investments that are readily convertible to known amounts of cash and have original maturities of three months or less from the date of purchase. As of December 31, 2017 and December 31, 2016, the Company had cash equivalents of $127.2 million and $246.9 million, respectively, invested in U.S. Treasury instruments, government debt securities, and government securities money market. Additionally, as of December 31, 2017 and December 31, 2016, the Company had cash of $86.0 million and $72.0 million, respectively, maintained in U.S. and non‑U.S. bank accounts, of which most bank account balances exceeded the U.S. Federal Deposit Insurance Corporation (“FDIC”) and U.K. Financial Services Compensation Scheme (“FSCS”) coverage limits.
In addition to cash and cash equivalents, we hold various types of government debt securities that are classified as investments on our consolidated statements of financial condition as they have original maturities of three months or more from the date of purchase. The Company held $95.8 million and $33.0 million of government debt securities classified as investments as of December 31, 2017 and 2016, respectively.
Our liquidity is highly dependent upon cash receipts from clients which generally requires the successful completion of transactions. The timing of receivable collections typically occurs within 60 days of billing. As of December 31, 2017 and 2016 accounts receivable were $56.7 million and $23.2 million, respectively, net of allowances of $1.4 million and $0.5 million, respectively.
To provide for additional working capital and other general corporate purposes, we maintain a $40.0 million revolving credit facility that matures on June 30, 2019. Advances on the facility bear interest at the greater of a fixed rate of 3.50% per annum or at the Company’s option of (i) LIBOR plus 1% or (ii) Prime minus 1.50%. As of December 31, 2017, the Company had no borrowings under the credit facility.
As of December 31, 2017, the Company’s available credit under this facility was $34.7 million as a result of the issuance of an aggregate amount of $5.3 million of various standby letters of credit, which were required in connection with certain office leases and other agreements. The Company incurs a 1% per annum fee on the outstanding balances of issued letters of credit.
On February 6, 2018, the Board of Directors of Moelis & Company declared a special dividend of $1.50 per share in addition to a regular quarterly dividend of $0.47 per share. The $1.97 per share will be paid on March 7, 2018 to Class A common stockholders of record on February 20, 2018. During the year ended December 31, 2017, the Company paid aggregate dividends of $3.73 per share which included special dividends of $1.25 and $1.00 per share and four regular quarterly dividends of $0.37 per share.
Regulatory Capital
We actively monitor our regulatory capital base. Our principal subsidiaries are subject to regulatory requirements in their respective jurisdictions to ensure general financial soundness and liquidity. This requires, among other things, that we comply with certain minimum capital requirements, record‑keeping, reporting procedures, experience and training requirements for employees and certain other requirements and procedures. These regulatory requirements may restrict the flow of funds to and from affiliates. See Note 12 of the consolidated financial statements as of December 31, 2017 for further information. These regulations differ in the United States, United Kingdom, Hong Kong and other countries in which we operate a registered broker‑dealer. The license under which we operate in each such country is meant to be appropriate to conduct an advisory business. We believe that we provide each of our subsidiaries with sufficient capital and liquidity, consistent with their business and regulatory requirements.
Tax Receivable Agreement
In connection with the IPO in April 2014, we entered into a tax receivable agreement with our eligible Managing Directors that provides for the payment to eligible Managing Directors of 85% of the amount of cash savings, if any, in U.S. federal, state and local income tax or franchise tax that we realize as a result of (a) the increases in tax basis attributable to exchanges by our eligible Managing Directors and (b) tax benefits related to imputed interest
39
deemed to be paid by us as a result of this tax receivable agreement. The Company expects to benefit from the remaining 15% of income tax cash savings, if any, that we realize.
For purposes of the tax receivable agreement, income tax cash savings will be computed by comparing our actual income tax liability to the amount of such taxes that we would have been required to pay had there been no increase to the tax basis of the tangible and intangible assets of Group LP as a result of the exchanges and had we not entered into the tax receivable agreement. The term of the tax receivable agreement commenced upon consummation of the IPO and will continue until all such tax benefits have been utilized or expired, unless we exercise our right to terminate the tax receivable agreement for an amount based on an agreed value of payments remaining to be made under the agreement.
Payments made under the tax receivable agreement are required to be made within 225 days of the filing of our tax returns. Because we generally expect to receive the tax savings prior to making the cash payments to the eligible selling holders of Group LP partnership units, we do not expect the cash payments to have a material impact on our liquidity.
In addition, the tax receivable agreement provides that, upon a merger, asset sale, or other form of business combination or certain other changes of control or if, at any time, we elect an early termination of the tax receivable agreement, our (or our successor’s) obligations with respect to exchanged or acquired units (whether exchanged or acquired before or after such change of control or early termination) will be based on certain assumptions, including that we would have sufficient taxable income to fully utilize the deductions arising from the increased tax deductions and tax basis and other benefits related to entering into the tax receivable agreement, and, in the case of an early termination election, that any units that have not been exchanged are deemed exchanged for the market value of the Class A common stock at the time of termination. Consequently, it is possible, in these circumstances, that the actual cash tax savings realized by us may be significantly less than the corresponding tax receivable agreement payments.
Cash Flows
Our operating cash flows are primarily influenced by the amount and timing of receipt of advisory fees, which are generally collected within 60 days of billing, and the payment of operating expenses, including payments of incentive compensation to our employees. We pay a significant portion of incentive compensation during the first two months of each calendar year with respect to the prior year’s results. Our investing and financing cash flows are primarily influenced by activities to fund investments and payments of dividends and estimated partner taxes. A summary of our operating, investing and financing cash flows is as follows:
|
|
|
Year Ended December 31, |
|
|||||||
|
($ in thousands) |
|
2017 |
|
2016 |
|
2015 |
|
|||
|
Cash Provided By (Used In) |
|
|
|
|
|
|
|
|
|
|
|
Operating Activities: |
|
|
|
|
|
|
|
|
|
|
|
Net income (loss) |
|
$ |
126,524 |
|
$ |
141,865 |
|
$ |
120,217 |
|
|
Non-cash charges |
|
|
116,682 |
|
|
76,070 |
|
|
46,839 |
|
|
Other operating activities |
|
|
(10,023) |
|
|
13,639 |
|
|
(24,292) |
|
|
Total operating activities |
|
|
233,183 |
|
|
231,574 |
|
|
142,764 |
|
|
Investing Activities |
|
|
(69,427) |
|
|
1,436 |
|
|
(1,740) |
|
|
Financing Activities |
|
|
(272,512) |
|
|
(158,017) |
|
|
(90,202) |
|
|
Effect of exchange rate changes |
|
|
3,021 |
|
|
(4,089) |
|
|
(744) |
|
|
Net increase (decrease) in cash |
|
|
(105,735) |
|
|
70,904 |
|
|
50,078 |
|
|
Cash and cash equivalents, beginning of period |
|
|
318,926 |
|
|
248,022 |
|
|
197,944 |
|
|
Cash and cash equivalents, end of period |
|
$ |
213,191 |
|
$ |
318,926 |
|
$ |
248,022 |
|
Year Ended December 31, 2017
Cash and cash equivalents were $213.2 million at December 31, 2017, a decrease of $105.7 million from $318.9 million of cash and cash equivalents at December 31, 2016. Operating activities resulted in a net inflow of $233.2 million primarily attributable to cash collected from clients net of cash operating expenses, including discretionary bonuses paid during the period. Investing activities resulted in a net outflow of $69.4 million primarily
40
attributable to net purchases of investments. Financing activities resulted in a net outflow of $272.5 million primarily related to the payment of dividends and tax distributions.
Year Ended December 31, 2016
Cash and cash equivalents were $318.9 million at December 31, 2016, an increase of $70.9 million from $248.0 million of cash and cash equivalents at December 31, 2015. Operating activities resulted in a net inflow of $231.6 million primarily attributable to net income and the impact of non‑cash equity‑based compensation charges on net income. Investing activities resulted in a net inflow of $1.4 million primarily attributable to the net proceeds from sales of investments, partially offset by the purchase of fixed assets. Financing activities resulted in a net outflow of $158.0 million primarily related to dividends and distributions to shareholders and partners.
Year Ended December 31, 2015
Cash and cash equivalents were $248.0 million at December 31, 2015, an increase of $50.1 million from $197.9 million of cash and cash equivalents at December 31, 2014. Operating activities resulted in a net inflow of $142.8 million primarily attributable to net income and the impact of non‑cash equity‑based compensation charges on net income. Investing activities resulted in a net outflow of $1.7 million primarily attributable to the purchase of fixed assets, offset by net proceeds from sales of investments. Financing activities resulted in a net outflow of $90.2 million primarily related to dividends and distributions to shareholders and partners.
Contractual Obligations
The following table sets forth information relating to our contractual obligations as of December 31, 2017:
|
|
|
Payment Due by Period |
|
|||||||||||||
|
|
|
|
|
Less than |
|
|
|
|
|
More than |
|
|||||
|
($ in thousands) |
|
Total |
|
1 Year |
|
1 – 3 Years |
|
3 – 5 Years |
|
5 Years |
|
|||||
|
Operating leases (net of $5,945 of committed sublease income) |
|
$ |
71,080 |
|
$ |
19,207 |
|
$ |
31,040 |
|
$ |
12,560 |
|
$ |
8,273 |
|
|
Amount due pursuant to Tax Receivable Agreement |
|
|
177,148 |
|
|
10,959 |
|
|
19,632 |
|
|
20,756 |
|
|
125,801 |
|
|
Total |
|
$ |
248,228 |
|
$ |
30,166 |
|
$ |
50,672 |
|
$ |
33,316 |
|
$ |
134,074 |
|
As of December 31, 2017, the Company has a total payable of $177.1 million due pursuant to the tax receivable agreement in the consolidated financial statements which represents management’s best estimate of the amounts currently expected to be owed under the tax receivable agreement. Payments made under the tax receivable agreement are required to be made within 225 days of the filing of our tax returns. Because we generally expect to receive the tax savings prior to making the cash payments to the eligible selling holders of Group LP partnership units, we do not expect the cash payments to have a material impact on our liquidity. Payments of $10.4 million were made during 2017 pursuant to the tax receivable agreement.
Off‑Balance Sheet Arrangements
We do not invest in any off‑balance sheet vehicles that provide liquidity, capital resources, market or credit risk support, or engage in any activities that expose us to any liability that is not reflected in our consolidated financial statements except for those described under “Contractual Obligations” above.
Market Risk and Credit Risk
Our business is not capital‑intensive and we do not invest in derivative instruments or, generally, borrow through issuing debt. As a result, we are not subject to significant market risk (including interest rate risk, foreign currency exchange rate risk and commodity price risk) or credit risk.
Risks Related to Cash and Short‑Term Investments
Our cash and cash equivalents include all short‑term highly liquid investments that are readily convertible to known amounts of cash and have original maturities of three months or less from the date of purchase. We invest most
41
of our cash in highly-rated municipal bonds, U.S. government agency debt securities and U.S. Treasury instruments. Cash is maintained in U.S. and non‑U.S. bank accounts. Most U.S. and U.K. account balances exceed the FDIC and FSCS coverage limits. In addition to cash and cash equivalents, we hold various types of government debt securities that are classified as investments on our statement of financial condition as they have original maturities of three months or more (but less than twelve months) from the date of purchase. We believe our cash and short‑term investments are not subject to any material interest rate risk, equity price risk, credit risk or other market risk.
Credit Risk
We regularly review our accounts receivable and allowance for doubtful accounts by considering factors such as historical experience, credit quality, age of the accounts receivable, and the current economic conditions that may affect a customer’s ability to pay such amounts owed to the Company. We maintain an allowance for doubtful accounts that, in our opinion, provides for an adequate reserve to cover losses that may be incurred. See “—Critical Accounting Policies—Accounts Receivable and Allowance for Doubtful Accounts.”
Exchange Rate Risk
The Company is exposed to the risk that the exchange rate of the U.S. dollar relative to other currencies may have an adverse effect on the reported value of the Company’s non‑U.S. dollar denominated assets and liabilities. Non‑functional currency‑related transaction gains and losses are recorded in the consolidated statements of operations. In addition, the reported amounts of our revenues may be affected by movements in the rate of exchange between the pound sterling, euro, Brazilian real, Hong Kong dollar, rupee and the U.S. dollar, in which our financial statements are denominated. For the years ended December 31, 2017, 2016 and 2015, the net impact of the fluctuation of foreign currencies in other comprehensive income (loss) in the consolidated statements of comprehensive income was a gain of $2.3 million, a loss of $1.5 million and a gain of $0.1 million, respectively. We have not entered into any transactions to hedge our exposure to these foreign currency fluctuations through the use of derivative instruments or other methods.
Critical Accounting Policies
We believe that the critical accounting policies included below represent those that are most important to the presentation of our financial condition and results of operations and require management’s most difficult, subjective and complex judgment.
The preparation of financial statements and related disclosures in conformity with U.S. GAAP requires management to make estimates and assumptions that affect the reported amounts of assets and liabilities and disclosure of contingent assets and liabilities at the date of the financial statements, and the reported amounts of revenues and expenses during the reporting period. Actual results could differ from those estimates. Estimates and assumptions are reviewed periodically, and the effects of revisions are reflected in the period for which they are determined to be necessary.
All intercompany balances and transactions within the Company have been eliminated.
Revenue and Expense Recognition
The Company recognizes revenues from providing advisory services when earned and collection is reasonably assured. Upfront fees and retainers are recognized over the estimated period during which the related services are to be performed. Transaction‑related fees are recognized when all services for a transaction have been provided, specified conditions have been met and the transaction closes. Deferred revenues are recorded for fees received that have not yet been earned. Expenses are recorded on the consolidated financial statements, net of client reimbursements.
Accounts Receivable and Allowance for Doubtful Accounts
The accompanying consolidated statements of financial condition present accounts receivable balances net of allowance for doubtful accounts based on the Company’s assessment of the collectability of customer accounts.
The Company maintains an allowance for doubtful accounts that, in management’s opinion, provides for an adequate reserve to cover losses that may be incurred. The Company regularly reviews the allowance by considering
42
factors such as historical experience, credit quality, age of the accounts receivable, and the current economic conditions that may affect a customer’s ability to pay such amounts owed to the Company.
After concluding that a reserved accounts receivable is no longer collectible, the Company will charge‑off the receivable. This is determined based on several factors including the age of the accounts receivable and the credit worthiness of the customer. This has the effect of reducing both the gross receivable and the allowance for doubtful accounts.
Equity‑based Compensation
The Company recognizes the cost of employee services received in exchange for an equity instrument award. The cost is based on its grant date fair value based on quoted market prices at the time of grant amortized over the service period required by the award’s vesting terms.
For the purposes of calculating diluted net income (loss) per share to holders of Class A common stock, unvested service‑based awards are included in the diluted weighted average shares of Class A common stock outstanding using the treasury stock method.
The Company has a retirement plan whereby a retiring employee generally will not forfeit certain qualifying incentive RSUs granted during employment if at retirement the employee meets certain requirements. For qualifying awards issued prior to December 1, 2016, the employee must (i) be at least 54 years old and (ii) have provided at least 8 consecutive years of service to the Company. For qualifying awards issued on or after December 1, 2016, (i) the employee must be at least 56 years old, (ii) the employee must have provided at least 5 consecutive years of service to the Company and (iii) the total of (i) and (ii) must be equal to at least 65 years. Any such RSUs will continue to vest on their applicable vesting schedule, subject to noncompetition and other terms. Over time a greater number of employees may become retirement eligible and the related requisite service period over which we will expense these awards will be shorter than the stated vesting period. Any unvested RSUs prior to meeting the stated requisite service period or retirement eligibility date are eligible to receive dividends in kind; however, the right to dividends in kind will be forfeited if the underlying award does not vest.
Equity Method Investments
The Company accounts for its equity method investments under the equity method of accounting as the Company does not control these entities, but has the ability to exercise significant influence. The amounts recorded on the consolidated financial statements of financial condition reflects the Company’s share of contributions made to, distributions received from, and the equity earnings and losses of, the investments. The Company reflects its share of gains and losses of the investment in income (loss) from equity method investments in the consolidated and statements of operations. Certain adjustments have been made to account for the Company’s equity method investment in Moelis Australia Limited under US GAAP as Moelis Australia follows local accounting principles under Australian Accounting Standards.
Income Taxes
The Company accounts for income taxes in accordance with ASC 740, “Accounting for Income Taxes” (“ASC 740”), which requires the recognition of tax benefits or expenses on temporary differences between the financial reporting and tax bases of its assets and liabilities by applying the enacted tax rates in effect for the year in which the differences are expected to reverse. Such net tax effects on temporary differences are reflected on the Company’s consolidated statements of financial condition as deferred tax assets and liabilities. Deferred tax assets are reduced by a valuation allowance when the Company believes that it is more‑likely‑than‑not that some portion or all of the deferred tax assets will not be realized.
ASC 740‑10 prescribes a two‑step approach for the recognition and measurement of tax benefits associated with the positions taken or expected to be taken in a tax return that affect amounts reported in the financial statements. The Company has reviewed and will continue to review the conclusions reached regarding uncertain tax positions, which may be subject to review and adjustment at a later date based on ongoing analyses of tax laws, regulations and interpretations thereof. For the years ended December 31, 2017, 2016 and 2015, no unrecognized tax benefit was recorded. To the extent that the Company’s assessment of the conclusions reached regarding uncertain tax positions
43
changes as a result of the evaluation of new information, such change in estimate will be recorded in the period in which such determination is made. The Company reports income tax‑related interest and penalties relating to uncertain tax positions, if applicable, as a component of income tax expense. For the years ended December 31, 2017, 2016 and 2015, no such amounts were recorded.
Recent Accounting Developments
For a discussion of recently issued accounting developments and their impact or potential impact on our consolidated financial statements, see Note 3—Recent Accounting Pronouncements, of the consolidated financial statements included in this Form 10‑K.
Item 7A. Quantitative and Qualitative Disclosures About Market Risk
Quantitative and Qualitative disclosures about market risk are set forth above in “Item 7—Management’s Discussion and Analysis of Financial Condition and Results of Operations—Market Risk and Credit Risk.”
44
Item 8. Financial Statements and Supplementary Data
Index to Consolidated Financial Statements
45
MANAGEMENT’S REPORT ON INTERNAL CONTROL OVER FINANCIAL REPORTING
Management of Moelis & Company and its subsidiaries (the “Company”) is responsible for establishing and maintaining adequate internal control over financial reporting. Internal control over financial reporting is a process designed under the supervision of the Company’s principal executive and principal financial officers to provide reasonable assurance regarding the reliability of financial reporting and the preparation of the Company’s financial statements for external purposes in accordance with U.S. generally accepted accounting principles.
Our internal control over financial reporting includes those policies and procedures that:
|
· |
pertain to the maintenance of records that, in reasonable detail, accurately and fairly reflect the transactions and dispositions of the assets of the Company; |
|
· |
provide reasonable assurance that transactions are recorded as necessary to permit preparation of financial statements in accordance with U.S. generally accepted accounting principles, and that our receipts and expenditures are being made only in accordance with authorizations of the Company’s management and directors; and |
|
· |
provide reasonable assurance regarding prevention or timely detection of unauthorized acquisition, use or disposition of our assets that could have a material effect on the financial statements. |
Management assessed the effectiveness of the Company’s internal control over financial reporting as of December 31, 2017. In making this assessment, management used the criteria set forth by the Committee of Sponsoring Organizations of the Treadway Commission (COSO) in Internal Control—Integrated Framework (2013). Based on management’s assessment and those criteria, management believes that the Company maintained effective internal control over financial reporting as of December 31, 2017.
Because of its inherent limitations, internal control over financial reporting may not prevent or detect misstatements. Projections of any evaluation of effectiveness to future periods are subject to the risk that controls may become inadequate because of changes in conditions, or that the degree of compliance with the policies or procedures may deteriorate.
The Company’s independent registered public accounting firm has issued its written attestation report on the Company’s internal control over financial reporting, as included below.
46
REPORT OF INDEPENDENT REGISTERED PUBLIC ACCOUNTING FIRM
To the Board of Directors and Stockholders of
Moelis & Company
New York, New York
Opinion on Internal Control over Financial Reporting
We have audited the internal control over financial reporting of Moelis & Company and subsidiaries (the “Company”) as of December 31, 2017, based on criteria established in Internal Control — Integrated Framework (2013) issued by the Committee of Sponsoring Organizations of the Treadway Commission (COSO). In our opinion, the Company maintained, in all material respects, effective internal control over financial reporting as of December 31, 2017, based on criteria established in Internal Control — Integrated Framework (2013) issued by COSO.
We have also audited, in accordance with the standards of the Public Company Accounting Oversight Board (United States) (PCAOB), the consolidated financial statements as of and for the year ended December 31, 2017, and the related notes and schedule, of the Company, and our report dated February 28, 2018 expressed an unqualified opinion on those financial statements.
Basis for Opinion
The Company’s management is responsible for maintaining effective internal control over financial reporting and for its assessment of the effectiveness of internal control over financial reporting, included in the accompanying Management’s Report on Internal Control over Financial Reporting. Our responsibility is to express an opinion on the Company’s internal control over financial reporting based on our audit. We are a public accounting firm registered with the PCAOB and are required to be independent with respect to the Company in accordance with the U.S. federal securities laws and the applicable rules and regulations of the Securities and Exchange Commission and the PCAOB.
We conducted our audit in accordance with the standards of the PCAOB. Those standards require that we plan and perform the audit to obtain reasonable assurance about whether effective internal control over financial reporting was maintained in all material respects. Our audit included obtaining an understanding of internal control over financial reporting, assessing the risk that a material weakness exists, testing and evaluating the design and operating effectiveness of internal control based on the assessed risk, and performing such other procedures as we considered necessary in the circumstances. We believe that our audit provides a reasonable basis for our opinion.
Definition and Limitations of Internal Control over Financial Reporting
A company’s internal control over financial reporting is a process designed to provide reasonable assurance regarding the reliability of financial reporting and the preparation of financial statements for external purposes in accordance with generally accepted accounting principles. A company’s internal control over financial reporting includes those policies and procedures that (1) pertain to the maintenance of records that, in reasonable detail, accurately and fairly reflect the transactions and dispositions of the assets of the company; (2) provide reasonable assurance that transactions are recorded as necessary to permit preparation of financial statements in accordance with generally accepted accounting principles, and that receipts and expenditures of the company are being made only in accordance with authorizations of management and directors of the company; and (3) provide reasonable assurance regarding prevention or timely detection of unauthorized acquisition, use, or disposition of the company’s assets that could have a material effect on the financial statements.
Because of its inherent limitations, internal control over financial reporting may not prevent or detect misstatements. Also, projections of any evaluation of effectiveness to future periods are subject to the risk that controls may become inadequate because of changes in conditions, or that the degree of compliance with the policies or procedures may deteriorate.
/s/ DELOITTE & TOUCHE LLP
New York, New York
February 28, 2018
47
REPORT OF INDEPENDENT REGISTERED PUBLIC ACCOUNTING FIRM
To the Board of Directors and Stockholders of
Moelis & Company
New York, New York
Opinion on the Financial Statements
We have audited the accompanying consolidated statements of financial condition of Moelis & Company and subsidiaries (the "Company") as of December 31, 2017 and 2016, and the related consolidated statements of operations, comprehensive income, cash flows and changes in equity for each of the three years in the period ended December 31, 2017, and the related notes and schedule (collectively referred to as the “financial statements”). In our opinion, the financial statements present fairly, in all material respects, the financial position of the Company and subsidiaries as of December 31, 2017 and 2016, and the results of their operations and their cash flows for each of the three years in the period ended December 31, 2017, in conformity with accounting principles generally accepted in the United States of America.
We have also audited, in accordance with the standards of the Public Company Accounting Oversight Board (United States) (“PCAOB”), the Company’s internal control over financial reporting as of December 31, 2017, based on the criteria established in Internal Control — Integrated Framework (2013) issued by the Committee of Sponsoring Organizations of the Treadway Commission and our report dated February 28, 2018, expressed an unqualified opinion on the Company’s internal control over financial reporting.
Basis for Opinion
These financial statements are the responsibility of the Company's management. Our responsibility is to express an opinion on the Company’s financial statements and financial statement schedule based on our audits. We are a public accounting firm registered with the PCAOB and are required to be independent with respect to the Company in accordance with the U.S. federal securities laws and the applicable rules and regulations of the Securities and Exchange Commission and the PCAOB.
We conducted our audits in accordance with the standards of the PCAOB. Those standards require that we plan and perform the audit to obtain reasonable assurance about whether the financial statements are free of material misstatement, whether due to error or fraud. Our audits included performing procedures to assess the risks of material misstatement of the financial statements, whether due to error or fraud, and performing procedures that respond to those risks. Such procedures included examining, on a test basis, evidence regarding the amounts and disclosures in the financial statements. Our audits also included evaluating the accounting principles used and significant estimates made by management, as well as evaluating the overall presentation of the financial statements. We believe that our audits provide a reasonable basis for our opinion.
/s/ DELOITTE & TOUCHE LLP
New York, New York
February 28, 2018
We have served as the Company’s auditor since 2008.
48
Moelis & Company
Consolidated Statements of Financial Condition
(dollars in thousands, except per share amounts)
|
|
|
December 31, |
|
December 31, |
|
||
|
|
|
2017 |
|
2016 |
|
||
|
Assets |
|
|
|
|
|
|
|
|
Cash and cash equivalents |
|
$ |
213,191 |
|
$ |
318,926 |
|
|
Restricted cash |
|
|
703 |
|
|
659 |
|
|
Receivables: |
|
|
|
|
|
|
|
|
Accounts receivable, net of allowance for doubtful accounts of $1,433 and $475 as of December 31, 2017 and December 31, 2016, respectively |
|
|
56,725 |
|
|
23,158 |
|
|
Other receivables |
|
|
4,868 |
|
|
7,293 |
|
|
Total receivables |
|
|
61,593 |
|
|
30,451 |
|
|
Deferred compensation |
|
|
8,848 |
|
|
8,701 |
|
|
Investments at fair value (cost basis $96,351 and $33,593 as of December 31, 2017 and December 31, 2016, respectively) |
|
|
96,108 |
|
|
33,383 |
|
|
Equity method investments |
|
|
58,848 |
|
|
20,873 |
|
|
Equipment and leasehold improvements, net |
|
|
10,458 |
|
|
8,397 |
|
|
Deferred tax asset |
|
|
234,000 |
|
|
167,791 |
|
|
Prepaid expenses and other assets |
|
|
15,319 |
|
|
9,619 |
|
|
Total assets |
|
$ |
699,068 |
|
$ |
598,800 |
|
|
Liabilities and Equity |
|
|
|
|
|
|
|
|
Compensation payable |
|
$ |
145,152 |
|
$ |
131,591 |
|
|
Accounts payable and accrued expenses |
|
|
18,323 |
|
|
14,326 |
|
|
Dividends payable |
|
|
— |
|
|
68,066 |
|
|
Amount due pursuant to tax receivable agreement |
|
|
177,148 |
|
|
120,936 |
|
|
Deferred revenue |
|
|
4,948 |
|
|
2,971 |
|
|
Other liabilities |
|
|
9,241 |
|
|
9,469 |
|
|
Total liabilities |
|
|
354,812 |
|
|
347,359 |
|
|
Commitments and Contingencies (See Note 13) |
|
|
|
|
|
|
|
|
Class A common stock, par value $0.01 per share (1,000,000,000 shares authorized, 34,163,042 issued and 33,455,626 outstanding at December 31, 2017; 1,000,000,000 authorized, 20,948,998 issued and 20,561,108 outstanding at December 31, 2016) |
|
|
342 |
|
|
210 |
|
|
Class B common stock, par value $0.01 per share (1,000,000,000 shares authorized, 19,912,230 issued and outstanding at December 31, 2017; 1,000,000,000 authorized, 31,138,193 issued and outstanding at December 31, 2016) |
|
|
199 |
|
|
311 |
|
|
Treasury stock, at cost; 707,416 and 387,890 shares as of December 31, 2017 and December 31, 2016, respectively |
|
|
(23,188) |
|
|
(10,930) |
|
|
Additional paid-in-capital |
|
|
487,163 |
|
|
291,026 |
|
|
Retained earnings (accumulated deficit) |
|
|
(139,918) |
|
|
(68,229) |
|
|
Accumulated other comprehensive income (loss) |
|
|
352 |
|
|
(543) |
|
|
Total Moelis & Company equity |
|
|
324,950 |
|
|
211,845 |
|
|
Noncontrolling interests |
|
|
19,306 |
|
|
39,596 |
|
|
Total equity |
|
|
344,256 |
|
|
251,441 |
|
|
Total liabilities and equity |
|
$ |
699,068 |
|
$ |
598,800 |
|
See notes to the consolidated financial statements.
49
Moelis & Company
Consolidated Statements of Operations
(dollars in thousands, except per share amounts)
|
|
|
Year Ended December 31, |
|||||||
|
|
|
2017 |
|
2016 |
|
2015 |
|||
|
Revenues |
|
$ |
684,615 |
|
$ |
613,373 |
|
$ |
551,863 |
|
Expenses |
|
|
|
|
|
|
|
|
|
|
Compensation and benefits |
|
|
401,384 |
|
|
360,893 |
|
|
311,224 |
|
Occupancy |
|
|
17,101 |
|
|
18,696 |
|
|
15,063 |
|
Professional fees |
|
|
19,954 |
|
|
12,574 |
|
|
20,911 |
|
Communication, technology and information services |
|
|
25,173 |
|
|
22,025 |
|
|
18,263 |
|
Travel and related expenses |
|
|
30,634 |
|
|
20,570 |
|
|
24,329 |
|
Depreciation and amortization |
|
|
3,544 |
|
|
3,183 |
|
|
2,635 |
|
Other expenses |
|
|
22,543 |
|
|
14,343 |
|
|
21,935 |
|
Total expenses |
|
|
520,333 |
|
|
452,284 |
|
|
414,360 |
|
Operating income (loss) |
|
|
164,282 |
|
|
161,089 |
|
|
137,503 |
|
Other income and (expenses) |
|
|
177,728 |
|
|
509 |
|
|
2,085 |
|
Income (loss) from equity method investments |
|
|
8,341 |
|
|
5,076 |
|
|
4,476 |
|
Income (loss) before income taxes |
|
|
350,351 |
|
|
166,674 |
|
|
144,064 |
|
Provision for income taxes |
|
|
223,827 |
|
|
24,809 |
|
|
23,847 |
|
Net income (loss) |
|
|
126,524 |
|
|
141,865 |
|
|
120,217 |
|
Net income (loss) attributable to noncontrolling interests |
|
|
97,124 |
|
|
103,478 |
|
|
87,113 |
|
Net income (loss) attributable to Moelis & Company |
|
$ |
29,400 |
|
$ |
38,387 |
|
$ |
33,104 |
|
Weighted-average shares of Class A common stock outstanding |
|
|
|
|
|
|
|
|
|
|
Basic |
|
|
30,597,058 |
|
|
20,933,757 |
|
|
20,021,652 |
|
Diluted |
|
|
37,675,511 |
|
|
24,242,302 |
|
|
21,362,571 |
|
Net income (loss) per share attributable to holders of shares of Class A common stock |
|
|
|
|
|
|
|
|
|
|
Basic |
|
$ |
0.96 |
|
$ |
1.83 |
|
$ |
1.65 |
|
Diluted |
|
$ |
0.78 |
|
$ |
1.58 |
|
$ |
1.55 |
See notes to the consolidated financial statements.
50
Moelis & Company
Consolidated Statements of Comprehensive Income
(dollars in thousands)
|
|
|
Year Ended December 31, |
|||||||
|
|
|
2017 |
|
2016 |
|
2015 |
|||
|
Net income |
|
$ |
126,524 |
|
$ |
141,865 |
|
$ |
120,217 |
|
Unrealized gain (loss) on investments |
|
|
(465) |
|
|
(249) |
|
|
— |
|
Foreign currency translation adjustment, net of tax |
|
|
2,292 |
|
|
(1,485) |
|
|
99 |
|
Other comprehensive income (loss) |
|
|
1,827 |
|
|
(1,734) |
|
|
99 |
|
Comprehensive income (loss) |
|
|
128,351 |
|
|
140,131 |
|
|
120,316 |
|
Less: Comprehensive income attributable to noncontrolling interests |
|
|
98,056 |
|
|
102,395 |
|
|
87,189 |
|
Comprehensive income (loss) attributable to Moelis & Company |
|
$ |
30,295 |
|
$ |
37,736 |
|
$ |
33,127 |
See notes to the consolidated financial statements.
51
Moelis & Company
Consolidated Statements of Cash Flows
(dollars in thousands)
|
|
|
Year Ended December 31, |
|||||||
|
|
|
2017 |
|
2016 |
|
2015 |
|||
|
Cash flows from operating activities |
|
|
|
|
|
|
|
|
|
|
Net income (loss) |
|
$ |
126,524 |
|
$ |
141,865 |
|
$ |
120,217 |
|
Adjustments to reconcile net income to net cash provided by (used in) operating activities: |
|
|
|
|
|
|
|
|
|
|
Bad debt expense |
|
|
2,895 |
|
|
(277) |
|
|
1,213 |
|
Depreciation and amortization |
|
|
3,544 |
|
|
3,183 |
|
|
2,635 |
|
(Income) loss from equity method investments |
|
|
(8,341) |
|
|
(5,076) |
|
|
(4,476) |
|
Equity-based compensation |
|
|
96,295 |
|
|
77,050 |
|
|
46,131 |
|
Deferred tax provision |
|
|
191,697 |
|
|
(1,014) |
|
|
796 |
|
Gain on equity method investment |
|
|
(41,652) |
|
|
— |
|
|
— |
|
Gain on remeasurement of amount due pursuant to tax receivable agreement |
|
|
(134,665) |
|
|
— |
|
|
— |
|
Other |
|
|
6,909 |
|
|
2,204 |
|
|
540 |
|
Changes in assets and liabilities: |
|
|
|
|
|
|
|
|
|
|
Accounts receivable |
|
|
(35,607) |
|
|
5,536 |
|
|
(7,993) |
|
Other receivables |
|
|
2,220 |
|
|
3,562 |
|
|
(5,448) |
|
Prepaid expenses and other assets |
|
|
(5,388) |
|
|
1,872 |
|
|
(4,704) |
|
Deferred compensation |
|
|
(61) |
|
|
167 |
|
|
(3,420) |
|
Compensation payable |
|
|
11,853 |
|
|
10,739 |
|
|
(10,618) |
|
Accounts payable and accrued expenses |
|
|
3,611 |
|
|
(6,219) |
|
|
1,751 |
|
Deferred revenue |
|
|
1,975 |
|
|
(4,018) |
|
|
1,855 |
|
Dividends received |
|
|
11,672 |
|
|
1,416 |
|
|
4,415 |
|
Other liabilities |
|
|
(298) |
|
|
584 |
|
|
(130) |
|
Net cash provided by (used in) operating activities |
|
|
233,183 |
|
|
231,574 |
|
|
142,764 |
|
Cash flows from investing activities |
|
|
|
|
|
|
|
|
|
|
Purchase of investments |
|
|
(179,807) |
|
|
(120,906) |
|
|
(157,981) |
|
Proceeds from sales of investments |
|
|
115,640 |
|
|
126,000 |
|
|
160,001 |
|
Return of capital from equity method investments |
|
|
— |
|
|
11 |
|
|
254 |
|
Note payments received from employees |
|
|
781 |
|
|
— |
|
|
— |
|
Notes issued to employees |
|
|
(400) |
|
|
(852) |
|
|
— |
|
Purchase of equipment and leasehold improvements |
|
|
(5,647) |
|
|
(2,870) |
|
|
(3,996) |
|
Change in restricted cash |
|
|
6 |
|
|
53 |
|
|
(18) |
|
Net cash provided by (used in) investing activities |
|
|
(69,427) |
|
|
1,436 |
|
|
(1,740) |
|
Cash flows from financing activities |
|
|
|
|
|
|
|
|
|
|
Dividends and distributions |
|
|
(255,694) |
|
|
(154,703) |
|
|
(80,909) |
|
Payments under tax receivable agreement |
|
|
(10,386) |
|
|
— |
|
|
(1,587) |
|
Proceeds from exercise of stock options |
|
|
6,055 |
|
|
— |
|
|
— |
|
Payments to settle employee tax obligations on share-based awards |
|
|
(12,258) |
|
|
(3,314) |
|
|
(7,616) |
|
Class A partnership units and other equity purchased |
|
|
(229) |
|
|
— |
|
|
(90) |
|
Net cash provided by (used in) financing activities |
|
|
(272,512) |
|
|
(158,017) |
|
|
(90,202) |
|
Effect of exchange rate fluctuations on cash and cash equivalents |
|
|
3,021 |
|
|
(4,089) |
|
|
(744) |
|
Net increase (decrease) in cash and cash equivalents |
|
|
(105,735) |
|
|
70,904 |
|
|
50,078 |
|
Cash and cash equivalents, beginning of period |
|
|
318,926 |
|
|
248,022 |
|
|
197,944 |
|
Cash and cash equivalents, end of period |
|
$ |
213,191 |
|
$ |
318,926 |
|
$ |
248,022 |
|
Supplemental cash flow disclosure: |
|
|
|
|
|
|
|
|
|
|
Cash paid during the period for: |
|
|
|
|
|
|
|
|
|
|
Income taxes |
|
$ |
31,837 |
|
$ |
28,613 |
|
$ |
26,000 |
|
Dividends paid, declared in the prior year |
|
$ |
68,066 |
|
$ |
— |
|
$ |
— |
|
Other non-cash activity |
|
|
|
|
|
|
|
|
|
|
Dividend equivalents issued |
|
$ |
24,657 |
|
$ |
23,367 |
|
$ |
4,130 |
|
Dividend declared not paid |
|
$ |
— |
|
$ |
68,066 |
|
$ |
— |
|
Class A Partnership Units or other equity converted into Class A Common Stock |
|
$ |
55,901 |
|
$ |
835 |
|
$ |
4,726 |
|
Non-cash settlement of accounts receivable |
|
$ |
— |
|
$ |
— |
|
$ |
635 |
|
Cumulative Effect Adjustment upon Adoption of ASU 2016-09 |
|
$ |
658 |
|
$ |
— |
|
$ |
— |
|
Forfeiture of fully-vested Group LP units or other equity units |
|
$ |
36 |
|
$ |
83 |
|
$ |
1,075 |
See notes to the consolidated financial statements.
52
Moelis & Company
Consolidated Statements of Changes in Equity
(dollars in thousands)
|
|
|
Shares |
|
|
|
|
|
|
|
|
|
|
|
|
|
Retained |
|
Accumulated |
|
|
|
|
|
|
||||||
|
|
|
Class A |
|
Class B |
|
|
|
Class A |
|
Class B |
|
|
|
|
Additional |
|
Earnings |
|
Other |
|
|
|
|
|
|
|||||
|
|
|
Common |
|
Common |
|
Treasury |
|
Common |
|
Common |
|
Treasury |
|
Paid-In |
|
(Accumulated |
|
Comprehensive |
|
Noncontrolling |
|
Total |
||||||||
|
|
|
Stock |
|
Stock |
|
Stock |
|
Stock |
|
Stock |
|
Stock |
|
Capital |
|
Deficit) |
|
Income (Loss) |
|
Interests |
|
Equity |
||||||||
|
Balance as of January 1, 2015 |
|
19,770,893 |
|
31,621,542 |
|
— |
|
$ |
198 |
|
$ |
316 |
|
$ |
— |
|
$ |
136,896 |
|
$ |
(24,118) |
|
$ |
85 |
|
$ |
61,008 |
|
$ |
174,385 |
|
Net income (loss) |
|
— |
|
— |
|
— |
|
|
— |
|
|
— |
|
|
— |
|
|
— |
|
|
33,104 |
|
|
— |
|
|
87,113 |
|
|
120,217 |
|
Equity-based compensation |
|
134,228 |
|
(5,412) |
|
— |
|
|
1 |
|
|
— |
|
|
— |
|
|
42,400 |
|
|
— |
|
|
— |
|
|
3,730 |
|
|
46,131 |
|
Other comprehensive income (loss) |
|
— |
|
— |
|
— |
|
|
— |
|
|
— |
|
|
— |
|
|
— |
|
|
— |
|
|
23 |
|
|
76 |
|
|
99 |
|
Dividends declared ($1.00 per share of Class A Common Stock) and distributions |
|
— |
|
— |
|
— |
|
|
— |
|
|
— |
|
|
— |
|
|
4,130 |
|
|
(24,324) |
|
|
— |
|
|
(60,715) |
|
|
(80,909) |
|
Treasury stock purchases |
|
— |
|
— |
|
(263,622) |
|
|
— |
|
|
— |
|
|
(7,616) |
|
|
— |
|
|
— |
|
|
— |
|
|
— |
|
|
(7,616) |
|
Class A Partnership Units and other equity purchased or converted to Class A Common stock |
|
631,619 |
|
(343,857) |
|
— |
|
|
6 |
|
|
(4) |
|
|
— |
|
|
5,727 |
|
|
— |
|
|
— |
|
|
(1,093) |
|
|
4,636 |
|
Net excess tax benefit (detriment) from equity-based compensation |
|
— |
|
— |
|
— |
|
|
— |
|
|
— |
|
|
— |
|
|
428 |
|
|
— |
|
|
— |
|
|
— |
|
|
428 |
|
Other |
|
— |
|
(43,037) |
|
— |
|
|
— |
|
|
— |
|
|
— |
|
|
1,122 |
|
|
— |
|
|
— |
|
|
(1,075) |
|
|
47 |
|
Balance as of December 31, 2015 |
|
20,536,740 |
|
31,229,236 |
|
(263,622) |
|
$ |
205 |
|
$ |
312 |
|
$ |
(7,616) |
|
$ |
190,703 |
|
$ |
(15,338) |
|
$ |
108 |
|
$ |
89,044 |
|
$ |
257,418 |
|
Balance as of January 1, 2016 |
|
20,536,740 |
|
31,229,236 |
|
(263,622) |
|
$ |
205 |
|
$ |
312 |
|
$ |
(7,616) |
|
$ |
190,703 |
|
$ |
(15,338) |
|
$ |
108 |
|
$ |
89,044 |
|
$ |
257,418 |
|
Net income (loss) |
|
— |
|
— |
|
— |
|
|
— |
|
|
— |
|
|
— |
|
|
— |
|
|
38,387 |
|
|
— |
|
|
103,478 |
|
|
141,865 |
|
Equity-based compensation |
|
308,720 |
|
(2,132) |
|
— |
|
|
4 |
|
|
— |
|
|
— |
|
|
73,914 |
|
|
— |
|
|
— |
|
|
3,132 |
|
|
77,050 |
|
Other comprehensive income (loss) |
|
— |
|
— |
|
— |
|
|
— |
|
|
— |
|
|
— |
|
|
— |
|
|
— |
|
|
(651) |
|
|
(1,083) |
|
|
(1,734) |
|
Dividends declared ($3.29 per share of Class A Common Stock) and distributions |
|
— |
|
— |
|
— |
|
|
— |
|
|
— |
|
|
— |
|
|
23,367 |
|
|
(91,278) |
|
|
— |
|
|
(154,858) |
|
|
(222,769) |
|
Treasury stock purchases |
|
— |
|
— |
|
(124,268) |
|
|
— |
|
|
— |
|
|
(3,314) |
|
|
— |
|
|
— |
|
|
— |
|
|
— |
|
|
(3,314) |
|
Class A Partnership Units and other equity purchased or converted to Class A Common stock |
|
103,538 |
|
(88,911) |
|
— |
|
|
1 |
|
|
(1) |
|
|
— |
|
|
952 |
|
|
— |
|
|
— |
|
|
(117) |
|
|
835 |
|
Net excess tax benefit (detriment) from equity-based compensation |
|
— |
|
— |
|
— |
|
|
— |
|
|
— |
|
|
— |
|
|
(62) |
|
|
— |
|
|
— |
|
|
— |
|
|
(62) |
|
Other |
|
— |
|
— |
|
— |
|
|
— |
|
|
— |
|
|
— |
|
|
2,152 |
|
|
— |
|
|
— |
|
|
— |
|
|
2,152 |
|
Balance as of December 31, 2016 |
|
20,948,998 |
|
31,138,193 |
|
(387,890) |
|
$ |
210 |
|
$ |
311 |
|
$ |
(10,930) |
|
$ |
291,026 |
|
$ |
(68,229) |
|
$ |
(543) |
|
$ |
39,596 |
|
$ |
251,441 |
|
Balance as of January 1, 2017 |
|
20,948,998 |
|
31,138,193 |
|
(387,890) |
|
$ |
210 |
|
$ |
311 |
|
$ |
(10,930) |
|
$ |
291,026 |
|
$ |
(68,229) |
|
$ |
(543) |
|
$ |
39,596 |
|
$ |
251,441 |
|
Cumulative effect adjustment upon adoption of ASU 2016-09 |
|
— |
|
— |
|
— |
|
|
— |
|
|
— |
|
|
— |
|
|
4,855 |
|
|
(4,197) |
|
|
— |
|
|
— |
|
|
658 |
|
Balance as of January 1, 2017, as adjusted |
|
20,948,998 |
|
31,138,193 |
|
(387,890) |
|
|
210 |
|
|
311 |
|
|
(10,930) |
|
|
295,881 |
|
|
(72,426) |
|
|
(543) |
|
|
39,596 |
|
|
252,099 |
|
Net income (loss) |
|
— |
|
— |
|
— |
|
|
— |
|
|
— |
|
|
— |
|
|
— |
|
|
29,400 |
|
|
— |
|
|
97,124 |
|
|
126,524 |
|
Equity-based compensation |
|
1,708,826 |
|
— |
|
— |
|
|
17 |
|
|
— |
|
|
— |
|
|
94,141 |
|
|
— |
|
|
— |
|
|
2,137 |
|
|
96,295 |
|
Other comprehensive income (loss) |
|
— |
|
— |
|
— |
|
|
— |
|
|
— |
|
|
— |
|
|
— |
|
|
— |
|
|
895 |
|
|
932 |
|
|
1,827 |
|
Dividends declared ($2.48 per share of Class A Common Stock) and distributions |
|
— |
|
— |
|
— |
|
|
— |
|
|
— |
|
|
— |
|
|
24,657 |
|
|
(96,892) |
|
|
— |
|
|
(115,393) |
|
|
(187,628) |
|
Treasury Stock Purchases |
|
— |
|
— |
|
(319,526) |
|
|
— |
|
|
— |
|
|
(12,258) |
|
|
— |
|
|
— |
|
|
— |
|
|
— |
|
|
(12,258) |
|
Exercise of Stock options |
|
279,277 |
|
— |
|
— |
|
|
3 |
|
|
— |
|
|
— |
|
|
6,052 |
|
|
— |
|
|
— |
|
|
— |
|
|
6,055 |
|
Issuance of Class A common stock and cancellation of Class B common stock in connection with offerings and other exchanges |
|
11,226,067 |
|
(11,225,963) |
|
— |
|
|
112 |
|
|
(112) |
|
|
— |
|
|
60,762 |
|
|
— |
|
|
— |
|
|
(5,090) |
|
|
55,672 |
|
Equity-based payments to non-employees |
|
— |
|
— |
|
— |
|
|
— |
|
|
— |
|
|
— |
|
|
5,615 |
|
|
— |
|
|
— |
|
|
— |
|
|
5,615 |
|
Other |
|
(126) |
|
— |
|
— |
|
|
— |
|
|
— |
|
|
— |
|
|
55 |
|
|
— |
|
|
— |
|
|
— |
|
|
55 |
|
Balance as of December 31, 2017 |
|
34,163,042 |
|
19,912,230 |
|
(707,416) |
|
$ |
342 |
|
$ |
199 |
|
$ |
(23,188) |
|
$ |
487,163 |
|
$ |
(139,918) |
|
$ |
352 |
|
$ |
19,306 |
|
$ |
344,256 |
See notes to the consolidated financial statements.
53
Moelis & Company
Notes to the Consolidated Financial Statements
(dollars in thousands)
1. ORGANIZATION AND BASIS OF PRESENTATION
Moelis & Company and its consolidated subsidiaries (the “Company,” “we,” “our,” or “us”) is a leading global investment bank incorporated in Delaware. Prior to the Company’s IPO, the business operated as a Delaware limited partnership that commenced operations during 2007. Following the IPO, the operations are owned by Moelis & Company Group LP (“Group LP”), a U.S. Delaware limited partnership, and Group LP is controlled by Moelis & Company. Moelis & Company’s shareholders are entitled to receive a portion of Group LP’s economics through their direct ownership interests in shares of Class A common stock of Moelis & Company. The noncontrolling interest owners of Group LP (not Moelis & Company) receive economics of the operations primarily through their ownership interests in Group LP partnership units.
The Company’s activities as an investment banking advisory firm constitute a single business segment offering clients, including corporations, governments and financial sponsors, a range of advisory services with expertise across all major industries in mergers and acquisitions, recapitalizations and restructurings and other corporate finance matters.
Basis of Presentation—The consolidated financial statements of Moelis & Company include its partnership interests in Group LP, its equity interest in the sole general partner of Group LP, Moelis & Company Group GP LLC (“Group GP”), and its interests in its subsidiaries. Moelis & Company will operate and control all of the business and affairs of Group LP and its operating entity subsidiaries indirectly through its equity interest in Group GP. The Company operates through the following subsidiaries:
|
· |
Moelis & Company LLC (“Moelis U.S.”), a Delaware limited liability company, a registered broker‑dealer with the U.S. Securities and Exchange Commission (“SEC”) and a member of the Financial Industry Regulatory Authority, Inc. (“FINRA”). |
|
· |
Moelis & Company International Holdings LLC (“Moelis International”), a Delaware limited liability company, owns the following entities and investments: |
|
· |
Moelis & Company UK LLP (“Moelis UK”), a limited liability partnership registered under the laws of England and Wales. In addition to the United Kingdom, Moelis UK maintains operations through the following branches: |
|
· |
Moelis & Company UK LLP, French Branch (French branch) |
|
· |
Moelis & Company Europe Limited, Frankfurt am Main Branch (German branch) |
|
· |
Moelis & Company UK LLP, DIFC Branch (Dubai branch) |
|
· |
Moelis & Company Asia Limited (“Moelis Asia”), a limited company incorporated in Hong Kong licensed under the Hong Kong Securities and Futures Ordinance to provide financial advisory services. In addition to Hong Kong, Moelis Asia maintains operations in Beijing China through Hong Kong Moelis & Company Asia Limited Beijing Representative Office, as well as having a wholly‑owned Chinese subsidiary, Moelis & Company Consulting (Beijing) Company Limited. |
|
· |
Moelis & Company India Private Limited, a private limited company incorporated in Mumbai, India. |
|
· |
Moelis & Company Assessoria Financeira Ltda. (“Moelis Brazil”), a limited liability company incorporated in São Paulo, Brazil. |
|
· |
An equity method investment in Moelis Australia Limited (“Moelis Australia”), a public company listed on the Australian Securities Exchange. |
54
2. SUMMARY OF SIGNIFICANT ACCOUNTING POLICIES
Basis of Accounting—The Company prepared the accompanying consolidated financial statements in conformity with accounting principles generally accepted in the United States of America (“U.S. GAAP”). The consolidated financial statements include the combined operations, assets and liabilities of the Company.
Consolidation—The Company’s policy is to consolidate (i) entities, other than limited partnerships, in which it has a controlling financial interest, (ii) variable interest entities where the Company has a variable interest and is deemed to be the primary beneficiary and (iii) limited partnerships where the Company has ownership of the majority of voting interests. When the Company does not have a controlling interest in an entity, but exerts significant influence over the entity’s operating and financial decisions, the Company applies the equity method of accounting in which it records in earnings its share of income or losses of the entity. All intercompany balances and transactions with the Company’s subsidiaries have been eliminated in consolidation.
Use of Estimates—The preparation of consolidated financial statements and related disclosures in conformity with U.S. GAAP requires management to make estimates and assumptions that affect the reported amounts of assets and liabilities and disclosure of contingent assets and liabilities at the date of the financial statements, and the reported amounts of revenues and expenses during the reporting period. Actual results could differ from those estimates. Estimates and assumptions are reviewed periodically, and the effects of revisions are reflected in the period in which they are determined to be necessary.
In preparing the consolidated financial statements, management makes estimates and assumptions regarding:
|
· |
the adequacy of the allowance for doubtful accounts; |
|
· |
the measurement and realization of deferred taxes; |
|
· |
the measurement of amount due pursuant to the tax receivable agreement; |
|
· |
the measurement and vesting of equity‑based compensation; and |
|
· |
other matters that affect the reported amounts and disclosures of contingencies in the financial statements. |
Cash and Cash Equivalents—Cash and cash equivalents include all short‑term highly liquid investments that are readily convertible to known amounts of cash and have original maturities of three months or less from the date of purchase.
As of December 31, 2017, the Company had cash equivalents of $127,159 (December 31, 2016: $246,933) invested primarily in government securities money markets, government debt securities and U.S. Treasury instruments. Additionally, as of December 31, 2017, the Company had cash of $86,032 (December 31, 2016: $71,993) maintained in U.S. and non‑U.S. bank accounts, of which most bank account balances had little or no insurance coverage (most balances are held in U.S. and U.K. accounts which exceeded the U.S. Federal Deposit Insurance Corporation and U.K. Financial Services Compensation Scheme coverage limits).
Restricted Cash—As of December 31, 2017, the Company held cash of $703 (December 31, 2016: $659) in restricted collateral deposits primarily held by certain non‑U.S. subsidiaries.
Receivables—The accompanying consolidated statements of financial condition present accounts receivable balances net of allowance for doubtful accounts based on the Company’s assessment of the collectability of customer accounts.
The Company maintains an allowance for doubtful accounts that, in management’s opinion, provides for an adequate reserve to cover losses that may be incurred. The Company regularly reviews the allowance by considering factors such as historical experience, credit quality, age of the accounts receivable, and the current economic conditions that may affect a customer’s ability to pay such amounts owed to the Company.
55
After concluding that a reserved accounts receivable is no longer collectible, the Company will charge‑off the receivable. This is determined based on several factors including the age of the accounts receivable and the credit worthiness of the customer. This has the effect of reducing both the gross receivable and the allowance for doubtful accounts.
Deferred Compensation—Deferred compensation costs represent arrangements with certain employees whereby cash payments are subject to a required period of service subsequent to payment by the Company. These amounts are charged to expenses over the period that the employee is required to provide services in order to vest in the payment.
Financial Instruments at Fair Value—Fair value is generally based on quoted prices, however if quoted market prices are not available, fair value is determined based on other relevant factors, including dealer price quotations, price activity for equivalent instruments and valuation pricing models. The Company established a fair value hierarchy which prioritizes and ranks the level of market price observability used in measuring financial instruments at fair value. Market price observability is affected by a number of factors, including the type of instrument, the characteristics specific to the instrument and the state of the marketplace (including the existence and transparency of transactions between market participants). Financial instruments with readily‑available actively quoted prices or for which fair value can be measured from actively‑quoted prices in an orderly market will generally have a higher degree of market price observability and a lesser degree of judgment used in measuring fair value.
Financial instruments measured and reported at fair value are classified and disclosed in one of the following categories (from highest to lowest) based on inputs:
Level 1—Quoted prices (unadjusted) are available in active markets for identical instruments that the Company has the ability to access as of the reporting date. The Company, to the extent that it holds such instruments, does not adjust the quoted price for these instruments, even in situations in which the Company holds a large position and a sale could reasonably affect the quoted price.
Level 2—Pricing inputs are observable for the instruments, either directly or indirectly, as of the reporting date, but are not the same as those used in Level 1. Fair value is determined through the use of models or other valuation methodologies.
Level 3—Pricing inputs are unobservable for the instruments and include situations where there is little, if any, market activity for the investments. The inputs into the determination of fair value require significant judgment or estimation by the Company’s management.
In certain cases, the inputs used to measure fair value may fall into different levels of the fair value hierarchy. In such cases, the determination of which category within the fair value hierarchy is appropriate for any given investment is based on the lowest level of input that is significant to the fair value measurement. The Company’s assessment of the significance of a particular input to the fair value measurement in its entirety requires judgment, and considers factors specific to the instrument.
For level 3 investments in which pricing inputs are unobservable and limited market activity exists, management’s determination of fair value is based on the best information available, may incorporate management’s own assumptions and involves a significant degree of judgment.
Equity Method Investments—The Company accounts for its equity method investments under the equity method of accounting as the Company does not control these entities but has the ability to exercise significant influence. The amounts recorded on the consolidated financial statements of financial condition reflect the Company’s share of contributions made to, distributions received from, and the equity earnings and losses of, the investments. The Company reflects its share of gains and losses of the investment in income (loss) from equity method investments in the consolidated statements of operations. Certain adjustments have been made to account for the Company’s equity method investment in Moelis Australia under US GAAP as Moelis Australia Limited follows local accounting principles under Australian Accounting Standards.
Equipment and Leasehold Improvements—Office equipment and furniture and fixtures are stated at cost less accumulated depreciation, which is determined using the straight‑line method over the estimated useful lives of the
56
assets, ranging from three to seven years, respectively. Leasehold improvements are stated at cost less accumulated amortization, which is determined using the straight‑line method over the lesser of the term of the lease or the estimated useful life of the asset.
Major renewals and improvements are capitalized and minor replacements, maintenance and repairs are charged to expenses as incurred. Upon retirement or disposal of assets, the cost and related accumulated depreciation or amortization are removed from the consolidated statements of financial condition and any gain or loss is reflected in the consolidated statements of operations.
Deferred Tax Asset and Amount Due Pursuant to Tax Receivable Agreement –In conjunction with the IPO, the Company was treated for U.S. federal income tax purposes as having directly purchased Class A partnership units in Group LP from the existing unitholders. Additional Group LP Class A partnership units may be exchanged for shares of Class A common stock in the Company. The initial purchase and future exchanges are expected to result in an increase in the tax basis of Group LP’s assets attributable to the Company’s interest in Group LP. These increases in the tax basis of Group LP’s assets attributable to the Company’s interest in Group LP would not have been available but for the initial purchase and future exchanges. Such increases in tax basis are likely to increase (for tax purposes) depreciation and amortization deductions and therefore reduce the amount of income tax the Company would otherwise be required to pay in the future. As a result, the Company records a deferred tax asset for such increase in tax basis.
The Company has entered into a tax receivable agreement with its eligible Managing Directors that will provide for the payment by the Company to its eligible Managing Directors of 85% of the amount of cash savings, if any, in U.S. federal, state and local income tax or franchise tax that the Company actually realizes as a result of (a) the increases in tax basis attributable to exchanges by its eligible Managing Directors and (b) tax benefits related to imputed interest deemed to be paid by the Company as a result of this tax receivable agreement. The Company expects to benefit from the remaining 15% of cash savings, if any, in income tax that it realizes and record any such estimated tax benefits as an increase to additional paid‑in‑capital. For purposes of the tax receivable agreement, cash savings in income tax will be computed by comparing the Company’s actual income tax liability to the amount of such taxes that it would have been required to pay had there been no increase to the tax basis of the tangible and intangible assets of Group LP as a result of the exchanges and had it not entered into the tax receivable agreement. The term of the tax receivable agreement commenced upon consummation of the IPO and will continue until all such tax benefits have been utilized or expired, unless the Company exercises its right to terminate the tax receivable agreement for an amount based on an agreed value of payments remaining to be made under the agreement. The Company has recorded the estimated tax benefits related to the increase in tax basis and imputed interest as a result of the initial purchase and subsequent exchanges described above as a deferred tax asset in the consolidated statements of financial condition. The amount due to its eligible Managing Directors related to the tax receivable agreement as a result of the initial purchase and subsequent exchanges described above is recorded as amount due pursuant to tax receivable agreement in the consolidated statements of financial condition. The amounts recorded for the deferred tax asset and the liability for our obligations under the tax receivable agreement are estimates. Any adjustments to our estimates subsequent to their initial establishment will be included in net income (loss). Future exchanges of Class A partnership units in Group LP for Class A common shares in the Company will be accounted for in a similar manner.
In connection with the enactment of the Tax Cuts and Jobs Act on December 22, 2017, which reduced the U.S. corporate federal tax rate for future years, the Company re-measured its net deferred tax assets and its liability pursuant to the tax receivable agreement to reflect the impact of the lower enacted tax rate. See Note 7 for further discussion.
Revenue and Expense Recognition—The Company recognizes revenues from providing advisory services when earned and collection is reasonably assured. Upfront fees are recognized over the estimated period that the related services are performed. Transaction‑related fees are recognized when all services for a transaction have been provided, specified conditions have been met and the transaction closes. Underwriting revenues are recognized when the offering is deemed complete and is presented net of related expenses. Deferred revenues are recorded for fees received that have not yet been earned. Expenses are reflected on the consolidated statements of operations, net of client reimbursements. Reimbursable expenses billed to clients totaled $15,431, $16,369 and $13,678 for the years ended December 31, 2017, 2016 and 2015, respectively.
Equity‑based Compensation—The Company recognizes the cost of employee services received in exchange for an equity instrument award. The cost is based on its grant‑date fair value based on quoted market prices at the time of grant amortized over the service period required by the award’s vesting terms. The Company records as treasury stock
57
shares repurchased from its employees for the purpose of settling tax liabilities incurred upon the vesting of restricted stock units (“RSUs”). The Company records dividends in kind, net of forfeitures, on outstanding RSUs as a dividend payment and a charge to equity. Dividends in kind on RSUs are subject to the same vesting conditions as the underlying RSUs on which they were accrued. Dividends in kind will be forfeited if the award does not vest.
For the purposes of calculating diluted net income (loss) per share to holders of Class A common stock, unvested service‑based awards are included in the diluted weighted average shares of Class A common stock outstanding using the treasury stock method. See Note 9 for further discussion.
The Company has a retirement plan whereby a retiring employee generally will not forfeit certain qualifying incentive RSUs granted during employment if at retirement the employee meets certain requirements. For qualifying awards issued prior to December 1, 2016, the employee must (i) be at least 54 years old and (ii) have provided at least 8 consecutive years of service to the Company. For qualifying awards issued on or after December 1, 2016, (i) the employee must be at least 56 years old, (ii) the employee must have provided at least 5 consecutive years of service to the Company and (iii) the total of (i) and (ii) must be equal to at least 65 years. Any such RSUs will continue to vest on their applicable vesting schedule, subject to noncompetition and other terms. Over time a greater number of employees may become retirement eligible and the related requisite service period over which we will expense these awards will be shorter than the stated vesting period. Any unvested RSUs prior to meeting the stated requisite service period or retirement eligibility date are eligible to receive dividends in kind; however, the right to dividends in kind will be forfeited if the underlying award does not vest.
Effective January 1, 2017, the Company adopted a change in accounting policy in accordance with Accounting Standards Update 2016-09, “Compensation—Stock Compensation (Topic 718)” (“ASU 2016-09”) to account for forfeitures as they occur. The change was applied on a modified retrospective basis with a cumulative decrease to retained earnings and an increase in additional paid-in capital (“APIC”) of $4,855 as of January 1, 2017. The tax effect of this adjustment increased deferred tax assets and retained earnings by $658. No prior periods were adjusted as a result of this change in accounting policy.
Income Taxes—The Company accounts for income taxes in accordance with ASC 740, “Accounting for Income Taxes” (“ASC 740”), which requires the recognition of tax benefits or expenses on temporary differences between the financial reporting and tax bases of its assets and liabilities by applying the enacted tax rates in effect for the year in which the differences are expected to reverse. Such net tax effects on temporary differences are reflected on the Company’s consolidated statements of financial condition as deferred tax assets and liabilities. Deferred tax assets are reduced by a valuation allowance when the Company believes that it is more‑likely‑than‑not that some portion or all of the deferred tax assets will not be realized.
ASC 740‑10 prescribes a two‑step approach for the recognition and measurement of tax benefits associated with the positions taken or expected to be taken in a tax return that affect amounts reported in the financial statements. The Company has reviewed and will continue to review the conclusions reached regarding uncertain tax positions, which may be subject to review and adjustment at a later date based on ongoing analyses of tax laws, regulations and interpretations thereof. For the years ended December 31, 2017, 2016 and 2015, no unrecognized tax benefit was recorded. To the extent that the Company’s assessment of the conclusions reached regarding uncertain tax positions changes as a result of the evaluation of new information, such change in estimate will be recorded in the period in which such determination is made. The Company reports income tax‑related interest and penalties relating to uncertain tax positions, if applicable, as a component of income tax expense. For the years ended December 31, 2017, 2016 and 2015, no such amounts were recorded.
Prior to January 1, 2017, all excess tax benefits resulting from exercise or settlement of share-based payment transactions were recognized in APIC and any tax deficiencies were either offset against APIC, or were recognized in the income statement under certain conditions. Under ASU 2016-09, all excess tax benefits and deficiencies are recognized as income tax benefits or expenses in the consolidated statement of operations prospectively.
Under ASU 2016-09, the Company is now required to present excess tax benefits and detriments as an operating activity in the same manner as other cash flows related to income taxes rather than as a financing activity. The Company adopted these changes retrospectively, and prior year excess tax benefits are now reflected in changes in prepaid expenses and other assets within the consolidated statement of cash flows.
58
Foreign Currency Translation—Assets and liabilities held in non‑U.S. dollar denominated currencies are translated into U.S. dollars at exchange rates in effect at the end of the reporting period. Revenues and expenses are translated at average exchange rates during the reporting period. A charge or credit is recorded to other comprehensive income to reflect the translation of these amounts to the extent the non‑U.S. currency is designated the functional currency of the subsidiary. Non‑functional currency related transaction gains and losses are immediately recorded in the consolidated statements of operations.
3. RECENT ACCOUNTING PRONOUNCEMENTS
In May 2014, the FASB issued ASU No. 2014-09, “Revenue from Contracts with Customers” (“ASU 2014-09”). ASU 2014-09 requires a company to recognize revenue in an amount that reflects the consideration to which the entity expects to be entitled in exchange for services provided. The amendment requires enhanced disclosures regarding the nature, amount, timing and uncertainty of revenues and cash flows from contracts with customers. In August 2015, the FASB issued ASU No. 2015-14, “Deferral of the Effective Date”, which provides amendments that defer the effective date of ASU 2014-09 by one year. The amendments in this update are effective either retrospectively to each prior reporting period presented, or as a cumulative effect adjustment as of the date of adoption, during interim and annual periods beginning after December 15, 2017, with early adoption permitted beginning after December 15, 2016. The Company adopted ASU 2014-09 on January 1, 2018, using the modified retrospective approach. The adoption of ASU 2014-09 will affect the timing of revenue recognition and the presentation of reimbursable expenses billed to clients in our consolidated statements of operations. Specifically, revenue and deal-related expenses for the majority of engagements will be recognized over time and reimbursed expenses will be presented gross in revenues and expenses. In addition, underwriting revenues, which are currently disclosed net of expenses, will be reported gross in our consolidated statements of operations.
In January 2016, the FASB issued ASU No. 2016-01, “Financial Instruments—Overall: Recognition and Measurement of Financial Assets and Financial Liabilities” (“ASU 2016-01”). ASU 2016-01 enhances the reporting model for financial instruments by addressing certain aspects of the recognition, measurement, presentation and disclosure of financial instruments. Key provisions require equity investments (except those accounted for under the equity method of accounting) to be measured at fair value with changes in fair value recognized in net income. In addition, the exit price notion must be used when measuring the fair value of financial instruments for disclosure purposes. ASU 2016-01 is effective for fiscal years, and interim periods within those fiscal years, beginning after December 15, 2017. The Company adopted ASU 2016-01 on January 1, 2018, with a cumulative-effect adjustment to retained earnings for the unrealized gains and losses within accumulated other comprehensive income related to equity investments. The adoption of ASU 2016-01 is not anticipated to have a material impact on our consolidated financial statements.
In February 2016, the FASB issued ASU No. 2016-02, “Leases” (“ASU 2016-02”). ASU 2016-02 increases the transparency and comparability among organizations by recognizing lease assets and lease liabilities on the balance sheet and disclosing key information about leasing arrangements. The amendments will retain lease classifications, distinguishing finance leases from operating leases, using criteria that is substantially similar for distinguishing capital leases from operating leases in previous guidance. Lessees and lessors are required to recognize and measure leases at the beginning of the earliest period presented using a modified retrospective approach. ASU 2016-02 is effective for fiscal years, and interim periods within those fiscal years, beginning after December 15, 2018. Early adoption is permitted. Upon initial evaluation, the Company has determined it will record right-to-use assets and liabilities measured at the present value of reasonably certain lease payments on our consolidated statements of financial condition. We do not anticipate any material changes to our consolidated statements of operations.
In August 2016, the FASB issued ASU No. 2016-15, “Statement of Cash Flows—Classification of Certain Cash Receipts and Cash Payments” (“ASU 2016-15”). ASU 2016-15 provides more standardized guidance to improve consistency surrounding the classification of certain cash payments and receipts between the operating, investing, and financing sections of the statement of cash flows. These transactions include the settlement of certain debt instruments, distributions received from equity-method investees and other transactions. ASU 2016-15 is effective for fiscal years, and interim periods within those fiscal years, beginning after December 15, 2017. Early adoption is permitted. The Company adopted ASU 2016-15 on January 1, 2018. The primary impact of ASU 2016-15 is selecting one of two acceptable accounting treatments for distributions received from equity method investments. The Company currently follows the nature of distribution approach, therefore, we do not anticipate the adoption of ASU 2016-15 to have a material impact on our consolidated financial statements.
59
In October 2016, the FASB issued ASU No. 2016-16, “Income Taxes—Intra-Entity Transfers of Assets Other Than Inventory” (“ASU 2016-16”). ASU 2016-16 provides clearer guidance related to current and deferred income taxes driven by intra-entity asset transfers. Specifically, this ASU states that an entity should recognize the income tax consequences of intra-entity transfers of assets other than inventory when they occur whereas in the past, certain entities did not recognize these impacts until the asset was sold to a third party. ASU 2016-16 is effective for fiscal years, and interim periods within those fiscal years, beginning after December 15, 2017. Early adoption is permitted. The Company adopted ASU 2016-16 on January 1, 2018, and it is not anticipated to have a material impact on our consolidated financial statements.
In November 2016, the FASB issued ASU No. 2016-18, “Statement of Cash Flows—Restricted Cash” (“ASU 2016-18”). ASU 2016-18 requires that entities include a reconciliation of changes in restricted cash in their cash flow statement. This will standardize the diversity in practice where some entities included such balances in their statement, while others omitted them. ASU 2016-18 is effective for fiscal years, and interim periods within those fiscal years, beginning after December 15, 2017. Early adoption is permitted. The Company adopted ASU 2016-18 on January 1, 2018, and it is not anticipated to have a material impact on the Company’s disclosures.
In May 2017, the FASB issued ASU No. 2017-09, “Compensation—Stock Compensation” (“ASU 2017-09”). ASU 2017-09 provides greater clarity on issues regarding accounting for changes in terms or conditions of share-based payment awards. ASU 2017-09 is effective for fiscal years, and interim periods within those fiscal years, beginning after December 15, 2017. Early adoption is permitted. The Company adopted ASU 2017-09 on January 1, 2018, and it is not anticipated to have a material impact on the Company’s consolidated financial statements.
4. EQUITY METHOD INVESTMENTS
Moelis Australia
On April 1, 2010, the Company entered into a 50‑50 joint venture in Moelis Australia Holdings PTY Limited, investing a combination of cash and certain net assets in exchange for its interests. The remaining 50% was owned by an Australian trust established by and for the benefit of Moelis Australia senior executives.
On April 10, 2017, Moelis Australia consummated their initial public offering and became listed on the Australian Securities Exchange (ASX: MOE). As a result of the offering, the Company’s ownership interest in Moelis Australia was diluted to less than 50% and the Company recognized a gain of approximately $15,170, recorded in other income and expenses on the consolidated statement of operations. Contemporaneous with the offering, Moelis Australia agreed to terminate an asset management related revenue sharing agreement resulting in a payment to a third party, of which the Company recognized a charge of approximately $2,400 in income (loss) from equity method investments. In connection with Moelis Australia’s initial public offering, the Company and Moelis Australia entered into a Strategic Alliance Agreement for Moelis Australia to continue to conduct its investment banking advisory business in Australia and New Zealand as an integrated part of the global advisory business of the Company consistent with the manner in which Moelis Australia and the Company have partnered together since 2010. Also, in connection with the offering and new shareholders agreement, the Company and Moelis Australia terminated a put option enabling the key senior Australian executive to sell his shares held in Moelis Australia back to the Company, and a call option held by the Company to purchase additional shares in Moelis Australia. On March 20, 2017, Moelis Australia declared a dividend, of which the Company received $11,672 on April 18, 2017. The Company accounted for the dividend as a return on investment and reduced the carrying value of the investment in Moelis Australia by $11,672.
On September 13, 2017 and October 30, 2017, Moelis Australia completed offerings of 11,940,000 and 10,060,000 shares of common stock, respectively, to raise additional capital. The issuance of shares further reduced Moelis & Company’s ownership interest in Moelis Australia. These shares were issued at a fair value greater than the carrying value of the ownership interest disposed, resulting in gains of approximately $14,429 and $9,680, respectively, recorded in other income on the consolidated statement of operations. Moelis Australia issued additional shares during 2017 related to acquisitions, which further reduced Moelis & Company’s ownership interest in Moelis Australia. The shares were issued at a fair value greater than the carrying value of the ownership interest disposed, resulting in a gain of approximately $2,372, recorded in other income and expenses on the consolidated statement of operations.
60
Summary financial information related to Moelis Australia is as follows:
|
|
Year Ended December 31, |
|||||||
|
|
2017 |
|
2016 |
|
2015 |
|||
|
Total revenues |
$ |
83,602 |
|
$ |
41,292 |
|
$ |
31,076 |
|
Total expenses |
|
(62,187) |
|
|
(34,526) |
|
|
(30,460) |
|
Net Income (loss) |
$ |
21,415 |
|
$ |
6,766 |
|
$ |
616 |
|
|
|
|
|
|
|
|
|
|
|
Moelis & Company's Income (loss) from equity method investment |
$ |
8,366 |
|
$ |
3,383 |
|
$ |
308 |
|
|
|
|
|
|
|
|
|
|
|
|
December 31, |
|
December 31, |
|
|
|
||
|
|
2017 |
|
2016 |
|
|
|
||
|
Total assets |
$ |
222,514 |
|
$ |
53,004 |
|
|
|
|
Total liabilities |
|
(54,100) |
|
|
(29,408) |
|
|
|
|
Net equity |
$ |
168,414 |
|
$ |
23,596 |
|
|
|
As of December 31, 2017, 2016 and 2015, the Company’s ownership interest in Moelis Australia was approximately 33%, 50% and 50%, respectively.
Other Equity Method Investment
In June 2014, the Company made an investment of $265 into a general partner entity which invests third‑party funds and is controlled by a related party, Moelis Asset Management LP. The Company has determined that it should account for this investment as an equity method investment on its consolidated financial statements. For the years ended December 31, 2016 and 2015, $1,693 and $4,168 of income was recorded on this investment, respectively.
During the years ended December 31, 2016 and 2015, the Company received cash distributions from this entity in the amounts of $1,427 and $4,669, respectively. The investment was substantially liquidated during 2016.
5. EQUIPMENT AND LEASEHOLD IMPROVEMENTS
Equipment and leasehold improvements, net consists of the following:
|
|
|
December 31, |
|
December 31, |
|
||
|
|
|
2017 |
|
2016 |
|
||
|
Office equipment |
|
$ |
9,639 |
|
$ |
12,489 |
|
|
Furniture and fixtures |
|
|
3,424 |
|
|
3,255 |
|
|
Leasehold improvements |
|
|
11,324 |
|
|
8,151 |
|
|
Total |
|
|
24,387 |
|
|
23,895 |
|
|
Less accumulated depreciation and amortization |
|
|
(13,929) |
|
|
(15,498) |
|
|
Equipment and leasehold improvements, net |
|
$ |
10,458 |
|
$ |
8,397 |
|
Depreciation and amortization expenses for fixed assets totaled $3,544, $3,183 and $2,635 for the years ended December 31, 2017, 2016, and 2015, respectively.
6. FAIR VALUE MEASUREMENTS
The Company established a fair value hierarchy which prioritizes and ranks the level of market price observability used in measuring investments at fair value. Financial instruments measured and reported at fair value are classified and disclosed in one of the following categories (from highest to lowest) based on inputs:
Level 1—Quoted prices (unadjusted) are available in active markets for identical instruments that the Company has the ability to access as of the reporting date. The Company, to the extent that it holds such instruments, does not adjust the quoted price for these instruments, even in situations in which the Company holds a large position and a sale could reasonably affect the quoted price.
61
Level 2—Pricing inputs are observable for the instruments, either directly or indirectly, as of the reporting date, but are not the same as those used in level 1. Fair value is determined through the use of models or other valuation methodologies.
Level 3—Pricing inputs are unobservable for the instruments and include situations in which there is little, if any, market activity for the investments. The inputs into the determination of fair value require significant judgment or estimation by the Company’s management.
The estimated fair values of government securities money markets, U.S. Treasury instruments, and government debt securities as of December 31, 2017 and 2016 are based on quoted prices for recent trading activity in identical or similar instruments. The Company generally invests in U.S. Treasury Bills with maturities of less than twelve months. See Note 2 for further information on the Company’s fair value hierarchy.
In 2015 the Company received convertible notes as compensation for its services and classified this investment as available-for-sale. In July 2016, the issuer of the convertible notes consummated its initial public offering and the notes converted into common stock of the issuer at a discounted conversion rate equal to the principal value of the notes plus accrued interest. The common stock is classified as available-for-sale and the subsequent measurement of its fair value is recorded based upon the quoted price in its active market. Unrealized changes in fair value are reflected in other comprehensive income in the consolidated financial statements.
The following table summarizes the levels of the fair value hierarchy into which the Company’s financial assets fall as of December 31, 2017:
|
|
|
Total |
|
Level 1 |
|
Level 2 |
|
Level 3 |
||||
|
Financial assets: |
|
|
|
|
|
|
|
|
|
|
|
|
|
Included in cash and cash equivalents |
|
|
|
|
|
|
|
|
|
|
|
|
|
Government debt securities (1) |
|
$ |
41,086 |
|
$ |
— |
|
$ |
41,086 |
|
$ |
— |
|
U.S. treasury instruments |
|
|
39,978 |
|
|
— |
|
|
39,978 |
|
|
— |
|
Government securities money market |
|
|
46,095 |
|
|
— |
|
|
46,095 |
|
|
— |
|
Investments |
|
|
|
|
|
|
|
|
|
|
|
|
|
Government debt securities (1) |
|
|
39,910 |
|
|
— |
|
|
39,910 |
|
|
— |
|
U.S. treasury instruments |
|
|
55,935 |
|
|
7,943 |
|
|
47,992 |
|
|
— |
|
Common stock |
|
|
263 |
|
|
263 |
|
|
— |
|
|
— |
|
Total financial assets |
|
$ |
223,267 |
|
$ |
8,206 |
|
$ |
215,061 |
|
$ |
— |
|
(1) |
Consists of municipal bonds, agency bonds and agency discount notes. |
The following table summarizes the levels of the fair value hierarchy into which the Company’s financial assets fall as of December 31, 2016:
|
|
|
Total |
|
Level 1 |
|
Level 2 |
|
Level 3 |
|
||||
|
Financial assets: |
|
|
|
|
|
|
|
|
|
|
|
|
|
|
Included in cash and cash equivalents |
|
|
|
|
|
|
|
|
|
|
|
|
|
|
U.S. treasury bills |
|
$ |
44,999 |
|
$ |
— |
|
$ |
44,999 |
|
$ |
— |
|
|
Government securities money market |
|
|
201,934 |
|
|
— |
|
|
201,934 |
|
|
— |
|
|
Investments |
|
|
|
|
|
|
|
|
|
|
|
|
|
|
U.S. treasury bills |
|
|
32,995 |
|
|
— |
|
|
32,995 |
|
|
— |
|
|
Common stock |
|
|
388 |
|
|
388 |
|
|
— |
|
|
— |
|
|
Total financial assets |
|
$ |
280,316 |
|
$ |
388 |
|
$ |
279,928 |
|
$ |
— |
|
62
The Company’s methodology for reclassifications impacting the fair value hierarchy is that transfers in/out of the respective category are reported at fair value as of the beginning of the period in which the reclassification occurred. The changes to the Company’s investments classified as level 3 are as follows for the year ended December 31, 2016.
|
|
|
Convertible notes |
|
|
January 1, 2016 |
|
$ |
635 |
|
Unrealized gains (losses) included in accumulated other comprehensive income |
|
|
43 |
|
Transfer out of level 3 due to conversion of convertible notes to common stock |
|
|
(678) |
|
December 31, 2016 |
|
$ |
— |
|
Unrealized gains (losses) related to investment still held as of December 31, 2016 |
|
$ |
— |
During the twelve months ended December 31, 2016, convertible notes held by the Company which were classified as level 3 were converted into common stock due to the occurrence of an initial public offering described above. As a result, the convertible notes classified as level 3 were converted to common stock classified as level 1.
At the end of the reporting period, the Company reviews U.S. treasury instruments held to determine whether the securities are of the most recent issuance of that security with the same maturity (referred to as “on-the-run”, which is the most liquid version of the maturity band). If a U.S. treasury instrument held at the end of the reporting period was from the most recent issuance it is classified as level 1, otherwise it is referred to as “off-the-run” and is classified as level 2. During the twelve months ended December 31, 2017 and 2016, there were $47,992 and $0 transfers from level 1 to level 2 related to U.S. Treasury instruments acquired on-the-run that as of the reporting period became off-the-run, respectively.
7. INCOME TAXES
The following table presents the U.S. and non‑U.S. components of income (loss) before income tax expense:
|
|
|
For the Year Ended December 31, |
|
|||||||
|
|
|
2017 |
|
2016 |
|
2015 |
|
|||
|
U.S. |
|
$ |
279,038 |
|
$ |
172,401 |
|
$ |
140,477 |
|
|
Non-U.S. |
|
|
71,313 |
|
|
(5,727) |
|
|
3,587 |
|
|
Income (loss) before income taxes |
|
$ |
350,351 |
|
$ |
166,674 |
|
$ |
144,064 |
|
The current and deferred components of the income tax provision for the years ended December 31, 2017, 2016, and 2015 are as follows:
|
|
|
For the Year Ended December 31, |
|
|||||||
|
|
|
2017 |
|
2016 |
|
2015 |
|
|||
|
Current income taxes: |
|
|
|
|
|
|
|
|
|
|
|
Federal |
|
$ |
19,923 |
|
$ |
22,178 |
|
$ |
14,483 |
|
|
State and Local |
|
|
4,556 |
|
|
5,361 |
|
|
4,254 |
|
|
Foreign |
|
|
7,651 |
|
|
(1,716) |
|
|
4,314 |
|
|
|
|
$ |
32,130 |
|
$ |
25,823 |
|
$ |
23,051 |
|
|
Deferred income taxes: |
|
|
|
|
|
|
|
|
|
|
|
Federal |
|
$ |
192,102 |
|
$ |
(848) |
|
$ |
774 |
|
|
State and Local |
|
|
1,538 |
|
|
(207) |
|
|
(29) |
|
|
Foreign |
|
|
(1,943) |
|
|
41 |
|
|
51 |
|
|
Total |
|
$ |
223,827 |
|
$ |
24,809 |
|
$ |
23,847 |
|
63
The total provision for income taxes differs from the amount which would be computed by applying the appropriate statutory rate to income before income taxes as follows:
|
|
|
For the Year Ended December 31, |
|
||||
|
|
|
2017 |
|
2016 |
|
2015 |
|
|
Reconciliation of federal statutory tax rates |
|
|
|
|
|
|
|
|
U.S. statutory tax rate |
|
35.0 |
% |
35.0 |
% |
35.0 |
% |
|
Increase (decrease) due to state and local taxes |
|
2.7 |
% |
2.3 |
% |
2.2 |
% |
|
Rate benefit as a U.S. limited partnership/flow through |
|
-10.1 |
% |
-21.8 |
% |
-22.1 |
% |
|
Estimated re-measurement impact primarily related to the Tax Act |
|
51.7 |
% |
0.0 |
% |
0.0 |
% |
|
Other income from reduction of amount due pursuant to tax receivable agreement in connection with the Tax Act |
|
-14.6 |
% |
0.0 |
% |
0.0 |
% |
|
Excess tax benefit from equity compensation delivery |
|
-1.7 |
% |
0.0 |
% |
0.0 |
% |
|
Foreign taxes |
|
0.7 |
% |
-0.9 |
% |
1.8 |
% |
|
Other |
|
0.2 |
% |
0.3 |
% |
-0.3 |
% |
|
Effective income tax rate |
|
63.9 |
% |
14.9 |
% |
16.6 |
% |
Deferred income taxes reflect the net effect of temporary differences between the tax basis of an asset or liability and its reported amount in the Company’s consolidated statements of financial condition. These temporary differences result in taxable or deductible amounts in future years. The significant components of deferred tax assets and liabilities included on the Company’s consolidated statements of financial condition are as follows:
|
|
|
For the Year Ended December 31, |
|
||||
|
|
|
2017 |
|
2016 |
|
||
|
Net operating loss |
|
$ |
7,685 |
|
$ |
5,988 |
|
|
Step-up in tax basis in Group LP assets |
|
|
208,799 |
|
|
143,630 |
|
|
Deferred Compensation |
|
|
28,043 |
|
|
21,132 |
|
|
Accrued expenses and other |
|
|
292 |
|
|
3,995 |
|
|
|
|
|
244,819 |
|
|
174,745 |
|
|
Valuation allowance on NOL and other |
|
|
(10,819) |
|
|
(6,954) |
|
|
Net deferred tax asset |
|
$ |
234,000 |
|
$ |
167,791 |
|
The Company recorded an increase in the net deferred tax asset of $66,209 for the year ended December 31, 2017, which was primarily attributable to the step-up in tax basis in Group LP assets resulting principally from the redemption of Class A partnership units in connection with the follow-on offerings in January and July 2017 and an increase in deferred compensation, partially offset by the amortization of tax basis in the Group LP assets, the vesting and delivery of equity-based compensation awards in 2017, and the re-measurement of the Company’s net deferred tax assets primarily in connection with the Tax Cuts and Jobs Act, which is described in greater detail below. The estimated impact of such re-measurement is $181,023, which includes adjustments to deferred assets primarily relating to the step-up in tax basis in Group LP assets related to the prior partnership unit exchanges and offerings, and deferred compensation. After the re-measurement, approximately $195,516 of the deferred tax asset related to step-up in tax basis in Group LP assets is attributable to exchanges by certain partners of Group LP who are party to the tax receivable agreement. Pursuant to this agreement, 85% (or $166,189) of the estimated tax benefits associated with this portion of the deferred tax asset are payable to such exchanging partners over the next 15 years and recorded as amount due pursuant to tax receivable agreement in the consolidated statements of financial condition. This amount, together with approximately $10,959 of estimated payments due within the twelve months, comprises our total tax receivable agreement obligation of $177,148 at the end of 2017. The remaining tax benefit is retained by the Company.
On December 22, 2017, the U.S. enacted comprehensive tax legislation commonly referred to as the Tax Cuts and Jobs Act (“Tax Act”). The Tax Act makes broad and complex changes to the U.S. tax code including, but not limited to, reducing the U.S. federal corporate tax rate from 35 percent to 21 percent, effective January 1, 2018.
The SEC staff issued SAB 118, which provides guidance on accounting for the tax effects of the Tax Act. SAB 118 provides a measurement period that should not extend beyond one year from the tax legislation enactment date for companies to complete the accounting under ASC 740. In accordance with SAB 118, a company must reflect the income tax effects of those aspects of the Tax Act for which the accounting under ASC 740 is complete or a reasonable estimate if such accounting is incomplete.
64
In connection with the Company’s initial analysis of the impact of the Tax Act, which reduced the U.S. federal corporate tax rate for future years, the Company re-measured its deferred tax assets and liabilities to the lower enacted tax rate and recorded a provisional net decrease in its deferred tax assets described above, with a corresponding net adjustment to the deferred income tax expense for the year ended December 31, 2017. The liability pursuant to the Company’s tax receivable agreement was also re-measured, which resulted in an estimated reduction of liability of $134,721, which was recorded as a component of other income. See the section in Note 2 regarding the Deferred Tax Asset and Amount Due Pursuant to Tax Receivable Agreement for more detail. The impact of the Tax Act may differ from the estimated amounts recorded due to, among other things, further refinement of the Company’s calculations, changes in interpretations and assumptions the Company has made in conjunction with the release of additional regulatory guidance that may be issued, and actions the Company may take as a result of Tax Act.
As of December 31, 2017, the Company had accumulated net foreign operating loss carryforwards related to its international operations of approximately $29,871 for which it has recorded a deferred tax asset of $7,685. Approximately $26,915 of the operating losses (or $6,725 of the deferred tax asset) has an indefinite life and $2,956 of the operating losses (or $960 of the deferred tax asset) will expire on dates between 2019 and 2026. At December 31, 2017, the Company’s management concluded that a valuation allowance should be established with regard to the tax benefits associated with most foreign net operating losses, as it is more likely than not that these losses will not be fully utilized in future years.
Foreign withholding taxes are not provided for on the undistributed earnings of foreign subsidiaries that are essentially permanent in nature. There were no significant untaxed foreign earnings at December 31, 2017, 2016 and 2015.
Prior to the Company’s reorganization and IPO of Moelis & Company, the Company had been primarily subject to the New York City unincorporated business tax (“UBT”) and certain other foreign, state and local taxes. The Company’s operations are comprised of entities that are organized as limited liability companies and limited partnerships. For U.S. federal income tax purposes, taxes related to income earned by these entities represent obligations of their interest holders, which are primarily made up of individual partners and members and have historically not been reflected in the consolidated statements of financial condition. In connection with the Company’s reorganization and IPO, the Company became subject to U.S. corporate federal, state and local income tax on its allocable share of results of operations from Group LP.
The Company is subject to taxation in certain U.S., state, local, and foreign jurisdictions. As of December 31, 2017, the Company’s tax years for 2016, 2015, and 2014 are generally subject to examination by the tax authorities. As of December 31, 2017, the Company does not expect any material changes in its tax provision related to any outstanding current examinations. Developments with respect to such examinations are monitored on an ongoing basis and adjustments to tax liabilities are made as appropriate.
The Company has no unrecognized tax benefits for the periods ended December 31, 2017, 2016 and 2015.
65
8. NET INCOME (LOSS) PER SHARE ATTRIBUTABLE TO CLASS A COMMON SHAREHOLDERS
The calculations of basic and diluted net income (loss) per share attributable to holders of shares of Class A common stock for the year ended December 31, 2017, 2016 and 2015 are presented below.
|
|
|
|
Year Ended December 31, |
|||||||
|
(dollars in thousands, except per share amounts) |
|
|
2017 |
|
2016 |
|
2015 |
|||
|
Numerator: |
|
|
|
|
|
|
|
|
|
|
|
Net income (loss) attributable to holders of shares of Class A common stock—basic |
|
|
$ |
29,400 |
|
$ |
38,387 |
|
$ |
33,104 |
|
Add (deduct) dilutive effect of: |
|
|
|
|
|
|
|
|
|
|
|
Noncontrolling interests related to Class A partnership units |
|
(a) |
|
|
|
(a) |
|
|
(a) |
|
|
Net income (loss) attributable to holders of shares of Class A common stock—diluted |
|
|
$ |
29,400 |
|
$ |
38,387 |
|
$ |
33,104 |
|
Denominator: |
|
|
|
|
|
|
|
|
|
|
|
Weighted average shares of Class A common stock outstanding—basic |
|
|
|
30,597,058 |
|
|
20,933,757 |
|
|
20,021,652 |
|
Add (deduct) dilutive effect of: |
|
|
|
|
|
|
|
|
|
|
|
Noncontrolling interests related to Class A partnership units |
|
(a) |
|
|
|
(a) |
|
|
(a) |
|
|
Weighted average number of incremental shares issuable from unvested restricted stock, RSUs and stock options, as calculated using the treasury stock method |
|
(b) |
|
7,078,453 |
|
(b) |
3,308,545 |
|
(b) |
1,340,919 |
|
Weighted average shares of Class A common stock outstanding—diluted |
|
|
|
37,675,511 |
|
|
24,242,302 |
|
|
21,362,571 |
|
Net income (loss) per share attributable to holders of shares of Class A common stock |
|
|
|
|
|
|
|
|
|
|
|
Basic |
|
|
$ |
0.96 |
|
$ |
1.83 |
|
$ |
1.65 |
|
Diluted |
|
|
$ |
0.78 |
|
$ |
1.58 |
|
$ |
1.55 |
We have not included the impact of Class B common stock because these shares are entitled to an insignificant amount of economic participation.
|
(a) |
Class A partnership units may be exchanged for Moelis & Company Class A common stock on a one‑for‑one basis, subject to applicable lock‑up, vesting and transfer restrictions. If all Class A partnership units were to be exchanged for Class A common stock, fully diluted Class A common stock outstanding would be 63,647,961 shares for the year ended December 31, 2017, 58,061,255 shares for the year ended December 31, 2016 and 55,481,167 shares for the year ended December 31, 2015. In computing the dilutive effect, if any, that the aforementioned exchange would have on net income (loss) per share, net income (loss) available to holders of Class A common stock would be adjusted due to the elimination of the noncontrolling interests in consolidated entities associated with the Group LP Class A partnership units (including any tax impact). For the year ended December 31, 2017, 2016 and 2015, such exchange is not reflected in diluted net income (loss) per share as the assumed exchange is not dilutive. |
|
(b) |
During the years ended December 31, 2017, 2016 and 2015, certain shares of Moelis & Company’s Class A common stock assumed to be issued pursuant to certain RSUs as calculated using the treasury stock method were antidilutive and therefore have been excluded from the calculation of diluted net income (loss) per share attributable to Moelis & Company. The additional weighted average amount of RSUs that would have been included in this calculation if the effect were dilutive would have been 6,137 units for the year ended December 31, 2017, 16 units for the year ended December 31, 2016 and 1,380 units for the year ended December 31, 2015. |
66
9. EQUITY‑BASED COMPENSATION
Partnership Units
Prior to the Company’s restructuring and IPO, the business operated as a partnership and its ownership structure was comprised of common partners (principally outside investors) holding units. The common partners contributed capital to the partnership and were not subject to vesting. Units granted to Managing Directors upon joining the Company and as part of annual incentive compensation generally vested based on service over five to eight years. Certain non‑Managing Director employees were granted units as part of their incentive arrangements and these units generally vest based on service ratably over four years. In connection with the Company’s restructuring and IPO, substantially all of the Managing Director partner equity subject to vesting had been accelerated. Units granted to non‑Managing Director employees were not accelerated in connection with the Company’s restructuring and IPO and continue to vest based on the original terms of the grant.
In connection with the reorganization and IPO, Group LP issued Class A partnership units to Moelis & Company and to certain existing unit holders. Following the reorganization, a Group LP Class A partnership unit (not held by Moelis & Company or its subsidiaries) is exchangeable into one share of Moelis & Company Class A common stock and represents the Company’s noncontrolling interests. As of December 31, 2017, partners held 22,472,337 Group LP partnership units, 423,439 of which were unvested and will continue to vest over their service life.
In relation to the vesting of units, the Company recognized compensation expenses of $2,137, $3,132 and $3,730 for the years ended December 31, 2017, 2016 and 2015, respectively. As of December 31, 2017, there was $1,373 of unrecognized compensation expense related to unvested Class A partnership units which is expected to be recognized over a weighted‑average period of 0.8 years, using the graded vesting method.
2014 Omnibus Incentive Plan
In connection with the IPO, the Company adopted the Moelis & Company 2014 Omnibus Incentive Plan (the “Plan”) to provide additional incentives to selected officers, employees, Managing Directors, non‑employee directors, independent contractors, partners, senior advisors and consultants. The Plan provides for the issuance of incentive stock options (“ISOs”), nonqualified stock options, stock appreciation rights (“SARs”), restricted stock, RSUs, stock bonuses, other stock‑based awards and cash awards.
In the first quarter of 2015, the Board of Directors authorized the repurchase of up to $25 million of shares of Class A common stock of the Company and/or Class A partnership units of Group LP with no expiration date. Under this share repurchase program, shares may be repurchased from time to time in open market transactions, in privately negotiated transactions or otherwise. The timing and the actual number of shares repurchased will be opportunistic and measured in nature and will depend on a variety of factors, including price and market conditions. As of December 31, 2017, approximately $20 million of shares may yet be purchased under the program.
Restricted Stock and Restricted Stock Units (RSUs)
Pursuant to the Plan and in connection with the Company’s annual compensation process and ongoing hiring process, the Company issues RSUs which generally vest over a service life of four to five years. For the years ended December 31, 2017, 2016 and 2015, the Company recognized expenses of $91,598, $70,303 and $38,295, respectively, in relation to the vesting of RSUs.
67
The following table summarizes activity related to restricted stock and RSUs for the years ended December 31, 2017, 2016 and 2015.
|
|
|
Restricted Stock & RSUs |
|||||||||||||
|
|
|
2017 |
|
2016 |
|
2015 |
|||||||||
|
|
|
|
|
Weighted |
|
|
|
Weighted |
|
|
|
Weighted |
|||
|
|
|
|
|
Average |
|
|
|
Average |
|
|
|
Average |
|||
|
|
|
Number of |
|
Grant Date |
|
Number of |
|
Grant Date |
|
Number of |
|
Grant Date |
|||
|
|
|
Shares |
|
Fair Value |
|
Shares |
|
Fair Value |
|
Shares |
|
Fair Value |
|||
|
Unvested Balance at January 1, |
|
8,504,190 |
|
$ |
26.70 |
|
5,123,481 |
|
$ |
28.67 |
|
2,473,624 |
|
$ |
25.86 |
|
Granted |
|
3,348,651 |
|
|
37.40 |
|
4,197,742 |
|
|
24.11 |
|
2,906,452 |
|
|
31.24 |
|
Forfeited |
|
(87,615) |
|
|
30.59 |
|
(75,159) |
|
|
26.04 |
|
(81,560) |
|
|
28.90 |
|
Vested |
|
(2,407,227) |
|
|
27.10 |
|
(741,874) |
|
|
28.42 |
|
(175,035) |
|
|
29.44 |
|
Unvested Balance at December 31, |
|
9,357,999 |
|
$ |
30.15 |
|
8,504,190 |
|
$ |
26.70 |
|
5,123,481 |
|
$ |
28.67 |
As of December 31, 2017, the total compensation expense related to unvested restricted stock and RSUs not yet recognized was $98,719. The weighted‑average period over which this compensation expense is expected to be recognized at December 31, 2017 is 1.5 years. Beginning in January of 2017, the Company accounts for forfeitures as they occur per the guidance in ASU 2016-09. See Note 2 for further discussion on this change in accounting policy.
Stock Options
Pursuant to the Plan, the Company issued 3,501,881 stock options in 2014 which vest over a five‑year period. The Company estimated the fair value of stock option awards at grant using the Black‑Scholes valuation model with the following assumptions:
|
|
|
Assumptions |
|
|
|
Expected life (in years) |
|
|
6 |
|
|
Weighted-average risk free interest rate |
|
|
1.91 |
% |
|
Expected volatility |
|
|
35 |
% |
|
Dividend yield |
|
|
2.72 |
% |
|
Weighted-average fair value at grant date |
|
$ |
6.70 |
|
The Company paid special dividends of $4.05, in aggregate, through December 31, 2017. As required under Section 5 of the Company’s 2014 Omnibus Incentive Plan, the Compensation Committee of the Company’s Board of Directors equitably reduced the exercise price of the Company’s outstanding options to purchase common stock by $4.05 from $25.00 per share to $20.95 per share.
The following table summarizes activity related to stock options for the year ended December 31, 2017, 2016 and 2015.
|
|
|
Stock Options Outstanding |
|||||||||||||
|
|
|
2017 |
|
2016 |
|
2015 |
|||||||||
|
|
|
|
|
Weighted |
|
|
|
Weighted |
|
|
|
Weighted |
|||
|
|
|
|
|
Average |
|
|
|
Average |
|
|
|
Average |
|||
|
|
|
Number |
|
Exercise Price |
|
Number |
|
Exercise Price |
|
Number |
|
Exercise Price |
|||
|
|
|
Outstanding |
|
Per Share |
|
Outstanding |
|
Per Share |
|
Outstanding |
|
Per Share |
|||
|
Outstanding at January 1, |
|
2,822,728 |
|
$ |
20.95 |
|
3,081,203 |
|
$ |
20.95 |
|
3,296,906 |
|
$ |
20.95 |
|
Grants |
|
— |
|
|
— |
|
— |
|
|
— |
|
— |
|
|
— |
|
Exercises |
|
(279,277) |
|
|
20.95 |
|
— |
|
|
— |
|
(3,500) |
|
|
20.95 |
|
Forfeitures or expirations |
|
(107,219) |
|
|
20.95 |
|
(258,475) |
|
|
20.95 |
|
(212,203) |
|
|
20.95 |
|
Outstanding at December 31, |
|
2,436,232 |
|
$ |
20.95 |
|
2,822,728 |
|
$ |
20.95 |
|
3,081,203 |
|
$ |
20.95 |
For the years ended December 31, 2017, 2016 and 2015, the Company recognized expenses of $2,560, $3,615, and $4,106 respectively, in relation to these stock options. As of December 31, 2017, the total compensation expense related to unvested stock options not yet recognized was $2,974. The weighted-average period over which this
68
compensation expense is expected to be recognized is 1.1 years. Beginning in January of 2017, the Company accounts for forfeitures as they occur per the guidance in ASU 2016-09. See Note 2 for further discussion on this change in accounting policy.
10. STOCKHOLDERS EQUITY
Class A Common Stock
IPO and Reorganization
In April 2014, the Company issued 15,263,653 shares of Class A common stock in connection with the IPO and reorganization.
Follow-on Offerings
Since its IPO, the Company has conducted several offerings of Class A common stock in order to facilitate organized liquidity and increase the public float of its Class A common stock. The details of these offerings are displayed below. The Company did not retain any proceeds from the sale of its Class A common stock.
|
|
|
Total Shares |
|
Total Increase in |
|
Date of Offering |
|
Offered |
|
Shares Outstanding |
|
November, 2014 |
|
6,325,000 |
|
4,511,058 |
|
January, 2017 |
|
5,750,000 |
|
5,356,876 |
|
July, 2017 |
|
6,000,000 |
|
5,680,903 |
|
Total |
|
18,075,000 |
|
15,548,837 |
As of December 31, 2017, 34,163,042 shares of Class A common stock were issued and 33,455,626 shares were outstanding. As of December 31, 2016, 20,948,998 shares of Class A common stock were issued and 20,561,108 shares were outstanding. The increase in shares of Class A common stock was due primarily to the IPO and offering transactions described above.
Class B Common Stock
IPO and Reorganization
In conjunction with Moelis & Company’s IPO of its Class A common stock, the Company issued 36,158,698 shares of Class B common stock. Moelis & Company Partner Holdings LP (“Partner Holdings”) holds all shares of Class B common stock, enabling it initially to exercise majority voting control over the Company. The economic rights of Class B common stock are based on the ratio of the Class B subscription price to the initial public offering price of shares of Class A common stock (.00055 to 1), and the aggregate number of shares of Class B common stock may be converted to Class A common stock. Holders of shares of Class B common stock are entitled to receive dividends of the same type as any dividends payable on outstanding shares of Class A common stock at a ratio of .00055 to 1.
Follow-on Offerings
In connection with the offering in November 2014, Partner Holdings surrendered 2,998,322 shares of Class B common stock and was issued 1,658 shares of Class A common stock at a conversion ratio of .00055 to 1. The Company also purchased 1,509,131 shares of Class B common stock from Partner Holdings for cash of $28 and subsequently cancelled those shares. The Company did not retain any proceeds from the offering.
In connection with the offering in January 2017, the Company purchased 5,356,876 shares of Class B common stock from Partner Holdings for cash of $101 and subsequently cancelled those shares.
In connection with the offering in July 2017, the Company purchased 5,680,903 shares of Class B common stock from Partner Holdings for cash of $128 and subsequently cancelled those shares.
69
As of December 31, 2017 and 2016, 19,912,230 and 31,138,193 shares of Class B common stock were issued and outstanding, respectively, due primarily to the IPO and offering transactions described above.
Treasury Stock
During the years ended December 31, 2017 and 2016, the Company repurchased 319,526 and 124,268 shares, respectively, from its employees for the purpose of settling tax liabilities incurred upon the vesting of RSUs. The result of the repurchases was an increase of $12,258 and $3,314, respectively, in the treasury stock balance on the Company’s consolidated statements of changes in equity as of December 31, 2017 and 2016.
Noncontrolling Interests
A Group LP Class A partnership unit (not held by Moelis & Company or its subsidiaries) is exchangeable into one share of Moelis & Company Class A common stock and represents the Company’s noncontrolling interests (non‑redeemable). As of December 31, 2017 and 2016, partners held 22,472,337 and 33,698,300 Group LP partnership units, respectively, representing a 40% and 62% noncontrolling interest in Moelis & Company, respectively.
Controlling Interests
Moelis & Company operates and controls all of the business and affairs of Group LP and its operating entity subsidiaries indirectly through its equity interest in Group GP, and thus the 33,455,626 shares of Class A common stock outstanding at December 31, 2017 represents the controlling interest.
11. RELATED‑PARTY TRANSACTIONS
Aircraft Lease—On August 30, 2014, a related party, Moelis & Company Manager LLC ("Manager"), acquired an aircraft with funds received solely from its managing member (Mr. Moelis). The aircraft is used and operated by the Company pursuant to a dry lease with Manager which terminates on December 31, 2019. The terms of the dry lease are comparable to the market rates of leasing from an independent third party. Pursuant to this dry lease arrangement, the lessee is obligated to bear its share of the costs of operating the aircraft. For the years ended December 31, 2017, 2016, and 2015, the Company incurred $1,872, $1,248 and $1,248 in aircraft lease costs to be paid to Manager, respectively. In addition, Mr. Moelis is the other lessee of the aircraft and shares the operating and related costs of the plane in proportion to his respective use pursuant to a cost sharing and operating agreement.
Promissory Notes—As of December 31, 2017, there were $552 of unsecured promissory notes from employees held by the Company (December 31, 2016: $922). Any outstanding balances are reflected in other receivables on the consolidated statements of financial condition. The notes held as of December 31, 2017 and 2016 bear a fixed interest rate of 4.00%. During the years ended December 31, 2017, 2016 and 2015, the Company received $781, $0 and $0, respectively, of principal repayments and recognized interest income of $27, $25 and $5, respectively, on such notes, which is included in other income and expenses on the consolidated statements of operations.
Services Agreement—In connection with the Company’s IPO, the Company entered into a services agreement with a related party, Moelis Asset Management LP, whereby the Company provides certain administrative services, technology, and office space to Moelis Asset Management LP for a fee. This fee totaled $1,118, $1,283 and $1,698 for the years ended December 31, 2017, 2016 and 2015, respectively. The amount of the fee is based upon the estimated usage and related expense of all shared services between the Company and Moelis Asset Management LP during the relevant period, and will be assessed periodically by Management as per the terms of the agreement. As of December 31, 2017 and 2016, there were no balances due from Moelis Asset Management LP.
Moelis Australia—As of December 31, 2017 and 2016, the Company had a net balance due from Moelis Australia of $128 and a net balance due to Moelis Australia of $38, respectively, which are reflected in other receivables on the consolidated statements of financial condition. These balances consist of amounts due to or from Moelis Australia for advisory services performed as well as billable expenses incurred by the Company on behalf of Moelis Australia during the period. The relationship between the Company and Moelis Australia is governed by a services agreement.
Other Equity Method Investment—In June of 2014, the Company made an investment of $265 into an entity controlled by a related party, Moelis Asset Management LP. The Company has determined that it should account for this
70
investment as an equity method investment on the consolidated financial statements. For the years ended December 31, 2016 and 2015, income of $1,693 and $4,168 was recorded on this investment, respectively, and the Company received cash distributions from this entity in the amounts of $1,427 and $4,669, respectively. The investment was substantially liquidated during the year ended December 31, 2016.
Revenues—From time to time, the Company enters into advisory transactions with Moelis Asset Management LP and its affiliates. The Company earned revenues associated with such transactions of $1,240, $7,281 and $5,780 for the years ended December 31, 2017, 2016 and 2015, respectively.
12. REGULATORY REQUIREMENTS
Under the SEC Uniform Net Capital Rule (SEC Rule 15c3‑1) Alternative Standard under Section (a)(1)(ii), the minimum net capital requirement is $250. At December 31, 2017, Moelis U.S. had net capital of $29,259, which was $29,009 in excess of its required net capital. At December 31, 2016, Moelis U.S. had net capital of $76,871 which was $76,621 in excess of its required net capital.
Moelis U.S. does not carry customer accounts and does not otherwise hold funds or securities for, or owe money or securities to, customers and accordingly is exempt under Section (k)(2)(ii) of SEC Rule 15c3‑3.
At December 31, 2017, the aggregate regulatory net capital of Moelis UK was $50,498 which exceeded the minimum requirement by $50,439. At December 31, 2016, the aggregate regulatory net capital of Moelis UK was $8,827, which exceeded the minimum requirement by $8,774.
13. COMMITMENTS AND CONTINGENCIES
Bank Line of Credit—In April 2017 the Company renewed its revolving credit facility which extended the maturity date to June 30, 2019. As of December 31, 2017, the commitment amount was $40,000.
Borrowings on the facility bear interest at the greater of a fixed rate of 3.50% per annum or at the borrower’s option of (i) LIBOR plus 1% or (ii) Prime minus 1.50%. As of December 31, 2017 and 2016, the Company had no borrowings under the credit facility.
As of December 31, 2017, the Company’s available credit under this facility was $34,723 as a result of the issuance of an aggregate amount of $5,277 of various standby letters of credit, which were required in connection with certain office lease and other agreements. The Company incurs a 1% per annum fee on the outstanding balance of issued letters of credit.
Leases—The Company maintains operating leases with expiration dates that extend through 2026. The Company incurred expense relating to its operating leases of $15,102, $15,856 and $12,942 for the years ended December 31, 2017, 2016 and 2015, respectively. In addition, during the second quarter of 2016, the Company decided to sublet a portion of its growth space in the U.K. which required a sublease loss reserve to be recognized for the estimated net economics of such sublet. The expense related to the aforementioned sublease loss reserve, which is remeasured at each reporting period, for the years ended December 31, 2017 and 2016 was $213 and $1,741, respectively.
The future minimum rental payments required under the operating leases in place at December 31, 2017 are as follows:
|
Fiscal year ended |
|
Operating Leases |
|
Sublease Income |
|
Net Minimum Payments |
|||
|
2018 |
|
$ |
19,621 |
|
$ |
(414) |
|
$ |
19,207 |
|
2019 |
|
|
19,624 |
|
|
(564) |
|
|
19,060 |
|
2020 |
|
|
12,883 |
|
|
(903) |
|
|
11,980 |
|
2021 |
|
|
7,405 |
|
|
(903) |
|
|
6,502 |
|
2022 |
|
|
6,961 |
|
|
(903) |
|
|
6,058 |
|
Thereafter |
|
|
10,531 |
|
|
(2,258) |
|
|
8,273 |
|
Total |
|
$ |
77,025 |
|
$ |
(5,945) |
|
$ |
71,080 |
71
Contractual Arrangements—In the normal course of business, the Company enters into contracts that contain a variety of representations and warranties and which provide indemnification for specified losses, including certain indemnification of certain officers, directors and employees.
Legal—In the ordinary course of business, from time to time the Company and its affiliates are involved in judicial or regulatory proceedings, arbitration or mediation concerning matters arising in connection with the conduct of its businesses, including contractual and employment matters. In addition, government agencies and self-regulatory organizations conduct periodic examinations and initiate administrative proceedings regarding the Company’s business, including, among other matters, compliance, accounting and operational matters, that can result in censure, fine, the issuance of cease-and-desist orders or the suspension or expulsion of a broker-dealer, investment advisor, or its directors, officers or employees. In view of the inherent difficulty of determining whether any loss in connection with such matters is probable and whether the amount of such loss can be reasonably estimated, particularly in cases where claimants seek substantial or indeterminate damages or where investigations and proceedings are in the early stages, the Company cannot estimate the amount of such loss or range of loss, if any, related to such matters, how or if such matters will be resolved, when they will ultimately be resolved, or what the eventual settlement, fine, penalty or other relief, if any, might be. Subject to the foregoing, the Company believes, based on current knowledge and after consultation with counsel, that it is not currently party to any material pending proceedings, individually or in the aggregate, the resolution of which would have a material effect on the Company.
14. EMPLOYEE BENEFIT PLANS
The Company covers substantially all U.S. salaried employees with a defined contribution 401(k) plan. Each salaried employee of the Company who has attained the age of 21 is eligible to participate in the 401(k) plan on their first day of employment. Any employer contributions to the 401(k) plan are entirely at the discretion of the Company. The Company accrued expenses relating to employer matching contributions to the 401(k) plan for the years ended December 31, 2017, 2016 and 2015, in the amounts of $2,264, $1,971 and $1,779, respectively.
15. BUSINESS INFORMATION
The Company’s activities as an investment banking advisory firm constitute a single business segment offering clients, including corporations, governments and financial sponsors, a range of advisory services with expertise across all major industries in mergers and acquisitions, recapitalizations and restructurings and other corporate finance matters.
We do not allocate our revenue by the type of advice we provide because of the complexity of the transactions on which we may earn revenue and our comprehensive approach to client service. For example, a restructuring engagement may evolve to require a sale of all or a portion of the client, M&A assignments can develop from relationships established on prior restructuring engagements and capital markets expertise can be instrumental on both M&A and restructuring assignments.
There were no clients that accounted for more than 10% of revenues for the years ended December 31, 2017, 2016 and 2015. Since the financial markets are global in nature, the Company generally manages its business based on the operating results of the enterprise taken as whole, not by geographic region. The following table sets forth the geographical distribution of revenues and assets based on the location of the office that generates the revenues or holds the assets, and therefore may not be reflective of the geography in which our clients are located.
|
|
|
Year Ended December 31, |
|||||||
|
|
|
2017 |
|
2016 |
|
2015 |
|||
|
Revenues: |
|
|
|
|
|
|
|
|
|
|
United States |
|
$ |
535,985 |
|
$ |
516,688 |
|
$ |
443,998 |
|
Europe |
|
|
111,088 |
|
|
54,332 |
|
|
88,063 |
|
Rest of World |
|
|
37,542 |
|
|
42,353 |
|
|
19,802 |
|
Total |
|
$ |
684,615 |
|
$ |
613,373 |
|
$ |
551,863 |
72
|
|
|
December 31, |
|
December 31, |
||
|
|
|
2017 |
|
2016 |
||
|
Assets: |
|
|
|
|
|
|
|
United States |
|
$ |
519,933 |
|
$ |
506,748 |
|
Europe |
|
|
83,834 |
|
|
31,341 |
|
Rest of World |
|
|
95,301 |
|
|
60,711 |
|
Total |
|
$ |
699,068 |
|
$ |
598,800 |
16. SUBSEQUENT EVENTS
On February 6, 2018, the Board of Directors of Moelis & Company declared a special dividend of $1.50 per share in addition to a quarterly dividend of $0.47 per share. The $1.97 per share will be paid on March 7, 2018 to Class A common stockholders of record on February 20, 2018.
73
SUPPLEMENTAL FINANCIAL INFORMATION
Consolidated Quarterly Results of Operations (Unaudited)
|
|
|
For the Three Months Ended |
|
||||||||||
|
|
|
March 31, |
|
June 30, |
|
September 30, |
|
December 31, |
|
||||
|
($ in thousands, except per share data) |
|
2017 |
|
2017 |
|
2017 |
|
2017 |
|
||||
|
Revenues |
|
$ |
173,258 |
|
$ |
172,149 |
|
$ |
170,041 |
|
$ |
169,167 |
|
|
Total operating expenses |
|
|
130,224 |
|
|
129,441 |
|
|
130,162 |
|
|
130,506 |
|
|
Operating income (loss) |
|
$ |
43,034 |
|
$ |
42,708 |
|
$ |
39,879 |
|
$ |
38,661 |
|
|
Net income (loss) |
|
$ |
39,379 |
|
$ |
49,524 |
|
$ |
43,271 |
|
$ |
(5,650) |
|
|
|
|
|
|
|
|
|
|
|
|
|
|
|
|
|
Less: net income (loss) attributable to noncontrolling interests |
|
|
24,101 |
|
|
29,794 |
|
|
24,066 |
|
|
19,163 |
|
|
Net income (loss) attributable to Moelis & Company |
|
$ |
15,278 |
|
$ |
19,730 |
|
$ |
19,205 |
|
$ |
(24,813) |
|
|
Net income per share of common stock: |
|
|
|
|
|
|
|
|
|
|
|
|
|
|
Basic |
|
$ |
0.58 |
|
$ |
0.70 |
|
$ |
0.59 |
|
$ |
(0.72) |
|
|
Diluted |
|
$ |
0.46 |
|
$ |
0.57 |
|
$ |
0.48 |
|
$ |
(0.72) |
|
|
Dividends declared per share of common stock |
|
$ |
0.37 |
|
$ |
1.37 |
|
$ |
0.37 |
|
$ |
0.37 |
|
|
|
|
For the Three Months Ended |
|
||||||||||
|
|
|
March 31, |
|
June 30, |
|
September 30, |
|
December 31, |
|
||||
|
($ in thousands, except per share data) |
|
2016 |
|
2016 |
|
2016 |
|
2016 |
|
||||
|
Revenues |
|
$ |
126,364 |
|
$ |
131,725 |
|
$ |
150,676 |
|
$ |
204,608 |
|
|
Total operating expenses |
|
|
97,473 |
|
|
101,166 |
|
|
110,562 |
|
|
143,083 |
|
|
Operating income (loss) |
|
$ |
28,891 |
|
$ |
30,559 |
|
$ |
40,114 |
|
$ |
61,525 |
|
|
Net income (loss) |
|
$ |
25,619 |
|
$ |
26,205 |
|
$ |
35,313 |
|
$ |
54,728 |
|
|
|
|
|
|
|
|
|
|
|
|
|
|
|
|
|
Less: net income (loss) attributable to noncontrolling interests |
|
|
18,649 |
|
|
19,312 |
|
|
25,824 |
|
|
39,693 |
|
|
Net income (loss) attributable to Moelis & Company |
|
$ |
6,970 |
|
$ |
6,893 |
|
$ |
9,489 |
|
$ |
15,035 |
|
|
Net income per share of common stock: |
|
|
|
|
|
|
|
|
|
|
|
|
|
|
Basic |
|
$ |
0.34 |
|
$ |
0.33 |
|
$ |
0.45 |
|
$ |
0.71 |
|
|
Diluted |
|
$ |
0.31 |
|
$ |
0.29 |
|
$ |
0.39 |
|
$ |
0.58 |
|
|
Dividends declared per share of common stock |
|
$ |
1.10 |
|
$ |
0.30 |
|
$ |
0.32 |
|
$ |
1.57 |
|
74
Schedule II—Valuation and Qualifying Accounts
For the Year Ended December 31, 2017
(dollars in thousands)
|
|
|
Allowance for Doubtful |
|
|||||||
|
|
|
Accounts(1) |
|
|||||||
|
|
|
2017 |
|
2016 |
|
2015 |
|
|||
|
Balance at beginning of period |
|
$ |
475 |
|
$ |
1,149 |
|
$ |
1,552 |
|
|
Additions: |
|
|
|
|
|
|
|
|
|
|
|
Bad debt expense |
|
|
2,895 |
|
|
(277) |
|
|
1,213 |
|
|
Deductions: |
|
|
|
|
|
|
|
|
|
|
|
Charge-offs of uncollectible balances |
|
|
(1,937) |
|
|
(397) |
|
|
(1,616) |
|
|
Balance at end of period |
|
$ |
1,433 |
|
$ |
475 |
|
$ |
1,149 |
|
|
(1) |
Includes the allowance for doubtful accounts for both accounts receivable and other receivables. |
75
Item 9. Changes in and Disagreements with Accountants on Accounting and Financial Disclosure
None.
Item 9A. Controls and Procedures
Evaluation of Disclosure Controls and Procedures
Under the supervision and with the participation of our management, including our Chief Executive Officer and Chief Financial Officer, we conducted an evaluation of the effectiveness of the Company’s disclosure controls and procedures (as defined in rule 13a‑15(e) of the Securities Exchange Act of 1934, as amended (the “Exchange Act”)). Based upon this evaluation, our Chief Executive Officer and Chief Financial Officer concluded that our disclosure controls and procedures were effective as of the end of the period covered by this report.
Management’s Report on Internal Control over Financial Reporting
Management assessed the effectiveness of our internal control over financial reporting as of December 31, 2017. In making this assessment, management used the criteria established by the Committee of Sponsoring Organizations of the Treadway Commission (“COSO”) in Internal Control—Integrated Framework (2013). Based on this assessment, management has concluded that, as of December 31, 2017, our internal control over financial reporting was effective, at a reasonable assurance level.
The Company’s independent registered public accounting firm has issued its written attestation report on the Company’s internal control over financial reporting, as included in Part II, Item 8 of this Annual Report on Form 10-K and are incorporated herein by reference.
Changes in Internal Controls
No change in our internal control over financial reporting (as defined in Rule 13a‑15(f) and 15d‑15(f) of the Exchange Act) occurred during the period covered by this report that has materially affected, or is reasonably likely to materially affect, our internal control over financial reporting.
In April 2014, we entered into a Master Services Agreement with Old Holdings, an entity controlled by our Chairman and Chief Executive Officer Kenneth Moelis, and certain of Old Holding’s subsidiaries, which was renewed in 2015, 2016 and 2017 for one year terms. On February 28, 2018, we entered into the fourth renewal of this agreement for a term of one year. The foregoing summary is not complete and is qualified in its entirety by reference to the renewal agreement, which is filed herewith as Exhibit 10.23.
76
Item 10. Directors, Executive Officers and Corporate Governance
The information required by this Item 10 of Form 10‑K will be included in our definitive proxy statement to be filed for our 2018 annual meeting of stockholders (“2018 Proxy Statement”), expected to be held in June 2018, and is incorporated herein by reference. The 2018 Proxy Statement will be filed with the SEC within 120 days after the end of the fiscal year to which this report relates.
Item 11. Executive Compensation
The information required by this Item 11 of Form 10‑K will be included in our 2018 Proxy Statement and is incorporated herein by reference.
Item 12. Security Ownership of Certain Beneficial Owners and Management and Related Stockholder Matters
Other than as set out below, the information required by this Item 12 of Form 10‑K will be included in our 2018 Proxy Statement and is incorporated herein by reference.
Equity Compensation Plan Information
The following table provides information as of December 31, 2017 regarding securities issued under our Moelis & Company 2014 Omnibus Incentive Plan.
|
|
|
|
|
|
|
|
|
|
Number of Shares |
|
|
|
|
|
|
Number of Shares |
|
|
|
|
Remaining Available |
|
|
|
|
|
|
to be Issued |
|
Weighted Average |
|
for Future Issuance |
|
|
|
|
|
|
|
Upon Exercise of |
|
Exercise Price of |
|
Under Equity |
|
|
|
|
|
|
|
Outstanding |
|
Outstanding |
|
Compensation |
|
|
|
|
|
|
|
Options, |
|
Options, |
|
Plan (Excluding |
|
|
|
|
|
|
|
Warrants and |
|
Warrants and |
|
Securities Reflected |
|
|
|
|
|
Plan Category |
|
Rights(2) |
|
Rights |
|
In First Column) |
|
|
|
Equity compensation plans approved by shareholders |
|
2014 Omnibus Incentive Plan |
(1) |
12,811,819 |
|
$ |
20.95 |
|
4,681,784 |
|
|
Equity compensation plans not approved by shareholders |
|
None |
|
— |
|
|
— |
|
— |
|
|
Total |
|
|
|
12,811,819 |
|
$ |
20.95 |
|
4,681,784 |
|
|
(1) |
Our 2014 Omnibus Incentive Plan was approved by our security holders in April 2014. See “Note 9—Equity Based Compensation” of the consolidated financial statements for a description of our Omnibus Incentive Plan. |
|
(2) |
Excludes 22,472,337 Group LP Partnership Units. |
|
(3) |
The number of shares of Class A common stock available for issuance under the 2014 Omnibus Incentive Plan is adjusted on the first day of each fiscal year by a formula, which generally provides the shares available for issuance to be equal to 15% of the outstanding Class A common stock of the Company at that time. |
Item 13. Certain Relationship and Related Transactions, and Director Independence
The information required by this Item 13 of Form 10‑K will be included in our 2018 Proxy Statement and is incorporated herein by reference.
Item 14. Principal Accounting Fees and Services
The information required by this Item 14 of Form 10‑K will be included in our 2018 Proxy Statement and is incorporated herein by reference.
77
Item 15. Exhibits and Financial Statement Schedules
|
1. |
Financial Statements |
The consolidated financial statements required to be filed in the Form 10‑K are listed in Part II, Item 8 hereof.
|
2. |
Financial Data Schedules |
See “Index to Consolidated Financial Statements” in this Form 10‑K listed in Part II, Item 8 hereof.
|
3. |
Exhibits |
The agreements and other documents filed as exhibits to this report are not intended to provide factual information or other disclosure other than with respect to the terms of the agreements or other documents themselves, and you should not rely on them for that purpose. In particular, any representations and warranties made by us in these agreements or other documents were made solely within the specific context of the relevant agreement or document and may not describe the actual state of affairs as of the date they were made or at any other time.
EXHIBIT INDEX
|
Exhibit Number |
|
Description |
| 3.1 |
|
|
|
|
|
|
| 3.2 |
|
|
|
|
|
|
| 10.1 |
|
|
|
|
|
|
| 10.2 |
|
|
|
|
|
|
| 10.3 |
|
|
|
|
|
|
| 10.4 |
|
|
|
|
|
|
| 10.5 |
|
|
|
|
|
|
| 10.6 |
|
|
|
|
|
|
| 10.7 |
|
78
|
Exhibit Number |
|
Description |
|
|
|
|
| 10.8 |
|
|
|
|
|
|
| 10.9 |
|
|
|
|
|
|
| 10.10 |
|
|
|
|
|
|
| 10.11 |
|
|
|
|
|
|
| 10.12 |
|
|
|
|
|
|
| 10.13 |
|
|
|
|
|
|
| 10.14 |
|
|
|
|
|
|
| 10.15 |
|
|
|
|
|
|
| 10.16 |
|
|
|
|
|
|
| 10.17 |
|
|
|
|
|
|
| 10.18 |
|
|
|
|
|
|
| 10.19 |
|
|
|
|
|
|
79
|
Exhibit Number |
|
Description |
| 10.20 |
|
|
|
|
|
|
| 10.21 |
|
|
|
|
|
|
| 10.22 |
|
|
|
|
|
|
| 21.1 |
|
|
|
|
|
|
| 23.1 |
|
|
|
|
|
|
| 24.1 |
|
Power of Attorney (included on signature page hereto) |
|
|
|
|
| 31.1 |
|
|
|
|
|
|
| 31.2 |
|
|
|
|
|
|
|
32.1* |
|
|
|
|
|
|
|
32.2* |
|
|
|
|
|
|
|
101.INS |
|
XBRL Instance Document |
|
|
|
|
|
101.SCH |
|
XBRL Taxonomy Extension Schema |
|
|
|
|
|
101.CAL |
|
XBRL Taxonomy Extension Calculation Linkbase |
|
|
|
|
|
101.LAB |
|
XBRL Taxonomy Extension Label Linkbase |
|
|
|
|
|
101.PRE |
|
XBRL Taxonomy Extension Presentation Linkbase |
|
|
|
|
|
101.DEF |
|
XBRL Taxonomy Extension Definition Linkbase |
* Document has been furnished, is not deemed filed and is not to be incorporated by reference into any of the Registrant’s filings under the Securities Act of 1933, as amended, or the Securities Exchange Act of 1934 irrespective of any general incorporation language contained in any such filing.
** Management contract or compensatory plan
80
Pursuant to the requirements of Section 13 or 15(d) the Securities Exchange Act of 1934, the registrant has duly caused this report to be signed on its behalf by the undersigned thereunto duly authorized this 28th day of February, 2018.
|
|
Moelis & Company |
||
|
|
|
|
|
|
|
By: |
/s/ Kenneth Moelis |
|
|
|
|
Name: |
Kenneth Moelis |
|
|
|
Title: |
Chairman and Chief Executive Officer |
KNOW ALL MEN BY THESE PRESENTS, that each person whose signature appears below constitutes and appoints Kenneth Moelis, Elizabeth Crain, Joseph Simon and Osamu Watanabe, and each of them, his true and lawful attorneys‑in‑fact and agents, with full power to act separately and full power of substitution and resubstitution, for him and in his name, place and stead, in any and all capacities, to sign any and all amendments (including post‑effective amendments) to this Annual Report on Form 10‑K and all amendments thereto the Securities Exchange Act of 1934, as amended, and to file the same, with all exhibits thereto, and all other documents in connection therewith, with the SEC, granting unto each said attorney‑in‑fact and agent full power and authority to do and perform each and every act in person, hereby ratifying and confirming all that said attorneys‑in‑fact and agents or either of them or his or their substitute or substitutes may lawfully do or cause to be done by virtue hereof.
Pursuant to the requirements of Section 13 or 15(d) of the Securities Exchange Act of 1934, as amended, this Report has been signed by the following persons in the capacities and on the dates indicated.
|
Signature |
|
Title |
|
Date |
|
|
|
|
|
|
|
/s/ KENNETH MOELIS |
|
Chairman and Chief Executive Officer (Principal Executive Officer) |
|
February 28, 2018 |
|
Kenneth Moelis |
|
|
||
|
|
|
|
|
|
|
/s/ JOSEPH SIMON |
|
Chief Financial Officer (Principal Financial Officer) |
|
February 28, 2018 |
|
Joseph Simon |
|
|
||
|
|
|
|
|
|
|
/s/ CHRIS CALLESANO |
|
Principal Accounting Officer |
|
February 28, 2018 |
|
Chris Callesano |
|
|
||
|
|
|
|
|
|
|
/s/ NAVID MAHMOODZADEGAN |
|
Director |
|
February 28, 2018 |
|
Navid Mahmoodzadegan |
|
|
||
|
|
|
|
|
|
|
/s/ JEFFREY RAICH |
|
Director |
|
February 28, 2018 |
|
Jeffrey Raich |
|
|
||
|
|
|
|
|
|
|
/s/ ERIC CANTOR |
|
Vice Chairman and Director |
|
February 28, 2018 |
|
Eric Cantor |
|
|
||
|
|
|
|
|
|
|
/s/ J. RICHARD LEAMAN III |
|
Director |
|
February 28, 2018 |
|
J. Richard Leaman III |
|
|
||
|
|
|
|
|
|
|
/s/ JOHN A. ALLISON |
|
Director |
|
February 28, 2018 |
|
John A. Allison |
|
|
||
|
|
|
|
|
|
|
/s/ YVONNE GREENSTREET |
|
Director |
|
February 28, 2018 |
|
Yvonne Greenstreet |
|
|
||
|
|
|
|
|
|
|
/s/ KENNETH L. SHROPSHIRE |
|
Director |
|
February 28, 2018 |
|
Kenneth L. Shropshire |
|
|
81