Attached files
| file | filename |
|---|---|
| 8-K - 8-K - SEARS HOMETOWN & OUTLET STORES, INC. | sho8k5282014.htm |
| EX-1.1 - EXHIBIT - SEARS HOMETOWN & OUTLET STORES, INC. | announcementofearningsrele.htm |

Annual Meeting of Stockholders May 28, 2014 W. Bruce Johnson – CEO and President

2 Forward-Looking Statements Certain statements made in this presentation contain forward-looking statements. Forward-looking statements are subject to risks and uncertainties that may cause our actual results, performance or achievements to be materially different from any future results, performance or achievements expressed or implied by these forward-looking statements. Forward- looking statements include without limitation information concerning our future financial performance, business strategy, plans, goals and objectives. Statements preceded or followed by, or that otherwise include, the words “believes,” “expects,” “anticipates,” “intends,” “project,” “estimates,” “plans,” “forecast,” “is likely to” and similar expressions or future or conditional verbs such as “will,” “may,” “would,” “should” and “could” are generally forward-looking in nature and not historical facts. Such statements are based upon the current beliefs and expectations of our management and are subject to significant risks and uncertainties. Actual results may differ materially from those set forth in the forward-looking statements. The following factors, among others, could cause our actual results, performance, and achievements to differ from those described in the forward-looking statements: our continued reliance on Sears Holdings Corporation (“Sears Holdings”) for most products and services that are important to the successful operation of our business; our potential need to depend on Sears Holdings beyond the expiration or earlier termination by Sears Holdings of certain of our agreements with Sears Holdings; the possible material adverse effects on us if Sears Holdings’ financial condition were perceived to significantly deteriorate, including if as a consequence Sears Holdings were to choose to seek the protection of the U.S. bankruptcy laws; the willingness and ability of Sears Holdings to meet their contractual obligations to us; our ability to offer merchandise and services that our customers want, including those under the Kenmore, Craftsman, and DieHard brands (which brands are owned by subsidiaries of Sears Holdings); the sale by Sears Holdings and its subsidiaries to other retailers that compete with us of major home appliances and other products branded with the Kenmore, Craftsman, or DieHard brands; our ability to successfully manage our inventory levels and implement initiatives to improve inventory management and other capabilities; competitive conditions in the retail industry; worldwide economic conditions and business uncertainty, the availability of consumer and commercial credit, changes in consumer confidence, tastes, preferences and spending, and changes in vendor relationships; the fact that our past performance generally, as reflected on our historical financial statements, may not be indicative of our future performance as a result of, among other things, the consolidation of Hometown and Outlet into a single business entity, our separation from Sears Holdings (the “Separation”), (Continued on Next Slide)
3 Forward-Looking Statements—Continued operating as a standalone business entity, and the impact of increased costs due to a decrease in our purchasing power following the Separation and other losses of benefits associated with being wholly owned by Sears Holdings and its subsidiaries prior to the Separation; our agreements related to the Separation and our continuing relationship with Sears Holdings were negotiated while we were a subsidiary of Sears Holdings and we may have received different terms from unaffiliated third parties (including with respect to merchandise-vendor and service-provider indemnification and defense for negligence claims and claims arising out of failure to comply with contractual obligations); our reliance on Sears Holdings to provide computer systems to process transactions with our customers (including the point-of-sale system for the stores we operate and the stores that our independent dealers and franchisees operate, which point-of-sale system captures, among other things, credit-card information supplied by our customers) and others, quantify our results of operations, and manage our business (“Our SHC-Supplied Systems"); Our SHC-Supplied Systems may be subject to disruptions and data/security breaches for which Sears Holdings may be unwilling or unable to indemnify and defend us against third-party claims and other losses resulting from such disruptions and data/security breaches, which could have one or more material adverse effects on us; limitations and restrictions in our Credit Agreement and related agreements governing our indebtedness and our ability to service our indebtedness; our ability to obtain additional financing on acceptable terms; our dependence on independent dealers and independent franchisees to operate their stores profitably and in a manner consistent with our concepts and standards; our dependence on sources outside the U.S. for significant amounts of our merchandise inventories; impairment charges for goodwill or fixed-asset impairment for long-lived assets; our ability to attract, motivate and retain key executives and other employees; the impact of increased costs associated with being a public company; our ability to maintain effective internal controls as a public company; our ability to realize the benefits that we expect to achieve from the Separation; low trading volume of our common stock due to limited liquidity or a lack of analyst coverage; and the impact on our common stock and our overall performance as a result of our principal stockholders' ability to exert control over us. The foregoing factors are not exhaustive and should be read in conjunction with the other cautionary statements, including the "Risk Factors," that are included in our Annual Report on Form 10-K and in our other filings with the Securities and Exchange Commission and our other public announcements. If one or more of these or other risks or uncertainties materialize, or if our underlying assumptions prove to be incorrect, actual results may vary materially from what we projected. The forward-looking statements included in this presentation are made only as of its date. We undertake no obligation to publicly update or review any forward-looking statement made by us or on our behalf.
4 2013 Performance Business Strategy Q&A Topics

5 2013 Performance Significant ($17M) public/independent company costs vs. 2012. Cold, late spring and delayed fall lawn & garden season. Disappointing sales/margin performance. Values in $'Ms 2012 2013 Net Sales $2,454 $2,422 Cost of Sales & Occupancy $1,840 $1,843 Gross Margin $613 $578 Margin rate 25.0% 23.9% Selling and Administration $504 $507 Depreciation $9 $12 Gain on the sale of assets $0 ($2) Operating Income $100 $61 Net Income $60 $36 Adjusted EBITDA $110 $72 Fiscal Year

6 2013 Performance We have completed staffing and other fully cycled public company cost increases following the separation from SHC. Public/Separate Company Cost Increase by Quarter: (1) Began operating as a separate company in Oct’12 with roughly two weeks as a separate company in Q3’12. Values in $'Ms 2012 2013 Q3 (1) Q4 FY Q1 Q2 Q3 Q4 FY Adjusted EBITDA 16.4 19.9 109.8 27.1 17.5 13.8 13.1 71.5 Standalone operating costs (0.9) (4.1) (5.0) (5.7) (6.4) (5.0) 0.0 (17.1) Change in the treatment of warranty costs 2.3 1.5 3.8 0.0 0.0 0.0 0.0 0.0 Warranty reserve adjustments (2.1) 0.0 (2.1) 0.0 0.0 0.0 0.0 0.0 Impact of 53rd week 0.0 3.1 3.1 0.0 0.0 0.0 0.0 0.0 Store Closing true-up 0.0 0.0 3.7 0.0 0.0 0.0 0.0 0.0 Total Adjustments (0.7) 0.6 3.6 (5.7) (6.4) (5.0) 0.0 (17.1) Adjusted EBITDA including MD&A items 17.0 19.4 106.2 32.8 23.9 18.8 13.1 88.6
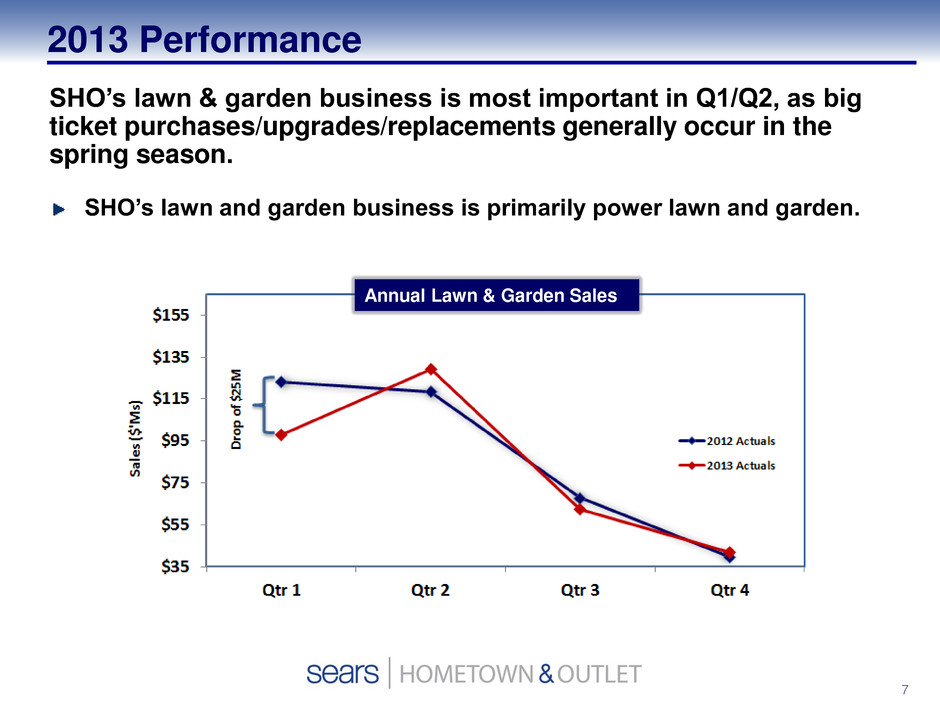
7 2013 Performance SHO’s lawn & garden business is most important in Q1/Q2, as big ticket purchases/upgrades/replacements generally occur in the spring season. SHO’s lawn and garden business is primarily power lawn and garden. Annual Lawn & Garden Sales
8 2013 Performance Disappointing Sales and Margin Performance Outlet Lower margins resulting from low inventory of “As-Is” appliances. Reduced flow of As-Is product from SHC. Expanding store base which increased inventory needs. Holiday promotional investments did not drive expected sales increase. Hometown Highly competitive retail appliance landscape with increased focus from home improvement retailers and retailers that historically focused on consumer electronics. Reduced benefit from SHC marketing and promotions, particularly as regards the appliance category and the Kenmore and Craftsman brands. Heavy year of product transitions drove additional markdowns.

9 Our Strategies Remain Consistent: Expand our store base. Leverage key brands. Optimize merchandise assortments. Grow dealer and franchise models. Increase multi-channel sales.

10 Expand Our Store Base Since 2011, SHO’s store portfolio has been affected by: Orchard Supply Hardware openings in 2011 and closings in 2012 & 2013. Store restructuring announced in late 2011. Annual Store Count
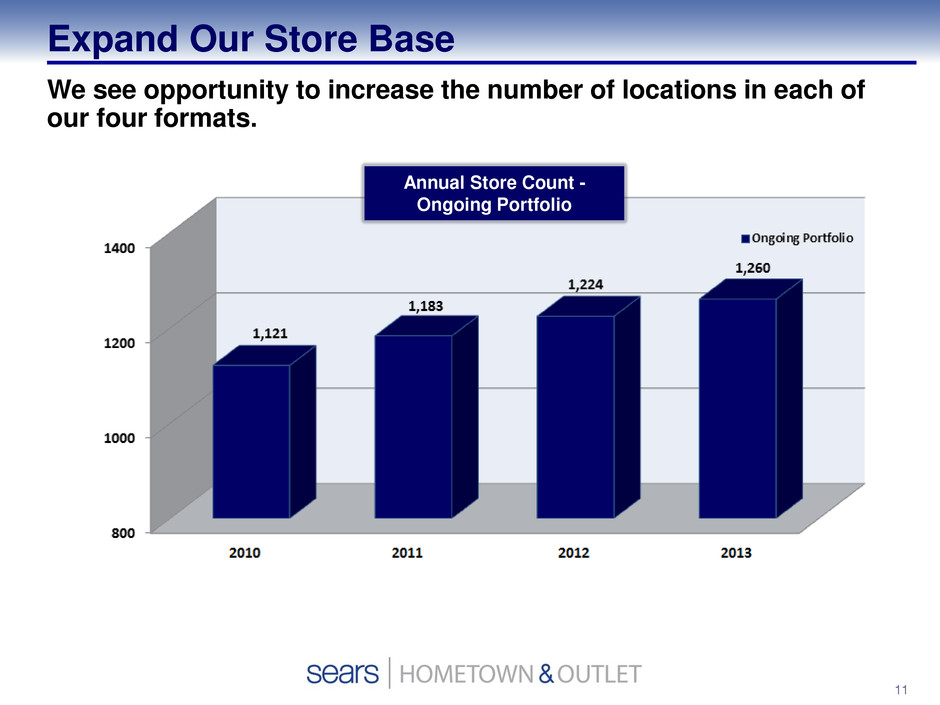
11 Expand Our Store Base We see opportunity to increase the number of locations in each of our four formats. Annual Store Count - Ongoing Portfolio
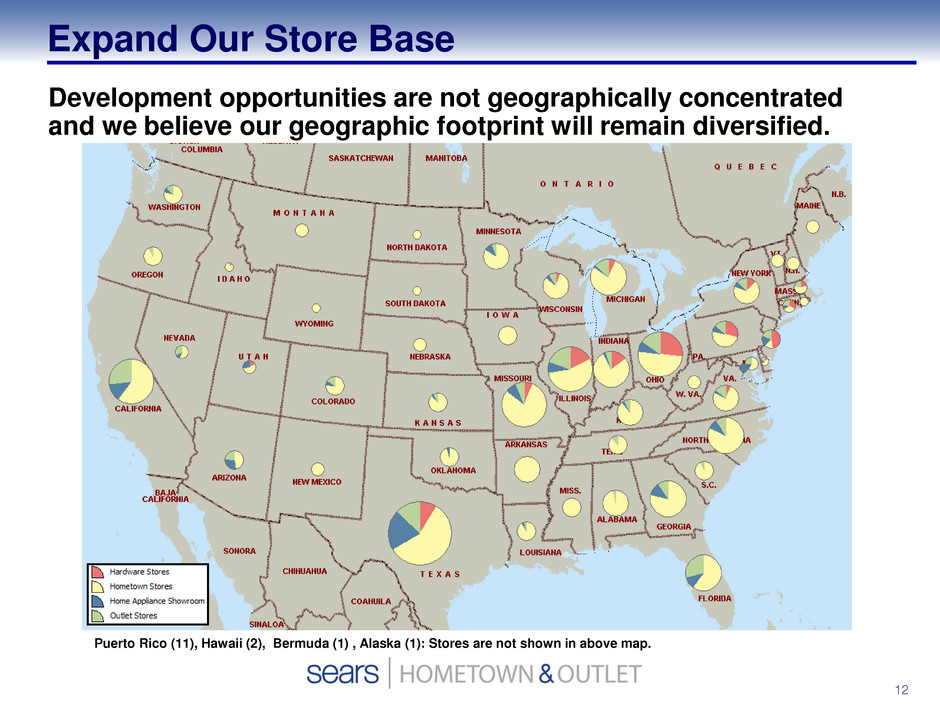
12 Development opportunities are not geographically concentrated and we believe our geographic footprint will remain diversified. Puerto Rico (11), Hawaii (2), Bermuda (1) , Alaska (1): Stores are not shown in above map. Expand Our Store Base

13 Leverage Key Brands Home Appliances Other Hardline Categories Kenmore and Craftsman are Sears Holdings brands with limited distribution outside SHC/SHO stores. SHO offers a full range of the top appliance brands. Managing brand-mix to optimize growth/profitability. SHC Brands Non-SHC Brands Percent of Sales* *In home appliances and other major hard-lines (Tools and Lawn & Garden) categories for fiscal year 2013 ** Appliance floor-space in Hometown segment 56% 44% Appliance** Floor-space 58% in ’12 ; 54% in ’13 ; 48% in ’14 42% in ’12 ; 46% in ’13 ; 52% in ’14

14 • De-emphasized consumer electronics. – Exited 772 stores. – Retained in selected Outlet (26) and Hometown stores (117). • Expanded mattresses and tools. – Primarily in Hometown and Hardware. • Expanded built-in cooking. – Primarily in Hometown and Home Appliance Showrooms. 2012 - Early 2013 Optimize Merchandise Assortments Emphasize merchandise that leverages big ticket selling skills and distribution capabilities. Expansion/introduction of higher margin products. Expand Outlet sourcing to supply inventory for store growth, offset reductions in product from SHC and diversify sourcing.

15 Optimize Merchandise Assortments • Introduction of furniture broadly into Outlet stores. – A limited number of items in most stores for 2013 holiday season. – Expanding assortment in 2014. • Increase inventory and improve assortment of apparel. – Expanded sourcing. • Craftsman Pro launch. – Lawn tractor tailored to SHO customer needs. – Primarily available from SHO. • Increase inventory and sales mix of “As-Is” appliances. – Expanded sourcing. Late 2013 - 2014

16 Optimize Merchandise Assortments Outlet appliance inventory has three primary types: • As-Is: Highest margin product. Typically went to a consumer’s house, was returned, and manufacturer needs an outlet for it. • D&O: Discontinued or obsolete inventory for which manufacturer needs an outlet. • New: New products where we have gaps in As-Is and D&O product. As-Is or Out-of-box New/D&O or In-Box

17 Optimize Merchandise Assortments In 2013 SHO created a “reverse flow network” that efficiently manages the movement of outlet appliance product and leverages SHO’s nationwide network of facilities for testing, repair and distribution. By reducing the number of legs of freight involved, SHO reduces the manufacturer’s cost of getting “out-of-box” product to SHO facilities. This is a win-win proposition that motivates manufacturers to send more of their out-of-box products to SHO. By Q4 2013 we began to see an increased flow of out-of-box product to SHO.

18 Grow Dealer and Franchise Models Outlet Stores Hometown Segment We continue to franchise additional stores.

19 Grow Dealer and Franchise Models Most Hometown Dealer stores are run by a single-store owner operator. Percent of Hometown stores operated by single-unit and multi-unit operators.
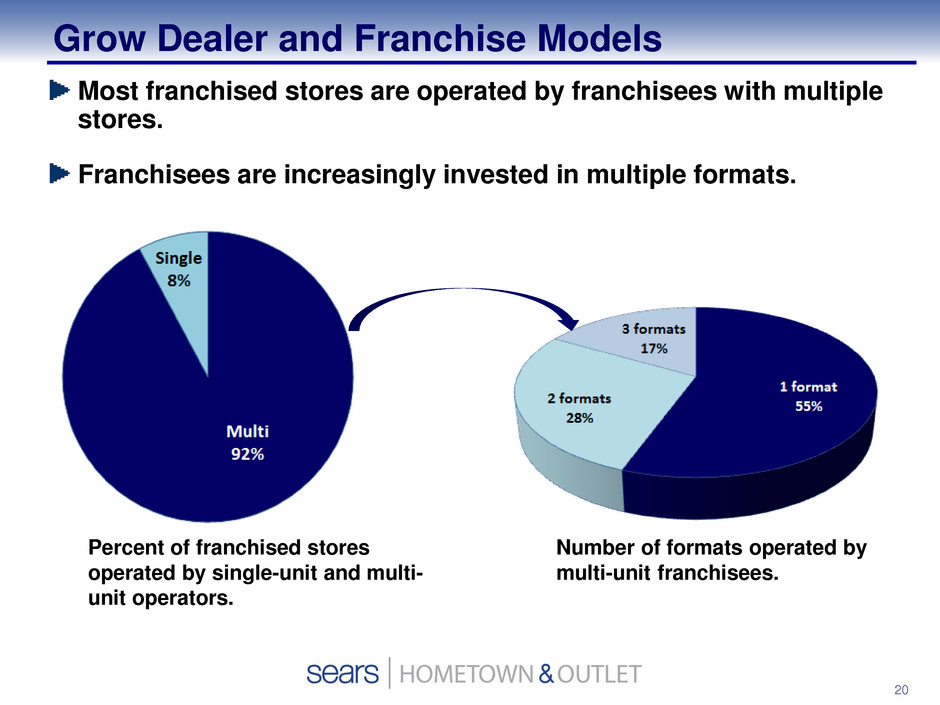
20 Grow Dealer and Franchise Models Percent of franchised stores operated by single-unit and multi- unit operators. Number of formats operated by multi-unit franchisees. Most franchised stores are operated by franchisees with multiple stores. Franchisees are increasingly invested in multiple formats.

21 Grow Dealer and Franchise Models Entrepreneur magazine’s 35th Annual Franchise 500® list placing at No. 161. Entrepreneur magazine’s Top New Franchises list debuting at No. 4. Entrepreneur magazine’s 2014 Fastest- Growing Franchise Rankings placing at No. 81. SHO is growing quickly as a franchise brand:

22 Grow Dealer and Franchise Models SHO has been investing to strengthen and expand its dealer and franchisee operating capabilities. SHO continues to invest in locating and recruiting new franchisees and dealers. • Online staff recruitment tool to improve staff quality and reduce the amount of time positions are open. • Selling skills training and certification with incentives and recognition for enhanced selling skills and success. • Product knowledge seminar and training. • In-store onboard training. Recent and Ongoing Dealer/Franchisee Investments • Online tools. • Franchisee websites. • SHO franchisee website. • Contact with chambers of commerce in markets where we have/desire stores. Primary Dealer/Franchisee Recruitment Methods

23 Increase Multi-Channel Sales Web-to-Store: Customer orders merchandise from home using website and picks-up in a physical store location. Store-to-Home: Customer orders from kiosk in a physical store location with product shipped to customer’s home. Multi-channel revenue was $167M in 2013, +11% vs. 2012. Searsoutlet.com and sears.com are used by SHO consumers who desire merchandise not available in store. +60% Searsoutlet.com Annual sales ($’Ms) +54% Hometown e-Commerce Annual sales ($’Ms)

Appendix

25 Reconciliation of Adjusted EBITDA to Net Income Values in $'Ms 2013 2012 Net Income $ 35.6 $ 60.1 Income Tax Expense 24.3 39.9 Other Income (1.9) (1.4) Interest Expense 3.1 0.9 Operating Income 61.1 99.5 Depreciation 12.0 9.5 Store Closing Charges and Severence Costs - 0.8 Gain on the sale of assets (1.6) - Adjusted EBITDA $ 71.5 $ 109.8 Fiscal Year
