Attached files
| file | filename |
|---|---|
| 8-K - 8-K - ALLERGAN INC | d732921d8k.htm |
| EX-99.1 - EX-99.1 - ALLERGAN INC | d732921dex991.htm |
| Exhibit 99.2
|
May 27, 2014 Certain Potential Business Risks And Issues With Valeant Pharmaceuticals International, Inc.
|
|
Important Information
Information contained in this presentation regarding Valeant Pharmaceuticals International, Inc. (“Valeant”) is taken directly from the information publicly disclosed by Valeant and we do not make any representations or warranties, either express or implied, with respect to such information’s accuracy or completeness. In addition, certain other information contained in this presentation is based on publicly available sources as of the date of this presentation, and while we have no reason to believe that such information is not accurate, we can provide no such assurances with respect thereto. IMS data used in this presentation has been purchased from IMS Health, a provider of healthcare information. The information in this presentation represents the opinions of Allergan and Investors and stockholders should make their own independent investigations of the matters referenced in this presentation and draw their own conclusions.
| 2 |
|
|
|
Introduction
As Allergan’s Board of Directors stated on May 12, 2014, the Valeant/Pershing Square unsolicited proposal of April 22, 2014 substantially undervalues Allergan - regardless of the consideration mix
Over the course of the past several weeks since the Valeant/Pershing Square proposal, we have met with many of our stockholders and stock analysts
During those conversations, many stockholders and stock analysts expressed serious concerns about the sustainability of Valeant’s business model. Some of the key themes included:
Valeant’s low organic sales growth (driven mostly by price increases)
Sustainability of acquisitions strategy
Low R&D investment and the impact on future growth
Market share erosion due to lack of sales and marketing infrastructure and investment
Lack of transparency in financial reporting and sustainability of tax structure
Given that the Valeant unsolicited proposal includes a substantial amount of Valeant stock in exchange for acquiring Allergan, this is a serious concern for Allergan stockholders
In order to respond to concerns expressed by some of our stockholders, Allergan engaged two independent, third party consultants and forensic accountants to conduct an initial review of Valeant based on publicly available information
Alvarez & Marsal and FTI Consulting have reviewed this analysis and confirmed key components presented herein
3
|
|
Key Questions About Valeant That All Of Allergan’s Stockholders Should Consider
What is Valeant’s real organic growth?
How have the two largest Valeant acquisitions (Bausch & Lomb and Medicis) performed under Valeant’s ownership? How have other acquisitions performed?
Does Valeant have any experience promoting products of Allergan’s scale?
How stable is Valeant’s management team?
Can Valeant cut $2.7bn of Allergan’s expenses without disrupting the performance of the business?
What is the relative distribution strength of Allergan vs. Valeant in prescription ophthalmology in significant emerging markets (BRIC)?
Is Valeant’s stated tax rate achievable and sustainable?
Are Valeant’s accounting practices consistent with others in the industry?
Is a business model centered on a serial acquisition and cost cutting strategy sustainable?
What do Allergan’s stockholders “gain” by merging with Valeant?
4
|
|
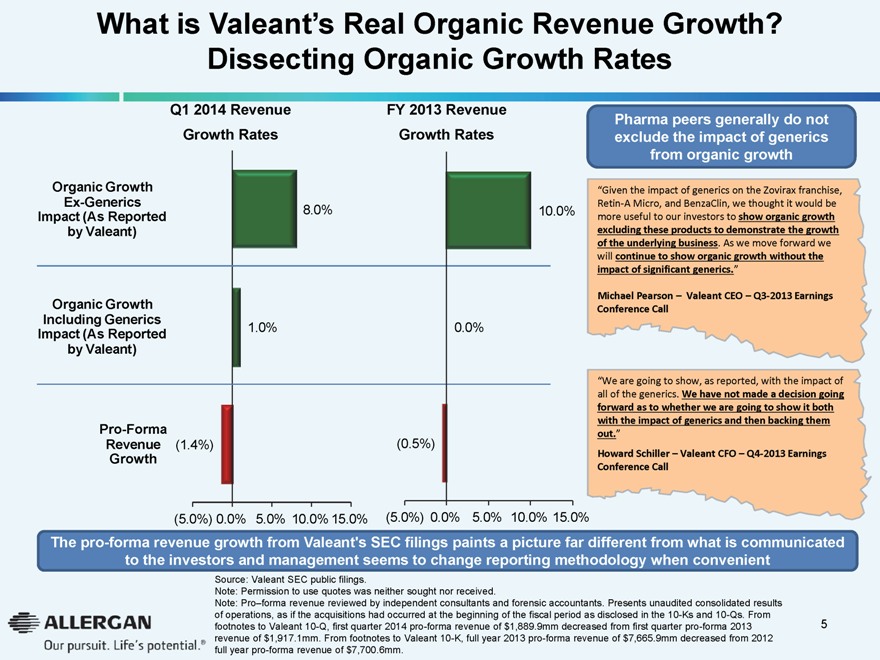
What is Valeant’s Real Organic Revenue Growth Dissecting Organic Growth Rates
Q1 2014 Revenue FY 2013 Revenue Growth Rates Growth Rates
Organic Growth Ex-Generics
8.0% 10.0%
Impact (As Reported by Valeant)
Organic Growth Including Generics
1.0% 0.0%
Impact (As Reported by Valeant)
Pro-Forma
Revenue (1.4%) (0.5%)
Growth
(5.0%) 0.0% 5.0% 10.0% 15.0% (5.0%) 0.0% 5.0% 10.0% 15.0%
Pharma peers generally do not exclude the impact of generics from organic growth
“Given the impact of generics on the Zovirax franchise, Retin-A Micro, and BenzaClin, we thought it would be
more useful to our investors to show organic growth excluding these products to demonstrate the growth of the underlying business.
As we move forward we will continue to show organic growth without the impact of significant generics.”
Michael Pearson – Valeant CEO – Q3-2013 Earnings Conference Call
“We are going to show, as reported, with the impact of all of the generics. We have not made a decision going
forward as to whether we are going to show it both with the impact of generics and then backing them out.”
Howard Schiller – Valeant CFO – Q4-2013 Earnings Conference Call
The pro-forma revenue growth from Valeant’s SEC filings paints a picture far different from what is communicated to the investors and management seems to change reporting methodology when convenient
Source: Valeant SEC public filings.
Note: Permission to use quotes was neither sought nor received.
Note: Pro–forma revenue reviewed by independent consultants and forensic accountants. Presents unaudited consolidated results of operations, as if the acquisitions had occurred at the beginning of the fiscal period as disclosed in the 10-Ks and 10-Qs. From footnotes to Valeant 10-Q, first quarter 2014 pro-forma revenue of $1,889.9mm decreased from first quarter pro-forma 2013 revenue of $1,917.1mm. From footnotes to Valeant 10-K, full year 2013 pro-forma revenue of $7,665.9mm decreased from 2012 full year pro-forma revenue of $7,700.6mm.
5
|
|
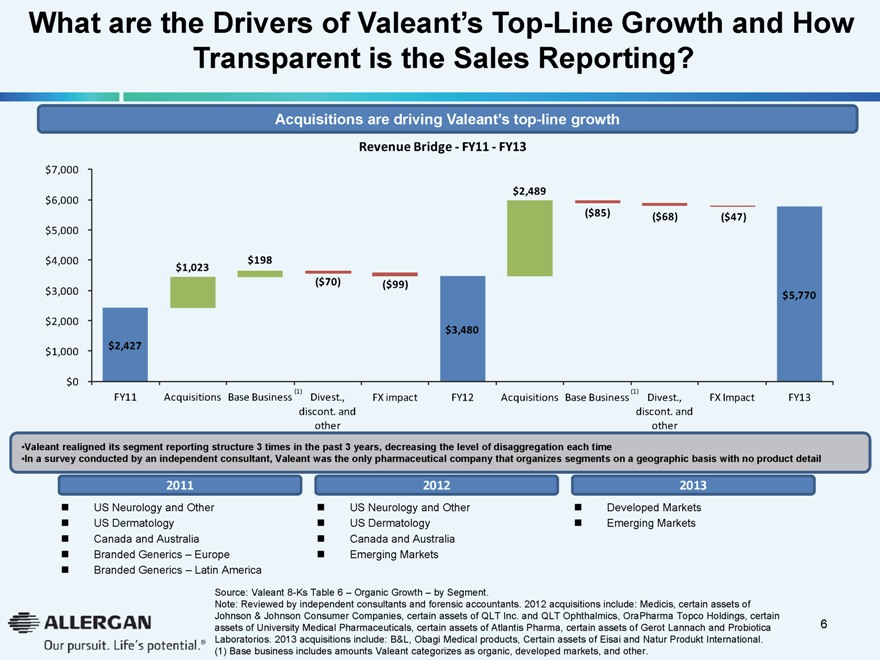
What are the Drivers of Valeant’s Top-Line Growth and How Transparent is the Sales Reporting?
Acquisitions are driving Valeant’s top-line growth
Revenue Bridge - FY11 - FY13
$7,000
$6,000 $2,489
($85) ($68) ($47) $5,000
$4,000 $198 $1,023
($70) ($99) $3,000 $5,770
$2,000 $3,480 $2,427 $1,000
$0
(1) (1)
FY11 Acquisitions Base Business Divest., FX impact FY12 Acquisitions Base Business Divest., FX Impact FY13 discont. and discont. and other other
Valeant realigned its segment reporting structure 3 times in the past 3 years, decreasing the level of disaggregation each time
In a survey conducted by an independent consultant, Valeant was the only pharmaceutical company that organizes segments on a geographic basis with no product detail
2011 2012 2013
US Neurology and OtherUS Neurology and OtherDeveloped Markets US Dermatology US Dermatology Emerging Markets Canada and Australia Canada and Australia Branded Generics – Europe Emerging Markets Branded Generics – Latin America
Source: Valeant 8-Ks Table 6 – Organic Growth – by Segment.
Note: Reviewed by independent consultants and forensic accountants. 2012 acquisitions include: Medicis, certain assets of Johnson & Johnson Consumer Companies, certain assets of QLT Inc. and QLT Ophthalmics, OraPharma Topco Holdings, certain assets of University Medical Pharmaceuticals, certain assets of Atlantis Pharma, certain assets of Gerot Lannach and Probiotica Laboratorios. 2013 acquisitions include: B&L, Obagi Medical products, Certain assets of Eisai and Natur Produkt International.
(1) Base business includes amounts Valeant categorizes as organic, developed markets, and other.
6
|
|
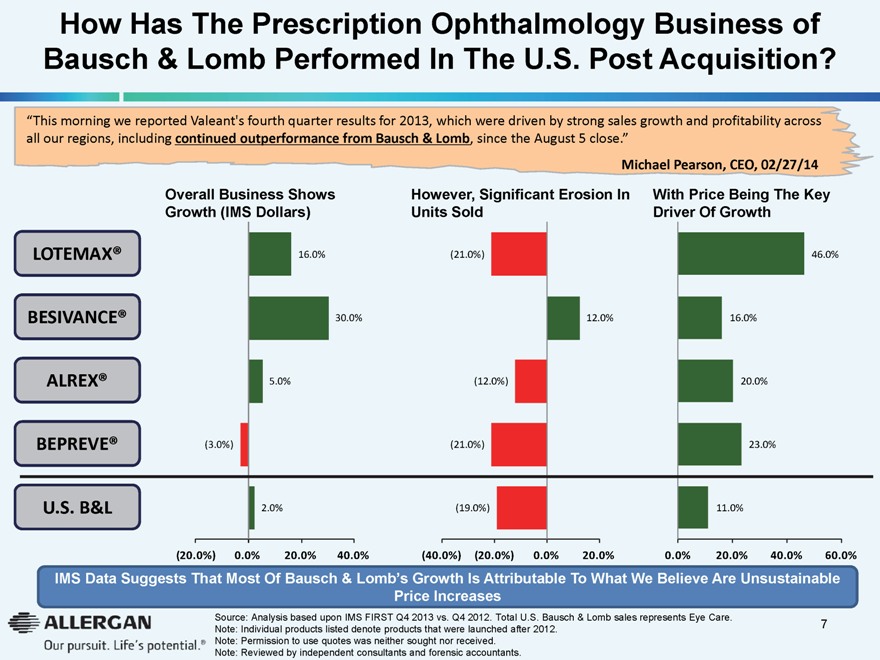
How Has The Prescription Ophthalmology Business of Bausch & Lomb Performed In The U.S. Post Acquisition?
“This morning we reported Valeant’s fourth quarter results for 2013, which were driven by strong sales growth and
profitability across all our regions, including continued outperformance from Bausch & Lomb, since the August 5 close.”
Michael Pearson, CEO, 02/27/14
Overall Business Shows However, Significant Erosion In With Price Being The Key Growth (IMS Dollars) Units Sold Driver Of Growth
LOTEMAX® 16.0% (21.0%) 46.0%
BESIVANCE® 30.0% 12.0% 16.0%
ALREX® 5.0% (12.0%) 20.0%
BEPREVE® (3.0%) (21.0%) 23.0%
U.S. B&L 2.0% (19.0%) 11.0%
(20.0%) 0.0% 20.0% 40.0% (40.0%) (20.0%) 0.0% 20.0% 0.0% 20.0% 40.0% 60.0%
IMS Data Suggests That Most Of Bausch & Lomb’s Growth Is Attributable To What We Believe Are Unsustainable Price Increases
Source: Analysis based upon IMS FIRST Q4 2013 vs. Q4 2012. Total U.S. Bausch & Lomb sales represents Eye Care.
Note: Individual products listed denote products that were launched after 2012. Note: Permission to use quotes was neither sought nor received.
Note: Reviewed by independent consultants and forensic accountants.
7
|
|
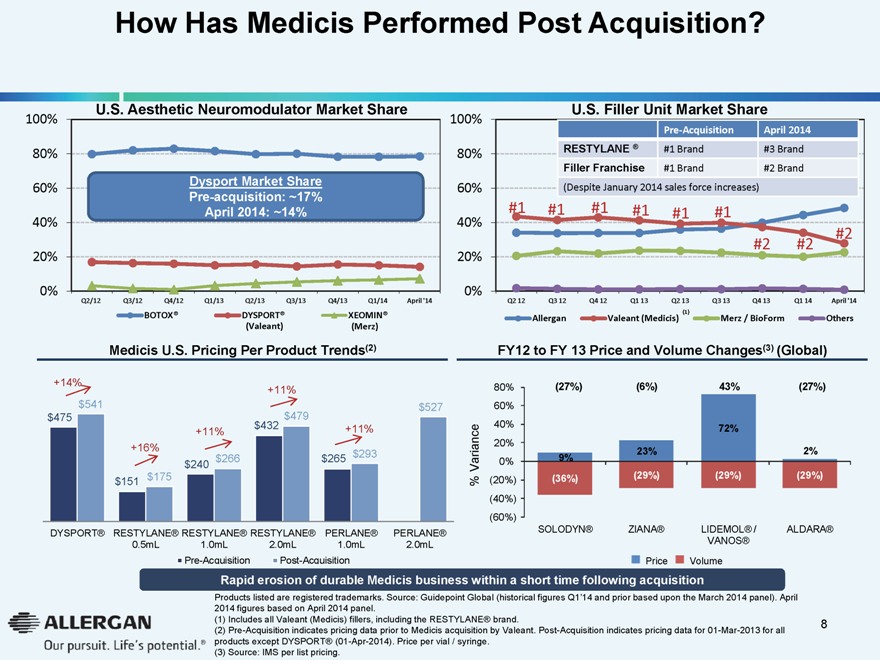
How Has Medicis Performed Post Acquisition?
U.S. Aesthetic Neuromodulator Market Share U.S. Filler Unit Market Share
100% 100%
PreAcquisition April 2014
RESTYLANE ® #1 Brand #3 Brand
80% 80%
Filler Franchise #1 Brand #2 Brand
Dysport Market Share
60% 60% (Despite January 2014 sales force increases)
Pre-acquisition: ~17%
April 2014: ~14% #1 #1 #1 #1 #1 #1
40% 40%
#2
#2 #2
20% 20%
0% 0%
Q2/12 Q3/12 Q4/12 Q1/13 Q2/13 Q3/13 Q4/13 Q1/14 April ‘14 Q2 12 Q3 12 Q4 12 Q1 13 Q2 13 Q3 13 Q4 13 Q1 14 April ‘14
BOTOX® DYSPORT® XEOMIN® Allergan Valeant (Medicis) (1) Merz / BioForm Others (Valeant) (Merz)
Medicis U.S. Pricing Per Product Trends(2) FY12 to FY 13 Price and Volume Changes(3) (Global)
+14% 80% (27%) (6%) 43% (27%)
+11% $541 $527 60% $475 $479 $432 +11% 40% 72% +11% +16% 20% $293 23% 2% $266 $265 0% 9% $240 Variance $175 (36%) (29%) (29%) (29%) $151 % (20%) (40%) (60%)
DYSPORT® RESTYLANE® RESTYLANE® RESTYLANE® PERLANE® PERLANE® SOLODYN® ZIANA® LIDEMOL® / ALDARA®
0.5mL 1.0mL 2.0mL 1.0mL 2.0mL VANOS® Pre-Acquisition Post-Acquisition Price Volume
Rapid erosion of durable Medicis business within a short time following acquisition
Products listed are registered trademarks. Source: Guidepoint Global (historical figures Q1’14 and prior based upon the March 2014 panel). April 2014 figures based on April 2014 panel.
(1) Includes all Valeant (Medicis) fillers, including the RESTYLANE® brand. (2) Pre-Acquisition indicates pricing data prior to Medicis acquisition by Valeant. Post-Acquisition indicates pricing data for 01-Mar-2013 for all products except DYSPORT® (01-Apr-2014). Price per vial / syringe.
| (3) |
|
Source: IMS per list pricing. |
| 8 |
|
|
|
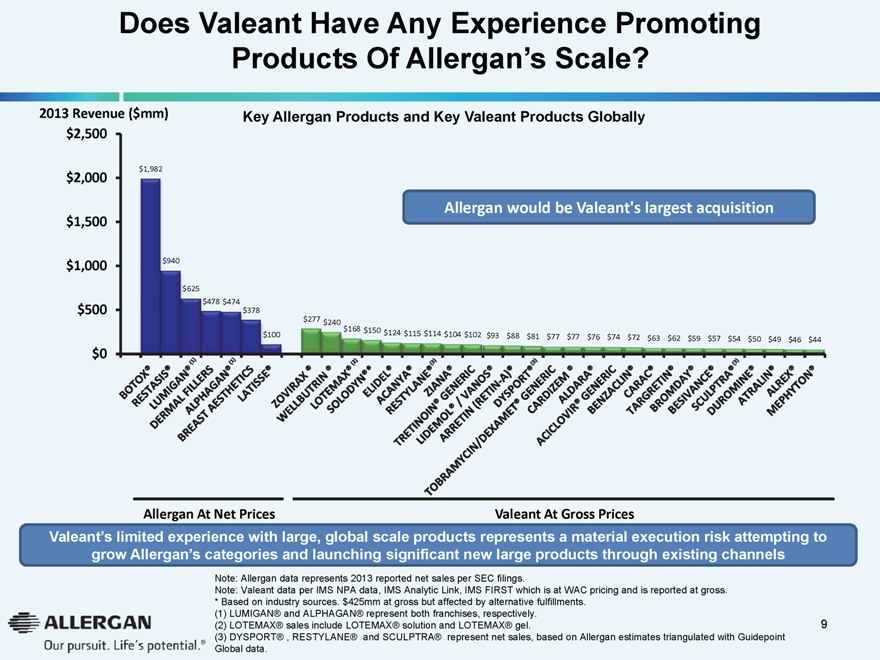
Does Valeant Have Any Experience Promoting Products Of Allergan’s Scale?
2013 Revenue ($mm)
Key Allergan Products and Key Valeant Products Globally
$2,500
$2,000 $1,982
Allergan would be Valeant’s largest acquisition $1,500
$1,000 $940
$625 $478 $474
$500 $378
$277 $240 $168 $150 $124 $115 $114 $100 $104 $102 $93 $88 $81 $77 $77 $76 $74 $72
$63 $62 $59 $57 $54 $50 $49 $46 $44
$0
Allergan At Net Prices
Valeant At Gross Prices
Valeant’s limited experience with large, global scale products represents a material execution risk attempting to grow Allergan’s categories and launching significant new large products through existing channels
Note: Allergan data represents 2013 reported net sales per SEC filings.
Note: Valeant data per IMS NPA data, IMS Analytic Link, IMS FIRST which is at WAC pricing and is reported at gross.
| * |
|
Based on industry sources. $425mm at gross but affected by alternative fulfillments. |
(1) LUMIGAN® and ALPHAGAN® represent both franchises, respectively. (2) LOTEMAX® sales include LOTEMAX® solution and LOTEMAX® gel.
(3) DYSPORT® , RESTYLANE® and SCULPTRA® represent net sales, based on Allergan estimates triangulated with Guidepoint Global data.
9
|
|
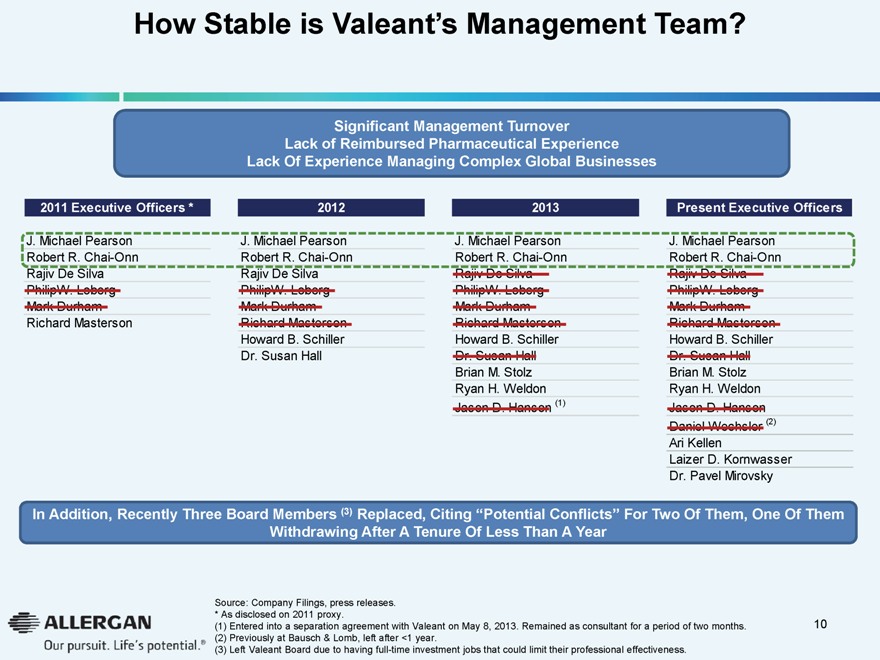
How Stable is Valeant’s Management Team?
Significant Management Turnover Lack of Reimbursed Pharmaceutical Experience Lack Of Experience Managing Complex Global Businesses
2011 Executive Officers * 2012 2013 Present Executive Officers
J. Michael Pearson J. Michael Pearson J. Michael Pearson J. Michael Pearson Robert R. Chai-Onn Robert R. Chai-Onn Robert R. Chai-Onn Robert R. Chai-Onn Rajiv De Silva Rajiv De Silva Rajiv De Silva Rajiv De Silva PhilipW. Loberg PhilipW. Loberg PhilipW. Loberg PhilipW. Loberg Mark Durham Mark Durham Mark Durham Mark Durham Richard Masterson Richard Masterson Richard Masterson Richard Masterson Howard B. Schiller Howard B. Schiller Howard B. Schiller Dr. Susan Hall Dr. Susan Hall Dr. Susan Hall Brian M. Stolz Brian M. Stolz Ryan H. Weldon Ryan H. Weldon Jason D. Hanson (1) Jason D. Hanson Daniel Wechsler (2) Ari Kellen Laizer D. Kornwasser Dr. Pavel Mirovsky
In Addition, Recently Three Board Members (3) Replaced, Citing “Potential Conflicts” For Two Of Them, One Of Them Withdrawing After A Tenure Of Less Than A Year
Source: Company Filings, press releases.
* As disclosed on 2011 proxy. (1) Entered into a separation agreement with Valeant on May 8, 2013. Remained as consultant for a period of two months.
| (2) |
|
Previously at Bausch & Lomb, left after <1 year. |
| (3) |
|
Left Valeant Board due to having full-time investment jobs that could limit their professional effectiveness. |
| 10 |
|
|
|
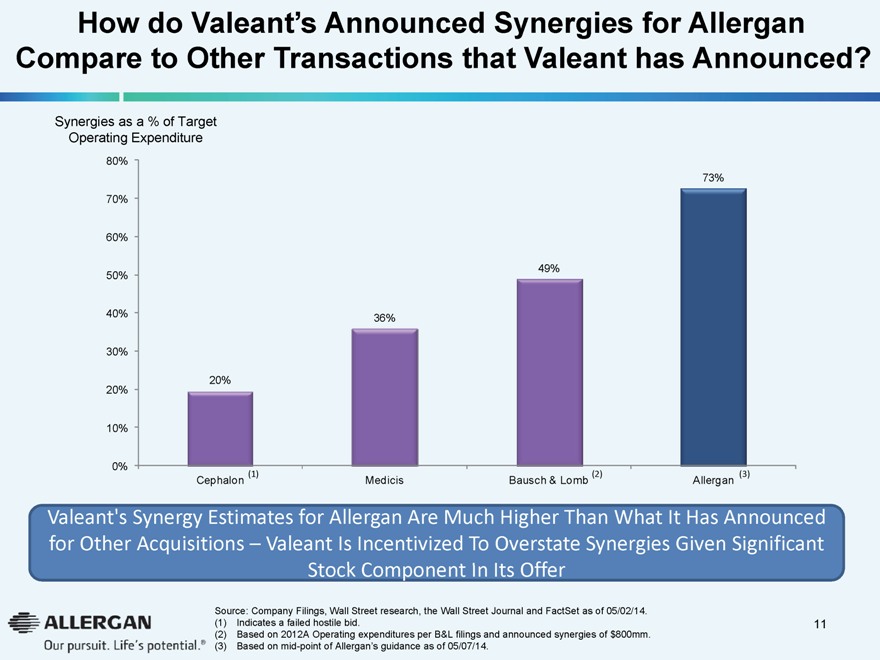
How do Valeant’s Announced Synergies for Allergan Compare to Other Transactions that Valeant has Announced?
Synergies as a % of Target Operating Expenditure
80%
73% 70%
60%
49% 50%
40% 36% 30% 20% 20% 10%
0% (1) (2) (3)
Cephalon Medicis Bausch & Lomb Allergan
Valeant’s Synergy Estimates for Allergan Are Much Higher Than What It Has Announced for Other Acquisitions – Valeant Is Incentivized To Overstate Synergies Given Significant Stock Component In Its Offer
Source: Company Filings, Wall Street research, the Wall Street Journal and FactSet as of 05/02/14.
(1) Indicates a failed hostile bid. 11
(2) Based on 2012A Operating expenditures per B&L filings and announced synergies of $800mm. (3) Based on mid-point of Allergan’s guidance as of 05/07/14.
|
|
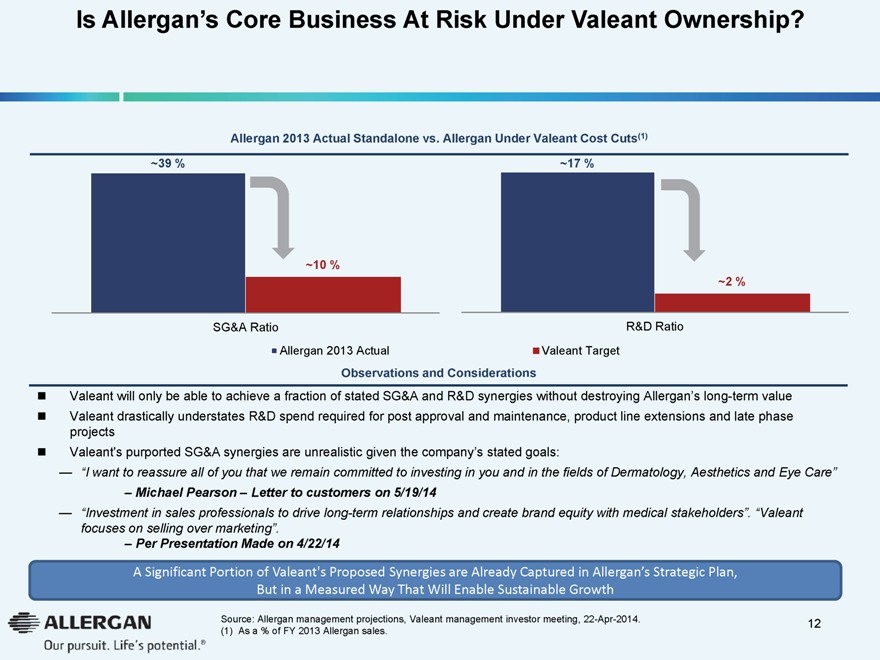
Is Allergan’s Core Business At Risk Under Valeant Ownership?
Allergan 2013 Actual Standalone vs. Allergan Under Valeant Cost Cuts(1)
~39 % ~17 %
~10 %
~2 %
SG&A Ratio R&D Ratio
Allergan 2013 Actual Valeant Target
Observations and Considerations
Valeant will only be able to achieve a fraction of stated SG&A and R&D synergies without destroying Allergan’s long-term value Valeant drastically understates R&D spend required for post approval and maintenance, product line extensions and late phase projects Valeant’s purported SG&A synergies are unrealistic given the company’s stated goals:
— “I want to reassure all of you that we remain committed to investing in you and in the fields of Dermatology, Aesthetics and Eye Care”
– Michael Pearson – Letter to customers on 5/19/14
— “Investment in sales professionals to drive long-term relationships and create brand equity with medical stakeholders”. “Valeant focuses on selling over marketing”.
– Per Presentation Made on 4/22/14
A Significant Portion of Valeant’s Proposed Synergies are Already Captured in Allergan’s Strategic Plan, But in a Measured Way That Will Enable Sustainable Growth
Source: Allergan management projections, Valeant management investor meeting, 22-Apr-2014. 12 (1) As a % of FY 2013 Allergan sales.
|
|
Are Valeant’s Purported R&D Synergies Achievable?
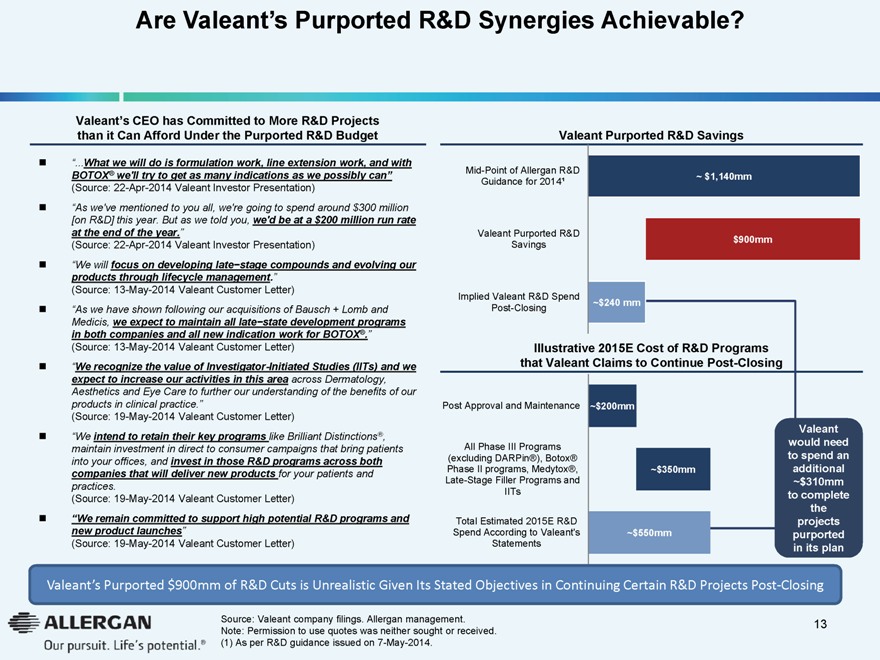
Valeant’s CEO has Committed to More R&D Projects than it Can Afford Under the Purported R&D Budget
”.What we will do is formulation work, line extension work, and with BOTOX® we’ll try to get as many indications as we possibly can”
(Source: 22-Apr-2014 Valeant Investor Presentation)
“As we’ve mentioned to you all, we’re going to spend around $300 million [on R&D] this year. But as we told you, we’d be at a $200 million run rate at the end of the year.”
(Source: 22-Apr-2014 Valeant Investor Presentation)
“We will focus on developing late-stage compounds and evolving our products through lifecycle management.”
(Source: 13-May-2014 Valeant Customer Letter)
“As we have shown following our acquisitions of Bausch + Lomb and Medicis, we expect to maintain all late-state development programs in both companies and all new indication work for BOTOX®.”
(Source: 13-May-2014 Valeant Customer Letter)
“We recognize the value of Investigator-Initiated Studies (IITs) and we expect to increase our activities in this area across Dermatology, Aesthetics and Eye Care to further our understanding of the benefits of our products in clinical practice.”
(Source: 19-May-2014 Valeant Customer Letter)
“We intend to retain their key programs like Brilliant Distinctions®, maintain investment in direct to consumer campaigns that bring patients into your offices, and invest in those R&D programs across both companies that will deliver new products for your patients and practices.
(Source: 19-May-2014 Valeant Customer Letter)
“We remain committed to support high potential R&D programs and new product launches”
(Source: 19-May-2014 Valeant Customer Letter)
Valeant Purported R&D Savings
Mid-Point of Allergan R&D
~ $1,140mm
Guidance for 2014¹
Valeant Purported R&D $900mm
Savings
Implied Valeant R&D Spend
~$240 mm
Post-Closing
Illustrative 2015E Cost of R&D Programs that Valeant Claims to Continue Post-Closing
Post Approval and Maintenance ~$200mm
Valeant
All Phase III Programs would need (excluding DARPin®), Botox® to spend an Phase II programs, Medytox®, ~$350mm additional Late-Stage Filler Programs and ~$310mm
IITs to complete the
Total Estimated 2015E R&D projects Spend According to Valeant’s ~$550mm purported
Statements in its plan
Valeant’s Purported $900mm of R&D Cuts is Unrealistic Given Its Stated
Objectives in Continuing Certain R&D Projects Post-Closing
Source: Valeant company filings. Allergan management. 13 Note: Permission to use quotes was neither sought or received.
| (1) |
|
As per R&D guidance issued on 7-May-2014. |
|
|
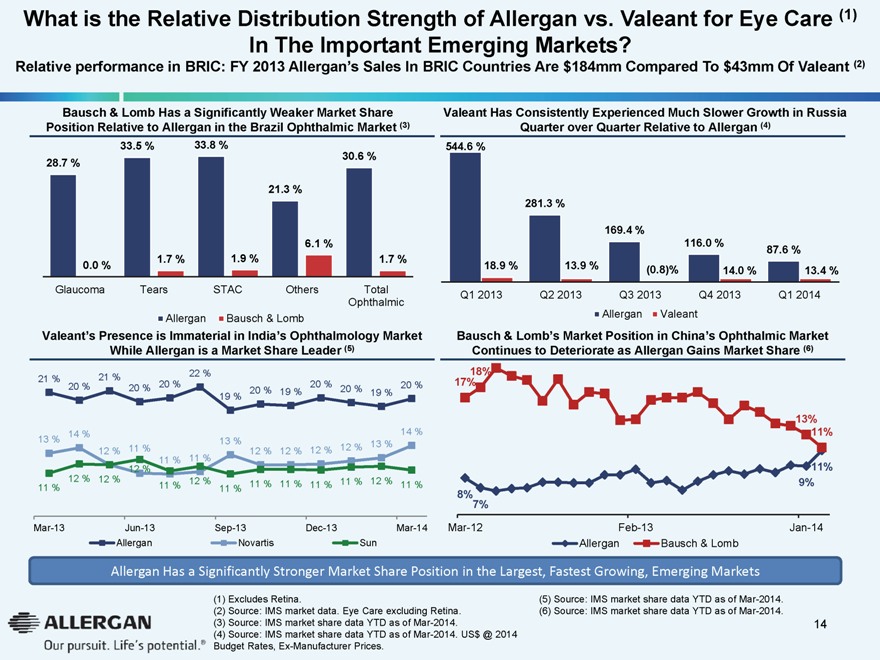
What is the Relative Distribution Strength of Allergan vs. Valeant for Eye Care (1) In The Important Emerging Markets?
Relative performance in BRIC: FY 2013 Allergan’s Sales In BRIC Countries Are $184mm Compared To $43mm Of Valeant (2)
Bausch & Lomb Has a Significantly Weaker Market Share Valeant Has Consistently Experienced Much Slower Growth in Russia Position Relative to Allergan in the Brazil Ophthalmic Market (3) Quarter over Quarter Relative to Allergan (4)
33.5 % 33.8 % 544.6 %
30.6 %
28.7 %
21.3 %
281.3 %
169.4 %
6.1 % 116.0 %
87.6 % 1.7 % 1.9 % 1.7 % 0.0 % 18.9 % 13.9 % (0.8)%
14.0 % 13.4 %
Glaucoma Tears STAC Others Total
Q1 2013 Q2 2013 Q3 2013 Q4 2013 Q1 2014 Ophthalmic Allergan Bausch & Lomb Allergan Valeant
Valeant’s Presence is Immaterial in India’s Ophthalmology Market Bausch & Lomb’s Market Position in China’s Ophthalmic Market While Allergan is a Market Share Leader (5) Continues to Deteriorate as Allergan Gains Market Share (6)
22 % 18%
21 % 21 % 17%
20 % 20 % 20 % 20 % 20 %
20 % 19 % 20 % 19 %
19 %
13%
14 % 14 % 11%
13 % 13 %
11 % 12 % 13 %
12 % 12 % 12 % 12 %
11 % 11 % 11%
12 % 12 %
12 % 12 % 11 % 12 % 9%
11 % 11 % 11 % 11 % 11 % 11 %
11 %
8%7%
Mar-13 Jun-13 Sep-13 Dec-13 Mar-14 Mar-12 Feb-13 Jan-14
Allergan Novartis Sun Allergan Bausch & Lomb
Allergan Has a Significantly Stronger Market Share Position in the Largest, Fastest Growing, Emerging Markets
(1) Excludes Retina.
(2) Source: IMS market data. Eye Care excluding Retina. (3) Source: IMS market share data YTD as of Mar-2014.
(4) Source: IMS market share data YTD as of Mar-2014. US$ @ 2014
Budget Rates, Ex-Manufacturer Prices.
(5) Source: IMS market share data YTD as of Mar-2014. (6) Source: IMS market share data YTD as of Mar-2014.
14
|
|
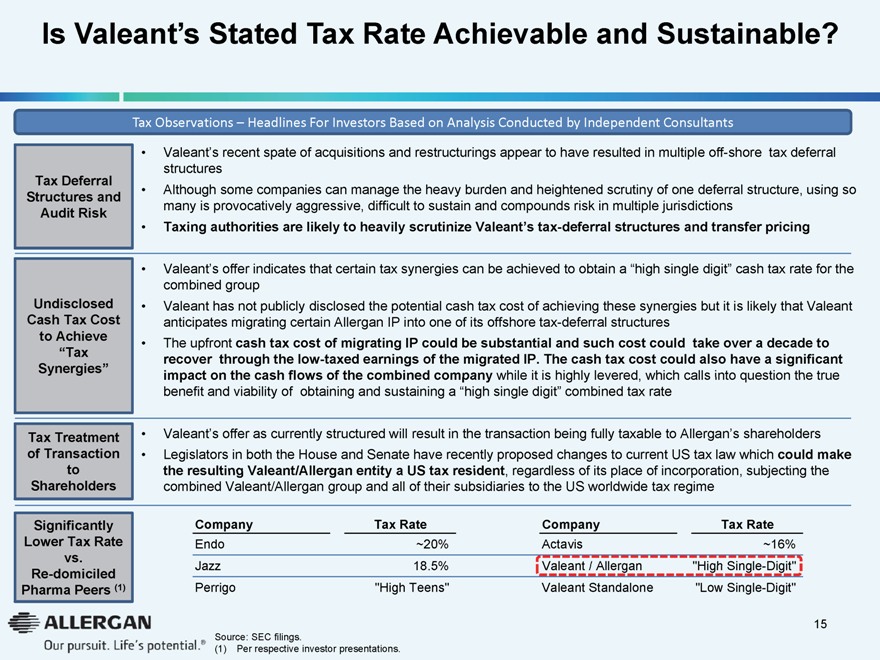
Is Valeant’s Stated Tax Rate Achievable and Sustainable?
Tax Deferral Structures and Audit Risk
Undisclosed Cash Tax Cost to Achieve “Tax Synergies”
Tax Treatment of Transaction to Shareholders
Significantly Lower Tax Rate vs. Re-domiciled Pharma Peers (1)
Tax Observations – Headlines For Investors Based on Analysis Conducted by Independent Consultants
Valeant’s recent spate of acquisitions and restructurings appear to have resulted in multiple off-shore tax deferral structures
Although some companies can manage the heavy burden and heightened scrutiny of one deferral structure, using so many is provocatively aggressive, difficult to sustain and compounds risk in multiple jurisdictions
Taxing authorities are likely to heavily scrutinize Valeant’s tax-deferral structures and transfer pricing
Valeant’s offer indicates that certain tax synergies can be achieved to obtain a “high single digit” cash tax rate for the combined group
Valeant has not publicly disclosed the potential cash tax cost of achieving these synergies but it is likely that Valeant anticipates migrating certain Allergan IP into one of its offshore tax-deferral structures
The upfront cash tax cost of migrating IP could be substantial and such cost could take over a decade to recover through the low-taxed earnings of the migrated IP. The cash tax cost could also have a significant impact on the cash flows of the combined company while it is highly levered, which calls into question the true benefit and viability of obtaining and sustaining a “high single digit” combined tax rate
Valeant’s offer as currently structured will result in the transaction being fully taxable to Allergan’s shareholders
Legislators in both the House and Senate have recently proposed changes to current US tax law which could make the resulting Valeant/Allergan entity a US tax resident, regardless of its place of incorporation, subjecting the combined Valeant/Allergan group and all of their subsidiaries to the US worldwide tax regime
Company Tax Rate Company Tax Rate
Endo ~20% Actavis ~16% Jazz 18.5% Valeant / Allergan “High Single-Digit” Perrigo “High Teens” Valeant Standalone “Low Single-Digit”
15
Source: SEC filings.
(1) Per respective investor presentations.
|
|
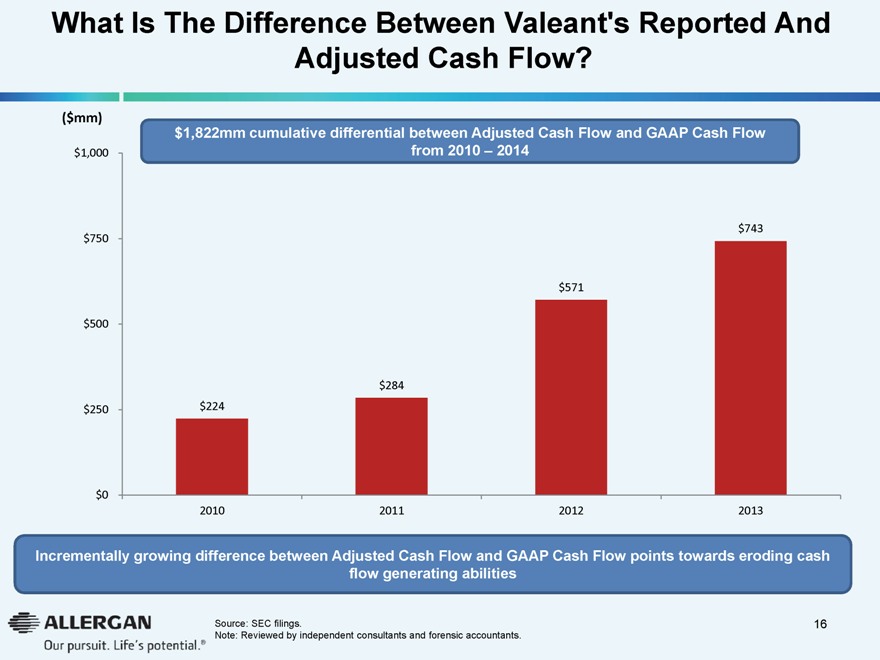
What Is The Difference Between Valeant’s Reported And Adjusted Cash Flow?
($mm) $1,822mm cumulative differential between Adjusted Cash Flow and GAAP Cash Flow $1,000 from 2010 – 2014
$743
$750
$571
$500
$284
$250
$224
$0
2010
2011
2012
2013
Incrementally growing difference between Adjusted Cash Flow and GAAP Cash Flow points towards eroding cash flow generating abilities
Source: SEC filings. 16 Note: Reviewed by independent consultants and forensic accountants.
|
|
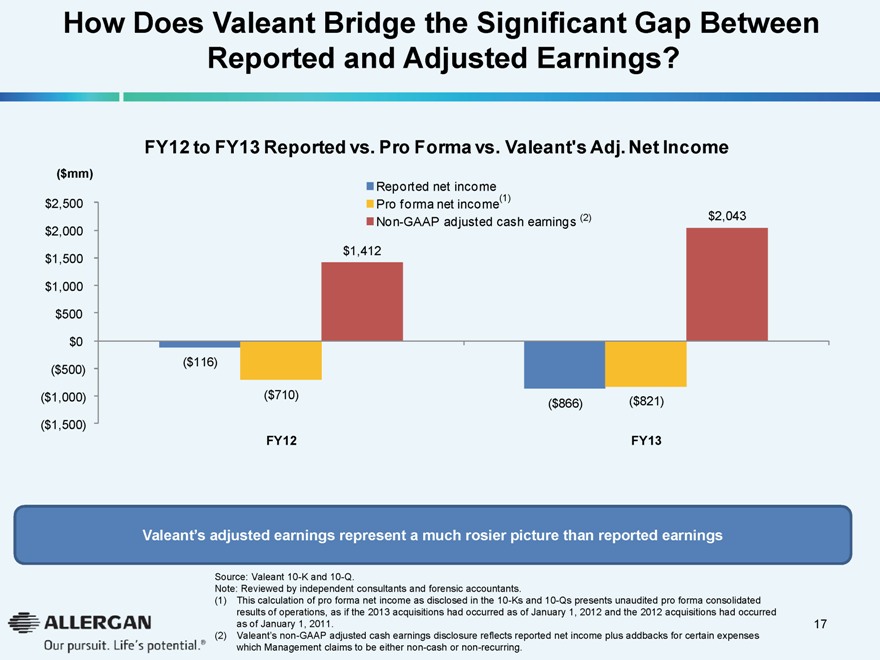
How Does Valeant Bridge the Significant Gap Between Reported and Adjusted Earnings?
FY12 to FY13 Reported vs. Pro Forma vs. Valeant’s Adj. Net Income
($mm)
Reported net income $2,500 (1)
Pro forma net income $2,043 Non-GAAP adjusted cash earnings (2) $2,000 $1,412 $1,500
$1,000
$500
$0
($116)
($500)
($1,000) ($710)
($866) ($821)
($1,500)
FY12 FY13
Valeant’s adjusted earnings represent a much rosier picture than reported earnings
Source: Valeant 10-K and 10-Q.
Note: Reviewed by independent consultants and forensic accountants.
(1) This calculation of pro forma net income as disclosed in the 10-Ks and 10-Qs presents unaudited pro forma consolidated results of operations, as if the 2013 acquisitions had occurred as of January 1, 2012 and the 2012 acquisitions had occurred as of January 1, 2011. 17
(2) Valeant’s non-GAAP adjusted cash earnings disclosure reflects reported net income plus addbacks for certain expenses which Management claims to be either non-cash or non-recurring.
|
|
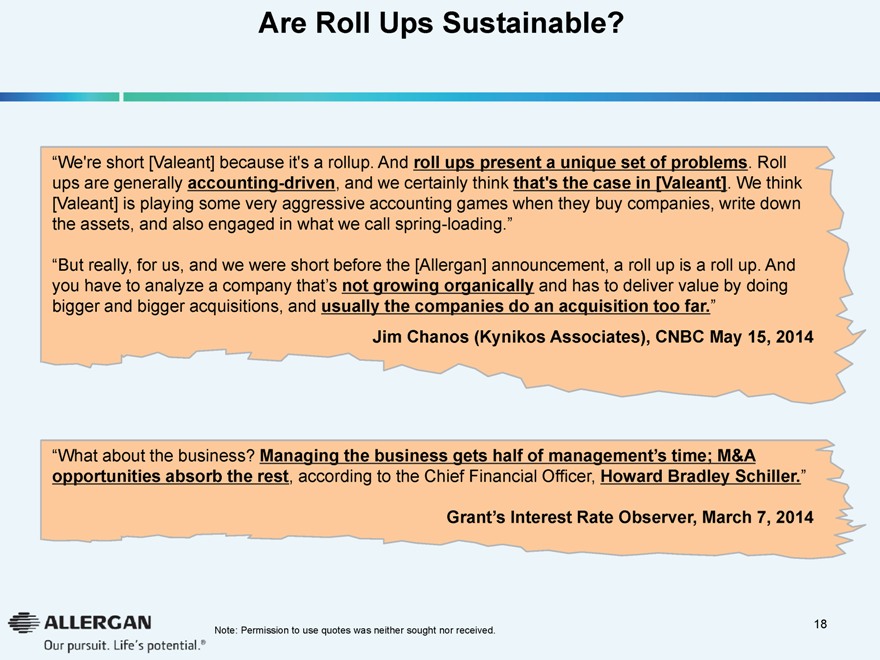
Are Roll Ups Sustainable
“We’re short [Valeant] because it’s a rollup. And roll ups present a unique set of problems. Roll ups are generally accounting-driven, and we certainly think that’s the case in [Valeant]. We think [Valeant] is playing some very aggressive accounting games when they buy companies, write down the assets, and also engaged in what we call spring-loading.”
“But really, for us, and we were short before the [Allergan] announcement, a roll up is a roll up. And you have to analyze a company that’s not growing organically and has to deliver value by doing bigger and bigger acquisitions, and usually the companies do an acquisition too far.”
Jim Chanos (Kynikos Associates), CNBC May 15, 2014
“What about the business? Managing the business gets half of management’s time; M&A opportunities absorb the rest, according to the Chief Financial Officer, Howard Bradley Schiller.”
Grant’s Interest Rate Observer, March 7, 2014
Note: Permission to use quotes was neither sought nor received.
18
|
|
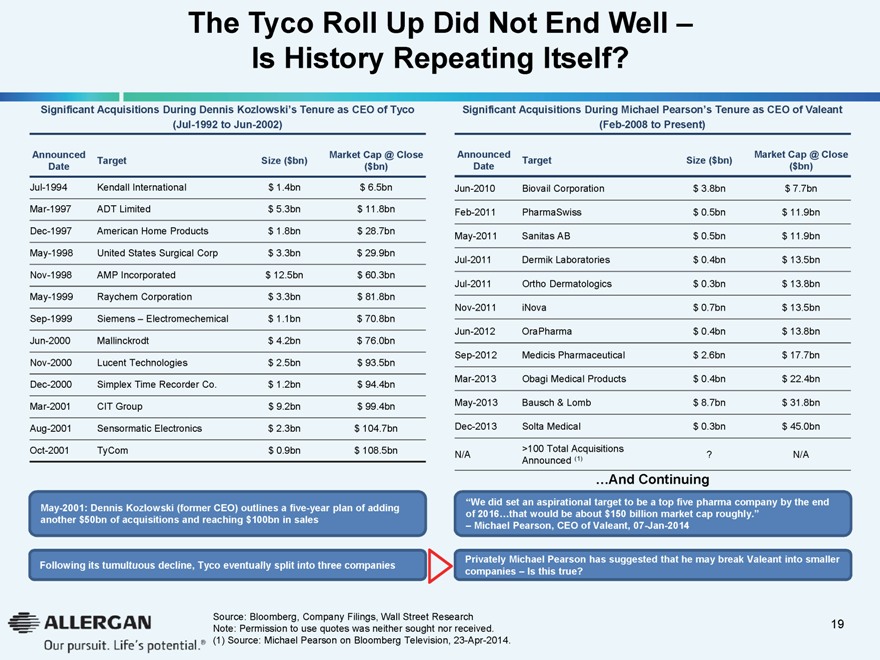
The Tyco Roll Up Did Not End Well –Is History Repeating Itself?
Significant Acquisitions During Dennis Kozlowski’s Tenure as CEO of Tyco (Jul-1992 to Jun-2002)
Announced Market Cap @ Close Target Size ($bn) Date ($bn)
Jul-1994 Kendall International $ 1.4bn $ 6.5bn Mar-1997 ADT Limited $ 5.3bn $ 11.8bn Dec-1997 American Home Products $ 1.8bn $ 28.7bn May-1998 United States Surgical Corp $ 3.3bn $ 29.9bn Nov-1998 AMP Incorporated $ 12.5bn $ 60.3bn May-1999 Raychem Corporation $ 3.3bn $ 81.8bn Sep-1999 Siemens – Electromechemical $ 1.1bn $ 70.8bn Jun-2000 Mallinckrodt $ 4.2bn $ 76.0bn Nov-2000 Lucent Technologies $ 2.5bn $ 93.5bn Dec-2000 Simplex Time Recorder Co. $ 1.2bn $ 94.4bn Mar-2001 CIT Group $ 9.2bn $ 99.4bn Aug-2001 Sensormatic Electronics $ 2.3bn $ 104.7bn Oct-2001 TyCom $ 0.9bn $ 108.5bn
May-2001: Dennis Kozlowski (former CEO) outlines a five-year plan of adding another $50bn of acquisitions and reaching $100bn in sales
Following its tumultuous decline, Tyco eventually split into three companies
Significant Acquisitions During Michael Pearson’s Tenure as CEO of Valeant (Feb-2008 to Present)
Announced Market Cap @ Close Target Size ($bn) Date ($bn)
Jun-2010 Biovail Corporation $ 3.8bn $ 7.7bn Feb-2011 PharmaSwiss $ 0.5bn $ 11.9bn May-2011 Sanitas AB $ 0.5bn $ 11.9bn Jul-2011 Dermik Laboratories $ 0.4bn $ 13.5bn Jul-2011 Ortho Dermatologics $ 0.3bn $ 13.8bn Nov-2011 iNova $ 0.7bn $ 13.5bn Jun-2012 OraPharma $ 0.4bn $ 13.8bn Sep-2012 Medicis Pharmaceutical $ 2.6bn $ 17.7bn Mar-2013 Obagi Medical Products $ 0.4bn $ 22.4bn May-2013 Bausch & Lomb $ 8.7bn $ 31.8bn Dec-2013 Solta Medical $ 0.3bn $ 45.0bn
>100 Total Acquisitions
N/A (1) N/A Announced?
…And Continuing
“We did set an aspirational target to be a top five pharma company by the end of 2016…that would be about $150 billion market cap roughly.”
– Michael Pearson, CEO of Valeant, 07-Jan-2014
Privately Michael Pearson has suggested that he may break Valeant into smaller companies – Is this true?
Source: Bloomberg, Company Filings, Wall Street Research
Note: Permission to use quotes was neither sought nor received. 19 (1) Source: Michael Pearson on Bloomberg Television, 23-Apr-2014.
|
|
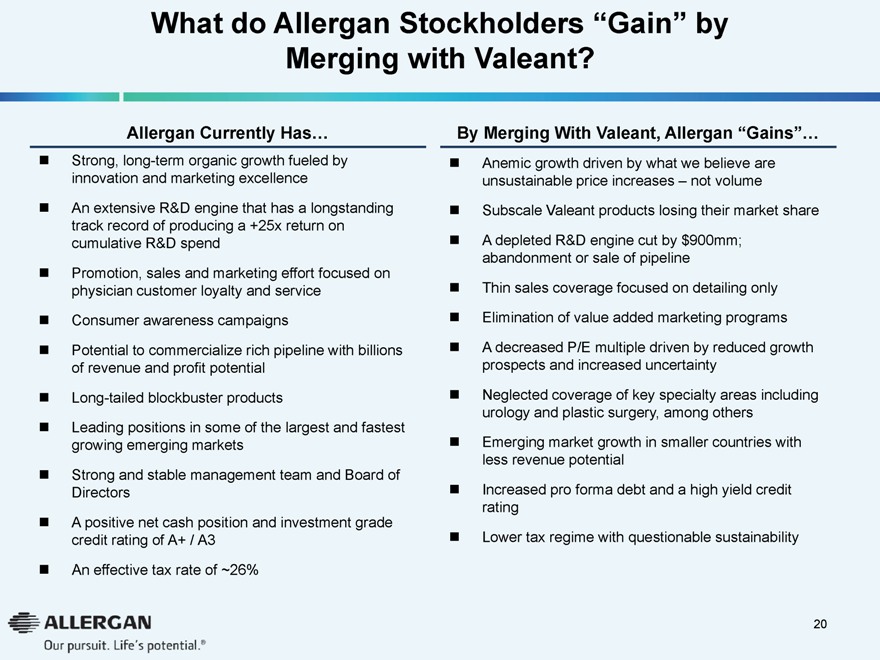
What do Allergan Stockholders “Gain” by Merging with Valeant?
Allergan Currently Has…
Strong, long-term organic growth fueled by innovation and marketing excellenceAn extensive R&D engine that has a longstanding track record of producing a +25x return on cumulative R&D spendPromotion, sales and marketing effort focused on physician customer loyalty and service Consumer awareness campaigns Potential to commercialize rich pipeline with billions of revenue and profit potential Long-tailed blockbuster products Leading positions in some of the largest and fastest growing emerging markets Strong and stable management team and Board of Directors A positive net cash position and investment grade credit rating of A+ / A3An effective tax rate of ~26%
By Merging With Valeant, Allergan “Gains”…
Anemic growth driven by what we believe are unsustainable price increases – not volumeSubscale Valeant products losing their market shareA depleted R&D engine cut by $900mm; abandonment or sale of pipeline Thin sales coverage focused on detailing only Elimination of value added marketing programs A decreased P/E multiple driven by reduced growth prospects and increased uncertainty Neglected coverage of key specialty areas including urology and plastic surgery, among others Emerging market growth in smaller countries with less revenue potential Increased pro forma debt and a high yield credit rating Lower tax regime with questionable sustainability
20
|
|

May 27, 2014 Certain Potential Business Risks And Issues With Valeant Pharmaceuticals International, Inc.