Attached files
| file | filename |
|---|---|
| 8-K/A - 8-K/A - Covisint Corp | a8kfy14q4earnings331141.htm |
| EX-99.1 - PRESS RELEASE - Covisint Corp | exhibit9911.htm |

Covisint Corporation: Fourth Quarter and Full Year Fiscal 2014 Results May 22, 2014
Forward Looking Information 2 This presentation contains “forward-looking” statements that involve risks, uncertainties and assumptions. If the risks or uncertainties ever materialize or the assumptions prove incorrect, our results may differ materially from those expressed or implied by such forward-looking statements. All statements other than statements of historical fact could be deemed forward-looking, including, but not limited to, any projections of financial information; any statements about historical results that may suggest trends for our business and results of operations; any statements of the plans, strategies and objectives of management for future operations; any statements of expectation or belief regarding future events, potential markets or market size, technology developments, or enforceability of our intellectual property rights; and any statements of assumptions underlying any of the foregoing. These statements are based on estimates and information available to us at the time of this presentation and are not guarantees of future performance. Actual results could differ materially from our current expectations as a result of many factors, including but not limited to: quarterly fluctuations in our business and results of operations; our ability to address market needs and sell our applications and services successfully; the general market conditions of the industry; and the effects of competition. These and other risks and uncertainties associated with our business are described in the prospectus for our IPO. We assume no obligation and do not intend to update these forward-looking statements. In addition to U.S. GAAP financials, this presentation includes certain non-GAAP financial measures. These historical and forward-looking non-GAAP measures are in addition to, not a substitute for or superior to, measures of financial performance prepared in accordance with GAAP. A reconciliation between GAAP and non-GAAP measures is included in the appendix to this presentation. Covisint is a registered trademark of Covisint Corporation. This presentation also contains additional trademarks and service marks of ours and of other companies. We do not intend our use or display of other companies’ trademarks or service marks to imply a relationship with, or endorsement or sponsorship of us by, these other companies.
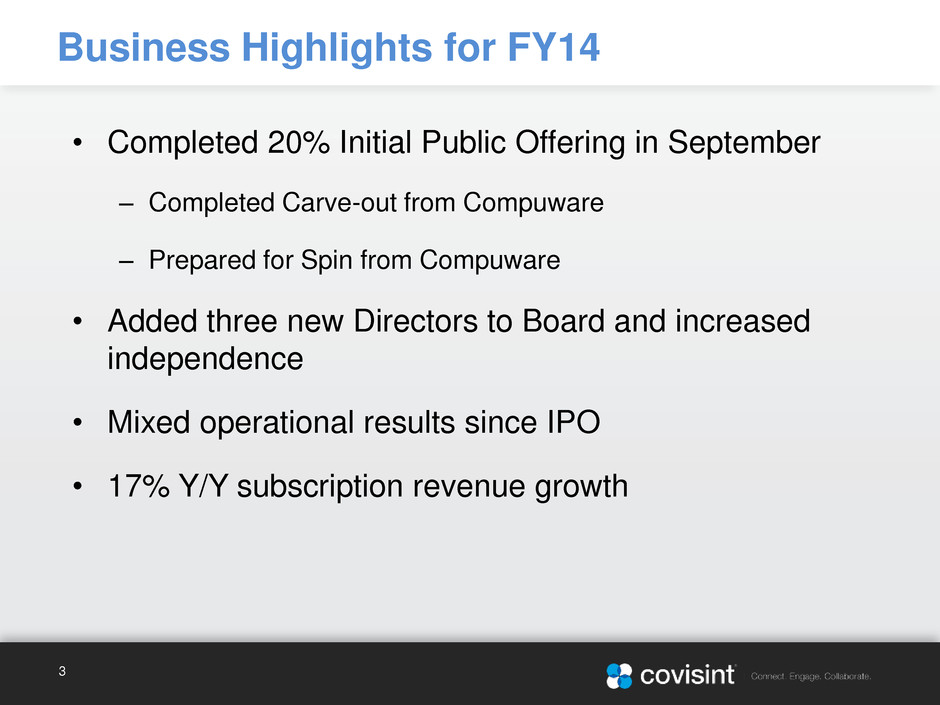
Business Highlights for FY14 • Completed 20% Initial Public Offering in September – Completed Carve-out from Compuware – Prepared for Spin from Compuware • Added three new Directors to Board and increased independence • Mixed operational results since IPO • 17% Y/Y subscription revenue growth 3
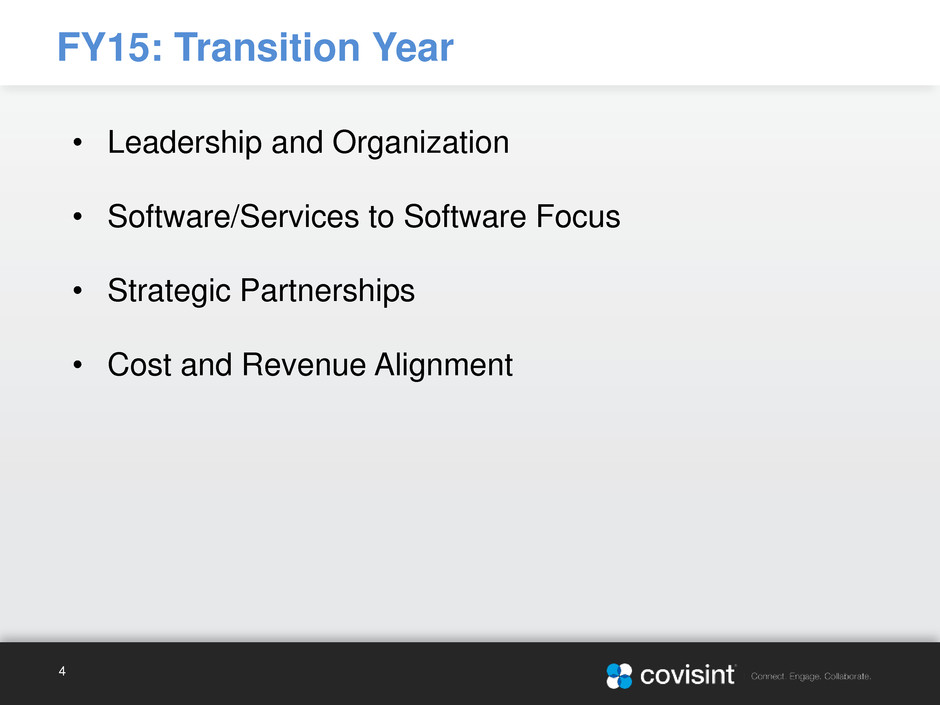
FY15: Transition Year 4 • Leadership and Organization • Software/Services to Software Focus • Strategic Partnerships • Cost and Revenue Alignment
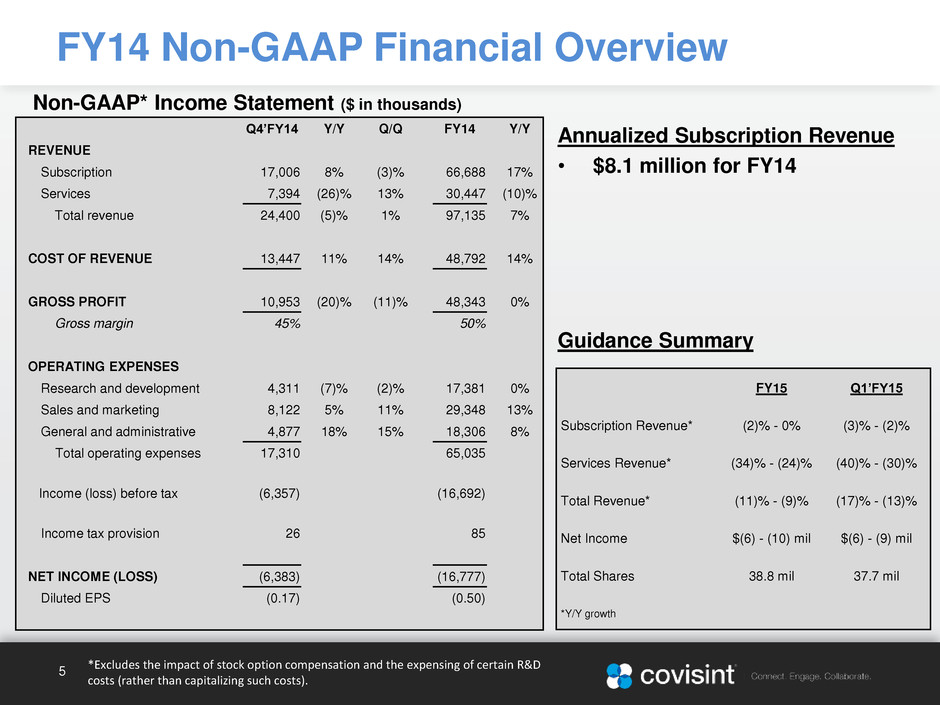
Non-GAAP* Income Statement ($ in thousands) FY14 Non-GAAP Financial Overview Annualized Subscription Revenue • $8.1 million for FY14 Guidance Summary 5 Q4’FY14 Y/Y Q/Q FY14 Y/Y REVENUE Subscription 17,006 8% (3)% 66,688 17% Services 7,394 (26)% 13% 30,447 (10)% Total revenue 24,400 (5)% 1% 97,135 7% COST OF REVENUE 13,447 11% 14% 48,792 14% GROSS PROFIT 10,953 (20)% (11)% 48,343 0% Gross margin 45% 50% OPERATING EXPENSES Research and development 4,311 (7)% (2)% 17,381 0% Sales and marketing 8,122 5% 11% 29,348 13% General and administrative 4,877 18% 15% 18,306 8% Total operating expenses 17,310 65,035 Income (loss) before tax (6,357) (16,692) Income tax provision 26 85 NET INCOME (LOSS) (6,383) (16,777) Diluted EPS (0.17) (0.50) FY15 Q1’FY15 Subscription Revenue* (2)% - 0% (3)% - (2)% Services Revenue* (34)% - (24)% (40)% - (30)% Total Revenue* (11)% - (9)% (17)% - (13)% Net Income $(6) - (10) mil $(6) - (9) mil Total Shares 38.8 mil 37.7 mil *Y/Y growth *Excludes the impact of stock option compensation and the expensing of certain R&D costs (rather than capitalizing such costs).

Appendix

General and administrative 7,338 28,676 Adjustments: Stock compensation expense 2,461 10,330 Amortization of trademarks - 40 General and administrative, non-GAAP 4,877 18,306 Net income (loss) (9,928) (35,658) Adjustments: Capitalized internal software costs (1,331) (5,695) Stock compensation expense 3,062 17,475 Amortization of intangibles 1,814 7,101 Net income (loss), non-GAAP (6,383) (16,777) Diluted EPS (0.27) (1.06) Adjustments: Capitalized internal software costs (0.04) (0.17) Stock compensation expense 0.08 0.52 Amortization of intangibles 0.05 0.21 Diluted EPS, non-GAAP (0.17) (0.50) FY14 FY14 FY14 Q4'FY14 Q4'FY14 Q4'FY14 Cost of revenue 15,278 56 74 Adjustments: Stock compensation expens 94 829 Cost of revenue - a ortization of capitalized software 1,737 6,753 Cost of revenue, non-GAAP 13,447 48 792 Research and development 3,046 12 40 Adjustments: Capitalized internal software costs (1,331) 5 695 Stock compensation expens 66 72 Research and development, non-GAAP 4,311 17,381 Sales and marketing 8,640 35,250 Adjustments: Stock compensation expense 441 5,594 Amortization of customer r lationship agreements 77 3 8 Sales and marketing, non-GAAP 8,122 29,348 FY14 FY14 FY14Q4'FY14 Q4'FY14 Q4'FY14 FY14 Non-GAAP Reconciliation 7
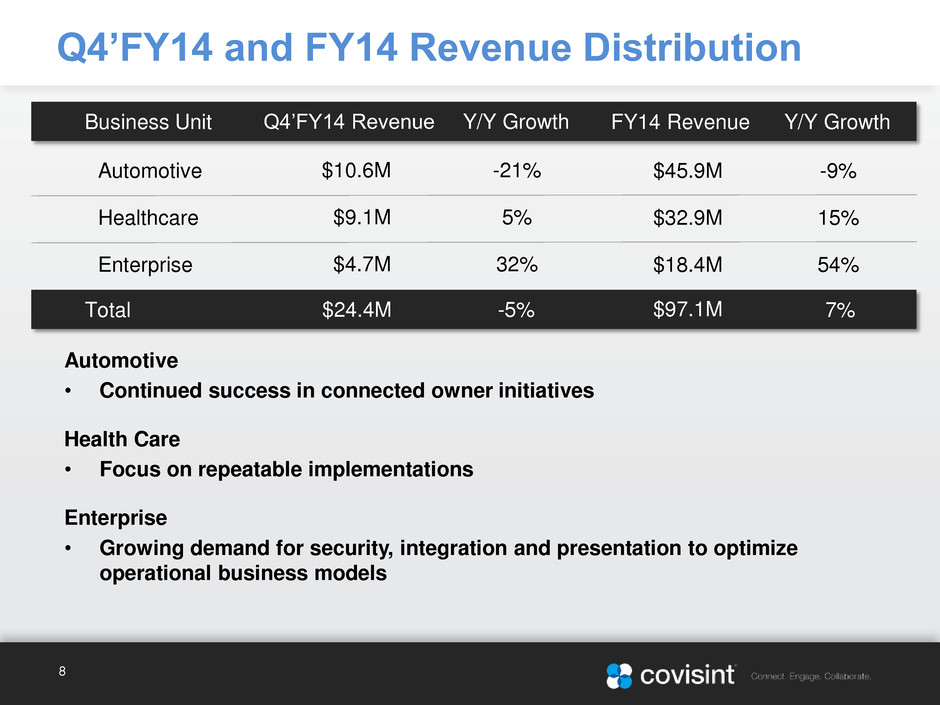
Q4’FY14 and FY14 Revenue Distribution 8 Business Unit FY14 Revenue Y/Y Growth Automotive $45.9M -9% Healthcare $32.9M 15% Enterprise $18.4M 54% Total 7% Automotive • Continued success in connected owner initiatives Health Care • Focus on repeatable implementations Enterprise • Growing demand for security, integration and presentation to optimize operational business models Q4’FY14 Revenue Y/Y Growth $10.6M -21% $9.1M 5% $4.7M 32% $24.4M -5% $97.1M
