Attached files
| file | filename |
|---|---|
| EX-99.1 - EX-99.1 - AMERICAN SCIENCE & ENGINEERING, INC. | a14-13197_1ex99d1.htm |
| 8-K - 8-K - AMERICAN SCIENCE & ENGINEERING, INC. | a14-13197_18k.htm |
EXHBIT 99.2
|
|
May 22, 2014 1 21 May 2014 American Science and Engineering, Inc. Q4 and Fiscal Year 2014 Earnings Call Presentation |
|
|
Safe Harbor Statement ©2014 American Science and Engineering, Inc. The foregoing presentation contains statements concerning AS&E’s financial performance, markets and business operations that may be considered “forward-looking” under applicable securities laws. AS&E wishes to caution readers of this press release that actual results might differ materially from those projected in any forward-looking statements. Factors which might cause actual results to differ materially from those projected in the forward-looking statements contained herein include the following: significant reductions, delays or cancellations (in full or in part) in procurements of the Company’s systems by the United States and other governments; disruption in the supply of any source component incorporated into AS&E's products; litigation seeking to restrict the use of intellectual property used by the Company; limitations under certain laws on the Company’s ability to protect its own intellectual property; potential product liability claims against the Company; global political trends and events which affect public perception of the threat presented by drugs, explosives and other contraband; global economic developments and the ability of governments and private organizations to fund purchases of the Company’s products to address such threats; the potential insufficiency of Company resources, including human resources, capital, plant and equipment and management systems, to accommodate any future growth; technical problems and other delays that could impact new product development and the Company’s ability to adapt to changes in technology and customer requirements; competitive pressures; lengthy sales cycles both in US government procurement and procurement abroad; and future delays in federal funding. These and certain other factors which might cause actual results to differ materially from those projected are detailed from time to time in AS&E’s periodic reports and registration statements filed with the Securities and Exchange Commission, which important factors are incorporated herein by reference. AS&E undertakes no obligation to update forward looking statements to reflect changed assumptions, the occurrence of unanticipated events, or changes in future operating results, financial condition or business over time. Readers are further advised to review the “Risk Factors” set forth in the Company’s Annual Report on Form 10-K, which further detail and supplement the factors described in this Safe Harbor Statement. Among other disclosures, the Risk Factors disclose risks pertaining to that portion of the Company’s business that is dependent on U.S. government contracting as well as international customers. As a contractor with the U.S. government, a significant number of the Company’s government contracts may be terminated at the government’s discretion. 2 |
|
|
Sales by Product Line – Q4’14 vs Q4’13 (000’s) 3 ©2014 American Science and Engineering, Inc. Q4'14 Q4'13 Increase/ (Decrease) Cargo Systems 30,633 $ 12,913 $ 17,720 $ Mobile Cargo Systems 18,821 3,861 14,960 Parcel and Personnel Systems 2,615 1,923 692 Service 10,977 21,967 (10,990) Other 2,530 1,616 914 Total Sales 65,576 $ 42,280 $ 23,296 $ |

|
|
Consolidated Statement of Operations – Q4’14 vs. Q4’13 (000’s) 4 ©2014 American Science and Engineering, Inc. 0.41 $ 0.09 $ 0.50 $ Income per share - Diluted 0.41 $ 0.09 $ 0.50 $ Income per share - Basic 3,195 $ 760 $ 3,955 $ Net income 1,600 392 1,992 Provision for income taxes 4,795 1,152 5,947 Income before provision for income taxes (50) 19 (31) Interest and other, net 4,845 1,133 5,978 Operating income 2,335 13,116 15,451 Operating expenses 1,608 4,756 6,364 Research and development 727 8,360 9,087 Selling, general and administrative 7,180 14,249 21,429 Gross profit 16,116 28,031 44,147 Total cost of sales and contracts 23,296 $ 42,280 $ 65,576 $ Total net sales and contract revenues Increase/ (Decrease) March 31, 2013 March 31, 2014 Quarter Ended |
|
|
Sales by Product Line – FY’14 vs FY’13 (000’s) 5 ©2014 American Science and Engineering, Inc. FY'14 FY'13 Increase / (Decrease) Cargo Systems 62,781 $ 49,925 $ 12,856 $ Mobile Cargo Systems 38,975 31,558 7,417 Parcel and Personnel Systems 10,994 7,825 3,169 Service 68,998 88,191 (19,193) Other 8,501 9,181 (680) Total Sales 190,249 $ 186,680 $ 3,569 $ |
|
|
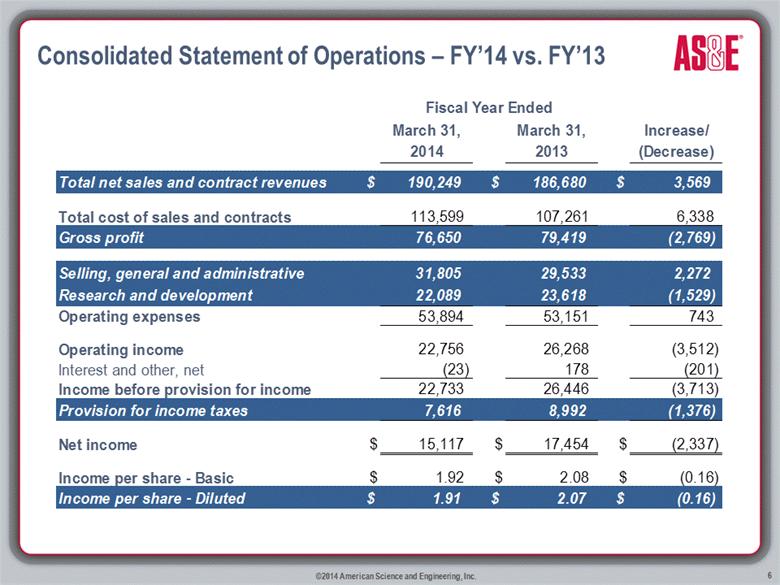
Consolidated Statement of Operations – FY’14 vs. FY’13 6 ©2014 American Science and Engineering, Inc. (0.16) |
|
|
Cash Balance (000’s) 7 ©2014 American Science and Engineering, Inc. |
|
|
Total Bookings – International vs. Domestic (000’s) 8 ©2014 American Science and Engineering, Inc. FY'14 FY'13 Domestic $ 49,108 $ 105,351 International 131,053 74,959 $ 180,161 $ 180,310 |
|
|
Backlog (000’s) 9 ©2014 American Science and Engineering, Inc. |
|
|
10 ©2014 American Science and Engineering, Inc. Strategy Pillars Organic Inorganic Foundation |

|
|
11 Q & A ©2014 American Science and Engineering, Inc. |