Attached files
| file | filename |
|---|---|
| 8-K - FORM 8-K - APOLLO INVESTMENT CORP | d728849d8k.htm |
 Wells Fargo 2014 Specialty Finance Conference
May 21, 2014
Information is as of March 31, 2014 except as otherwise noted.
It should not be assumed that investments made in the future will
be profitable or will equal the performance of investments in this document.
Exhibit 99.1 |
 Disclaimers, Definitions, and Important Notes
1
Past Performance
Past performance is not indicative nor a guarantee of future returns,
the realization of which is dependent on many factors, many of which are beyond Apollo’s control. Net returns give effect to all fees and
expenses. Unless otherwise noted, information included herein is
presented as of the date indicated on the cover page and may change at any time without notice.
Forward-Looking Statements
We make forward-looking statements in this presentation and other
filings we make with the SEC within the meaning of Section 27A of the Securities Act of 1933, as amended, and Section 21E of the Securities
Exchange Act of 1934, as amended. Forward-looking statements are
subject to substantial risks and uncertainties, many of which are difficult to predict and are generally beyond our control. These forward-looking
statements include information about possible or assumed future results
of our business, financial condition, liquidity, results of operations, plans and objectives, including information about our ability to generate
attractive returns while attempting to mitigate risk. When used in this
release, the words "believe," "expect,” "anticipate," "estimate," "plan," "continue," "intend," "should," "may" or similar expressions, are
intended to identify forward-looking statements. Statements
regarding the following subjects, among others, may be forward-looking: the return on equity; the yield on investments; the ability to borrow to finance
The forward-looking statements are based on our beliefs,
assumptions and expectations of our future performance, taking into account all information currently available to us. Forward-looking statements are not
predictions of future events. These beliefs, assumptions and
expectations can change as a result of many possible events or factors, not all of which are known to us. Some of these factors are described in the
company's filings with the Securities and Exchange Commission. If a
change occurs, our business, financial condition, liquidity and results of operations may vary materially from those expressed in our forward-
looking statements. Any forward-looking statement speaks only as of
the date on which it is made. New risks and uncertainties arise over time, and it is not possible for us to predict those events or how they may
affect us. Except as required by law, we are not obligated to, and do
not intend to, update or revise any forward-looking statements, whether as a result of new information, future events or otherwise. This
Target IRR and MOIC
Targeted IRR is presented solely for the purpose of providing insight
into Apollo Investment Corporation’s (“AIC’s” or the “Fund’s) investment objectives, detailing its anticipated risk and reward characteristics
and for establishing a benchmark for future evaluation of the
Fund’s performance. Targeted IRR is not a predictor, projection or guarantee of future performance. There can be no assurance Apollo’s targets will be
met or that Apollo will be successful in finding investment
opportunities that meet these anticipated return parameters. There is no guarantee as to the quality of any investment or the adequacy of Apollo’s
methodology for estimating future returns. Target returns should
not be used as a primary basis for an investor’s decision to invest the Fund. Targeted returns are presented gross of all fees and expenses.
The multiple of investment cost (MOIC) is derived from dividing the sum
of the estimated remaining value and realized proceeds by the amount invested. The MOIC is presented gross and does not reflect the
effect of management fees, incentive compensation, certain expenses or
taxes.
Credit Rating Disclaimer
Apollo, its affiliates, and third parties that provide information to
Apollo, such rating agencies, do not guarantee the accuracy, completeness, timeliness or availability of any information, including ratings, and are
not responsible for any errors or omissions (negligent or otherwise),
regardless of the cause, or the results obtained from the use of such content. Apollo, its affiliates and third party content providers give no
express or implied warranties, including, but not limited to, any
warranties of merchantability or fitness for a particular purpose or use, and they expressly disclaim any responsibility or liability for direct, indirect,
incidental, exemplary, compensatory, punitive, special or consequential
damages, costs expenses, legal fees or losses (including lost income or profits and opportunity costs) in connection with the use of the
information herein. Credit ratings are statements of opinions and
not statements of facts or recommendations to purchase, hold or sell securities. They do not address the suitability of securities for investment
assets; and risks associated with investing in real
estate assets, including changes in business conditions and the general economy.
presentation may contain statistics and other data that in some cases
has been obtained from or compiled from information made available by third-party service providers.
purposes and should not be relied on as investment advice.
Neither Apollo nor any of its respective affiliates have any responsibility to update any of the information provided in this summary document. |
 Disclaimers, Definitions, and Important Notes
2
AUM Definition
Assets Under Management (“AUM”) – refers to the
investments we manage or with respect to which we have control, including capital we have the right to call from our investors pursuant to their capital
commitments to various funds. Our AUM equals the sum of: (i) the fair
value of our private equity investments plus the capital that we are entitled to call from our investors pursuant to the terms of their capital
commitments plus non-recallable capital to the extent a fund is
within the commitment period in which management fees are calculated based on total commitments to the fund; (ii) the net asset value of our capital
markets funds, other than certain senior credit funds, which are
structured as collateralized loan obligations or certain collateralized loan obligation and collateralized debt obligation credit funds that have a fee
generating basis other than mark-to-market asset values, plus
used or available leverage and/or capital commitments; (iii) the gross asset values or net asset values of our real estate entities and the structured portfolio
vehicle investments included within the funds we manage, which includes
the leverage used by such structured portfolio vehicles; (iv) the incremental value associated with the reinsurance investments of the
portfolio company assets that we manage; and (v) the fair value of any
other investments that we manage plus unused credit facilities, including capital commitments for investments that may require pre-qualification
before investment plus any other capital commitments available for
investment that are not otherwise included in the clauses above. Our AUM measure includes AUM for which we charge either no or nominal fees.
Our definition of AUM is not based on any definition of AUM contained
in our operating agreement or in any of our Apollo fund management agreements. We consider multiple factors for determining what should
be included in our definition of AUM. Such factors include but are not
limited to (1) our ability to influence the investment decisions for existing and available assets; (2) our ability to generate income from the
underlying assets in our funds; and (3) the AUM measures that we use
internally or believe are used by other investment managers. Given the differences in the investment strategies and structures among other
alternative investment managers, our calculation of AUM may differ from
the calculations employed by other investment managers and, as a result, this measure may not be directly comparable to similar measures
Important Notes Regarding the Use of Index Comparisons
There are significant differences between the Fund’s investments
and the indices described. For instance, the Fund may use leverage and invest in securities or financial instruments that have a greater degree of risk
and volatility, as well as less liquidity, than those securities
contained in the indices. Moreover, the indices do not reflect the reinvestment of income or dividends and the indices are not subject to any of the fees or
expenses of the Fund. It should not be assumed that the Fund will
invest in any specific securities that comprise the indices, nor should it be understood to mean there is a correlation between the Fund’s returns and
Index Definitions (Source: Bloomberg)
MSCI US REIT (RMZ) The MSCI US Reit Index is a price-only index,
which MSCI began calculating on June 20, 2005. Previously, this index (then known as the Morgan Stanley REIT Index) was calculated and
maintained by the AMEX. The AMEX began calculating the index with a
base level of 200, as of December 30, 1994.
S&P 500 (SPX) Standard and Poor's 500 Index is a
capitalization-weighted index of 500 stocks. The index is designed to measure performance of the broad domestic economy through changes in the aggregate
market value of 500 stocks representing all major industries. The index
was developed with a base level of 10 for the 1941- 43 base period.
NASDAQ Composite (CCMP) The NASDAQ Composite Index is a broad-based
capitalization-weighted index of stocks in all three NASDAQ tiers: Global Select, Global Market and Capital Market. The index was
developed with a base level of 100 as of February 5, 1971.
KBW Bank Index (BKX) The KBW Bank Index is a modified cap-weighted
index consisting of 24 exchange- listed and National Market System stocks, representing national money center banks and leading
regional institutions. The index is intended to reflect the evolving
financial sector and was developed with a base value of 250 as of October 21, 1991. Effective March 22, 2004, the index had a 10:1 split.
Financial Select SPDR (XLF) Financial Select Sector SPDR
Fund is an exchange-traded fund incorporated in the USA. The Fund's objective is to provide investment results that, before expenses, correspond to the
performance of The Financial Select Sector. The Index includes
financial services firms whose business' range from investment management to commercial & business banking.
presented by other investment managers.
the indices’ performance. The indices are included for
information purposes only. |
 Agenda
3
Introduction to Apollo Investment Corporation
BDC Industry Opportunity
Investment Portfolio & Strategy
Conclusion |
 Middle Market
Lender
Primarily provides debt solutions to U.S. middle market companies with a focus on
directly originated proprietary investments Target investment
characteristics: (i) commitment & hold size ranges from between $20 million and $250 million and (ii)
companies with annual revenues between $50 million and $2 billion
Since IPO in April 2004 and through March 31, 2014, invested $13.1 billion in 291
portfolio companies Publicly traded business development company
(“BDC”) (NASAQ: AINV) treated as a regulated investment company (“RIC”) for
tax purposes
Significant
Competitive
Advantages
Apollo affiliation provides significant
benefits -
expertise, investment
opportunities, market insights
Multi-channel sourcing capabilities
Able to invest in all levels of the capital
structure –
flexible mandate
Experienced management team
Investment grade credit ratings provide
favorable access to debt markets
(2)
Scale allows for underwriting larger
investments with commensurate hold
sizes
Externally
Managed by
Apollo Global
Management
Externally managed by an affiliate of Apollo Global Management, LLC, a
leading alternative asset manager with $159 billion of AUM
(3)
with expertise in private equity, credit and real estate
Apollo Global Management, LLC founded in 1990
Investment
Objective
Generate current income and capital appreciation
Risk-adjusted philosophy with emphasis on illiquid non-investment grade
debt Required
to
distribute
at
least
90%
of
net
investment
income
and
cumulative
net
realized
capital
gains
payable
each
year
$0.80
per
share
annual
dividend
(most
recent
quarterly
dividend
annualized)
(4)
Introduction to Apollo Investment Corporation
4
(1) At fair value. (2) See credit rating disclaimer at beginning of presentation. (3) See
definition of AUM at beginning of presentation. (4) There can be no assurances that AINV’s dividend will remain at the current level. |
 Company Snapshot
5
Select Financial Data
(1)
Investment Portfolio
$3.5 bn
# of Portfolio Companies
111
Debt Outstanding
$1.37 bn
Net Assets
$2.05 bn
Net leverage Ratio
(2)
0.68x
Net Asset Value Per Share
$8.67
Most Recent Quarterly
Dividend
(3)
$0.20
Market Information
(4)
Market Capitalization
$1.9 bn
Share Price
$8.06
Price-to-Book
0.93x
Dividend Yield
(5)
9.9%
LTM $494
~ 30% of portfolio in specialty verticals
35 different industries in portfolio
(1) As of March 31, 2014. (2) Net leverage ratio is defined as debt outstanding
plus payable for investments purchased and cash equivalents, plus due to custodian, less receivable for investments sold, less cash equivalents, less
cash, less foreign currency, divided by total net assets. (3) Declared a dividend of $0.20 per
common share on May 20, 2014 to stockholders of record as of June 20, 2014. (4) As of May 19, 2014. (5) Most recent quarterly dividend
annualized divided by share price. (6) At current costs. Exclusive of securities on
non-accrual status. (7) On a fair value basis. |
 Agenda
6
Introduction to Apollo Investment Corporation
BDC Industry Opportunity
Investment Portfolio & Strategy
Conclusion |
 The Evolution of BDCs
7
While still focused on U.S. middle market lending, many BDCs have
evolved into a more institutionalized business model with a
focus on sound risk management and increasing differentiation amongst
strategies. Asset Mix
Concentration
Average Investment % Equity
Average Investment % Equity
2.7%
1.9%
Funding & Leverage
Credit Ratings
Average Rating
Average Rating
Unrated
BBB
Valuation & Returns
Lower valuations despite improved
returns
Investment grade status facilitating
the issuance of long-term, unsecured
debt (including converts, institutional
& retail notes)
BDCs have reduced their exposure
to unsecured debt by about half
Increased reliance on term funding
with increased, but still low, leverage
as portfolios have ramped &
seasoned
BDCs has diversified their portfolios,
with less concentrated exposures
60%
30%
1%
9%
Secured debt
Unsecured debt
Structured products
Equity & other
63%
18%
9%
10%
Secured debt
Unsecured debt
Structured products
Equity & other
90%
0.47x
Revolver Borrowing % Total Debt
Debt-to-Equity Ratio
33%
0.68x
Revolver Borrowing % Total Debt
Debt-to-Equity Ratio
6%
1.09x
ROE
Price-to-Book
13%
1.04x
ROE
Price-to-Book
Based on major BDC peers public as of December 2007 (AINV, ARCC, BKCC,
PNNT and PSEC). Pre Financial Crisis as of December 31, 2007. Today as of March 31, 2014. Average investment size based on total investment
portfolio divided by number of portfolio companies. Credit Ratings
– see credit rating disclaimer at beginning of presentation. Return on Equity (ROE) based on LTM results. Price-to-Book based on average price vs. average
book value over LTM. Source: SNL, FactSet, Company data.
|
 Lending Environment & BDCs Filling the Void
8
$3.2
$7.0
$10.7
$16.2
$25.1
$19.7
$19.6
$25.1
$30.2
$36.5
$45.7
2003
2004
2005
2006
2007
2008
2009
2010
2011
2012
2013
5 year CAGR
18%
10 year CAGR
30%
Total
Assets
of
Publicly-Traded
BDCs
(in
billions)
(2)
$14.9
$14.0
2007
2013
Total Assets for Financial Firms (in trillions)
Decreased ~ $900
billion or 6%
$681
$335
2007
2013
Level 3 Assets for Financial Firms (in billions)
Decreased ~ $350
billion or 51%
(1) Financial firms include: Bank of America, Bear Stearns,
Citigroup , Countrywide Financial, Credit Suisse, Deutsche Bank, Goldman Sachs, JPMorgan, Merrill Lynch, Morgan Stanley, Washington Mutual and
Wells Fargo & Co . (2) Based on calendar year. Includes the
following BDCs: ACAS, ACSF, AINV, ARCC, BKCC, CMFN, CPTA, FDUS, FSC, FSFR, GAIN,GARS, GBDC, GLAD, GSVC, HCAP, HRZN, HTGC,
KCAP, KIPO, MAIN, MCC, MCGC, MRCC, MVC, NGPC, NMFC, OFS, PFLT, PNNT,
PSEC, SAR, SCM, SLRC, SUNS, TCAP, TCPC, TCRD, TICC, TINY, TPVG, TSLX and WHF. Source: Bloomberg.
A variety of recent bank regulations have driven large financial firms
to reduce assets. While BDCs have grown significantly, they
remain small relative to the contraction in bank credit, leaving them
with more room to run. |
 Regulatory Reform Is Changing the Lending Landscape
9
Key Dates
Description
Impact
Risk-based
Capital Ratios
Basel III
Phase-in
2015-2019
Higher risk weightings on non-investment grade
securities
Capital surcharge for SIFI’s
Common equity, Tier 1 and Total Capital ratios are
7.0%, 8.5% and 10.5%, respectively
SIFI buffer 1% to 2.5%
Supplementary
Leverage Ratio
Implementation
January 2018
Leverage ratio captures many off balance sheet
exposures including unfunded commitments
Capital surcharge for 8 U.S. global systemically
important banks (“G-SIBs”) and their U.S. insured
depository institutions (“IDI”)
At least 5% for GSIBs and 6% for IDI subsidiaries
vs. 3% for others
Leveraged
Lending
Guidance
Guidance Effective
May 2013
More Specific
Guidelines Issued
December 2013
Annual
Reviews
Expected
to Begin
May 2014
Increases universe of what is considered a
leveraged
loan
Establishes minimum lending standards
Changes
in “criticized loan”
rules may make
underwriting higher leverage transactions (i.e. LBOs)
more difficult for the largest banks
‘No exceptions policy’
on new issuance
Leveraged
lending definition:
Senior Debt-to-EBITDA > 3:1
Total Debt-to EBITDA > 4:1
Loans levered > 6x considered “criticized”
50% repayment standard over 5 to 7 year period
Regulators monitoring covenant
-lite and PIK-toggle
structures
Risk Retention
Rules
Expected
to be
finalized by
end of 2015
Requires CLO managers to retain an economic
interest without selling or hedging for the life of the
securitization
Manager must own 5% of securitization or some
percentage of each underlying
loan
The Volcker
Rule
Finalized
December 2013
Implementation
July 2017
Prohibits banks from sponsoring a covered fund
(e.g., hedge fund, private equity fund)
Limits banks’
fund ownership interest
Banks may not invest more than 3% of Tier 1 capital
in covered
funds
Banks cannot represent
more than 3% of the total
capital of a given covered fund
We believe the evolving bank regulatory environment will limit banks’ willingness and / or
ability to make leveraged loans, which should result in new opportunities for non-bank
capital providers, such as BDCs |
 10
Comparison & Composition of Returns
across Financial Institutions
BDCs generally generate
superior yields from their
balance sheet, with
comparable (or better)
credit losses
BDC expenses are generally
lower than those of other
financial institutions leading
to significantly higher ROAs
BDC generally operate with
significantly lower leverage,
with the potential for
superior ROEs on both an
absolute and risk-adjusted
basis
“Net revenue” is revenue net of both interest expense and
credit items. “Credit items” include all loan loss provisions, securities impairments, gain or loss on sale of loans and available-for-sale securities and other
dispositions. “Expenses” exclude interest expense;
advisory fees include management and incentive fees paid by externally-managed BDCs. Capital markets banks include GS, MS, BAC, C, JPM, WFC. Regional banks include
136 banks with assets between $2 billion and $10 billion. Based on
last 12 months of results. |
 Agenda
Introduction to Apollo Investment Corporation
BDC Industry Opportunity
Investment Portfolio & Strategy
Conclusion
11 |
 Investment Process
12
Experienced investment team
31 Opportunistic Credit
investment professionals
with avg 13 years of
experience
Ability to execute direct / non-
sponsor transactions with a
focus on specialty verticals
Financial sponsors
Long-term relationships
Transactions with > 100
sponsors
53% of portfolio is
sponsored-backed
(1)
No origination restrictions
Apollo affiliation
Coverage and experience
Market insights
Proprietary research
Apollo’s credit segment AUM
~$101 billion
(2)
Risk-adjusted investment
philosophy
Preservation of capital
Strong asset coverage
Extensive due diligence
Knowledge sharing across
Apollo platform
Access to management
teams of private equity
portfolio companies
Draft term sheet
Investment Committee Review
Iterative process
Extensive quarterly portfolio
reviews
Internal risk rating system
Covenant compliance
Board observation rights
Independent 3rd party valuation
for non-quoted investments
Provide managerial assistance
Increased monitoring of
problem investments
Watch list committee
Generally seek to:
Negotiate transaction
Structuring and terms
Strong covenants, collateral
package, prepayment
protection, Board seat or
observation rights
Seek Investment Committee
approval
Weekly meetings to discuss
and vote on new deals
Comprised of senior
personnel from across Apollo
Multi-Channel
Sourcing Engine
Focus on Risk-Adjusted
Returns
Protect Downside Risk
Comprehensive and Regular
Review and Dialog
(1) At fair value. (2) As of March 31, 2014. See
definition of AUM at beginning of presentation. Deal Sourcing
Underwriting & Due
Diligence
Structuring, Pricing &
Approval
Portfolio Monitoring
Dedicated professionals for
managing problem
investments
limit borrower concentration
to <5%
limit industry concentration
to <10% |
 Portfolio Positioning
13
Reduced
Borrower
Concentration
(1)
Yield
on
Debt
Portfolio
(3)
Improved
Credit
Quality
(2)
Developed
Specialty
Verticals
(1)
Specialty Verticals as % of Portfolio
Focus
on
Floating
Rate
(1)
Floating Rate as % of Debt Portfolio
Emphasis
on
Secured
Lending
(1)
Secured Debt as % of Portfolio
(1) On a fair value basis. (2) Source: company data.
Includes all portfolio company investments except structured products, common equities and warrants. Also excludes select investments where debt-to-EBITDA is not a
relevant average metric or data is not available. Metrics at close
and weighted average by cost. (3) Weighted average, at current cost, exclusive of securities on non-accrual status. |
 Industry Fundamentals
Strategy
%
Portfolio
Yield
(1)
Target
Returns
Oil & Gas
5x increase in annual capital
spending to develop shale
resources
Traditional capital providers
have reduced exposure
Houston office
Secured lending against North
American producing upstream oil
and gas reserves (PDPs)
Apollo’s Natural Resources
platform provides additional
support
11.8%
12.5%
15-25% IRR
and 1.4x
MOIC over a
2+ year hold
(2)
Aircraft
Leasing
Positive trends of passenger
traffic growth, air traffic has
grown roughly 2x GDP
Movement of aircraft from
airlines’
balance sheets to
dedicated lessor balance
sheets
35% of global fleet under
operating lease
Dedicated portfolio company
(Merx Aviation)
Generally targeting used current
generation Boeing and Airbus
commercial aircraft
12.2%
12.0%
Mid-teen
return with
good
downside
protection
Structured
Products
(3)
Regulatory reform prompting
financial institutions to
decrease exposure to certain
assets, including middle
market loans
Strategic relationships with
middle market loan originators
Broaden exposure to diversified
portfolios of directly originated
middle market loans
Apollo’s Structured Credit Group
provides additional support
5.5%
13.5%
14% -
19%
Total Specialty Verticals
29.5%
12.5%
Specialty Verticals
We have been expanding our capabilities in select industries 1) with a
strong demand for capital, 2) where traditional capital has fled,
3) with significant barriers to entry, and 4) in which the Apollo
platform has expertise. 14
(1) As of March 31, 2014. At current cost. On yielding
investments.. (2) See disclaimer at beginning of presentation for important information regarding target returns and MOIC. (3) Excludes Other. |
 How We Are Investing in the Current Environment
15
(1) Source: S&P Capital IQ and Bloomberg. (2)
Other includes exit financing, general recap, corporate purpose, DIP, cap ex and IPO. (3) BofA Merrill Lynch US High Yield Indices.
Loan volume
increasing, but still well
below pre-crisis levels
Meaningful recent pick
up in sponsor activity
while refinancing
remains elevated
Loan pricing trending
down, but spread
between middle market
and large corporate
issuers widened
Credit spreads continue
to compress but remain
above pre-credit crisis
levels
With this market
backdrop, we are focused
on opportunities that are:
unrated
illiquid
complex
2
4
4
3
1
1
2
3 |
 Introduction to Apollo Investment Corporation
BDC Industry Opportunity
Investment Portfolio & Strategy
Conclusion
Agenda
16 |
 Strategic Priorities
Remain prudent, selective and opportunistic
Continue to identify mispriced risk
Pursue opportunities emerging from bank
regulation
Continue to optimize portfolio
Redeploy lower yielding assets
Increase exposure to floating rate assets
Optimize usage of non-qualified assets
Develop additional specialty verticals
17
9.9%
3.7%
2.0%
1.3%
1.9%
1.6%
AINV (1)
MSCI US REIT Index
(RMZ Index)
S&P 500
NASDAQ Composite
KBW Bank Index
Financial Select Sector SPDR (Fund) (XLF)
Dividend Yield for Alternative Investments
(2) (3)
(1) There can be no assurances that AINV’s dividend will remain at the current
level. (2) As of May 19, 2014. (3) See important note regarding indices on Disclaimer page at beginning of presentation. |
 Appendices
18 |
 Financial Highlights
$ in thousands, except per share amount
OPERATING RESULTS
Three months ended
March 31, 2014
Three months ended
December 31, 2013
Three months ended
September 30, 2013
Three months ended
June 30, 2013
Three months ended
March 31, 2013
Net investment income
$49,612
$49,683
$49,586
$52,367
$42,066
Net realized and unrealized gain (loss) on assets
$20,293
$56,055
$26,839
$(33,563)
$23,755
Net increase in net assets from operations
$96,905
$105,738
$76,425
$18,804
$65,821
Net investment income per share
$0.22
$0.22
$0.22
$0.25
$0.21
Net realized and unrealized gain (loss) per share
$0.09
$0.25
$0.12
$(0.16)
$0.12
Earnings
per
share
–
basic
(1)
$0.31
$0.47
$0.34
$0.09
$0.32
Earnings
per
share
–
diluted
(2)
$0.30
$0.45
$0.33
$0.09
$0.31
Dividend declared per common share
$0.20
$0.20
$0.20
$0.20
$0.20
19
SELECT BALANCE SHEET DATA
March 31, 2014
December 31, 2013
September 30, 2013
June 30, 2013
March 31, 2013
Investment portfolio
$3.48 billion
$3.18 billion
$3.03 billion
$3.04 billion
$2.85 billion
Debt outstanding
$1.37 billion
$1.26 billion
$1.08 billion
$1.13 billion
$1.16 billion
Net assets
$2.05 billion
$1.93 billion
$1.86 billion
$1.83 billion
$1.68 billion
Net asset value per share
$8.67
$8.57
$8.30
$8.16
$8.27
Debt-to-equity
0.67 x
0.66 x
0.58 x
0.61 x
0.69 x
Net leverage ratio
(3)
0.68 x
0.65 x
0.62 x
0.66 x
0.70 x
(1) Numbers may not sum due to rounding. (2) In applying the
if-converted method, conversion shall not be assumed for purposes of computing diluted EPS if the effect would be anti-dilutive. (3) The Company’s net leverage ratio is
defined as debt outstanding plus payable for investments purchased and
cash equivalents, plus due to custodian, less receivable for investments sold, less cash equivalents, less cash, less foreign currency, divided by total net assets. |
 Financial Highlights (continued)
PORTFOLIO ACTIVITY
(1)
Three months ended
March 31, 2014
Three months ended
December 31, 2013
Three months ended
September 30, 2013
Three months ended
June 30, 2013
Three months ended
March 31, 2013
Investments made during period
$986 million
$630 million
$412 million
$788 million
$428 million
Investments sold
$(323) million
$(293) million
$(284) million
$(105) million
$(98) million
Net investment activity before repayments
$663 million
$337 million
$127 million
$683 million
$330 million
Investments repaid
$(404) million
$(251) million
$(186) million
$(475) million
$(131) million
Net investment activity
$259 million
$86 million
$(59) million
$208 million
$199 million
Number of new portfolio companies
26
21
12
23
10
Number of investments in existing portfolio companies
18
22
18
23
9
Number of exited portfolio companies
16
13
13
10
2
Number of portfolio companies at period end
111
101
93
94
81
WEIGHTED AVERAGE YIELDS
(2)
March 31, 2014
December 31, 2013
September 30, 2013
June 30, 2013
March 31, 2013
Secured debt
10.8%
11.3%
11.1%
11.4%
11.2%
Unsecured debt
11.5%
11.5%
11.7%
11.8%
12.7%
Total debt portfolio
11.1%
11.4%
11.3%
11.6%
11.9%
Portfolio Composition
(fair value)
March 31, 2014
December 31, 2013
September 30, 2013
June 30, 2013
March 31, 2013
1
st
lien
27%
27%
27%
22%
16%
2
nd
lien
29%
24%
25%
26%
28%
Total secured debt
56%
51%
52%
48%
44%
Unsecured debt
27%
32%
34%
39%
43%
Structured products and other
6%
7%
6%
6%
7%
Preferred equity
3%
3%
N/M
N/M
N/M
Common equity and warrants
8%
7%
8%
7%
6%
20
(1) Numbers may not sum due to rounding.(2) On a cost basis, exclusive
of investments on non-accrual status. |
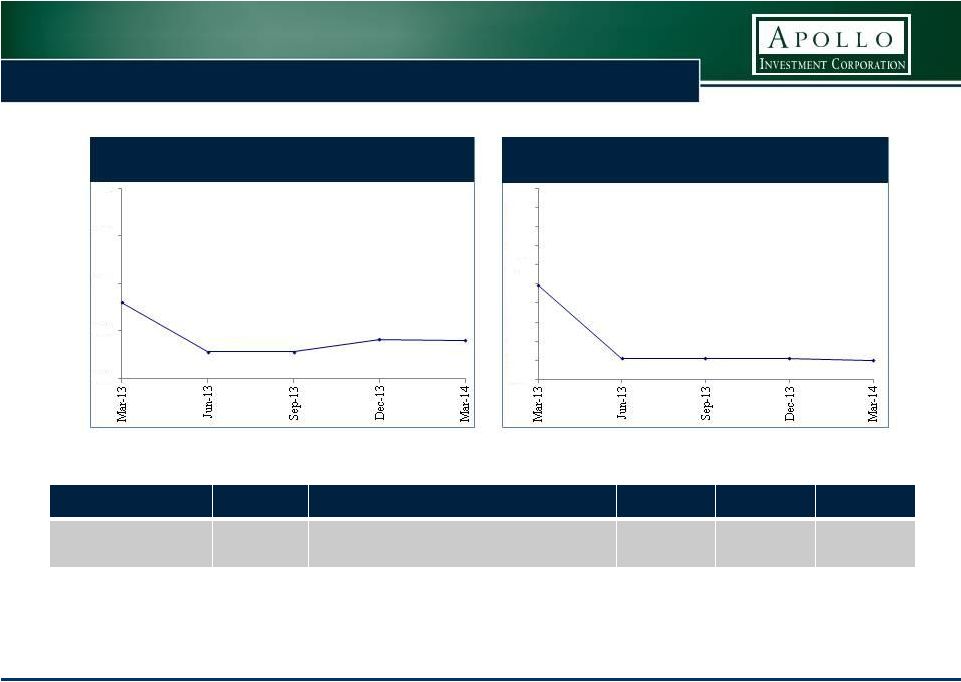
 Despite the high level of purchases, sales, and repayments over the
past year and a half, we have generally been able to maintain
the portfolio yield by shifting into more senior less liquid assets.
Investment Activity and Yields
21
Note: Numbers may not sum due to rounding. (1) Based on debt
investments on current cost basis. (2) On total debt portfolio, exclusive of investments on non-accrual status.
LTM
New Investments
2,816
$
Sales
(1,006)
$
Repayments
(1,316)
$
Net Investment Activity
494
$
$428
$788
$412
$630
$986
($98)
($105)
($284)
($293)
($323)
($131)
($475)
($186)
($251)
($404)
Mar-13
Jun-13
Sep-13
Dec-13
Mar-14
New Investments
Sales
Repayments
Quarterly Investment Activity (in $ millions)
11.8%
11.9%
11.6%
11.3%
11.4%
11.1%
11.5%
10.5%
10.4%
10.6%
10.1%
11.7%
10.0%
10.3%
9.4%
9.9%
12.3%
13.4%
11.9%
11.9%
Mar-13
Jun-13
Sep-13
Dec-13
Mar-14
Portfolio Yield (eop) (2)
New Investments
Sales
Repayments
Yield on Investment Activity
(1) |
 22
Leverage Ratio
We have consistently operated within our target leverage range of 0.50x
to 0.75x over the past five quarters. The target leverage
range considers the impact of a potential market shock to the fair
value of the portfolio, and the potential funding of off balance sheet
arrangements, while adhering to our regulatory asset coverage
requirement. 0.69 x
0.61 x
0.58 x
0.66 x
0.67 x
0.70 x
0.66 x
0.62 x
0.65 x
0.68 x
0.45 x
0.50 x
0.55 x
0.60 x
0.65 x
0.70 x
0.75 x
0.80 x
Mar-13
Jun-13
Sep-13
Dec-13
Mar-14
Debt
-to-equity
Net Leverage Ratio (1)
Leverage Ratio
Average
Debt-to-equity
0.64x
Net Leverage Ratio
0.64x
(1)
The Company’s net leverage ratio is defined as debt outstanding
plus payable for investments purchased and cash equivalents, plus due to custodian, less receivable for investments sold, less cash equivalents, less cash
less foreign currency, divided by total net assets.
|
 Diversification of Funding Sources
Funding Sources
Facility Size
(2)
Interest Rate
Final
Maturity
Date
SENIOR SECURED
FACILITY
$602 million
outstanding
($1.25 billion
commitments)
LIBOR + 200 bps
with no LIBOR floor
Aug-2018
(3)
SENIOR SECURED
NOTES
$225 million
6.25%
Oct-2015
$29 million
(Series A)
5.875%
Sep-2016
$16 million
(Series B)
6.25%
Sep-2018
2042 SENIOR
UNSECURED NOTES
$150 million
6.625%
Oct-2042
2043 SENIOR
UNSECURED NOTES
$150 million
6.875%
July-2043
CONVERTIBLE NOTES
$200 million
5.75%
Jan-2016
TOTAL DEBT
OUTSTANDING
$1,372 million
The weighted average annual interest cost for the year ended March 31,
2014 was 4.95%.
(1)
23
$1,677
$1,833
$1,865
$1,925
$2,052
$150
$300
$300
$300
$300
$200
$200
$200
$200
$200
$536
$355
$312
$491
$602
$270
$270
$270
$270
$270
$2,833
$2,958
$2,947
$3,186
$3,424
$0
$500
$1,000
$1,500
$2,000
$2,500
$3,000
$3,500
Mar-13
Jun-13
Sep-13
Dec-13
Mar-14
Retail Unsecured Notes
Convertible Unsecured Notes
Credit Facility (drawn)
Senior Secured Notes
Funding Sources
(1) Exclusive of 0.57% for amortization of debt issuance costs.
(2) As of March 31, 2014. (3) The facility will begin to amortize in August 2017. |
 Access to Apollo Global Management, LLC Platform
24
Principal Investment Businesses
(1)
(1)
See
definition
of
AUM
at
the
beginning
of
the
presentation.
Numbers
are
approximate.
As
of
March
31,
2014.
Includes
both
fee-generating
and
non-fee
generating
AUM.
Includes
$1.1
billion
of
commitments
that
have
yet to be deployed to an Apollo fund. (2) Includes funds and
strategic investment vehicles that are denominated in Euros and translated into U.S. dollars at an exchange rate of €1.00 to $1.38 as of March 31, 2014.
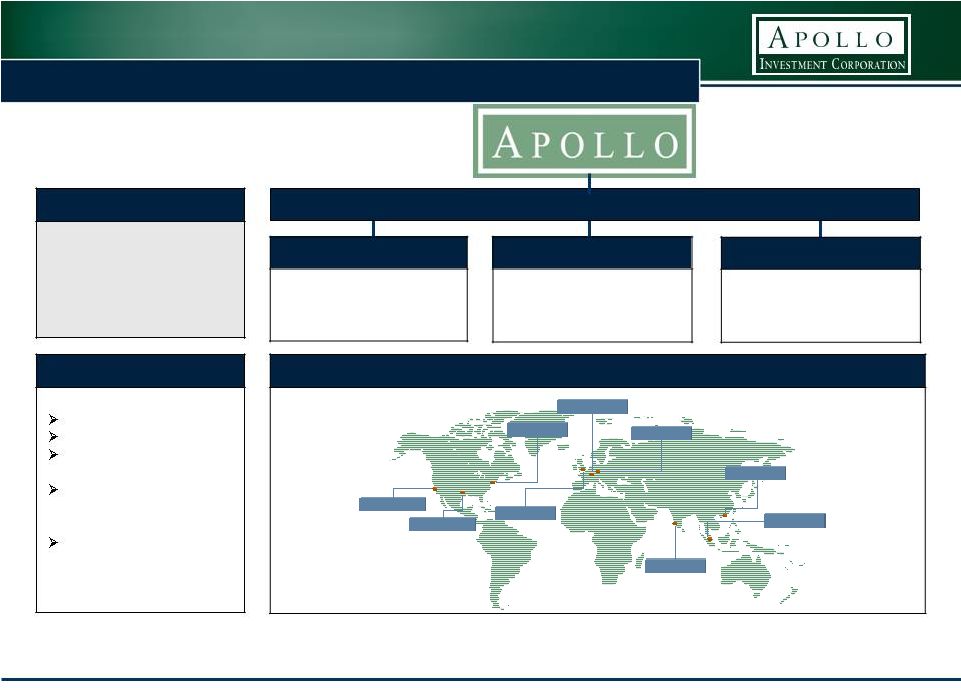
Los Angeles
New York
London
Singapore
Frankfurt
Luxembourg
Mumbai
Hong Kong
Houston
Global Footprint
Investment Approach
Value-oriented
Contrarian
Integrated investment
platform
Opportunistic across
market cycles and capital
structures
Focus on nine core
industries
Firm Profile
(1)
Founded:
1990
AUM:
$159
bn
Employees:
761
Inv. Prof.:
302
Private Equity
$48bn
AUM
Credit
(2)
$101bn
AUM
Real Estate
$9bn
AUM |
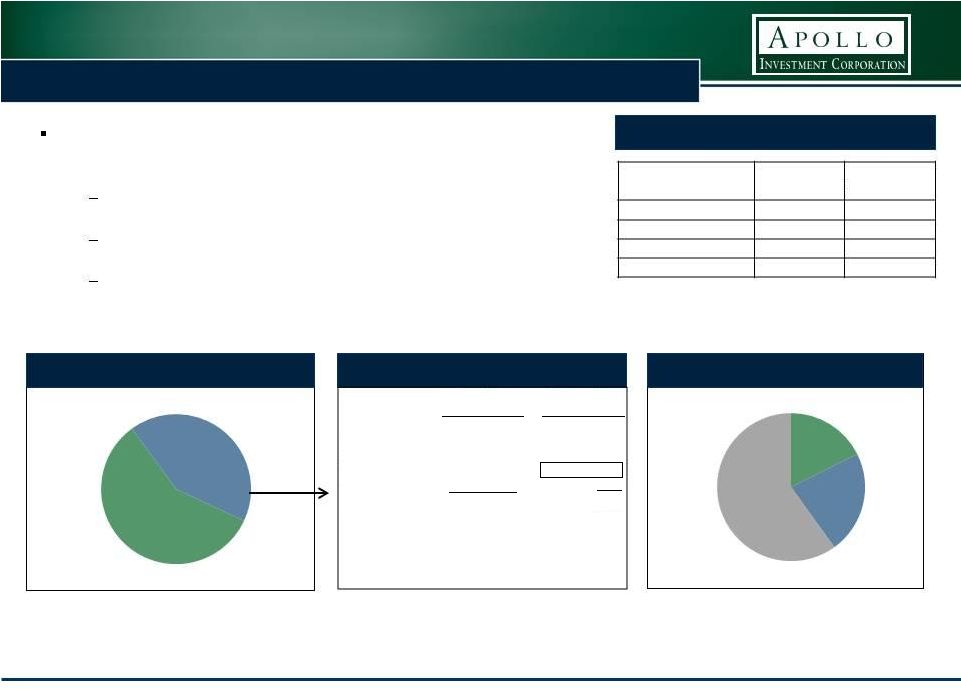 Interest Rate Exposure
25
(1) On a fair value basis. (2) Income-bearing investment
portfolio. Interest Rate Sensitivity
AIC has taken several steps to prepare its balance sheet for higher
interest rates by having a significant portion of its portfolio
in floating rate assets and issuing fixed rate debt.
$1.3 billion or 42% of the income-bearing portfolio was floating
rate at 3/31/14 up from 39% at 12/31/13
(1)
Issued $150 million of 30-year fixed rate senior unsecured notes
during the fiscal year
only 18% of funding sources (the drawn portion of the revolving
credit facility) are directly sensitive to interest rates
Floating Rate Debt Floor Breakdown
(1) (2)
Fixed
Rate
58%
Floating
Rate
42%
Investment Portfolio
(1) (2)
Floating
Rate
Credit
Facility
18%
Fixed
Rate
Debt
22%
Common
Equity
60%
Funding Sources
Basis Point Change
Annual Net
Income
(in thousands)
Annual
Net
Income per Share
Up
400
basis
points
$21,748
$0.092
Up
300
basis
points
$15,874
$0.067
Up
200
basis
points
$10,583
$0.045
Up
100
basis
points
$(510)
$(0.002)
Fair Value
($ millions)
% of Floating
Rate Portfolio
No Floor
31
3%
< 1.25%
507
40%
>1.25% to < 1.75%
550
43%
>1.75
177
14%
Total
1,265
100% |
 Investments on Non-Accrual Status
26
Company
Industry
Investment
Par Amount
(000’s)
Cost
(000’s)
Fair Value
(000’s)
Gryphon Colleges Corporation
(Delta Educational Systems)
(2 investments)
Education
Preferred Stock, 13.50% PIK
Preferred Stock, 12.50% PIK
N/A
$34,549
$13,802
Investments on non-accrual status as of March 31, 2014
0.8%
0.3%
0.3%
0.4%
0.4%
0.0%
0.5%
1.0%
1.5%
2.0%
Percentage of Portfolio on Non
-Accrual Status
(based on fair value)
4.9%
1.1%
1.1%
1.1%
1.0%
0.0%
1.0%
2.0%
3.0%
4.0%
5.0%
6.0%
7.0%
8.0%
9.0%
10.0%
Percentage of Portfolio on Non
-Accrual Status
(based on cost) |
 Target Play (Location)
Williston Basin (aka Bakken)
Permian Basin (aka Bone
Spring)
Utica (American Energy)
Gulf of Mexico (Bennu)
Mississippian Play
Woodbine (East Texas)
Alaska -
North Slope and
Cook Inlet
Building Specialist Origination: Oil & Gas
27
Compelling Industry Fundamentals
5x increase (from $50 billion to $250 billion in 10 years) in
annual capital spending to develop shale resources
Many capital providers to energy industry have reduced
exposure (e.g., banks and hedge funds) since the 2008-09
financial crisis
Total US and global oil and gas capex 1972-present
(1)
Investment Thesis / Strategy
Focus on secured lending against North American
producing upstream oil and gas reserves
Emphasis on significant asset coverage
using
downside case assumptions
Lend against
PDPs
producing reserves) rather than PUDs (proved
un-developed reserves) or acreage
First lien, perfected mortgages on real property
interest
Exploitation rather than exploration
Structured with enhanced financial covenants
Strong upside participation through equity kicker
Mezzanine-like returns with “first dollar”, senior risk
Target Returns: 15-25% IRR and >1.5x MOIC
over a 2+ year hold
(2)
Target Investment Size: $20 to $100 million
Require borrowers to hedge ~75% of expected PDP
production for 2
-3 years
Leverage
Apollo
Natural
Resource
Partners’
private
equity
team / platform
(1) Source: CitiResearch. (2) See disclaimer at beginning of presentation for important
information regarding target returns and MOIC.
(proved developed
US Oil & Gas Total Capital Expenditures in
2010$ (lhs)
Total Global Spending by Top 9 Majors in
2010$ (rhs)
$bn
Previous peak in 1981:
$200bn
Current peak in 2012:
$302bn
6-fold increase in
capex spending
at same time
as 3-4 fold
increase in
costs
0
50
100
150
200
250
300
350
0
20
40
60
80
100
120
140
160
180
200
$bn |
 Investment Thesis / Strategy
Generally targeting used current generation Boeing and Airbus
commercial aircraft that remain in demand and / or have engine
commonality with a larger worldwide fleet
–
Target mid-teen returns with strong downside protection
(2)
–
Older aircraft transactions expected to be protected by the
underlying “metal”
value
of the aircraft
Average transaction size expected to range from $15 to $50 million,
depending on number and age of the aircraft; transaction timeframes will
vary widely but generally target 3 -
5 years
Without a central clearinghouse for aircraft trading the market is
inefficient, so nimbly deploying an opportunistic, transaction driven
strategy while leveraging strong relationships and specialized knowledge
creates attractive investment opportunities
Total aircraft strategy could grow to be ~10% of portfolio
Favorable Industry Dynamics
Building Specialist Origination: Aircraft Leasing
We
established
an
operating
subsidiary
–
Merx
Aviation
Finance,
LLC
–
to
participate
in
aircraft
leasing
transactions
which
is
led
by an experienced aircraft investment team.
We
believe
AIC’s
participation
in
the
aircraft
leasing
space
is
expected
to
provide
“mezzanine-like”
returns
with better than “mezzanine-like”
downside protection
Global air traffic has grown at roughly 2x global GDP and is expected
to continue to grow at a similar rate
(1)
–
Emerging
markets,
including
China
and
India,
are
expected
to
drive future growth
(1)
–
To support the increased air traffic, commercial aircraft fleet
has doubled
over last 20 years and is expected to double over
next 20 years
(1)
–
Stabilizes the value of older aircraft which must keep flying to
service enhanced aircraft demands
Movement of aircraft from airlines’
balance sheets to dedicated
lessor
balance
sheets
–
~ 35% of the global aircraft fleet is currently under operating
leases,
up by a factor of 7 over the last 20 years
(1)
–
Demand for use of operating leases by airlines is increasing
as airlines seek (i) to free-up capital, (ii) focus on core
competency of operating flights, and (iii) transfer / reduce residual
risk
(1)
Traditional capital providers to the space
(other than new deliveries)
have
been
pulling
back,
providing
an
attractive
capital
entry
point
–
Notable participants who have shrunk their balance sheets
recently include European banks and large investment banks,
which have pulled back from the used aircraft market as capital
requirements have increased
28
(1) Source: Deutsche Bank research. (2) See disclaimer at
begnning of presentation for important information regarding target returns. |