Attached files
| file | filename |
|---|---|
| EX-32.2 - EX-32.2 - APOLLO INVESTMENT CORP | d529765dex322.htm |
| EX-31.1 - EX-31.1 - APOLLO INVESTMENT CORP | d529765dex311.htm |
| EX-32.1 - EX-32.1 - APOLLO INVESTMENT CORP | d529765dex321.htm |
| EX-11.1 - EX-11.1 - APOLLO INVESTMENT CORP | d529765dex111.htm |
| EX-31.2 - EX-31.2 - APOLLO INVESTMENT CORP | d529765dex312.htm |
Table of Contents
UNITED STATES
SECURITIES AND EXCHANGE COMMISSION
WASHINGTON, D.C. 20549
FORM 10-K
| x | ANNUAL REPORT PURSUANT TO SECTION 13 OR 15(d) OF THE SECURITIES EXCHANGE ACT OF 1934 |
FOR THE FISCAL YEAR ENDED MARCH 31, 2013
OR
| ¨ | TRANSITION REPORT PURSUANT TO SECTION 13 OR 15(d) OF THE SECURITIES EXCHANGE ACT OF 1934 |
FOR THE TRANSITION PERIOD FROM TO
COMMISSION FILE NUMBER: 814-00646
APOLLO INVESTMENT CORPORATION
(Exact name of registrant as specified in its charter)
| Maryland | 52-2439556 | |
| (State of Incorporation) | (I.R.S. Employer Identification Number) | |
| 9 West 57th Street New York, N.Y. |
10019 | |
| (Address of principal executive offices) | (Zip Code) | |
Registrant’s telephone number, including area code: (212) 515-3450
Securities registered pursuant to Section 12(b) of the Act:
| Title of Each Class | Name of Each Exchange on Which Registered | |
| Common Stock, par value $0.001 per share |
The NASDAQ Global Select Market |
Securities registered pursuant to Section 12(g) of the Act: None
Indicate by check mark if the registrant is a well-known seasoned issuer, as defined in Rule 405 of the Securities Act. Yes ¨ No x
Indicate by check mark if the registrant is not required to file reports pursuant to Section 13 or Section 15(d) of the Act. Yes ¨ No x
Indicate by check mark whether the Registrant (1) has filed all reports required to be filed by Section 13 or 15(d) of the Securities Exchange Act of 1934 during the preceding 12 months (or for such shorter period that the Registrant was required to file such reports), and (2) has been subject to such filing requirements for the past 90 days. Yes x No ¨
Indicate by check mark whether the registrant has submitted electronically and posted on its corporate Web site, if any, every Interactive Data File required to be submitted and posted pursuant to Rule 405 of Regulation S-T during the preceding 12 months (or for such shorter period that the registrant was required to submit and post such files). Yes ¨ No ¨
Indicate by check mark if disclosure of delinquent filers pursuant to Item 405 of Regulation S-K is not contained herein, and will not be contained, to the best of Registrant’s knowledge, in definitive proxy or information statements incorporated by reference in Part III of this Form 10-K or any amendment to this Form 10-K. ¨
Indicate by check mark whether the registrant is a large accelerated filer, an accelerated filer, a non-accelerated filer, or a smaller reporting company. See the definitions of “large accelerated filer,” “accelerated filer” and “smaller reporting company” in Rule 12b-2 of the Exchange Act.
| Large accelerated filer x |
Accelerated filer ¨ | Non-accelerated filer ¨ | Smaller Reporting Company ¨ |
Indicate by check mark whether the registrant is a shell company (as defined in Rule 12b-2 of the Act) Yes ¨ No x
The aggregate market value of common stock held by non-affiliates of the Registrant on September 28, 2012 based on the closing price on that date of $7.88 on the NASDAQ Global Select Market was approximately $1.5 billion. For the purposes of calculating this amount only, all directors and executive officers of the Registrant have been treated as affiliates. There were 224,741,351 shares of the Registrant’s common stock outstanding as of May 22, 2013.
Portions of the registrant’s Proxy Statement for its 2013 Annual Meeting of Stockholders to be filed not later than 120 days after the end of the fiscal year covered by this Annual Report on Form 10-K are incorporated by reference into Part III of this Form 10-K.
Table of Contents
APOLLO INVESTMENT CORPORATION
FORM 10-K
FOR THE FISCAL YEAR ENDED MARCH 31, 2013
| Page | ||||||
| PART I | ||||||
| Item 1. | 1 | |||||
| Item 1A. | 9 | |||||
| Item 1B. | 32 | |||||
| Item 2. | 33 | |||||
| Item 3. | 33 | |||||
| Item 4. | 33 | |||||
| PART II | ||||||
| Item 5. | 34 | |||||
| Item 6. | 37 | |||||
| Item 7. | Management’s Discussion and Analysis of Financial Condition and Results of Operations |
38 | ||||
| Item 7A. | 51 | |||||
| Item 8. | 52 | |||||
| Item 9. | Changes in and Disagreements With Accountants on Accounting and Financial Disclosure |
99 | ||||
| Item 9A. | 99 | |||||
| Item 9B. | 99 | |||||
| PART III | ||||||
| Item 10. | Directors, Executive Officers and Corporate Governance | 100 | ||||
| Item 11. | 104 | |||||
| Item 12. | Security Ownership of Certain Beneficial Owners and Management and Related Stockholder Matters |
105 | ||||
| Item 13. | Certain Relationships and Related Transactions, and Director Independence |
107 | ||||
| Item 14. | 107 | |||||
| PART IV | ||||||
| Item 15. | 109 | |||||
| 111 | ||||||
Table of Contents
Apollo Investment Corporation
Apollo Investment Corporation (“Apollo Investment,” “Company,” “AIC,” “we,” “us,” and “our”), a Maryland corporation organized on February 2, 2004, is a closed-end, externally managed, non-diversified management investment company that has elected to be treated as a business development company (“BDC”) under the Investment Company Act of 1940 (the “1940 Act”). In addition, for tax purposes we have elected to be treated as a regulated investment company (“RIC”), under the Internal Revenue Code of 1986, as amended (the “Code”).
Our investment objective is to generate current income and capital appreciation. We invest primarily in various forms of debt investments including secured and unsecured loans, mezzanine investments and/or equity in private middle market companies. We may also invest in the securities of public companies and structured products such as collateralized loan obligations.
Our portfolio is comprised primarily of investments in debt, including secured, unsecured and mezzanine debt of private middle-market companies that, in the case of senior secured loans, generally are not broadly syndicated and whose aggregate tranche size is typically less than $250 million. Our portfolio also includes equity interests such as common stock, preferred stock, warrants or options. In this Form 10-K, we use the term “middle-market” to refer to companies with annual revenues between $50 million and $2 billion. While our investment objective is to generate current income and capital appreciation through investments in U.S. secured and unsecured loans, other debt securities and equity, we may also invest a portion of the portfolio in other investment opportunities, including foreign securities and structured products. Most of the debt instruments we invest in are unrated or rated below investment grade, which is an indication of size, credit worthiness and speculative nature relative to the capacity to pay interest and principal.
Apollo Investment Management, L.P. (“AIM”) is our investment adviser and an affiliate of Apollo Global Management, LLC, and its consolidated subsidiaries (“AGM”). AGM and other affiliates manage other funds that may have investment mandates that are similar, in whole or in part, with ours. AIM and its affiliates may determine that an investment is appropriate both for us and for one or more of those other funds. In such event, depending on the availability of such investment and other appropriate factors, AIM may determine that we should invest on a side-by-side basis with one or more other funds. We make all such investments subject to compliance with applicable regulations and interpretations, and our allocation procedures. In certain circumstances negotiated co-investments may be made only if we receive an order from the SEC permitting us to do so. There can be no assurance that any such order will be obtained.
During our fiscal year ended March 31, 2013, we invested $1.5 billion across 49 new and 36 existing portfolio companies through a combination of primary and secondary market purchases. This compares to $1.5 billion across 21 new and 18 existing portfolio companies for the previous fiscal year ended March 31, 2012. Investments sold or repaid during the fiscal year ended March 31, 2013 totaled $1.3 billion versus $1.6 billion for the fiscal year ended March 31, 2012. The weighted average yields on our secured loan portfolio, unsecured debt portfolio and total debt portfolio as of March 31, 2013 at our current cost basis were 11.2%, 12.7% and 11.9%, respectively. At March 31, 2012, the yields were 10.2%, 12.7% and 11.9%, respectively.
Our targeted investment size typically ranges between $20 million and $250 million, although this investment size may vary proportionately as the size of our available capital base changes. At March 31, 2013, our net portfolio consisted of 81 portfolio companies and was invested 44% in secured debt, 43% in unsecured debt, 7% in structured products, 0% in preferred equity and 6% in common equity and warrants measured at fair value versus 62 portfolio companies invested 32% in secured debt, 57% in unsecured debt, 3% in structured products, 1% in preferred equity and 7% in common equity and warrants at March 31, 2012.
1
Table of Contents
Since the initial public offering of Apollo Investment in April 2004 and through March 31, 2013, invested capital totaled $10.3 billion in 215 portfolio companies. Over the same period, Apollo Investment completed transactions with more than 100 different financial sponsors.
At March 31, 2013, 64% or $1.6 billion of our income-bearing investment portfolio is fixed rate debt and 36% or $0.9 billion is floating rate debt, measured at fair value. On a cost basis, 65% or $1.6 billion of our income-bearing investment portfolio is fixed rate debt and 35% or $0.9 billion is floating rate debt. At March 31, 2012, 67% or $1.6 billion of our income-bearing investment portfolio was fixed rate debt and 33% or $0.8 billion was floating rate debt. On a cost basis, 65% or $1.7 billion of our income-bearing investment portfolio was fixed rate debt and 35% or $0.9 billion was floating rate debt.
Apollo Investment Management, L.P.
AIM, our investment adviser, is led by John Hannan, James Zelter and Edward Goldthorpe. Potential investment opportunities are generally approved by an investment committee composed of senior personnel across AGM including Mr. Zelter and Mr. Goldthorpe. The composition of the investment committee and its approval process for the Company’s investments may change from time to time. AIM draws upon AGM’s more than 20 year history and benefits from the broader firm’s significant capital markets, trading and research expertise developed through investments in many core sectors in over 150 companies since inception.
Apollo Investment Administration
In addition to furnishing us with office facilities, equipment, and clerical, bookkeeping and record keeping services, Apollo Investment Administration, LLC (“AIA” or “Apollo Administration”), an affiliate of AGM, also oversees our financial records as well as prepares our reports to stockholders and reports filed with the SEC. AIA also performs the calculation and publication of our net asset value, the payment of our expenses and oversees the performance of various third-party service providers and the preparation and filing of our tax returns. Furthermore, AIA provides on our behalf managerial assistance to those portfolio companies to which we are required to provide such assistance.
Operating and Regulatory Structure
Our investment activities are managed by AIM and supervised by our board of directors, a majority of whom are independent of AGM and its affiliates. AIM is an investment adviser that is registered under the Investment Advisers Act of 1940. Under our investment advisory and management agreement, we pay AIM an annual base management fee based on our average gross assets as well as an incentive fee.
As a business development company, we are required to comply with certain regulatory requirements. Also, while we are permitted to finance investments using debt, our ability to use debt is limited in certain significant respects (see Item 1A Risk Factors). We have elected to be treated for federal income tax purposes as a RIC under Subchapter M of the Code.
Investments
Apollo Investment seeks to create a portfolio that includes primarily debt investments including secured loans, unsecured and mezzanine loans and, to a lesser extent, equity investments by investing, on an individual portfolio company basis, approximately $20 million to $250 million of capital, on average, in the securities of middle-market companies, as well as structured products such as collateralized loan obligations. The average investment size will vary as the size of our capital base varies. Our target portfolio consists primarily of long-term secured debt, as well as unsecured and mezzanine positions of private middle-market companies. Structurally, unsecured and mezzanine debt usually ranks subordinate in priority of payment to senior debt, such as bank debt, and is characterized as unsecured. As such, other creditors may rank senior to us in the event of an insolvency.
2
Table of Contents
However, unsecured and mezzanine debt ranks senior to common and preferred equity in a borrowers’ capital structure. Unsecured and mezzanine debt may have a fixed or floating interest rate. Additional income can be generated from upfront fees, call protection including call premiums, equity co-investments or warrants. We may also invest in debt and equity positions of structured products, such as collateralized loan obligations (“CLOs”). CLOs are a form of securitization in which the cash flows of a portfolio of loans are pooled and passed on to different classes of owners in various tranches.
Our principal focus is to provide capital to middle-market companies in a variety of industries. We generally seek to target companies that generate positive free cash flows or that may support debt investments with strong asset coverage, and we may provide debtor-in-possession or reserve financing. Additionally we may acquire investments in the secondary market if we believe the risk-adjusted returns are attractive.
The following is a representative list of the industries in which we have invested:
| • Aviation | • Education | • Homebuilding | • Precious Metals and Minerals | |||
| • Broadcasting & Entertainment |
• Electronics | • Insurance | • Printing & Publishing | |||
| • Business Services | • Energy | • Leisure Equipment | • Retail | |||
| • Chemicals | • Environmental & Facilities Services |
• Manufacturing | • Telecommunications | |||
| • Consulting Services | • Finance | • Media | • Transportation | |||
| • Consumer Products | • Financial Services | • Oil and Gas | • Utilities | |||
| • Distribution | • Grocery | • Packaging | ||||
| • Diversified Service | • Healthcare | • Power | ||||
We may also invest in other industries if we are presented with attractive opportunities. In an effort to increase our returns and the number of investments that we can make, we may in the future seek to securitize our debt investments. To securitize debt investments, we may create a wholly owned subsidiary and contribute a pool of loans to the subsidiary. We may sell debt of or interests in the subsidiary on a non-recourse basis to purchasers whom we would expect to be willing to accept a lower interest rate to invest in investment-grade securities. We may use the proceeds of such sales to reduce indebtedness or to fund additional investments. We may also invest through special purpose entities or other arrangements, including total return swaps and repurchase agreements, in order to obtain non-recourse financing or for other purposes.
We may invest, to the extent permitted by law, in the securities and instruments of other investment companies and in private funds. We may also co-invest on a concurrent basis with affiliates of ours, subject to compliance with applicable regulations and our allocation procedures. Certain types of negotiated co-investments may be made only if we receive an order from the SEC permitting us to do so. There can be no assurance that any such order will be obtained.
At March 31, 2013, our portfolio consisted of 81 portfolio companies and was invested 44% in secured debt, 43% in unsecured debt, 7% in structured products, 0% in preferred equity and 6% in common equity and warrants measured at fair value. We expect that our portfolio will continue to include primarily secured and unsecured debt investments as well as, to a lesser extent, equity-related securities. In addition, we also expect to invest a portion of our portfolio in other investments, which are not our primary focus, but are intended to enhance our risk-adjusted returns to stockholders. These investments may include, but are not limited to, securities of public companies, debt and equity securities of companies located outside of the United States and structured products.
3
Table of Contents
Listed below are our top ten portfolio companies and industries based on their fair value and represented as a percentage of the portfolio for the years ended March 31, 2013 and 2012:
TOP TEN PORTFOLIO COMPANIES AND INDUSTRIES AS OF MARCH 31, 2013
| PORTFOLIO COMPANY |
% of Portfolio | INDUSTRY | % of Portfolio | |||||||
| Ceridian Corp. |
6.8 | % | Diversified Service | 10.4 | % | |||||
| Ranpak Corp. |
5.1 | % | Healthcare | 10.2 | % | |||||
| U.S. Security Associates Holdings, Inc. |
4.9 | % | Business Services | 9.8 | % | |||||
| inVentiv Health, Inc. |
4.9 | % | Finance | 8.5 | % | |||||
| Merx Aviation Finance Holdings, LLC |
4.8 | % | Packaging | 5.1 | % | |||||
| Altegrity, Inc. |
3.6 | % | Financial Services | 5.0 | % | |||||
| Playpower Holdings, Inc. |
2.8 | % | Aviation | 4.8 | % | |||||
| First Data Corp. |
2.8 | % | Transportation | 4.6 | % | |||||
| Aveta, Inc. |
2.5 | % | Environmental & Facilities Services | 4.0 | % | |||||
| Intelsat Bermuda Ltd. |
2.4 | % | Energy | 3.9 | % | |||||
TOP TEN PORTFOLIO COMPANIES AND INDUSTRIES AS OF MARCH 31, 2012
| PORTFOLIO COMPANY |
% of Portfolio | INDUSTRY |
% of Portfolio | |||||||
| inVentiv Health, Inc. |
5.4 | % | Diversified Service | 8.9 | % | |||||
| Ranpak Corporation |
5.3 | % | Business Services | 8.1 | % | |||||
| Altegrity, Inc. |
5.2 | % | Education | 7.8 | % | |||||
| US Security Associates Holdings, Inc. |
5.2 | % | Market Research | 7.3 | % | |||||
| Intelsat Bermuda Ltd. |
4.0 | % | Distribution | 5.6 | % | |||||
| Asurion Corporation |
4.0 | % | Insurance | 5.4 | % | |||||
| Playpower Holdings, Inc. |
3.7 | % | Packaging | 5.4 | % | |||||
| TL Acquisitions, Inc. (Cengage Learning) |
3.5 | % | Broadcasting & Entertainment | 5.1 | % | |||||
| Univar Inc. |
3.5 | % | Healthcare | 4.9 | % | |||||
| Advantage Sales & Marketing, Inc. |
3.2 | % | Grocery | 4.8 | % | |||||
Listed below is the geographic breakdown of the portfolio based on fair value as of March 31, 2013 and 2012:
| Geographic Region |
% of Portfolio |
Geographic Region |
% of Portfolio | |||
| United States |
91.9% | United States | 90.6% | |||
| Western Europe |
6.7% | Western Europe | 9.4% | |||
| Cayman Islands |
1.4% | Cayman Islands | — | |||
|
|
| |||||
| 100.0% | 100.0% | |||||
|
|
|
Investment selection & due diligence
We are committed to a value oriented philosophy of, among other things, capital preservation and commit resources to managing risks associated with our investment portfolio. Our investment adviser conducts due diligence on prospective portfolio companies. In conducting its due diligence, our investment adviser uses information provided by the company and its management team, publicly available information, as well as information from their extensive relationships with former and current management teams, consultants, competitors and investment bankers and the direct experience of the senior partners of our affiliates.
4
Table of Contents
Our investment adviser’s due diligence will typically include:
| • | review of historical and prospective financial information; |
| • | on-site visits; |
| • | interviews with management, employees, customers and vendors of the potential portfolio company; |
| • | review of loan documents; |
| • | background checks; and |
| • | research relating to the company’s management, industry, markets, products and services, and competitors. |
Upon the completion of due diligence and a decision to seek approval for an investment in a company, the professionals leading the proposed investment generally present the investment opportunity to and seek approval from the investment committee, which determines whether to pursue the potential investment. Additional due diligence with respect to any investment may be conducted on our behalf by attorneys and accountants prior to the closing of the investment, as well as other outside advisers, as appropriate.
Investment structure
Once we have determined that a prospective portfolio company is suitable for investment, we work with the management of that company and its other capital providers, including senior, junior and equity capital providers, to structure an investment.
We generally seek to structure our investments as secured loans with a direct lien on the assets or cash flows of the company that provide for increased downside protection in the event of insolvency while maintaining attractive risk-adjusted returns and current interest income. We generally seek for these secured loans to obtain security interests in the assets of our portfolio companies that serve as collateral in support of the repayment of these loans. This collateral may take the form of first or second priority liens on the assets of a portfolio company. In some cases, we may enter into debt investments that, by their terms, convert into equity or additional debt securities or defer payments (payment-in-kind) of interest after our investment. Also, in some cases our debt investments may be collateralized by a subordinated lien on some or all of the assets of the borrower. Typically, our loans have maturities of three to ten years.
We seek to tailor the terms of our investments to the facts and circumstances of the transaction and the prospective portfolio company, negotiating a structure that protects our rights and manages our risk while creating incentives for the portfolio company to achieve its business plan and improve its profitability. For example, in addition to seeking a senior position in the capital structure of our portfolio companies, we seek to limit the downside potential of our investments by:
| • | requiring an expected total return on our investments (including both interest and potential equity appreciation) that compensates us for credit risk; |
| • | generally incorporating call protection into the investment structure where possible; and |
| • | negotiating covenants and information rights in connection with our investments that afford our portfolio companies flexibility in managing their businesses, but which are still consistent with our goal of preserving our capital. Such restrictions may include affirmative and negative covenants, default penalties, lien protection, change of control provisions and board rights, including either observation or participation rights. Our investments may include equity features, such as warrants or options to buy a minority interest in the portfolio company. Any warrants we receive with our debt securities generally require only a nominal cost to exercise, and thus, as a portfolio company appreciates in value, we may achieve additional investment return from this equity interest. We may |
5
Table of Contents
| structure the warrants to provide provisions protecting our rights as a minority-interest holder, as well as puts, or rights to sell such securities back to the company, upon the occurrence of specified events. In many cases, we may also seek to obtain registration rights in connection with these equity interests, which may include demand and “piggyback” registration rights. |
We expect to hold most of our investments to maturity or repayment, but we may sell certain of our investments sooner if a liquidity event takes place such as a sale or recapitalization or worsening of credit quality of a portfolio company, among other reasons.
Ongoing relationships with portfolio companies
Monitoring
AIM monitors our portfolio companies on an ongoing basis and also monitors the financial trends of each portfolio company to determine if each is meeting its respective business plans and to assess the appropriate course of action for each company. In addition, senior investment professionals of AIM may take board seats or obtain board observation rights for our portfolio companies.
AIM has several methods of evaluating and monitoring the performance and fair value of our investments, which can include, but are not limited to, the assessment of success of the portfolio company in adhering to its business plan and compliance with covenants; periodic and regular contact with portfolio company management and, if appropriate, the financial or strategic sponsor, to discuss financial position, requirements and accomplishments; comparisons to other portfolio companies in the industry; attendance at and participation in board meetings; and review of monthly and quarterly financial statements and financial projections for portfolio companies.
AIM also uses an investment rating system to characterize and monitor our expected level of returns on each investment in our portfolio. These ratings are just one of several factors that AIM uses to monitor our portfolio, are not in and of themselves determinative of fair value or revenue recognition and are presented for indicative purposes. AIM grades the credit risk of all investments on a scale of 1 to 5 no less frequently than quarterly. This system is intended primarily to reflect the underlying risk of a portfolio investment relative to our initial cost basis in respect of such portfolio investment (i.e., at the time of acquisition), although it may also take into account under certain circumstances the performance of the portfolio company’s business, the collateral coverage of the investment and other relevant factors.
Under this system, investments with a grade of 1 involve the least amount of risk to our initial cost basis. The trends and risk factors for this investment since origination or acquisition are generally favorable, which may include the performance of the portfolio company or a potential exit. Investments graded 2 involve a level of risk to our initial cost basis that is similar to the level of risk underwritten at the time of origination or acquisition. This portfolio company is generally performing in accordance with our analysis of its business and the full return of principal and interest or dividend is expected. Investments graded 3 indicate that the risk to our ability to recoup the cost of such investment has increased since origination or acquisition, but full return of principal and interest or dividend is expected. A portfolio company with an investment grade of 3 requires closer monitoring. Investments graded 4 indicate that the risk to our ability to recoup the cost of such investment has increased significantly since origination or acquisition, including as a result of factors such as declining performance and noncompliance with debt covenants, and we expect some loss of interest, dividend or capital appreciation, but still expect an overall positive internal rate of return on the investment. Investments graded 5 indicate that the risk to our ability to recoup the cost of such investment has increased materially since origination or acquisition and the portfolio company likely has materially declining performance. Loss of interest or dividend and some loss of principal investment is expected, which would result in an overall negative internal rate of return on the investment. For investments graded 4 or 5, AIM enhances its level of scrutiny over the monitoring of such portfolio company.
6
Table of Contents
AIM monitors and, when appropriate, changes the investment ratings assigned to each investment in our portfolio. In connection with our valuation process, AIM reviews these investment ratings on a quarterly basis, and our audit committee monitors such ratings. It is possible that the grade of certain of these portfolio investments may be reduced or increased over time.
Managerial assistance
As a BDC, we must offer, and must provide upon request, significant managerial assistance to certain of our portfolio companies. This assistance could involve, among other things, monitoring the operations of our portfolio companies, participating in board and management meetings, consulting with and advising officers of portfolio companies and providing other organizational and financial guidance. We may receive fees for these services.
Valuation Process
The following is a description of the steps we take each quarter to determine the value of our portfolio. Our portfolio of investments is recorded at fair value as determined in good faith by or under the direction of our board of directors pursuant to a written valuation policy and a consistently applied valuation process utilizing the input of our investment adviser, independent valuation firms, third party pricing services and the audit committee. Since this process necessarily involves the use of judgment and the engagement of independent valuation firms, there is no certainty as to the value of our portfolio investments. Investments for which market quotations are readily available are recorded in our financial statements at such market quotations if they are deemed to represent fair value. Market quotations may be deemed not to represent fair value where AIM believes that facts and circumstances applicable to an issuer, a seller or purchaser or the market for a particular security causes current market quotes not to reflect the fair value of the security, among other reasons. Examples of these events could include cases in which material events are announced after the close of the market on which a security is primarily traded, when a security trades infrequently causing a quoted purchase or sale price to become stale or in the event of a “fire sale” by a distressed seller.
With respect to investments for which market quotations are not readily available or when such market quotations are deemed not to represent fair value, our board of directors has approved a multi-step valuation process each quarter, as described below:
(1) our quarterly valuation process begins with each portfolio company or investment being initially valued by the investment professionals of our investment adviser responsible for the portfolio investment;
(2) preliminary valuation conclusions are then documented and discussed with senior management of our investment adviser;
(3) independent valuation firms are engaged by our board of directors to conduct independent appraisals by reviewing our investment adviser’s preliminary valuations and then making their own independent assessment;
(4) the audit committee of the board of directors reviews the preliminary valuation of our investment adviser and the valuation prepared by the independent valuation firm and responds to the valuation recommendation of the independent valuation firm to reflect any comments; and
(5) the board of directors discusses valuations and determines in good faith the fair value of each investment in our portfolio based on the input of our investment adviser, the applicable independent valuation firm, third party pricing services and the audit committee.
In addition, some of our investments provide for payment-in-kind (“PIK”) interest or dividends. Such amounts of accrued PIK interest or dividends are added to the cost of the investment on the respective capitalization dates and generally become due at maturity of the investment or upon the investment being called by the issuer. Upon capitalization, PIK is subject to the fair value estimates associated with their related investments.
7
Table of Contents
Competition
Our primary competitors in providing financing to middle-market companies include public and private funds, commercial and investment banks, commercial financing companies, other BDCs or hedge funds, and, to the extent they provide an alternative form of financing, private equity funds. Some of our existing and potential competitors are substantially larger and have considerably greater financial, technical and marketing resources than we do. For example, some competitors may have a lower cost of funds and access to funding sources that are not available to us. In addition, some of our competitors may have higher risk tolerances or different risk assessments, which could allow them to consider a wider variety of investments and establish more relationships than us. Furthermore, many of our competitors are not subject to the regulatory restrictions that the 1940 Act imposes on us as a BDC or the restrictions that the Code imposes on us as a RIC. We also expect to use the industry information of AGM’s investment professionals to which we have access to assess investment risks and determine appropriate pricing for our investments in portfolio companies. In addition, we believe that the relationships of the senior managers of AIM and those of our affiliates enable us to learn about, and compete effectively for, financing opportunities with attractive middle-market companies in the industries in which we seek to invest.
Staffing
The Company has no employees. All of the services we utilize are provided by third parties. Our chief financial officer and chief compliance officer and additional personnel assisting them in such functions are employees of AIA and perform their respective functions under the terms of the administration agreement with AIA. Certain of our other executive officers are managing partners of our investment adviser. Our day-to-day investment operations are managed by our investment adviser, which draws on the broader capabilities of the Opportunistic Credit segment of AGM’s credit business. In addition, we generally reimburse AIA for our allocable portion of expenses incurred by it in performing its obligations under the administration agreement, including rent and our allocable portion of the cost of our chief financial officer, chief compliance officer and corporate secretary and their respective staffs.
Sarbanes-Oxley Act of 2002
The Sarbanes-Oxley Act of 2002 imposes a wide variety of regulatory requirements on publicly-held companies and their insiders. Many of these requirements affect us. For example:
| • | Pursuant to Rule 13a-14 under the Securities Exchange Act of 1934 (“the 1934 Act”), our Chief Executive Officer and Chief Financial Officer must certify the accuracy of the financial statements contained in our periodic reports; |
| • | Pursuant to Item 307 of Regulation S-K, our periodic reports must disclose our conclusions about the effectiveness of our disclosure controls and procedures; |
| • | Pursuant to Rule 13a-15 of the 1934 Act, our management must prepare a report regarding its assessment of our internal control over financial reporting; and |
| • | Pursuant to Item 308 of Regulation S-K and Rule 13a-15 of the 1934 Act, our periodic reports must disclose whether there were significant changes in our internal controls or in other factors that could significantly affect these controls subsequent to the date of their evaluation, including any corrective actions with regard to material weaknesses. |
The Sarbanes-Oxley Act requires us to review our current policies and procedures to determine whether we comply with the Sarbanes-Oxley Act and the regulations promulgated thereunder. We will continue to monitor our compliance with all regulations that are adopted under the Sarbanes-Oxley Act and will take actions necessary to ensure that we are in compliance therewith.
8
Table of Contents
You may read and copy any materials we file with the SEC at the SEC’s Public Reference Room at 100 F Street, NE, Washington, DC 20549, on official business days during the hours of 10:00 am to 3:00 pm. You may obtain information on the operation of the Public Reference Room by calling the SEC at 1-800-SEC-0330. The SEC maintains an Internet site that contains reports, proxy and information statements, and other information regarding issuers that file electronically with the SEC. The address of that site is (http://www.sec.gov).
Our internet address is www.apolloic.com. We make available free of charge on our website our annual report on Form 10-K, quarterly reports on Form 10-Q, current reports on Form 8-K and amendments to those reports as soon as reasonably practicable after we electronically file such material with, or furnish it to, the SEC. Information contained on our website is not incorporated by reference into this annual report on Form 10-K, and you should not consider information contained on our website to be part of this annual report on Form 10-K.
Investing in Apollo Investment involves a number of significant risks related to our business, structure, investments and investment in our common stock. As a result, there can be no assurance that we will achieve our investment objective. You should carefully consider the risks described below, together with all of the other information included in this report, before you decide whether to invest in Apollo Investment. The risks set forth below are not the only risks we face. Additional risks and uncertainties not currently known to us or that we currently deem to be immaterial also may have a material adverse effect on our business, financial condition and/or operating results.
CERTAIN RISKS IN THE CURRENT ENVIRONMENT
Capital markets could experience a period of disruption and instability. Such market conditions have historically and could again have a material and adverse affect on debt and equity capital markets in the United States and abroad, which could have a materially negative impact on our business and operations.
Global capital markets have historically experienced periods of disruption and instability characterized by a lack of liquidity in the debt capital markets, significant losses in the principal value of investments, the re-pricing of credit risk in the broadly syndicated credit market and the failure of certain major financial institutions. Such conditions may occur for a prolonged period of time. These market conditions have historically and could again have a material adverse affect on debt and equity capital markets in the United States and Europe, which could have a materially negative impact on our business, financial condition and results of operations. We and other companies in the financial services sector may have to access, if available, alternative markets for debt and equity capital. In such circumstances, equity capital may be difficult to raise because subject to some limited exceptions, as a BDC, we are generally not able to issue additional shares of our common stock at a price less than net asset value without general approval by our shareholders, which we currently have, and approval of the specific issuance by our Board. In addition, our ability to incur indebtedness or issue preferred stock is limited by applicable regulations such that our asset coverage, as defined in the 1940 Act, must equal at least 200% immediately after each time we incur indebtedness or issue preferred stock. The debt capital that may be available, if at all, may be at a higher cost and on less favorable terms and conditions in the future. Any inability to raise capital could have a negative effect on our business, financial condition and results of operations.
Market conditions may in the future make it difficult to extend the maturity of or refinance our existing indebtedness, including the final maturity of our senior secured credit facility in May 2016, and any failure to do so could have a material adverse effect on our business. The illiquidity of our investments may make it difficult for us to sell such investments if required. As a result, we may realize significantly less than the value at which we have recorded our investments.
Given the extreme volatility and dislocation that the capital markets have historically experienced, many BDCs have faced, and may in the future face, a challenging environment in which to raise capital. We may in the future have difficulty accessing debt and equity capital, and a severe disruption in the global financial markets or
9
Table of Contents
deterioration in credit and financing conditions could have a material adverse effect on our business, financial condition and results of operations. In addition, significant changes in the capital markets, including the extreme volatility and disruption, have had, and may in the future have, a negative effect on the valuations of our investments and on the potential for liquidity events involving our investments. An inability to raise capital, and any required sale of our investments for liquidity purposes, could have a material adverse impact on our business, financial condition or results of operations. The current financial market situation, as well as various social and political tensions in the United States and around the world, particularly in the Middle East, may continue to contribute to increased market volatility, may have long-term effects on the United States and worldwide financial markets, and may cause further economic uncertainties or deterioration in the United States and worldwide. Since 2010, several European Union (‘‘EU’’) countries, including Greece, Ireland, Italy, Spain, and Portugal have faced budget issues, some of which may have negative long-term effects for the economies of those countries and other EU countries. There is continued concern about national-level support for the euro and the accompanying coordination of fiscal and wage policy among European Economic and Monetary Union member countries. AIM does not know how long the financial markets will continue to be affected by these events and cannot predict the effects of these or similar events in the future on the United States economy and securities markets or on our investments. AIM monitors developments and seeks to manage our investments in a manner consistent with achieving our investment objective, but there can be no assurance that it will be successful in doing so; and AIM may not timely anticipate or manage existing, new or additional risks, contingencies or developments, including regulatory developments in the current or future market environment.
We are required to record certain of our assets at fair value, as determined in good faith by our board of directors in accordance with our valuation policy. As a result, volatility in the capital markets may have a material adverse affect on our investment valuations and our net asset value, even if we plan to hold investments to maturity.
The instability in the financial markets approximately five years ago has led the U.S. Government to take a number of unprecedented actions and pass legislation designed to regulate and support certain financial institutions and numerous segments of the financial markets that have experienced extreme volatility, and in some cases a lack of liquidity.
On July 21, 2010, the President signed into law major financial services reform legislation in the form of the Dodd-Frank Wall Street Reform and Consumer Protection Act (the “Dodd-Frank Act”). The Dodd-Frank Act, among other things, grants regulatory authorities such as the Commodity Futures Trading Commission (“CFTC”) and SEC broad rulemaking authority to implement various provisions of the Dodd-Frank Act, including comprehensive regulation of the over-the-counter derivatives market. The regulations adopted to date by these regulators have not had a material adverse effect on our business. However, several significant rulemaking initiatives have not been completed and these could have the effect of reducing liquidity or otherwise adversely affecting us or our investments. There can be no assurance that future regulatory actions authorized by the Dodd-Frank Act will not significantly reduce our profitability. The implementation of the Dodd-Frank Act could also adversely affect us by increasing transaction and/or regulatory compliance costs. In addition, greater regulatory scrutiny may increase our exposure to potential liabilities. Increased regulatory oversight can also impose administrative burdens on us and on AIM, including, without limitation, responding to examinations or investigations and implementing new policies and procedures.
Additionally, federal, state, foreign, and other governments, their regulatory agencies or self regulatory organizations may take actions that affect the regulation of the securities in which we invest, or the issuers of such securities, in ways that are unforeseeable. Governments or their agencies may also acquire distressed assets from financial institutions and acquire ownership interests in those institutions. The implications of government ownership and disposition of these assets are unclear, and such a program may have positive or negative effects on the liquidity, valuation and performance of our portfolio companies. Furthermore, volatile financial markets can expose us to greater market and liquidity risk and potential difficulty in valuing securities.
10
Table of Contents
At any time after the date hereof, legislation may be enacted that could negatively affect us or our portfolio companies. Changing approaches to regulation may have a negative impact on the entities in which we invest. Legislation or regulation may also change the way in which we are regulated. There can be no assurance that the Dodd-Frank Act or any future legislation, regulation or deregulation will not have a material adverse effect on us or will not impair our ability to achieve our investment objective.
Concerns regarding the level of U.S. Government debt, a further downgrade of the U.S. government sovereign credit rating, impending automatic spending cuts and the continuing economic crisis in Europe could negatively impact our liquidity, financial condition and earnings.
Recent U.S. debt ceiling and budget deficit concerns, together with signs of deteriorating sovereign debt conditions in Europe, have increased the possibility of additional credit-rating downgrades and economic slowdowns in the U.S. Although U.S. lawmakers passed legislation to raise the federal debt ceiling, Standard & Poor’s Ratings Services lowered its long-term sovereign credit rating on the United States from “AAA” to “AA+” in August 2011. The impact of this or any further downgrades to the U.S. government’s sovereign credit rating or its perceived creditworthiness could adversely affect the U.S. and global financial markets and economic conditions. Absent further quantitative easing by the Federal Reserve, these developments, along with the European sovereign debt crisis, could cause interest rates and borrowing costs to rise, which may negatively impact our ability to access the debt markets on favorable terms. Continued adverse economic conditions could have a material adverse effect on our business, financial condition and results of operations.
Risks and ongoing concerns about the debt crisis in Europe could have a detrimental impact on the global economic recovery, sovereign and non-sovereign debt in these countries and the financial condition of European financial institutions. Market and economic disruptions have affected, and may continue to affect, consumer confidence levels and spending, personal bankruptcy rates, levels of incurrence and default on consumer debt and home prices, among other factors. There can be no assurance that the market disruptions in Europe, including the increased cost of funding for certain governments and financial institutions, will not spread, nor can there be any assurance that future assistance packages will be available or, even if provided, will be sufficient to stabilize the affected countries and markets in Europe or elsewhere. To the extent uncertainty regarding the economic recovery continues to negatively impact consumer confidence and consumer credit factors, our business and results of operations could be significantly and adversely affected.
Risks Associated with Recent Commodity Futures Trading Commission Actions
AIM has claimed relief available under a no-action letter (“Letter 12-40”) issued by the staff of the CFTC. Letter 12-40 relieves AIM from registering with the CFTC as the commodity pool operator (“CPO”) of AIC, provided that AIC (i) continues to be regulated by the SEC as a business development company, (ii) allocates no more than a designated percentage of its liquidation value to futures contracts, certain swap contracts and certain other derivative instruments that are within the jurisdiction of the Commodity Exchange Act (collectively, “CEA-regulated products”), and (iii) is not marketed to the public as a commodity pool or as a vehicle for trading in CEA-regulated products. If AIC can no longer satisfy the conditions of Letter 12-40, AIM could be subject to the CFTC’s CPO registration requirements, and the disclosure and operations of AIC would need to comply with all applicable regulations governing commodity pools and CPOs. If AIM were required to register as a CPO, it would also be required to become a member of the National Futures Association (“NFA”) and be subject to the NFA’s rules and bylaws. Compliance with these additional registration and regulatory requirements may increase AIM’s operating expenses, which, in turn, could result in AIC’s investors being charged additional fees.
The continued uncertainty related to the sustainability and pace of economic recovery in the U.S. and globally could have a negative impact on our business.
Apollo Investment’s business has been, and could continue to be, negatively impacted by the uncertainty surrounding the sustainability and pace of economic recovery in the U.S. as well as globally. Fiscal and monetary actions taken by U.S. and non-U.S. government and regulatory authorities could have a material adverse impact on our business.
11
Table of Contents
The continued uncertainty from the ongoing Eurozone Debt and Economic Crisis and the potential outcome on the global financial markets and financial conditions generally.
Several European countries continue to experience credit deterioration due to weakness in their economic and fiscal situations. These ongoing conditions have caused, and are likely to continue to cause, disruptions in the global financial markets.
RISKS RELATING TO OUR BUSINESS AND STRUCTURE
We may suffer credit losses.
Investment in small and middle-market companies is highly speculative and involves a high degree of risk of credit loss. These risks are likely to increase during volatile economic periods, as the U.S. and many other economies have experienced. See “Risks Related to Our Investments.”
We are dependent upon Apollo Investment Management’s key personnel for our future success and upon their access to AGM’s investment professionals and partners.
We depend on the diligence, skill and network of business contacts of the senior management of AIM specifically and AGM generally. Members of our senior management may depart at any time. We also depend, to a significant extent, on AIM’s access to the investment professionals and partners of AGM and the information and deal flow generated by the AGM investment professionals in the course of their investment and portfolio management activities. The senior management of AIM evaluates, negotiates, structures, closes and monitors our investments. Our future success depends on the continued service of senior members of AGM’s credit platform, including the senior management team of AIM. The departure of our senior management, any senior managers of AIM, or of a significant number of the investment professionals or partners of AGM, could have a material adverse effect on our ability to achieve our investment objective. In addition, we can offer no assurance that AIM will remain our investment adviser or that we will continue to have access to AGM’s partners and investment professionals or its information and deal flow.
Our financial condition and results of operations depend on our ability to manage future growth effectively.
Our ability to achieve our investment objective depends, in part, on our ability to grow, which depends, in turn, on AIM’s ability to identify, invest in and monitor companies that meet our investment criteria. Accomplishing this result on a cost-effective basis is largely a function of AIM’s structuring of the investment process, its ability to provide competent, attentive and efficient services to us and our access to financing on acceptable terms. The senior management team of AIM has substantial responsibilities under the investment advisory and management agreement, and with respect to certain members, in connection with their roles as officers of other AGM funds.
They may also be called upon to provide managerial assistance to our portfolio companies. These demands on their time may distract them or slow the rate of investment. In order to grow, we and AIM need to hire, train, supervise and manage new employees. Any failure to manage our future growth effectively could have a material adverse effect on our business, financial condition and results of operations.
We operate in a highly competitive market for investment opportunities.
A number of entities compete with us to make the types of investments that we make. We compete with public and private funds, commercial and investment banks, commercial financing companies, other BDCs and, to the extent they provide an alternative form of financing, private equity funds. Competition for investment opportunities intensifies from time to time and may intensify further in the future. Some of our existing and potential competitors are substantially larger and have considerably greater financial, technical and marketing resources than we do. For example, some competitors may have a lower cost of funds and access to funding
12
Table of Contents
sources that are not available to us. In addition, some of our competitors may have higher risk tolerances or different risk assessments, which could allow them to consider a wider variety of investments and establish more relationships than us. Furthermore, many of our competitors are not subject to the regulatory restrictions and valuation requirements that the 1940 Act imposes on us as a BDC and that the Code imposes on us as a RIC. We cannot assure you that the competitive pressures we face will not have a material adverse effect on our business, financial condition and results of operations. Also, as a result of this existing and potentially increasing competition, we may not be able to take advantage of attractive investment opportunities from time to time, and we can offer no assurance that we will be able to identify and make investments that are consistent with our investment objective.
We do not seek to compete primarily based on the interest rates we offer, and we believe that some of our competitors make loans with interest rates that are comparable to or lower than the rates we offer.
We may lose investment opportunities if we do not match our competitors’ pricing, terms and structure. If we match our competitors’ pricing, terms and structure, we may experience decreased net interest income and increased risk of credit loss.
Any failure on our part to maintain our status as a BDC would reduce our operating flexibility.
If we do not remain a BDC, we might be regulated as a closed-end investment company under the 1940 Act, which would subject us to substantially more regulatory restrictions under the 1940 Act and correspondingly decrease our operating flexibility.
We will be subject to corporate-level income tax if we are unable to qualify as a RIC.
To qualify as a RIC under the Code, we must meet certain source-of-income, asset diversification and annual distribution requirements. The annual distribution requirement for a RIC generally is satisfied if we distribute at least 90% of our “investment company taxable income” (generally, our ordinary income and the excess, if any, of our net short-term capital gains over our net long-term capital losses), if any, to our stockholders on an annual basis. To the extent we use debt financing, we are subject to certain asset coverage ratio requirements and other financial covenants under loan and credit agreements, and could in some circumstances also become subject to such requirements under the 1940 Act, that could, under certain circumstances, restrict us from making distributions necessary to qualify as a RIC. If we are unable to obtain cash from other sources, we may fail to qualify as a RIC and, thus, may be subject to corporate-level income tax. To qualify as a RIC, we must also meet certain asset diversification requirements at the end of each calendar quarter. Failure to meet these tests may result in our having to dispose of certain investments quickly in order to prevent the loss of RIC status. Because most of our investments are in private companies, any such dispositions could be made at disadvantageous prices and may result in substantial losses. If we fail to qualify as a RIC for any reason and become subject to corporate-level income tax, the resulting corporate-level taxes could substantially reduce our net assets, the amount of income available for distribution and the amount of our distributions. Such a failure would have a material adverse effect on us and our stockholders.
To qualify again to be taxed as a RIC in a subsequent year, we would be required to distribute to our stockholders our earnings and profits attributable to non-RIC years reduced by an interest charge on 50% of such earnings and profits payable by us to the IRS. In addition, if we failed to qualify as a RIC for a period greater than two taxable years, then we would be required to elect to recognize and pay tax on any net built-in gain (the excess of aggregate gain, including items of income, over aggregate loss that would have been realized if we had been liquidated) or, alternatively, be subject to taxation on such built-in gain recognized for a period of ten years, in order to qualify as a RIC in a subsequent year.
13
Table of Contents
We may have difficulty paying our required distributions if we recognize income before or without receiving cash representing such income.
For U.S. federal income tax purposes, we include in income certain amounts that we have not yet received in cash, such as original issue discount, which may arise if, for example, we receive warrants in connection with the making of a loan or payment-in-kind interest, which represents contractual interest added to the loan balance and typically due at the end of the loan term or possibly in other circumstances. Such original issue discount is included in income before we receive any corresponding cash payments and could be significant relative to our overall investment activities. Loans structured with these features may represent a higher level of credit risk than loans the interest on which must be paid in cash at regular intervals. We also may be required to include in income certain other amounts that we do not receive in cash.
The incentive fee payable by us that relates to our net investment income is computed and paid on income that may include some interest that has been accrued but not yet received in cash. If a portfolio company defaults on a loan, it is possible that accrued interest previously used in the calculation of the incentive fee will become uncollectible. Consequently, while we may make incentive fee payments on income accruals that we may not collect in the future and with respect to which we do not have a formal clawback right against our investment adviser per se, the amount of accrued income written off in any period will reduce the income in the period in which such write-off was taken and thereby reduce such period’s incentive fee payment. For the time period between April 1, 2012 and March 31, 2014, the portion of the incentive fee that is attributable to deferred interest, such as PIK, will not be paid to AIM until the Company receives such interest in cash. The accrual of incentive fees shall be reversed if such interest is reversed in connection with any write-off or similar treatment of the investment.
Since in certain cases we may recognize income before or without receiving cash representing such income, we may have difficulty meeting the tax requirement to distribute at least 90% of our investment company taxable income to maintain our status as a RIC. Accordingly, we may have to sell some of our investments at times we would not consider advantageous, raise additional debt or equity capital or reduce new investment originations in order to meet distribution and/or leverage requirements.
Regulations governing our operation as a BDC affect our ability to, and the way in which we raise, additional capital.
We may issue debt securities or preferred stock and/or borrow money from banks or other financial institutions, which we refer to collectively as “senior securities,” up to the maximum amount permitted by the 1940 Act. Under the provisions of the 1940 Act, we are permitted, as a BDC, to issue senior securities only in amounts such that our asset coverage, as defined in the 1940 Act, equals at least 200% after each issuance of senior securities. If the value of our assets declines, we may be unable to maintain asset coverage above the 200% level. If that happens, the contractual arrangements governing these securities may require us to sell a portion of our investments and, depending on the nature of our leverage, repay a portion of our indebtedness at a time when such sales may be disadvantageous.
BDCs may issue and sell common stock at a price below net asset value per share only in limited circumstances, one of which is during the one-year period after stockholder approval. In the past, our stockholders have approved a plan so that during the subsequent 12 month period we could, in one or more public or private offerings of our common stock, sell or otherwise issue shares of our common stock at a price below the then current net asset value per share, subject to certain conditions including parameters on the level of permissible dilution, approval of the sale by a majority of our independent directors and a requirement that the sale price be not less than approximately the market price of the shares of our common stock at specified times, less the expenses of the sale. We may in the future seek to renew such authority on terms and conditions set forth in the corresponding proxy statement. There is no assurance such approvals will be obtained.
14
Table of Contents
In the event we sell, or otherwise issue, shares of our common stock at a price below net asset value per share, existing stockholders will experience net asset value dilution and the investors who acquire shares in such offering may thereafter experience the same type of dilution from subsequent offerings at a discount. For example, if we sell an additional 10% of our common shares at a 5% discount from net asset value, a stockholder who does not participate in that offering for its proportionate interest will suffer net asset value dilution of up to 0.5% or $5 per $1000 of net asset value.
In addition to issuing securities to raise capital as described above, we anticipate that in the future we may securitize our loans to generate cash for funding new investments. To securitize loans, we may create a wholly-owned subsidiary, contribute a pool of loans to the subsidiary and have the subsidiary issue primarily investment grade debt securities to purchasers who we would expect would be willing to accept a substantially lower interest rate than the loans earn. We would retain all or a portion of the equity in the securitized pool of loans. Our retained equity would be exposed to any losses on the portfolio of loans before any of the debt securities would be exposed to such losses. An inability to successfully securitize our loan portfolio could limit our ability to grow our business and fully execute our business strategy and adversely affect our earnings, if any. Moreover, the successful securitization of our loan portfolio might expose us to losses as the residual loans in which we do not sell interests will tend to be those that are riskier and more apt to generate losses.
We currently use borrowed funds to make investments and are exposed to the typical risks associated with leverage.
We are exposed to increased risk of loss due to our use of debt to make investments. A decrease in the value of our investments will have a greater negative impact on the value of our common stock than if we did not use debt. Our ability to pay dividends will be restricted if we fail to satisfy certain of our asset coverage ratios and other financial covenants and any amounts that we use to service our indebtedness are not available for dividends to our common stockholders.
The agreements governing certain of our debt instruments require us to comply with certain financial and operational covenants. These covenants require us to, among other things, maintain certain financial ratios, including asset coverage and minimum shareholders’ equity. As of March 31, 2013, we were in compliance with these covenants. However, our continued compliance with these covenants depends on many factors, some of which are beyond our control. In the event of deterioration in the capital markets and pricing levels subsequent to this period, net unrealized depreciation in our portfolio may increase in the future. Absent an amendment to our revolving credit facility, continued unrealized depreciation in our investment portfolio could result in non-compliance with certain covenants.
Accordingly, there are no assurances that we will continue to comply with these covenants. Failure to comply with these covenants would result in a default which, if we were unable to obtain a waiver from the debt holders, could accelerate repayment under the instruments and thereby have a material adverse impact on our liquidity, financial condition, results of operations and ability to pay dividends.
Our current and future debt securities are and may be governed by an indenture or other instrument containing covenants restricting our operating flexibility. We, and indirectly our stockholders, bear the cost of issuing and servicing such securities. Our currently outstanding convertible securities have, and any convertible or exchangeable securities that we issue in the future may have rights, preferences and privileges more favorable than those of our common stock.
We fund a portion of our investments with borrowed money, which magnifies the potential for gain or loss on amounts invested and may increase the risk of investing in us.
Borrowings and other types of financing, also known as leverage, magnify the potential for gain or loss on amounts invested and, therefore, increase the risks associated with investing in our securities. Our lenders and debt holders have fixed dollar claims on our assets that are superior to the claims of our common stockholders or
15
Table of Contents
any preferred stockholders. If the value of our assets increases, then leveraging would cause the net asset value to increase more sharply than it would have had we not leveraged. Conversely, if the value of our assets decreases, leveraging would cause net asset value to decline more sharply than it otherwise would have had we not leveraged. Similarly, any increase in our income in excess of consolidated interest payable on the borrowed funds would cause our net income to increase more than it would without the leverage, while any decrease in our income would cause net income to decline more sharply than it would have had we not borrowed. Such a decline could negatively affect our ability to make common stock dividend payments. Leverage is generally considered a speculative investment technique.
We may in the future determine to fund a portion of our investments with preferred stock, which would magnify the potential for gain or loss and the risks of investing in us in the same way as our borrowings.
Preferred stock, which is another form of leverage, has the same risks to our common stockholders as borrowings because the dividends on any preferred stock we issue must be cumulative. Payment of such dividends and repayment of the liquidation preference of such preferred stock must take preference over any dividends or other payments to our common stockholders, and preferred stockholders are not subject to any of our expenses or losses and are not entitled to participate in any income or appreciation in excess of their stated preference.
Changes in interest rates may affect our cost of capital and net investment income.
Because we borrow money, and may issue preferred stock to finance investments, our net investment income will depend, in part, upon the difference between the rate at which we borrow funds or pay dividends on preferred stock and the rate at which we invest these funds. As a result, we can offer no assurance that a significant change in market interest rates will not have a material adverse effect on our net investment income. In periods of rising interest rates, our cost of funds would increase except to the extent we have issued fixed rate debt or preferred stock, which could reduce our net investment income. Our long-term fixed-rate investments are financed primarily with equity and long-term debt. We may use interest rate risk management techniques in an effort to limit our exposure to interest rate fluctuations. Such techniques may include various interest rate hedging activities to the extent permitted by the 1940 Act and applicable commodities laws. Interest rate hedging activities do not protect against credit risk. We have analyzed the potential impact of changes in interest rates on interest income net of interest expense. Assuming no changes to our balance sheet as of March 31, 2013, a hypothetical one percent increase in London Interbank Offered Rate (LIBOR) on our floating rate assets and liabilities would decrease our earnings by approximately two cents per average share over the next twelve months. Assuming no changes to our balance sheet as of March 31, 2013, a hypothetical two percent increase in LIBOR on our floating rate assets and liabilities would increase our earnings by three cents per average share over the next twelve months. Assuming no changes to our balance sheet as of March 31, 2013, a hypothetical three percent increase in LIBOR on our floating rate assets and liabilities would increase our earnings by approximately five cents per average share over the next twelve months. In addition, we believe that our interest rate matching strategy and our ability to hedge mitigates the effects any changes in interest rates may have on our investment income. Although management believes that this is indicative of our sensitivity to interest rate changes, it does not adjust for potential changes in credit quality, size and composition of the assets on the balance sheet and other business developments that could affect net increase or decrease in net assets resulting from operations, or net income. Accordingly, no assurances can be given that actual results would not differ materially from the potential outcome simulated by this estimate.
A portion of our floating rate investments may include features such as LIBOR floors. To the extent we invest in credit instruments with LIBOR floors, we may lose some of the benefits of incurring leverage. Specifically, if we issue preferred stock or debt (or otherwise borrow money), our costs of leverage will increase as rates increase. However, we may not benefit from the higher coupon payments resulting from increased interest rates if our investments in LIBOR floors and rates do not rise to levels above the LIBOR floors. In this situation, we will experience increased financing costs without the benefit of receiving higher income. This in turn may result in the potential for a decrease in the level of income available for dividends or distributions made by us.
16
Table of Contents
You should also be aware that a change in the general level of interest rates can be expected to lead to a change in the interest rates we receive on many of our debt investments. Accordingly, a change in interest rates could make it easier for us to meet or exceed the performance threshold and may result in a substantial increase in the amount of incentive fees payable to our investment adviser with respect to pre-incentive fee net investment income.
Our business requires a substantial amount of capital to grow because we must distribute most of our income.
Our business requires a substantial amount of capital. We have issued equity securities and have borrowed from financial institutions. A reduction in the availability of new capital could limit our ability to grow. We must distribute at least 90% of our investment company taxable income to maintain our regulated investment company status. As a result, any such cash earnings may not be available to fund investment originations. We expect to continue to borrow from financial institutions and issue additional debt and equity securities. If we fail to obtain funds from such sources or from other sources to fund our investments, it could limit our ability to grow, which may have an adverse effect on the value of our securities. In addition, as a BDC, our ability to borrow or issue additional preferred stock may be restricted if our total assets are less than 200% of our total borrowings and preferred stock.
Many of our portfolio investments are recorded at fair value as determined in good faith by our board of directors and, as a result, there is uncertainty as to the value of our portfolio investments.
A large percentage of our portfolio investments are not publicly traded. The fair value of these investments may not be readily determinable. We value these investments quarterly at fair value (based on ASC 820, its corresponding guidance and the principal markets in which these investments trade) as determined in good faith by our board of directors pursuant to a written valuation policy and a consistently applied valuation process utilizing the input of our investment adviser, independent valuation firms, third party pricing services and the audit committee. Our board of directors utilizes the services of independent valuation firms to aid it in determining the fair value of these investments. The types of factors that may be considered in fair value pricing of these investments include the nature and realizable value of any collateral, the portfolio company’s ability to make payments and its earnings, the markets in which the portfolio company does business, comparison to more liquid securities, indices and other market-related inputs, discounted cash flow, our principal market and other relevant factors. Because such valuations, and particularly valuations of private securities and private companies, are inherently uncertain, may fluctuate over short periods of time and may be based on estimates, our determinations of fair value may differ materially from the values that would have been used if a readily available market for these investments existed and may differ materially from the amounts we realize on any disposition of such investments. Our net asset value could be adversely affected if our determinations regarding the fair value of these investments were materially higher than the values that we ultimately realize upon the disposal of such investments.
In addition, decreases in the market values or fair values of our investments are recorded as unrealized depreciation. Unprecedented declines in prices and liquidity in the corporate debt markets have resulted in significant net unrealized depreciation in our portfolio in the past. The effect of all of these factors on our portfolio has reduced our NAV by increasing net unrealized depreciation in our portfolio. Depending on market conditions, we could incur substantial realized losses and may continue to suffer additional unrealized losses in future periods, which could have a material adverse impact on our business, financial condition and results of operations.
The lack of liquidity in our investments may adversely affect our business.
We generally make investments in private companies. Substantially all of these securities are subject to legal and other restrictions on resale or are otherwise less liquid than publicly traded securities. The illiquidity of our
17
Table of Contents
investments may make it difficult for us to sell such investments if the need arises. In addition, if we are required to liquidate all or a portion of our portfolio quickly, we may realize significantly less than the value at which we have previously recorded our investments. In addition, we may face other restrictions on our ability to liquidate an investment in a portfolio company to the extent that we or an affiliated manager of AGM has material non-public information regarding such portfolio company.
We may experience fluctuations in our periodic results.
We could experience fluctuations in our periodic operating results due to a number of factors, including the interest rates payable on the debt securities we acquire, the default rate on such securities, the level of our expenses (including the interest rates payable on our borrowings), the dividend rates on preferred stock we issue, variations in and the timing of the recognition of realized and unrealized gains or losses, the degree to which we encounter competition in our markets and general economic conditions. As a result of these factors, results for any period should not be relied upon as being indicative of performance in future periods.
Our ability to enter into transactions with our affiliates is restricted.
We are prohibited under the 1940 Act from knowingly participating in certain transactions with certain of our affiliates without the prior approval of our independent directors and, in some cases, of the SEC. Any person that owns, directly or indirectly, 5% or more of our outstanding voting securities will be our affiliate for purposes of the 1940 Act and we are generally prohibited from buying or selling any security (other than our securities) from or to such affiliate, absent the prior approval of our independent directors. The 1940 Act also prohibits certain “joint” transactions with certain of our affiliates, which could include investments in the same portfolio company (whether at the same or different times), without prior approval of our independent directors and, in some cases, of the SEC. We are prohibited from buying or selling any security from or to any person who owns more than 25% of our voting securities or certain of that person’s affiliates, or entering into prohibited joint transactions with such persons, absent the prior approval of the SEC through an exemptive order (other than in certain limited situations pursuant to current regulatory guidance). The analysis of whether a particular transaction constitutes a joint transaction requires a review of the relevant facts and circumstances then existing. Similar restrictions limit our ability to transact business with our officers or directors or their affiliates.
We have applied for an exemptive order from the SEC that would permit us and certain of our affiliates, including investment funds managed by our affiliates, to co-invest. Any such order will be subject to certain terms and conditions and there can be no assurance that such order will be granted by the SEC. Accordingly, we cannot assure you that we or our affiliates, including investment funds managed by our affiliates, will be permitted to co-invest, other than in the limited circumstances currently permitted by regulatory guidance or in the absence of a joint transaction.
There are significant potential conflicts of interest which could adversely affect our investment returns.
Allocation of Personnel
Potential investment opportunities are generally approved by an investment committee composed of senior personnel across AGM including Mr. Zelter and Mr. Goldthorpe. Our executive officers and directors, and the partners of our investment adviser, AIM, serve or may serve as officers, directors or principals of entities that operate in the same or a related line of business as we do or of investment funds managed by our affiliates. Accordingly, they may have obligations to investors in those entities, the fulfillment of which might not be in the best interests of us or our stockholders. Moreover, we note that, notwithstanding the difference in principal investment objectives between us and other AGM funds, such other AGM sponsored funds, including new affiliated potential pooled investment vehicles or managed accounts not yet established (whether managed or sponsored by AGM or AIM itself), have and may from time to time have overlapping investment objectives with us and, accordingly, invest in, whether principally or secondarily, asset classes similar to those targeted by us. To the extent such other investment vehicles have overlapping investment objectives, the scope of opportunities
18
Table of Contents
otherwise available to us may be adversely affected and/or reduced. As a result, certain partners of AIM may face conflicts in their time management and commitments as well as in the allocation of investment opportunities to other AGM funds. In addition, in the event such investment opportunities are allocated among us and other investment vehicles managed or sponsored by, or affiliated with, AIM our desired investment portfolio may be adversely affected. Although AIM endeavors to allocate investment opportunities in a fair and equitable manner, it is possible that we may not be given the opportunity to participate in certain investments made by investment funds managed by AIM or investment managers affiliated with AIM.
No Information Barriers
There are no information barriers amongst AGM and certain of its affiliates. If AIM were to receive material non-public information about a particular company, or have an interest in investing in a particular company, AGM or certain of its affiliates may be prevented from investing in such company. Conversely, if AGM were to receive material non-public information about a particular company, or have an interest in investing in a particular company, we may be prevented from investing in such company.
This risk may affect us more than it does other investment vehicles, as AIM generally does not use information barriers that many firms implement to separate persons who make investment decisions from others who might possess material, non-public information that could influence such decisions. AIM’s decision not to implement these barriers could prevent its investment professionals from undertaking certain transactions such as advantageous investments or dispositions that would be permissible for them otherwise. In addition, AIM could in the future decide to establish information barriers, particularly as its business expands and diversifies.
Co-Investment Activity and Allocation of Investment Opportunities
AGM and its affiliated investment managers, including AIM, may determine that an investment is appropriate both for us and for one or more other funds. In such event, depending on the availability of such investment and other appropriate factors, AIM may determine that we should invest on a side-by-side basis with one or more other funds. We may make all such investments subject to compliance with applicable regulations and interpretations, and our allocation procedures. In certain circumstances negotiated co-investments may be made only if we receive an order from the SEC permitting us to do so. There can be no assurance that any such order will be obtained.
AGM has adopted allocation procedures that are intended to ensure that each fund or account managed by AGM (“Apollo-advised funds”) is treated in a manner that, over time, is fair and equitable. Allocations generally are made pro rata based on order size. In certain circumstances, the allocation policy provides for the allocation of investments pursuant to a predefined arrangement that is other than pro rata. As a result, in situations where a security is appropriate for us but is limited in availability, we may receive a lower allocation than may be desired by our portfolio managers or no allocation if Apollo believes the investment is more appropriate for a different Apollo-advised fund because of its investment mandate. Investment opportunities may be allocated on a basis other than pro rata to the extent it is done in good faith and does not, or is not reasonably expected to, result in an improper disadvantage or advantage to one participating Apollo-advised fund as compared to another participating Apollo-advised fund.
In the event investment opportunities are allocated among us and the other Apollo-advised funds, we may not be able to structure our investment portfolio in the manner desired. Although AGM endeavors to allocate investment opportunities in a fair and equitable manner, it is possible that we may not be given the opportunity to participate in certain investments made by the other Apollo-advised funds or portfolio managers affiliated with AIM. Furthermore, we and the other Apollo-advised funds may make investments in securities where the prevailing trading activity may make impossible the receipt of the same price or execution on the entire volume of securities purchased or sold by us and the other Apollo-advised funds. When this occurs, the various prices may be averaged, and we will be charged or credited with the average price. Thus, the effect of the aggregation may operate on some occasions to our disadvantage. In addition, under certain circumstances, we may not be charged the same commission or commission equivalent rates in connection with a bunched or aggregated order.
19
Table of Contents
It is possible that the other Apollo-advised funds may make investments in the same or similar securities at different times and on different terms than we do. From time to time, we and the other Apollo-advised funds may make investments at different levels of an issuer’s capital structure or otherwise in different classes of an issuer’s securities. Such investments may inherently give rise to conflicts of interest or perceived conflicts of interest between or among the various classes of securities that may be held by such entities. Conflicts may also arise because portfolio decisions regarding us may benefit the other Apollo-advised funds. For example, the sale of a long position or establishment of a short position by us may impair the price of the same security sold short by (and therefore benefit) one or more Apollo-advised funds, and the purchase of a security or covering of a short position in a security by us may increase the price of the same security held by (and therefore benefit) one or more Apollo-advised funds. In these circumstances AIM and its affiliates will seek to resolve each conflict in a manner that is fair to the various clients involved in light of the totality of the circumstances. In some cases the resolution may not be in our best interests.
AGM and its clients may pursue or enforce rights with respect to an issuer in which we have invested, and those activities may have an adverse effect on us. As a result, prices, availability, liquidity and terms of our investments may be negatively impacted by the activities of AGM or its clients, and transactions for us may be impaired or effected at prices or terms that may be less favorable than would otherwise have been the case.
Fees and Expenses
In the course of our investing activities, we pay management and incentive fees to AIM, and reimburse AIM for certain expenses it incurs. As a result, investors in our common stock invest on a “gross” basis and receive distributions on a “net” basis after expenses, resulting in, among other things, a lower rate of return than one might achieve through direct investments. As a result of this arrangement, there may be times when the management team of AIM has interests that differ from those of our common stockholders, giving rise to a conflict.
AIM receives a quarterly incentive fee based, in part, on our pre-incentive fee income, if any, for the immediately preceding calendar quarter. This incentive fee will not be payable to AIM unless the pre-incentive net investment income exceeds the performance threshold. To the extent we or AIM are able to exert influence over our portfolio companies, the quarterly pre-incentive fee may provide AIM with an incentive to induce our portfolio companies to prepay interest or other obligations in certain circumstances.
Allocation of Expenses
We have entered into a royalty-free license agreement with AGM, pursuant to which AGM has agreed to grant us a non-exclusive license to use the name “Apollo.” Under the license agreement, we have the right to use the “Apollo” name for so long as AIM or one of its affiliates remains our investment adviser. In addition, we rent office space from AIA, an affiliate of AIM, and pay Apollo Administration our allocable portion of overhead and other expenses incurred by AIA in performing its obligations under the administration agreement, including our allocable portion of the cost of our Chief Financial Officer and Chief Compliance Officer and their respective staffs, which can create conflicts of interest that our board of directors must monitor.
In the past following periods of volatility in the market price of a company’s securities, securities class action litigation has, from time to time, been brought against that company.
If our stock price fluctuates significantly, we may be the target of securities litigation in the future. Securities litigation could result in substantial costs and divert management’s attention and resources from our business.
Changes in the laws or regulations governing our business or the businesses of our portfolio companies and any failure by us or our portfolio companies to comply with these laws or regulations, could negatively affect the profitability of our operations or of our portfolio companies.
We are subject to changing rules and regulations of federal and state governments, as well as the stock exchange on which our common stock is listed. These entities, including the Public Company Accounting Oversight Board,
20
Table of Contents
the SEC and The NASDAQ Global Select Market, have issued a significant number of new and increasingly complex requirements and regulations over the course of the last several years and continue to develop additional regulations. In particular, changes in the laws or regulations or the interpretations of the laws and regulations that govern BDCs, RICs or non-depository commercial lenders could significantly affect our operations and our cost of doing business. We are subject to federal, state and local laws and regulations and are subject to judicial and administrative decisions that affect our operations, including our loan originations, maximum interest rates, fees and other charges, disclosures to portfolio companies, the terms of secured transactions, collection and foreclosure procedures and other trade practices. If these laws, regulations or decisions change, or if we expand our business into jurisdictions that have adopted more stringent requirements than those in which we currently conduct business, we may have to incur significant expenses in order to comply, or we might have to restrict our operations. In addition, if we do not comply with applicable laws, regulations and decisions, we may lose licenses needed for the conduct of our business and be subject to civil fines and criminal penalties, any of which could have a material adverse effect upon our business, financial condition and results of operations.
Provisions of the Maryland General Corporation Law and of our charter and bylaws could deter takeover attempts and have an adverse impact on the price of our common stock.
The Maryland General Corporation Law, our charter and our bylaws contain provisions that may discourage, delay or make more difficult a change in control of us or the removal of our directors. We are subject to the Maryland Business Combination Act, subject to any applicable requirements of the 1940 Act. Our board of directors has adopted a resolution exempting from the Business Combination Act any business combination between us and any other person, subject to prior approval of such business combination by our board of directors, including approval by a majority of our disinterested directors. If the resolution exempting business combinations is repealed or our board of directors does not approve a business combination, the Business Combination Act may discourage third parties from trying to acquire control of us and increase the difficulty of consummating such an offer. Our bylaws exempt from the Maryland Control Share Acquisition Act acquisitions of our common stock by any person. If we amend our bylaws to repeal the exemption from the Control Share Acquisition Act, the Control Share Acquisition Act also may make it more difficult for a third party to obtain control of us and increase the difficulty of consummating such an offer. We intend to give the SEC prior notice should our board of directors elect to amend our bylaws to repeal the exemption from the Control Share Acquisition Act.
We have also adopted other measures that may make it difficult for a third party to obtain control of us, including provisions of our charter classifying our board of directors in three classes serving staggered three-year terms, and provisions of our charter authorizing our board of directors to classify or reclassify shares of our stock in one or more classes or series, to cause the issuance of additional shares of our stock, and to amend our charter, without stockholder approval, to increase or decrease the number of shares of stock that we have authority to issue. These provisions, as well as other provisions of our charter and bylaws, may delay, defer or prevent a transaction or a change in control that might otherwise be in the best interests of our stockholders.
We may choose to pay dividends in our own common stock, in which case you may be required to pay federal income taxes in excess of the cash dividends you receive.
We may distribute taxable dividends that are payable in cash and shares of our common stock at the election of each stockholder. The Internal Revenue Service has issued private letter rulings on cash/stock dividends paid by RICs and real estate investment trusts where the cash component is limited to 20% of the total distribution if certain requirements are satisfied. Stockholders receiving such dividends will be required to include the full amount of the dividend (including the portion payable in stock) as ordinary income (or, in certain circumstances, long-term capital gain) to the extent of our current and accumulated earnings and profits for federal income tax purposes. As a result, stockholders may be required to pay income taxes with respect to such dividends in excess of the cash dividends received. If a U.S. stockholder sells the common stock that it receives as a dividend in order to pay this tax, the sales proceeds may be less than the amount included in income with respect to the
21
Table of Contents
dividend, depending on the market price of our common stock at the time of the sale. Furthermore, with respect to non-U.S. stockholders, we may be required to withhold U.S. tax with respect to such dividends, including in respect of all or a portion of such dividend that is payable in common stock. In addition, if a significant number of our stockholders determine to sell shares of our common stock in order to pay taxes owed on dividends, it may put downward pressure on the trading price of our common stock. It is unclear whether and to what extent we will be able to pay taxable dividends in cash and common stock (whether pursuant to a private letter ruling or otherwise).
Climate Change.
There is evidence of global climate change. Climate change creates physical and financial risk and some of our portfolio companies may be adversely affected by climate change. For example, the needs of customers of energy companies vary with weather conditions, primarily temperature and humidity. To the extent weather conditions are affected by climate change, energy use could increase or decrease depending on the duration and magnitude of any changes. Increased energy use due to weather changes may require additional investments by our portfolio companies engaged in the energy business in more pipelines and other infrastructure to serve increased demand. Increases in the cost of energy also could adversely affect the cost of operations of our portfolio companies if the use of energy products or services is material to their business. A decrease in energy use due to weather changes may affect some of our portfolio companies’ financial condition, through decreased revenues. Extreme weather conditions in general require more system backup, adding to costs, and can contribute to increased system stresses, including service interruptions. Energy companies could also be affected by the potential for lawsuits against or taxes or other regulatory costs imposed on greenhouse gas emitters, based on links drawn between greenhouse gas emissions and climate change.
Our investment adviser and administrator have the right to resign on 60 days’ notice, and we may not be able to find a suitable replacement within that time, resulting in a disruption in our operations that could adversely affect our business, financial condition and results of operations.
Our investment adviser and administrator have the right, under our investment management agreement and administration agreement, respectively, to resign at any time upon not less than 60 days’ written notice, whether we have found a replacement or not. If our investment adviser or our administrator resigns, we may not be able to find a replacement or hire internal management or administration with similar expertise and ability to provide the same or equivalent services on acceptable terms within 60 days, or at all. If we are unable to do so quickly, our operations are likely to experience a disruption, our business, financial condition and results of operations as well as our ability to pay distributions are likely to be adversely affected and the market price of our shares may decline. In addition, the coordination of our internal management and investment activities or our internal administration activities, as applicable, is likely to suffer if we are unable to identify and reach an agreement with a single institution or group of executives having the expertise possessed by our investment adviser and its affiliates or our administrator and its affiliates. Even if we are able to retain comparable management or administration, whether internal or external, the integration of such management or administration and their lack of familiarity with our investment objective may result in additional costs and time delays that may adversely affect our business, financial condition and results of operations.
RISKS RELATED TO OUR INVESTMENTS
Our investments in prospective portfolio companies are risky, and you could lose all or part of your investment.
Investment in middle-market companies is speculative and involves a number of significant risks including a high degree of risk of credit loss. Middle-market companies may have limited financial resources and may be unable to meet their obligations under their debt securities that we hold, which may be accompanied by a deterioration in the value of any collateral and a reduction in the likelihood of us realizing any guarantees we may have obtained in connection with our investment. In addition, they typically have shorter operating histories,
22
Table of Contents
narrower product lines and smaller market shares than larger businesses, which tend to render them more vulnerable to competitors’ actions and market conditions, as well as general economic downturns. Middle-market companies are more likely to depend on the management talents and efforts of a small group of persons; therefore, the death, disability, resignation or termination of one or more of these persons could have a material adverse impact on our portfolio company and, in turn, on us. Middle-market companies also generally have less predictable operating results, may from time to time be parties to litigation, may be engaged in rapidly changing businesses with products subject to a substantial risk of obsolescence, and may require substantial additional capital to support their operations, finance expansion or maintain their competitive position. In addition, our executive officers, directors and our investment adviser may, in the ordinary course of business, be named as defendants in litigation arising from our investments in the portfolio companies.
We invest primarily in secured, unsecured and mezzanine debt of private middle-market companies. We also may invest in equity and structured products, such as CLOs. We may not realize gains from our equity investments.
Secured loans, which we define to include first lien and second lien debt, are the most senior form of indebtedness of an issuer and, due to the ability of the lender to sell the collateral to repay its loan in the event of default, the lender will likely experience more favorable recovery than more junior creditors in the event of the issuer defaults on its indebtedness.
Unsecured debt or loans, also referred to as mezzanine loans or subordinated debt are generally unsecured and junior to other indebtedness of the issuer. As a consequence, the holder of a mezzanine loan may lack adequate protection in the event the issuer becomes distressed or insolvent and will likely experience a lower recovery than more senior debtholders in the event the issuer defaults on its indebtedness. In addition, mezzanine loans of middle market companies are often highly illiquid and in adverse market conditions may experience steep declines in valuation even if they are fully performing.
We may invest in debt and equity positions of structured products, such as collateralized loan obligations. CLOs are a form a securitization in which the cash flows of a portfolio of loans are pooled and passed on to different classes of owners in various tranches.
When we invest in unsecured and secured loans, we have acquired and may continue to acquire warrants or other equity securities as well. In addition, we may invest directly in the equity securities of portfolio companies. Our goal is ultimately to dispose of such equity interests and realize gains upon our disposition of such interests. However, the equity interests we receive may not appreciate in value and, in fact, may decline in value. Accordingly, we may not be able to realize gains from our equity interests, and any gains that we do realize on the disposition of any equity interests may not be sufficient to offset any other losses we experience.
Our investments in CLOs may be riskier and less transparent to us and our stockholders than direct investments in the underlying companies.
We invest in CLOs. Generally, there may be less information available to us regarding the underlying debt investments held by CLOs than if we had invested directly in the debt of the underlying companies. As a result, our stockholders will not know the details of the underlying securities of the CLOs in which we will invest. Our CLO investments will also be subject to the risk of leverage associated with the debt issued by such CLOs and the repayment priority of senior debt holders in such CLOs. Our investments in prospective portfolio companies may be risky, and we could lose all or part of our investment.
CLOs typically will have no significant assets other than their underlying loans; payments on CLO investments are and will be payable solely from the cashflows from such loans.
CLOs typically will have no significant assets other than their underlying loans. Accordingly, payments on CLO investments are and will be payable solely from the cashflows from such loans, net of all management fees and
23
Table of Contents
other expenses. Payments to us as a holder of CLO investments are and will be met only after payments due on the senior notes (and, where appropriate, the junior secured notes) from time to time have been made in full. This means that relatively small numbers of defaults of loans may adversely impact our returns.
Our CLO investments are exposed to leveraged credit risk.
We may be in a subordinated position with respect to realized losses on loans underlying our investments in CLOs. The leveraged nature of CLOs, in particular, magnifies the adverse impact of loan defaults. CLO investments represent a leveraged investment with respect to the underlying loans. Therefore, changes in the market value of the CLO investments could be greater than the change in the market value of the underlying loans, which are subject to credit, liquidity and interest rate risk.
Economic recessions or downturns could impair our portfolio companies and harm our operating results.
Many of our portfolio companies may be susceptible to economic slowdowns or recessions and may be unable to repay our loans during these periods. Therefore, our non-performing assets may increase and the value of our portfolio may decrease during these periods if we are required to write down the values of our investments. Adverse economic conditions also may decrease the value of collateral securing some of our loans and the value of our equity investments. Economic slowdowns or recessions could lead to financial losses in our portfolio and a decrease in revenues, net income and assets. Unfavorable economic conditions also could increase our funding costs, limit our access to the capital markets or result in a decision by lenders not to extend credit to us. These events could prevent us from increasing investments and harm our operating results.
A portfolio company’s failure to satisfy financial or operating covenants imposed by us or other lenders could lead to defaults and, potentially, acceleration of the time when the loans are due and foreclosure on its secured assets, which could trigger cross-defaults under other agreements and jeopardize the portfolio company’s ability to meet its obligations under the debt that we hold. We may incur additional expenses to the extent necessary to seek recovery upon default or to negotiate new terms with a defaulting portfolio company.
There may be circumstances where our debt investments could be subordinated to claims of other creditors or we could be subject to, among other things, lender liability or fraudulent conveyance claims.
We could, in certain circumstances, become subject to potential liabilities that may exceed the value of our original investment in a portfolio company that experiences severe financial difficulties. For example, we may be adversely affected by laws related to, among other things, fraudulent conveyances, voidable preferences, lender liability, and the bankruptcy court’s discretionary power to disallow, subordinate or disenfranchise particular claims or re-characterize investments made in the form of debt as equity contributions.
If we do not invest a sufficient portion of our assets in qualifying assets, we could fail to qualify as a BDC or be precluded from investing according to our current business strategy.
As a BDC, we may not acquire any assets other than “qualifying assets” unless, at the time of and after giving effect to such acquisition, at least 70% of our total assets are qualifying assets. We believe that most of the investments that we may acquire in the future will constitute qualifying assets. However, we may be precluded from investing in what we believe are attractive investments if such investments are not qualifying assets for purposes of the 1940 Act. If we do not invest a sufficient portion of our assets in qualifying assets, we could be found to be in violation of the 1940 Act provisions applicable to BDCs, which would have a material adverse effect on our business, financial condition and results of operations. Similarly, these rules could prevent us from making follow-on investments in existing portfolio companies (which could result in the dilution of our position) or could require us to dispose of investments at inappropriate times in order to come into compliance with the 1940 Act. Because most of our investments will be in private companies, and therefore will be relatively illiquid, any such dispositions could be made at disadvantageous prices and could result in substantial losses.
24
Table of Contents
Our portfolio contains a limited number of portfolio companies, which subjects us to a greater risk of significant loss if any of these companies defaults on its obligations under any of its debt securities.
A consequence of the limited number of investments in our portfolio is that the aggregate returns we realize may be significantly adversely affected if one or more of our significant portfolio company investments perform poorly or if we need to write down the value of any one significant investment. Beyond our income tax diversification requirements, we do not have fixed guidelines for diversification, and our portfolio could contain relatively few portfolio companies.
Our failure to make follow-on investments in our portfolio companies could impair the value of our portfolio.
Following an initial investment in a portfolio company, we may make additional investments in that portfolio company as “follow-on” investments, in order to: (1) increase or maintain in whole or in part our equity ownership percentage; (2) exercise warrants, options or convertible securities that were acquired in the original or subsequent financing or (3) attempt to preserve or enhance the value of our investment.
We may elect not to make follow-on investments, may be constrained in our ability to employ available funds, or otherwise may lack sufficient funds to make those investments. We have the discretion to make any follow-on investments, subject to the availability of capital resources. The failure to make follow-on investments may, in some circumstances, jeopardize the continued viability of a portfolio company and our initial investment, or may result in a missed opportunity for us to increase our participation in a successful operation. Even if we have sufficient capital to make a desired follow-on investment, we may elect not to make a follow-on investment because we may not want to increase our concentration of risk, because we prefer other opportunities, or because we are inhibited by compliance with BDC requirements or the desire to maintain our tax status.
When we do not hold controlling equity interests in our portfolio companies, we may not be in a position to exercise control over our portfolio companies or to prevent decisions by management of our portfolio companies that could decrease the value of our investments.
We do not generally take controlling equity positions in our portfolio companies. To the extent that we do not hold a controlling equity interest in a portfolio company, we are subject to the risk that a portfolio company may make business decisions with which we disagree, and the stockholders and management of a portfolio company may take risks or otherwise act in ways that are adverse to our interests. Due to the lack of liquidity for the debt and equity investments that we typically hold in our portfolio companies, we may not be able to dispose of our investments in the event we disagree with the actions of a portfolio company, and may therefore suffer a decrease in the value of our investments.
An investment strategy focused primarily on privately-held companies presents certain challenges, including the lack of available information about these companies, a dependence on the talents and efforts of only a few key portfolio company personnel and a greater vulnerability to economic downturns.
We have invested and will continue to invest primarily in privately-held companies. Generally, little public information exists about these companies, and we are required to rely on the ability of AIM’s investment professionals to obtain adequate information to evaluate the potential returns from investing in these companies.
If we are unable to uncover all material information about these companies, we may not make a fully informed investment decision, and we may lose money on our investments. Also, privately-held companies frequently have less diverse product lines and smaller market presence than public company competitors, which often are larger. These factors could affect our investment returns.
25
Table of Contents
Our portfolio companies may incur debt that ranks equally with, or senior to, our investments in such companies.
We have invested and intend to invest primarily in mezzanine and senior debt securities issued by our portfolio companies. The portfolio companies usually have, or may be permitted to incur, other debt that ranks equally with, or senior to, the debt securities in which we invest. By their terms, such debt instruments may provide that the holders are entitled to receive payment of interest or principal on or before the dates on which we are entitled to receive payments in respect of the debt securities in which we invest. Also, in the event of insolvency, liquidation, dissolution, reorganization or bankruptcy of a portfolio company, holders of debt instruments ranking senior to our investment in that portfolio company would typically be entitled to receive payment in full before we receive any distribution in respect of our investment. After repaying such senior creditors, such portfolio company may not have any remaining assets to use for repaying its obligation to us. In the case of debt ranking equally with debt securities in which we invest, we would have to share on an equal basis any distributions with other creditors holding such debt in the event of an insolvency, liquidation, dissolution, reorganization or bankruptcy of the relevant portfolio company. In addition, we may not be in a position to control any portfolio company by investing in its debt securities. As a result, we are subject to the risk that a portfolio company in which we invest may make business decisions with which we disagree and the management of such company, as representatives of the holders of their common equity, may take risks or otherwise act in ways that do not serve our interests as debt investors.
Our incentive fee may induce AIM to make certain investments, including speculative investments.
The incentive fee payable by us to AIM may create an incentive for AIM to make investments on our behalf that are risky or more speculative than would be the case in the absence of such compensation arrangement. The way in which the incentive fee payable to AIM is determined, which is calculated separately in two components as a percentage of the net investment income (subject to a performance threshold) and as a percentage of the realized gain on invested capital, may encourage our investment adviser to use leverage to increase the return on our investments. Under certain circumstances, the use of leverage may increase the likelihood of default, which would disfavor the holders of our common stock, including investors in offerings of common stock, securities convertible into our common stock or warrants representing rights to purchase our common stock or securities convertible into our common stock. In addition, AIM receives the incentive fee based, in part, upon net capital gains realized on our investments. Unlike the portion of the incentive fee based on net investment income, there is no performance threshold applicable to the portion of the incentive fee based on net capital gains. As a result, AIM may have a tendency to invest more in investments that are likely to result in capital gains as compared to income producing securities. Such a practice could result in our investing in more speculative securities than would otherwise be the case, which could result in higher investment losses, particularly during economic downturns.
The incentive fee payable by us to AIM also may create an incentive for AIM to invest on our behalf in instruments that have a deferred interest feature such as investments with PIK provisions. Under these investments, we would accrue the interest over the life of the investment but would typically not receive the cash income from the investment until the end of the term or upon the investment being called by the issuer. Our net investment income used to calculate the income portion of our incentive fee, however, includes accrued interest. For the time period between April 1, 2012 and March 31, 2014, the portion of the incentive fee that is attributable to deferred interest, such as PIK, will not be paid to AIM until the Company receives such interest in cash. The accrual of incentive fees shall be reversed if such interest is reversed in connection with any write-off or similar treatment of the investment. The payment of incentive fees to AIM is made on accruals of expected cash interest. If a portfolio company defaults on a loan, it is possible that accrued interest previously used in the calculation of the incentive fee will become uncollectible. Thus, while a portion of this incentive fee would be based on income that we have not yet received in cash and with respect to which we do not have a formal claw-back right against our investment adviser per se, the amount of accrued income to the extent written off in any period will reduce the income in the period in which such write-off was taken and thereby reduce such period’s incentive fee payment.
26
Table of Contents
We may invest, to the extent permitted by law, in the securities and instruments of other investment companies, including private funds, and, to the extent we so invest, will bear our ratable share of any such investment company’s expenses, including management and performance fees. We will also remain obligated to pay management and incentive fees to AIM with respect to the assets invested in the securities and instruments of other investment companies. With respect to each of these investments, each of our common stockholders will bear his or her share of the management and incentive fee of AIM as well as indirectly bearing the management and performance fees and other expenses of any investment companies in which we invest.
We may be obligated to pay our investment adviser incentive compensation even if we incur a loss.
Our investment adviser is entitled to incentive compensation for each fiscal quarter in an amount equal to a percentage of the excess of our pre-incentive fee net investment income for that quarter (before deducting incentive compensation) above a performance threshold for that quarter. Accordingly, since the performance threshold is based on a percentage of our net asset value, decreases in our net asset value make it easier to achieve the performance threshold. Our pre-incentive fee net investment income for incentive compensation purposes excludes realized and unrealized capital losses or depreciation that we may incur in the fiscal quarter, even if such capital losses or depreciation result in a net loss on our statement of operations for that quarter. Thus, we may be required to pay AIM incentive compensation for a fiscal quarter even if there is a decline in the value of our portfolio or we incur a net loss for that quarter. In addition, increases in interest rates may increase the amount of incentive fees we pay to our investment adviser even though our performance relative the market has not increased.
Our investments in foreign securities may involve significant risks in addition to the risks inherent in U.S. investments.
Our investment strategy contemplates that a portion of our investments may be in securities of foreign companies. Investing in foreign companies may expose us to additional risks not typically associated with investing in U.S. companies. These risks include changes in exchange control regulations, political and social instability, expropriation, imposition of foreign taxes, less liquid markets and less available information than is generally the case in the United States, higher transaction costs, less government supervision of exchanges, brokers and issuers, less developed bankruptcy laws, difficulty in enforcing contractual obligations, lack of uniform accounting and auditing standards and greater price volatility. These risks are likely to be more pronounced for investments in companies located in emerging markets and particularly for middle-market companies in these economies.
Although most of our investments are denominated in U.S. dollars, our investments that are denominated in a foreign currency are subject to the risk that the value of a particular currency may change in relation to one or more other currencies. Among the factors that may affect currency values are trade balances, the level of short-term interest rates, differences in relative values of similar assets in different currencies, long-term opportunities for investment and capital appreciation, and political developments. We may employ hedging techniques to minimize these risks, but we can offer no assurance that we will, in fact, hedge currency risk or, that if we do, such strategies will be effective.
Hedging transactions may expose us to additional risks.
If we engage in hedging transactions, we may expose ourselves to risks associated with such transactions. We may utilize instruments such as forward contracts, currency options and interest rate swaps, caps, collars and floors to seek to hedge against fluctuations in the relative values of our portfolio positions from changes in currency exchange rates and market interest rates. Hedging against a decline in the values of our portfolio positions does not eliminate the possibility of fluctuations in the values of such positions or prevent losses if the values of such positions decline. However, such hedging can establish other positions designed to gain from those same developments, thereby offsetting the decline in the value of such portfolio positions. Such hedging
27
Table of Contents
transactions may also limit the opportunity for gain if the values of the underlying portfolio positions should increase. Moreover, it may not be possible to hedge against an exchange rate or interest rate fluctuation that is so generally anticipated that we are not able to enter into a hedging transaction at an acceptable price. Our ability to engage in hedging transactions may also be adversely affected by recent rules adopted by the CFTC.
While we may enter into transactions to seek to reduce currency exchange rate and interest rate risks, unanticipated changes in currency exchange rates or interest rates may result in poorer overall investment performance than if we had not engaged in any such hedging transactions. In addition, the degree of correlation between price movements of the instruments used in a hedging strategy and price movements in the portfolio positions being hedged may vary. Moreover, for a variety of reasons, we may not seek to establish a perfect correlation between such hedging instruments and the portfolio holdings being hedged. Any such imperfect correlation may prevent us from achieving the intended hedge and expose us to risk of loss. In addition, it may not be possible to hedge fully or perfectly against currency fluctuations affecting the value of securities denominated in non-U.S. currencies because the value of those securities is likely to fluctuate as a result of factors not related to currency fluctuations. Our ability to engage in hedging transactions may also be adversely affected by recent rules adopted by the CFTC.
RISKS RELATED TO MATURITY OF OUR DEBT INSTRUMENTS
Our senior secured credit facility begins amortizing in May 2015 and any inability to renew, extend or replace the facility could adversely impact our liquidity and ability to find new investments or maintain distributions to our stockholders.
We maintain a senior secured multi-currency revolving credit facility with a group of lenders, under which we had approximately $536 million of indebtedness outstanding at March 31, 2013. The previously outstanding credit facility was amended on May 23, 2012 pursuant to an amended and restated facility (the “Senior Secured Facility”). Our lenders’ obligation to make new loans or other extensions of credit under the Senior Secured Facility ceases on May 23, 2015, and the facility has a final stated maturity date of May 23, 2016. In addition, commencing on June 23, 2015, the Company is required to repay, in twelve consecutive monthly installments of equal size, the outstanding amount under the Senior Secured Facility as of May 23, 2015. There can be no assurance that we will be able to renew, extend or replace the Senior Secured Facility upon the termination of the lenders’ obligations to make new loans or the Senior Secured Facility’s final maturity on terms that are favorable to us, if at all. Our ability to renew, extend or replace the Senior Secured Facility will be constrained by then-current economic conditions affecting the credit markets. In the event that we are not able to renew, extend or replace the Senior Secured Facility at the time of the termination of the lenders’ obligations to make new loans or the Senior Secured Facility’s final maturity, this could have a material adverse effect on our liquidity and ability to fund new investments, our ability to make distributions to our stockholders and our ability to qualify as a RIC.
Our senior secured notes and our senior unsecured convertible notes have maturity dates over the course of the next several years, and any inability to replace or repay our senior secured notes or our senior unsecured convertible notes could adversely impact our liquidity and ability to fund new investments or maintain distributions to our stockholders.
On September 30, 2010, we entered into a note purchase agreement, providing for a private placement issuance of $225 million in aggregate principal amount of five-year, senior secured notes with a fixed interest rate of 6.25% and a maturity date of October 4, 2015 (the “Senior Secured Notes”). On January 25, 2011, we closed a private offering of $200 million aggregate principal amount of senior unsecured convertible notes (the “Convertible Notes”). The Convertible Notes bear interest at an annual rate of 5.75% and will mature on January 15, 2016 unless earlier converted or repurchased at the holder’s option. On September 29, 2011, we closed a private offering of $45 million aggregate principal amount of senior secured notes (the “Notes”) consisting of two series: (1) 5.875% Senior Secured Notes, Series A, of the Company due September 29, 2016 in the aggregate principal amount of $29 million; and (2) 6.250% Senior Secured Notes, Series B, of the Company due September 29, 2018, in the aggregate principal amount of $16 million. On October 9, 2012, the Company
28
Table of Contents
issued $150 million in aggregate principal amount of 6.625% senior unsecured notes due October 15, 2042 (the “2042 Notes”). There can be no assurance that we will be able to replace the Senior Secured Notes, the Convertible Notes, the Notes or the 2042 Notes upon their maturity on terms that are favorable to us, if at all. Our ability to replace the Senior Secured Notes, the Convertible Notes, the Notes or the 2042 Notes will be constrained by then-current economic conditions affecting the credit markets. In the event that we are not able to replace or repay the Senior Secured Notes, the Convertible Notes, the Notes or the 2042 Notes at the time of their maturity, this could have a material adverse effect on our liquidity and ability to fund new investments, our ability to make distributions to our stockholders and our ability to qualify as a RIC.
RISKS RELATED TO ISSUANCE OF OUR PREFERRED STOCK
An investment in our preferred stock should not constitute a complete investment program.
If we issue preferred stock, the net asset value and market value of our common stock may become more volatile.
We cannot assure you that the issuance of preferred stock would result in a higher yield or return to the holders of the common stock. The issuance of preferred stock would likely cause the net asset value and market value of the common stock to become more volatile. If the dividend rate on the preferred stock were to approach the net rate of return on our investment portfolio, the benefit of leverage to the holders of the common stock would be reduced. If the dividend rate on the preferred stock were to exceed the net rate of return on our portfolio, the leverage would result in a lower rate of return to the holders of common stock than if we had not issued preferred stock. Any decline in the net asset value of our investments would be borne entirely by the holders of common stock. Therefore, if the market value of our portfolio were to decline, the leverage would result in a greater decrease in net asset value to the holders of common stock than if we were not leveraged through the issuance of preferred stock. This greater net asset value decrease would also tend to cause a greater decline in the market price for the common stock. We might be in danger of failing to maintain the required asset coverage of the preferred stock or of losing our ratings on the preferred stock or, in an extreme case, our current investment income might not be sufficient to meet the dividend requirements on the preferred stock. In order to counteract such an event, we might need to liquidate investments in order to fund a redemption of some or all of the preferred stock. In addition, we would pay (and the holders of common stock would bear) all costs and expenses relating to the issuance and ongoing maintenance of the preferred stock, including higher advisory fees if our total return exceeds the dividend rate on the preferred stock. Holders of preferred stock may have different interests than holders of common stock and may at times have disproportionate influence over our affairs.
Holders of any preferred stock we might issue would have the right to elect members of the board of directors and class voting rights on certain matters.
Holders of any preferred stock we might issue, voting separately as a single class, would have the right to elect two members of the board of directors at all times and in the event dividends become two full years in arrears would have the right to elect a majority of the directors until such arrearage is completely eliminated. In addition, preferred stockholders have class voting rights on certain matters, including changes in fundamental investment restrictions and conversion to open-end status, and accordingly can veto any such changes. Restrictions imposed on the declarations and payment of dividends or other distributions to the holders of our common stock and preferred stock, both by the 1940 Act and by requirements imposed by rating agencies or the terms of our credit facilities, might impair our ability to maintain our qualification as a RIC for federal income tax purposes. While we would intend to redeem our preferred stock to the extent necessary to enable us to distribute our income as required to maintain our qualification as a RIC, there can be no assurance that such actions could be effected in time to meet the tax requirements.
29
Table of Contents
RISKS RELATING TO AN INVESTMENT IN OUR COMMON STOCK
Investing in our securities involves a high degree of risk and is highly speculative.
The investments we make in accordance with our investment objective may result in a higher amount of risk than alternative investment options and volatility or loss of principal. Our investments in portfolio companies may be highly speculative and aggressive, therefore, an investment in our securities may not be suitable for someone with a low risk tolerance.
There is a risk that investors in our equity securities may not receive dividends or that our dividends may not grow over time and that investors in our debt securities may not receive all of the interest income to which they are entitled.
We intend to make distributions on a quarterly basis to our stockholders out of assets legally available for distribution. We cannot assure you that we will achieve investment results that will allow us to make a specified level of cash distributions or year-to-year increases in cash distributions. In addition, due to the asset coverage test applicable to us as a business development company, we may in the future be limited in our ability to make distributions. Also, our revolving credit facility may limit our ability to declare dividends if we default under certain provisions or fail to satisfy certain other conditions. If we do not distribute a certain percentage of our income annually, we will suffer adverse tax consequences, including possible loss of the tax benefits available to us as a RIC. In addition, in accordance with U.S. generally accepted accounting principles and tax regulations, we include in income certain amounts that we have not yet received in cash, such as contractual payment-in-kind interest, which represents contractual interest added to the loan balance that becomes due at the end of the loan term, or the accrual of original issue or market discount. Since we may recognize income before or without receiving cash representing such income, we may have difficulty meeting the requirement to distribute at least 90% of our investment company taxable income in cash to obtain tax benefits as a RIC.
We will be subject to a 4% nondeductible federal excise tax on certain undistributed income of RICs unless we distribute in a timely manner an amount at least equal to the sum of (1) 98% of our ordinary income for each calendar year, (2) 98.2% of our capital gain net income for the one-year period ending October 31 in that calendar year and (3) any income recognized, but not distributed, in preceding years. We will not be subject to excise taxes on amounts on which we are required to pay corporate income taxes (such as retained net capital gains).
Finally, if more stockholders opt to receive cash dividends rather than participate in our dividend reinvestment plan, we may be forced to liquidate some of our investments and raise cash in order to make cash dividend payments.
Our shares may trade at discounts from net asset value or at premiums that are unsustainable over the long term.
Shares of business development companies may trade at a market price that is less than the net asset value that is attributable to those shares. The possibility that our shares of common stock will trade at a discount from net asset value or at a premium that is unsustainable over the long term are separate and distinct from the risk that our net asset value will decrease. It is not possible to predict whether shares will trade at, above, or below net asset value.
Investigations and reviews of Apollo affiliates’ use of placement agents could harm the Company’s reputation, depress its stock price or have other negative consequences.
While AIC has not, to date, raised any funds through the use of placement agents (other than through the ordinary course engagement of underwriters, from time to time, in connection with the public offering of AIC’s securities), affiliates of AIM sometimes use placement agents to assist in marketing certain of the investment
30
Table of Contents
funds that they manage. Various state attorneys general and federal and state agencies have initiated industry-wide investigations into the use of placement agents in connection with the solicitation of investments, particularly with respect to investments by public pension funds. Certain affiliates of AGM have received subpoenas and other requests for information from various government regulatory agencies and investors in AGM’s funds, seeking information regarding the use of placement agents. The California Public Employees’ Retirement System, (“CalPERS”), one of AGM’s strategic investors, announced on October 14, 2009, that it had initiated a special review of placement agents and related issues. The report of the CalPERS special review was issued on March 14, 2011. That report does not allege any wrongdoing on the part of AGM or its affiliates. In addition, on May 6, 2010, the California Attorney General filed a civil complaint against Alfred Villalobos and his company, Arvco Capital Research, LLC (a placement agent that AGM has used) and Federico Buenrostro Jr., the former CEO of CalPERS, alleging conduct in violation of certain California laws in connection with CalPERS’ purchase of securities in various funds managed by AGM and another asset manager. No AGM entity is a party to the civil lawsuit, nor does the lawsuit allege any misconduct on the part of AIC, AIM or AGM. Likewise, on April 23, 2012, the United States Securities and Exchange Commission filed a lawsuit alleging securities fraud on the part of Arvco, as well as Messrs. Buenrostro and Villalobos, in connection with their activities concerning certain CalPERS investments in funds managed by AGM. This lawsuit also does not allege wrongdoing on the part of AGM, and in fact alleges that AGM was defrauded by Arvco, Villalobos, and Buenrostro. Finally, on December 29, 2011, the United States Bankruptcy Court for the District of Nevada approved an application made by Mr. Villalobos, Arvco and related entities (the “Arvco Debtors”) in their consolidated bankruptcy proceedings to hire Special Litigation Counsel to pursue certain claims on behalf of the bankruptcy estates of the Arvco Debtors, including potential claims against AGM (a) for fees that AGM purportedly owes the Arvco Debtors for placement agent services, and (b) for indemnification of legal fees and expenses arising out of the Arvco Debtors’ defense of the California Attorney General action described above. On April 23, 2012, the SEC file a lawsuit alleging securities fraud on the part of Arvco, as well as Messrs. Buenrostro and Villalobos, in connection with their activities concerning certain Calpers investment funds managed by AGM. This lawsuit does not allege wrongdoing on the part of Apollo, and in fact alleges that AGM was defrauded by Arvco, Villalobos and Buenrostro. AGM has informed us that it believes it has handled its use of placement agents in an appropriate manner and that it is cooperating with such investigations and other reviews. Any unanticipated developments from these or future investigations or changes in industry practice may adversely affect AGM’s business (including with respect to AIM) or indirectly thereby, AIC’s business. Even if these investigations or changes in industry practice do not directly or indirectly affect AGM’s or AIC’s respective businesses, adverse publicity could harm our reputation and may cause us to lose existing investors, fail to gain new investors, depress our stock price or have other negative consequences.
The market price of our securities may fluctuate significantly.
The market price and liquidity of the market for our securities may be significantly affected by numerous factors, some of which are beyond our control and may not be directly related to our operating performance. These factors include:
| • | volatility in the market price and trading volume of securities of business development companies or other companies in our sector, which are not necessarily related to the operating performance of these companies; |
| • | changes in regulatory policies or tax guidelines, particularly with respect to RICs or business development companies; |
| • | loss of RIC status; |
| • | changes in earnings or variations in operating results; |
| • | changes in the value of our portfolio of investments; |
| • | any shortfall in revenue or net income or any increase in losses from levels expected by investors or securities analysts; |
31
Table of Contents
| • | departure of AIM’s key personnel; |
| • | operating performance of companies comparable to us; |
| • | general economic trends and other external factors; and |
| • | loss of a major funding source. |
We may be unable to invest the net proceeds raised from offerings on acceptable terms, which would harm our financial condition and operating results.
Until we identify new investment opportunities, we intend to either invest the net proceeds of future offerings in interest-bearing deposits or other short-term instruments or use the net proceeds from such offerings to reduce then-outstanding obligations under our credit facility. We cannot assure you that we will be able to find enough appropriate investments that meet our investment criteria or that any investment we complete using the proceeds from an offering will produce a sufficient return.
Sales of substantial amounts of our securities may have an adverse effect on the market price of our securities.
Sales of substantial amounts of our securities, or the availability of such securities for sale, could adversely affect the prevailing market prices for our securities. If this occurs and continues, it could impair our ability to raise additional capital through the sale of securities should we desire to do so.
If you do not fully exercise your subscription rights in any rights offering of our common stock, your interest in us may be diluted and, if the subscription price is less than our net asset value per share, you may experience an immediate dilution of the aggregate net asset value of your shares.
In the event we issue subscription rights to acquire shares of our common stock, stockholders who do not fully exercise their subscription rights should expect that they will, at the completion of the rights offering, own a smaller proportional interest in us than would be the case if they fully exercised their rights.
In addition, if the subscription price is less than the net asset value per share of our common stock, a stockholder who does not fully exercise its subscription rights may experience an immediate dilution of the aggregate net asset value of its shares as a result of the offering.
We would not be able to state the amount of any such dilution prior to knowing the results of the offering. Such dilution could be substantial.
Stockholders may experience dilution in their ownership percentage if they do not participate in our dividend reinvestment plan.
All dividends declared in cash payable to stockholders that are participants in our dividend reinvestment plan are generally automatically reinvested in shares of our common stock. As a result, stockholders that do not participate in the dividend reinvestment plan may experience dilution over time. Stockholders who do not elect to receive dividends in shares of common stock may experience accretion to the net asset value of their shares if our shares are trading at a premium and dilution if our shares are trading at a discount. The level of accretion or discount would depend on various factors, including the proportion of our stockholders who participate in the plan, the level of premium or discount at which our shares are trading and the amount of the dividend payable to a stockholder.
Item 1B. Unresolved Staff Comments
None.
32
Table of Contents
As of March 31, 2013, we did not own any real estate or other physical properties materially important to our operation. Our administrative and principal executive offices are located at 730 Fifth Avenue, New York, NY 10019 and 9 West 57th Street, New York, NY 10019, respectively. We believe that our office facilities are suitable and adequate for our business as it is contemplated to be conducted.
From time to time, we may become involved in various investigations, claims and legal proceedings that arise in the ordinary course of our business. Furthermore, third parties may try to seek to impose liability on us in connection with the activities of our portfolio companies. While we do not expect that the resolution of these matters if they arise would materially affect our business, financial condition or results of operations, resolution will be subject to various uncertainties and could result in the expenditure of significant financial and managerial resources.
Following the conclusion of the fiscal year ended March 31, 2013, the Company on May 20, 2013 learned that it was named as a defendant in a complaint by the bankruptcy trustee of DSI Renal Holdings and related companies (“DSI”). The complaint alleges, among other things, that the Company participated in a “fraudulent conveyance” involving a restructuring and subsequent sale of DSI in 2010 and 2011. The complaint seeks, jointly and severally from all defendants, (1) damages of approximately $425 million, of which the Company’s share would be approximately $41 million, and the return of 9,000 shares of common stock of DSI obtained by the Company in the restructuring and sale and (2) punitive damages. At this point in time, the Company has not yet been served in this action and is unable to assess whether it may have any liability in this action. The Company has not made any determination that this action is or may be material to the Company and intends to vigorously defend itself.
Item 4. Mine Safety Disclosures
Not Applicable.
33
Table of Contents
Item 5. Market for Registrant’s Common Equity, Related Stockholder Matters and Issuer Purchases of Equity Securities
PRICE RANGE OF COMMON STOCK
Our common stock is traded on the NASDAQ Global Select Market under the symbol “AINV.” The following table lists the high and low closing sale price for our common stock, the closing sale price as a percentage of net asset value (“NAV”) and quarterly dividends per share since shares of our common stock began being regularly quoted on NASDAQ.
| NAV(1) | Closing Sales Price | Premium or Discount of High Sales Price to NAV(2) |
Premium or Discount of Low Sales Price to NAV(2) |
Declared Dividends |
||||||||||||||||||||
| High | Low | |||||||||||||||||||||||
| Fiscal Year Ending March 31, 2013 |
||||||||||||||||||||||||
| Fourth Fiscal Quarter |
$ | 8.27 | $ | 9.01 | $ | 8.23 | 9 | % | 0 | % | $ | 0.20 | ||||||||||||
| Third Fiscal Quarter |
$ | 8.14 | $ | 8.47 | $ | 7.29 | 4 | % | (10 | )% | $ | 0.20 | ||||||||||||
| Second Fiscal Quarter |
$ | 8.46 | $ | 8.30 | $ | 7.57 | (2 | )% | (11 | )% | $ | 0.20 | ||||||||||||
| First Fiscal Quarter |
$ | 8.30 | $ | 7.67 | $ | 6.59 | (8 | )% | (21 | )% | $ | 0.20 | ||||||||||||
| Fiscal Year Ending March 31, 2012 |
||||||||||||||||||||||||
| Fourth Fiscal Quarter |
$ | 8.55 | $ | 8.00 | $ | 6.67 | (6 | )% | (22 | )% | $ | 0.20 | ||||||||||||
| Third Fiscal Quarter |
$ | 8.16 | $ | 8.55 | $ | 5.99 | 5 | % | (27 | )% | $ | 0.28 | ||||||||||||
| Second Fiscal Quarter |
$ | 8.12 | $ | 10.60 | $ | 7.39 | 31 | % | (9 | )% | $ | 0.28 | ||||||||||||
| First Fiscal Quarter |
$ | 9.76 | $ | 12.23 | $ | 9.71 | 25 | % | (1 | )% | $ | 0.28 | ||||||||||||
| (1) | NAV per share is determined as of the last day in the relevant quarter and therefore may not reflect the NAV per share on the date of the high and low sales prices. The NAVs shown are based on outstanding shares at the end of each period. |
| (2) | Calculated using the respective high or low closing sales price divided by the quarter end NAV. |
While our common stock has from time to time traded in excess of our net asset value, there can be no assurance, however, that it will trade at such a premium (to net asset value) in the future. The last reported closing market price of our common stock on May 21, 2013 was $8.76 per share. As of May 21, 2013, we had 98 stockholders of record.
DIVIDENDS
We intend to continue to distribute quarterly dividends to our stockholders. Our quarterly dividends, if any, will be determined by our board of directors. We expect that our distributions to shareholders generally will be from accumulated net investment income and from cumulative net realized capital gains, as applicable, although a portion may represent a return of capital.
We have elected to be taxed as a RIC under Subchapter M of the Code. To maintain our RIC status, we must distribute at least 90% of our ordinary income and realized net short-term capital gains in excess of realized net long-term capital losses, if any, out of the assets legally available for distribution. In addition, although we currently intend to distribute realized net capital gains (i.e., net long-term capital gains in excess of short-term capital losses), if any, at least annually, out of the assets legally available for such distributions, we may in the future decide to retain such capital gains for investment. In addition, we have substantial net capital loss carryforwards and consequently do not expect to generate cumulative net capital gains in the foreseeable future.
34
Table of Contents
We maintain an “opt out” dividend reinvestment plan for our common stockholders. As a result, if we declare a dividend, then stockholders’ cash dividends will be automatically reinvested in additional shares of our common stock, unless they specifically “opt out” of the dividend reinvestment plan so as to receive cash dividends.
We may not be able to achieve operating results that will allow us to make distributions at a specific level or to increase the amount of these distributions from time to time. In addition, due to the asset coverage test applicable to us as a business development company, we may in the future be limited in our ability to make distributions. Also, our revolving credit facility may limit our ability to declare dividends if we default under certain provisions or fail to satisfy certain other conditions. If we do not distribute a certain percentage of our income annually, we may suffer adverse tax consequences, including possible loss of the tax benefits available to us as a regulated investment company. In addition, in accordance with U.S. generally accepted accounting principles and tax regulations, we include in income certain amounts that we have not yet received in cash, such as contractual payment-in-kind interest, which represents contractual interest added to the loan balance that becomes due at the end of the loan term, or the accrual of original issue or market discount. Since we may recognize income before or without receiving cash representing such income, we may not be able to meet the requirement to distribute at least 90% of our investment company taxable income to obtain tax benefits as a regulated investment company.
With respect to the dividends to stockholders, income from origination, structuring, closing, commitment and other upfront fees associated with investments in portfolio companies is treated as taxable income and accordingly, distributed to stockholders.
All dividends declared in cash payable to stockholders that are participants in our dividend reinvestment plan are generally automatically reinvested in shares of our common stock. As a result, stockholders that do not participate in the dividend reinvestment plan may experience dilution over time. Stockholders who do not elect to receive dividends in shares of common stock may experience accretion to the net asset value of their shares if our shares are trading at a premium and dilution if our shares are trading at a discount. The level of accretion or discount would depend on various factors, including the proportion of our stockholders who participate in the plan, the level of premium or discount at which our shares are trading and the amount of the dividend payable to a stockholder.
The following table lists the quarterly dividends per share from our common stock for the past two fiscal years.
| Declared Dividends | ||||
| Fiscal Year Ending March 31, 2013 |
||||
| Fourth Fiscal Quarter |
$ | 0.20 | ||
| Third Fiscal Quarter |
$ | 0.20 | ||
| Second Fiscal Quarter |
$ | 0.20 | ||
| First Fiscal Quarter |
$ | 0.20 | ||
| Fiscal Year Ending March 31, 2012 |
||||
| Fourth Fiscal Quarter |
$ | 0.20 | ||
| Third Fiscal Quarter |
$ | 0.28 | ||
| Second Fiscal Quarter |
$ | 0.28 | ||
| First Fiscal Quarter |
$ | 0.28 | ||
Recent Sale of Unregistered Securities
None.
Issuer Purchases of Equity Securities
During the fiscal year ended March 31, 2013, as a part of our dividend reinvestment plan for our common shareholders, we purchased 1,931,526 shares of our common stock in the open market at an average price of $8.35 per share and transferred those shares to the participants in the dividend reinvestment plan.
35
Table of Contents
STOCK PERFORMANCE GRAPH
This graph compares the return on our common stock with that of the Standard & Poor’s 500 Stock Index and the Russell 2000 Financial Services Index, for the period March 31, 2008 through March 31, 2013. The graph assumes that, on March 31, 2008, a person invested $100 in each of the following: our common stock, the S&P 500 Index, the Russell 2000 Financial Services Index, and the S&P Small Cap 600 Financials Index. The graph measures total stockholder return, which takes into account both changes in stock price and dividends. It assumes that dividends paid are invested in like securities.
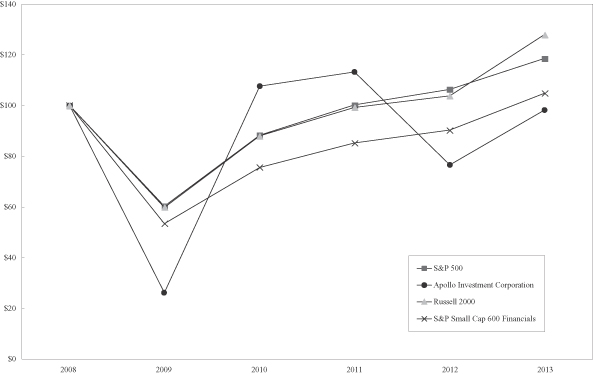
The graph and other information furnished under this Part II Item 5 of this Form 10-K shall not be deemed to be “soliciting material” or to be “filed” with the SEC or subject to Regulation 14A or 14C, or to the liabilities of Section 18 of the 1934 Act. The stock price performance included in the above graph is not necessarily indicative of future stock price performance.
36
Table of Contents
Item 6. Selected Financial Data
The Statement of Operations, Per Share and Balance Sheet data for the fiscal years ended March 31, 2013, 2012, 2011, 2010, and 2009 are derived from our financial statements which have been audited by PricewaterhouseCoopers LLP, our independent registered public accounting firm. This selected financial data should be read in conjunction with our financial statements and related notes thereto and “Management’s Discussion and Analysis of Financial Condition and Results of Operations” included elsewhere in this report.
| For the Year Ended March 31, (dollar amounts in thousands, except per share data) |
||||||||||||||||||||
| Statement of Operations Data: |
2013 | 2012 | 2011 | 2010 | 2009 | |||||||||||||||
| Total Investment Income |
$ | 331,994 | $ | 357,584 | $ | 358,779 | $ | 340,238 | $ | 377,304 | ||||||||||
| Net Expenses (including excise taxes) |
$ | 164,634 | $ | 184,842 | $ | 167,607 | $ | 140,828 | $ | 170,973 | ||||||||||
| Net Investment Income |
$ | 167,360 | $ | 172,742 | $ | 191,172 | $ | 199,410 | $ | 206,331 | ||||||||||
| Net Realized and Unrealized Gains (Losses) |
$ | (62,889 | ) | $ | (259,006 | ) | $ | (10,760 | ) | $ | 63,880 | $ | (818,210 | ) | ||||||
| Net Increase (Decrease) in Net Assets Resulting from Operations |
$ | 104,471 | $ | (86,264 | ) | $ | 180,412 | $ | 263,290 | $ | (611,879 | ) | ||||||||
| Per Share Data: |
||||||||||||||||||||
| Net Asset Value |
$ | 8.27 | $ | 8.55 | $ | 10.03 | $ | 10.06 | $ | 9.82 | ||||||||||
| Net Investment Income |
$ | 0.83 | $ | 0.88 | $ | 0.99 | $ | 1.26 | $ | 1.48 | ||||||||||
| Net Increase (Decrease) in Net Assets Resulting from Operations (Basic and Diluted) |
$ | 0.51 | $ | (0.44 | ) | $ | 0.93 | $ | 1.65 | $ | (4.39 | ) | ||||||||
| Distributions Declared |
$ | 0.80 | $ | 1.04 | $ | 1.12 | $ | 1.10 | $ | 1.82 | ||||||||||
| Balance Sheet Data: |
||||||||||||||||||||
| Total Assets |
$ | 2,944,312 | $ | 2,775,263 | $ | 3,148,813 | $ | 3,465,116 | $ | 2,548,639 | ||||||||||
| Debt Outstanding |
$ | 1,156,067 | $ | 1,009,337 | $ | 1,053,443 | $ | 1,060,616 | $ | 1,057,601 | ||||||||||
| Total Net Assets |
$ | 1,677,389 | $ | 1,685,231 | $ | 1,961,031 | $ | 1,772,806 | $ | 1,396,138 | ||||||||||
| Other Data: |
||||||||||||||||||||
| Total Return(1) |
28.2 | % | (32.4 | )% | 5.1 | % | 313.0 | % | (73.9 | )% | ||||||||||
| Number of Portfolio Companies at Year End |
81 | 62 | 69 | 67 | 72 | |||||||||||||||
| Total Portfolio Investments for the Year |
$ | 1,537,366 | $ | 1,480,508 | $ | 1,085,601 | $ | 716,425 | $ | 434,995 | ||||||||||
| Investment Sales and Repayments for the Year |
$ | 1,337,431 | $ | 1,634,520 | $ | 977,493 | $ | 451,687 | $ | 339,724 | ||||||||||
| Weighted Average Yield on Debt Portfolio at Year End |
11.9 | % | 11.9 | % | 11.6 | % | 11.8 | % | 11.7 | % | ||||||||||
| Weighted Average Shares Outstanding at Year End (Basic)(2) |
202,875 | 196,584 | 193,192 | 159,369 | 139,469 | |||||||||||||||
| (1) | Total return is based on the change in market price per share and takes into account dividends and distributions, if any, reinvested in accordance with Apollo Investment’s dividend reinvestment plan. |
| (2) | Weighted Average Shares Outstanding on a diluted basis for the fiscal year ended March 31, 2013 were 217,423. Weighted Average Shares Outstanding on a diluted basis for the fiscal year ended March 31, 2012 were 211,132. Weighted Average Shares Outstanding on a diluted basis for the fiscal year ended March 31, 2011 were 195,823. For the fiscal years ended 2010 and 2009, basic and diluted weighted average shares were the same. |
37
Table of Contents
Item 7. Management’s Discussion and Analysis of Financial Condition and Results of Operations
The following analysis of our financial condition and results of operations should be read in conjunction with our financial statements and the notes thereto contained elsewhere in this report.
Some of the statements in this report constitute forward-looking statements, which relate to future events or our future performance or financial condition. The forward-looking statements contained herein involve risks and uncertainties, including statements as to:
| • | our future operating results; |
| • | our business prospects and the prospects of our portfolio companies; |
| • | the impact of investments that we expect to make; |
| • | our contractual arrangements and relationships with third parties; |
| • | the dependence of our future success on the general economy and its impact on the industries in which we invest; |
| • | the ability of our portfolio companies to achieve their objectives; |
| • | our expected financings and investments; |
| • | the adequacy of our cash resources and working capital; and |
| • | the timing of cash flows, if any, from the operations of our portfolio companies. |
We generally use words such as “anticipates,” “believes,” “expects,” “intends” and similar expressions to identify forward-looking statements. Our actual results could differ materially from those projected in the forward-looking statements for any reason, including any factors set forth in “Risk Factors” and elsewhere in this report.
We have based the forward-looking statements included in this report on information available to us on the date of this report, and we assume no obligation to update any such forward-looking statements. Although we undertake no obligation to revise or update any forward-looking statements, whether as a result of new information, future events or otherwise, you are advised to consult any additional disclosures that we may make directly to you or through reports that we in the future may file with the SEC, including any annual reports on Form 10-K, quarterly reports on Form 10-Q and current reports on Form 8-K.
OVERVIEW
Apollo Investment was incorporated under the Maryland General Corporation Law in February 2004. We have elected to be treated as a BDC under the 1940 Act. As such, we are required to comply with certain regulatory requirements. For instance, we generally have to invest at least 70% of our total assets in “qualifying assets,” including securities of private or thinly traded public U.S. companies, cash equivalents, U.S. government securities and high-quality debt investments that mature in one year or less. In addition, for federal income tax purposes we have elected to be treated as a RIC under Subchapter M of the Code. Pursuant to this election and assuming we qualify as a RIC, we generally do not have to pay corporate-level federal income taxes on any income we distribute to our stockholders. Apollo Investment commenced operations on April 8, 2004 upon completion of its initial public offering that raised $870 million in net proceeds selling 62 million shares of its common stock at a price of $15.00 per share. Since then, and through March 31, 2013, we have raised approximately $1.9 billion in net proceeds from additional offerings of common stock. Subsequent to March 31, 2013 we raised an additional $0.2 billion in net proceeds from an offering of common stock.
Investments
Our level of investment activity can and does vary substantially from period to period depending on many factors, including the amount of debt and equity capital available to middle market companies, the level of
38
Table of Contents
merger and acquisition activity for such companies, the general economic environment and the competitive environment for the types of investments we make. As a business development company, we must not acquire any assets other than “qualifying assets” specified in the 1940 Act unless, at the time the acquisition is made, at least 70% of our total assets are qualifying assets (with certain limited exceptions).
Revenue
We generate revenue primarily in the form of interest and dividend income from the securities we hold and capital gains, if any, on investment securities that we may acquire in portfolio companies. Our debt investments, whether in the form of mezzanine or senior secured loans, generally have a stated term of five to ten years and bear interest at a fixed rate or a floating rate usually determined on the basis of a benchmark: LIBOR, Euro Interbank Offered Rate (EURIBOR), British pound sterling LIBOR (GBP LIBOR), or the prime rate. Interest on debt securities is generally payable quarterly or semiannually and while U.S. subordinated debt and corporate notes typically accrue interest at fixed rates, some of our investments may include zero coupon and/or step-up bonds that accrue income on a constant yield to call or maturity basis. In addition, some of our investments provide for PIK interest or dividends. Such amounts of accrued PIK interest or dividends are added to the cost of the investment on the respective capitalization dates and generally become due at maturity of the investment or upon the investment being called by the issuer. We may also generate revenue in the form of commitment, origination, structuring fees, fees for providing managerial assistance and, if applicable, consulting fees, etc.
Expenses
All investment professionals of the investment adviser and their staff, when and to the extent engaged in providing investment advisory and management services to us, and the compensation and routine overhead expenses of that personnel which is allocable to those services are provided and paid for by AIM. We bear all other costs and expenses of our operations and transactions, including those relating to:
| • | investment advisory and management fees; |
| • | expenses incurred by AIM payable to third parties, including agents, consultants or other advisors, in monitoring our financial and legal affairs and in monitoring our investments and performing due diligence on our prospective portfolio companies; |
| • | calculation of our net asset value (including the cost and expenses of any independent valuation firm); |
| • | direct costs and expenses of administration, including independent registered public accounting and legal costs; |
| • | costs of preparing and filing reports or other documents with the SEC; |
| • | interest payable on debt, if any, incurred to finance our investments; |
| • | offerings of our common stock and other securities; |
| • | registration and listing fees; |
| • | fees payable to third parties, including agents, consultants or other advisors, relating to, or associated with, evaluating and making investments; |
| • | transfer agent and custodial fees; |
| • | taxes; |
| • | independent directors’ fees and expenses; |
| • | marketing and distribution-related expenses; |
| • | the costs of any reports, proxy statements or other notices to stockholders, including printing and postage costs; |
39
Table of Contents
| • | our allocable portion of the fidelity bond, directors and officers/errors and omissions liability insurance, and any other insurance premiums; |
| • | organizational costs; and |
| • | all other expenses incurred by us or the Administrator in connection with administering our business, such as our allocable portion of overhead under the Administration Agreement, including rent and our allocable portion of the cost of our chief financial officer and chief compliance officer and their respective staffs. |
We expect our general and administrative operating expenses related to our ongoing operations to increase moderately in dollar terms. During periods of asset growth, we generally expect our general and administrative operating expenses to decline as a percentage of our total assets and increase during periods of asset declines. Incentive fees, interest expense and costs relating to future offerings of securities, among others, may also increase or reduce overall operating expenses based on portfolio performance, interest rate benchmarks, and offerings of our securities relative to comparative periods, among other factors.
Portfolio and Investment Activity
During our fiscal year ended March 31, 2013, we invested $1.5 billion across 49 new and 36 existing portfolio companies through a combination of primary and secondary market purchases. This compares to investing $1.5 billion in 21 new and 18 existing portfolio companies for the previous fiscal year ended March 31, 2012. Investments sold or repaid during the fiscal year ended March 31, 2013 totaled $1.3 billion versus $1.6 billion for the fiscal year ended March 31, 2012.
At March 31, 2013, our net portfolio consisted of 81 portfolio companies and was invested 44% in secured debt, 43% in unsecured debt, 7% in structured products, 0% in preferred equity and 6% in common equity and warrants measured at fair value versus 62 portfolio companies invested 32% in secured debt, 57% in unsecured debt, 3% in structured products, 1% in preferred equity and 7% in common equity and warrants at March 31, 2012.
The weighted average yields on our secured loan portfolio, unsecured debt portfolio and total debt portfolio as of March 31, 2013 at our current cost basis were 11.2%, 12.7% and 11.9%, respectively. At March 31, 2012, the yields were 10.2%, 12.7%, and 11.9%, respectively.
Since the initial public offering of Apollo Investment in April 2004 and through March 31, 2013, invested capital totaled $10.3 billion in 215 portfolio companies. Over the same period, Apollo Investment completed transactions with more than 100 different financial sponsors.
At March 31, 2013, 64% or $1.6 billion of our income-bearing debt investment portfolio is fixed rate debt and 36% or $0.9 billion is floating rate debt, measured at fair value. On a cost basis, 65% or $1.6 billion of our income-bearing investment portfolio is fixed rate debt and 35% or $0.9 billion is floating rate debt. At March 31, 2012, 67% or $1.6 billion of our income-bearing investment portfolio was fixed rate debt and 33% or $0.8 billion was floating rate debt. On a cost basis, 65% or $1.7 billion of our income-bearing investment portfolio was fixed rate debt and 35% or $0.9 billion was floating rate debt.
CRITICAL ACCOUNTING POLICIES
Our discussion and analysis of our financial condition and results of operations are based upon our financial statements, which have been prepared in accordance with accounting principles generally accepted in the United States of America, or GAAP. The preparation of these financial statements requires management to make estimates and assumptions that affect the reported amounts of assets, liabilities, revenues and expenses. Changes in the economic environment, financial markets and any other parameters used in determining such estimates could cause actual results to differ materially. In addition to the discussion below, our critical accounting policies are further described in the notes to the financial statements.
40
Table of Contents
Valuation of Portfolio Investments
Under procedures established by our board of directors, we value investments, including certain secured debt, unsecured debt, and other debt securities with maturities greater than 60 days, for which market quotations are readily available, at such market quotations (unless they are deemed not to represent fair value). We attempt to obtain market quotations from at least two brokers or dealers (if available, otherwise from a principal market maker or a primary market dealer or other independent pricing service). We utilize mid-market pricing as a practical expedient for fair value unless a different point within the range is more representative. If and when market quotations are deemed not to represent fair value, we typically utilize independent third party valuation firms to assist us in determining fair value. Accordingly, such investments go through our multi-step valuation process as described below. In each case, our independent valuation firms consider observable market inputs together with significant unobservable inputs in arriving at their valuation recommendations for such Level 3 categorized assets. Debt investments with remaining maturities of 60 days or less shall each be valued at cost with interest accrued or discount amortized to the date of maturity, unless such valuation, in the judgment of our investment adviser, does not represent fair value, in which case such investments shall be valued at fair value as determined in good faith by or under the direction of our board of directors. Investments that are not publicly traded or whose market quotations are not readily available are valued at fair value as determined in good faith by or under the direction of our board of directors. Such determination of fair values may involve subjective judgments and estimates.
With respect to investments for which market quotations are not readily available or when such market quotations are deemed not to represent fair value, our board of directors has approved a multi-step valuation process each quarter, as described below:
(1) our quarterly valuation process begins with each portfolio company or investment being initially valued by the investment professionals of our investment adviser responsible for the portfolio investment;
(2) preliminary valuation conclusions are then documented and discussed with senior management of our investment adviser;
(3) independent valuation firms are engaged by our board of directors to conduct independent appraisals by reviewing our investment adviser’s preliminary valuations and then making their own independent assessment;
(4) the audit committee of the board of directors reviews the preliminary valuation of our investment adviser and the valuation prepared by the independent valuation firm and responds to the valuation recommendation of the independent valuation firm to reflect any comments; and
(5) the board of directors discusses valuations and determines in good faith the fair value of each investment in our portfolio based on the input of our investment adviser, the applicable independent valuation firm, third party pricing services and the audit committee.
Investments in all asset classes are valued utilizing a market approach, an income approach, or both approaches, as appropriate. The market approach uses prices and other relevant information generated by market transactions involving identical or comparable assets or liabilities (including a business). The income approach uses valuation techniques to convert future amounts (for example, cash flows or earnings) to a single present amount (discounted). The measurement is based on the value indicated by current market expectations about those future amounts. In following these approaches, the types of factors that we may take into account in fair value pricing our investments include, as relevant: available current market data, including relevant and applicable market trading and transaction comparables, applicable market yields and multiples, security covenants, call protection provisions, information rights, the nature and realizable value of any collateral, the portfolio company’s ability to make payments, its earnings and discounted cash flows, the markets in which the portfolio company does business, comparisons of financial ratios of peer companies that are public, M&A comparables, our principal market (as the reporting entity) and enterprise values, among other factors. When readily available, broker
41
Table of Contents
quotations and/or quotations provided by pricing services are considered in the valuation process of independent valuation firms. For the fiscal year ended March 31, 2013, there was no change to the Company’s valuation techniques and related inputs considered in the valuation process.
ASC 820 classifies the inputs used to measure these fair values into the following hierarchy:
Level 1: Quoted prices in active markets for identical assets or liabilities, accessible by the Company at the measurement date.
Level 2: Quoted prices for similar assets or liabilities in active markets, or quoted prices for identical or similar assets or liabilities in markets that are not active, or other observable inputs other than quoted prices.
Level 3: Unobservable inputs for the asset or liability.
In all cases, the level in the fair value hierarchy within which the fair value measurement in its entirety falls has been determined based on the lowest level of input that is significant to the fair value measurement. Our assessment of the significance of a particular input to the fair value measurement in its entirety requires judgment and considers factors specific to each investment.
Revenue Recognition
The Company records interest and dividend income, adjusted for amortization of premium and accretion of discount, on an accrual basis. Some of our loans and other investments, including certain preferred equity investments, may have contractual payment-in-kind (“PIK”) interest or dividends. PIK interest and dividends computed at the contractual rate are accrued into income and reflected as receivable up to the capitalization date. PIK investments offer issuers the option at each payment date of making payments in cash or in additional securities. When additional securities are received, they typically have the same terms, including maturity dates and interest rates as the original securities issued. On these payment dates, the Company capitalizes the accrued interest or dividends receivable (reflecting such amounts as the basis in the additional securities received). PIK generally becomes due at maturity of the investment or upon the investment being called by the issuer. At the point the Company believes PIK is not expected to be realized, the PIK investment will be placed on non-accrual status. When a PIK investment is placed on non-accrual status, the accrued, uncapitalized interest or dividends are reversed from the related receivable through interest or dividend income, respectively. The Company does not reverse previously capitalized PIK interest or dividends. Upon capitalization, PIK is subject to the fair value estimates associated with their related investments. PIK investments on non-accrual status are restored to accrual status if the Company believes that PIK is expected to be realized. For the fiscal year ended March 31, 2013, accrued PIK totaled $20.3 million, on total investment income of $332.0 million. Loan origination fees, original issue discount, and market discounts are capitalized and amortized into income using the interest method or straight-line, as applicable. Upon the prepayment of a loan, any unamortized loan origination fees are recorded as interest income. We record prepayment premiums on loans and other investments as interest income when we receive such amounts. Structuring fees are recorded as other income when earned. Investments that are expected to pay regularly scheduled interest and/or dividends in cash are generally placed on non-accrual status when principal or interest/dividend cash payments are past due 30 days or more and/or when it is no longer probable that principal or interest/dividend cash payments will be collected. Such non-accrual investments are restored to accrual status if past due principal and interest or dividends are paid in cash, and in management’s judgment, are likely to continue timely payment of their remaining interest or dividend obligations. Interest or dividend cash payments received on non-accrual designated investments may be recognized as income or applied to principal depending upon management’s judgment.
Net Realized Gains or Losses and Net Change in Unrealized Appreciation or Depreciation
We measure realized gains or losses by the difference between the net proceeds from the repayment or sale and the amortized cost basis of the investment, without regard to unrealized appreciation or depreciation previously
42
Table of Contents
recognized, but considering unamortized upfront fees and prepayment penalties. Net change in unrealized appreciation or depreciation reflects the change in portfolio investment values during the reporting period, including the reversal of previously recorded unrealized appreciation or depreciation.
Within the context of these critical accounting policies, we are not currently aware of any reasonably likely events or circumstances that would result in materially different amounts being reported.
RESULTS OF OPERATIONS
Results comparisons are for the fiscal years ended March 31, 2013, March 31, 2012 and March 31, 2011.
Investment Income
For the fiscal years ended March 31, 2013, 2012 and 2011, gross investment income totaled $332.0 million, $357.6 million and $358.8 million, respectively. The decrease in gross investment income from fiscal year 2012 to fiscal year 2013 was primarily driven by a smaller portfolio, on average with which to generate income. This was partially offset by slightly higher yields on the debt portfolio. Also contributing to the decrease in gross investment income was lower non-recurring income of $9.1 million in fiscal year 2013. The decrease in gross investment income from fiscal year 2011 to fiscal year 2012 was primarily due to a decrease in the size of the income-producing portfolio as compared to the previous fiscal year and was partially offset by an increase in the weighted average portfolio yield as well as an increase in other income.
Net Expenses
Net expenses totaled $164.6 million, $184.8 million and $167.6 million, respectively, for the fiscal years ended March 31, 2013, 2012 and 2011, of which $94.1 million, $100.0 million and $107.6 million, respectively, were base management fees and performance-based incentive fees and $58.2 million, $66.4 million and $48.0 million, respectively, were interest and other debt expenses. Administrative services and other general and administrative expenses totaled $12.3 million, $18.5 million and $12.0 million, respectively, for the fiscal years ended March 31, 2013, 2012 and 2011. Net expenses consist of base investment advisory and management fees, insurance expenses, administrative services fees, legal fees, directors’ fees, audit and tax services expenses, and other general and administrative expenses. The decrease in net expenses from fiscal 2012 to fiscal 2013 was primarily due to lower interest and debt costs as a result of less debt outstanding, on average, during the fiscal year-ended March 31, 2013, lower management and incentive fees as a result of the implementation of the fee waiver in fiscal 2013 coupled with a smaller asset base in which to generate management fees. Lastly, in fiscal 2012 there were $4 million of non-recurring expenses as compared to $1 million of non-recurring expense in fiscal 2013. The increase in net expenses from fiscal 2011 to fiscal 2012 was primarily due to an increase in interest and other debt expenses as our net weighted average annual interest cost increased by approximately 100 basis points. This increase was due to the impact of fixed rate debt issuances. Additionally, during fiscal 2012 there were net non-recurring general and administrative expenses that totaled over $4 million. There were no accrued excise tax expenses for the fiscal years ended March 31, 2013, 2012 and 2011.
Net Investment Income
The Company’s net investment income totaled $167.4 million, $172.7 million and $191.2 million, or $0.83, $0.88 and $0.99 on a per average share basis, respectively, for the fiscal years ended March 31, 2013, 2012 and 2011.
Net Realized Losses
The Company had investment sales and repayments totaling $1.3 billion, $1.6 billion and $977 million, respectively, for the fiscal years ended March 31, 2013, 2012 and 2011. Net realized losses for the fiscal years
43
Table of Contents
ended March 31, 2013, 2012, and 2011 were $74.7 million, $341.4 million and $152.0 million, respectively. Net realized losses incurred during fiscal year 2013 were primarily derived from the exits of select investments, specifically New Omaha Holdings equity, Cengage Learning Acquisitions 2nd Lien, and RBS Holdings 1st Lien which comprised approximately $78 million of the net realized loss totals. The realized losses incurred upon the exit of New Omaha Holdings equity and RBS Holdings 1st Lien reversed out $40 million and $5 million, respectively, of previously reported unrealized losses. Net realized losses incurred during fiscal year 2012 were primarily derived from the exits of select investments, specifically Grand Prix Holdings, which accounted for over $273 million of the realized loss totals, but also included Playpower Holdings, TL Acquisitions and FSC Holdings, among others. The realized losses incurred upon the exit of these investments reversed out previously reported unrealized losses. Net realized losses incurred during fiscal year 2011 were primarily related to sales and restructurings of certain underperforming portfolio companies such as American Safety Razor, LVI Devices and Pacific Crane Maintenance Company, various portfolio optimization measures, and our liquidity management strategy during the financial crisis early in the 2010 fiscal year.
Net Unrealized Appreciation (Depreciation) on Investments, Cash Equivalents and Foreign Currencies
For the fiscal years ended March 31, 2013, 2012 and 2011 net change in unrealized appreciation on the Company’s investments, cash equivalents, foreign currencies and other assets and liabilities totaled $11.8 million, $82.4 million and $141.3 million, respectively. Driving the positive impact to unrealized appreciation was New Omaha and AB Acquisitions which were both exited in the fiscal year 2013 which resulted in the reversal of approximately $50 million of previously recognized negative unrealized depreciation. Other significant contributors to the positive change in unrealized depreciation for the period were investments in AIC Credit Opportunity Fund, LVI Services, Penton Business Media Holdings, LLC and Ceridian Corporation. Offsetting the positive impact of these investments were select holdings in certain portfolio companies such as Cengage, Playpower, Delta and Garden Fresh which resulted in negative unrealized depreciation during fiscal 2013. Net unrealized appreciation for fiscal 2012 included the reclassification of over $273 million of previously recognized unrealized depreciation on our investment in Grand Prix Holdings to a realized loss. This reclassification was offset by generally weaker capital market conditions as compared to the year ago period. Net unrealized appreciation for fiscal 2011 was primarily due to the recognition of realized losses which reversed unrealized depreciation, net changes in specific portfolio company fundamentals, and improving capital market conditions.
Net Increase (Decrease) in Net Assets From Operations
For the fiscal year ended March 31, 2013, the Company had a net increase in net assets resulting from operations of $104.5 million. For the fiscal year ended March 31, 2012, the Company had a net decrease in net assets resulting from operations of $86.3 million. For the fiscal years ended March 31, 2011, the Company had a net increase in net assets resulting from operations of $180.4 million. For the year ended March 31, 2013, basic and diluted income per average share were $0.51. For the year ended March 31, 2012, basic and diluted losses per average share were $0.44. For the year ended March 31, 2011, basic and diluted earnings per average share were $0.93.
LIQUIDITY AND CAPITAL RESOURCES
The Company’s liquidity and capital resources are generated and generally available through periodic follow-on equity and debt offerings, our senior secured, multi-currency $1.14 billion Senior Secured Facility maturing on May 23, 2016 (see note 12 within the Notes to Financial Statements), our senior secured notes, our senior unsecured notes, investments in special purpose entities in which we hold and finance particular investments on a non-recourse basis, as well as from cash flows from operations, investment sales of liquid assets and repayments of senior and subordinated loans and income earned from investments. The Company also has investments in its portfolio that contain PIK provisions. PIK investments offer issuers the option at each payment date of making payments in cash or in additional securities. When additional securities are received, they typically have the same
44
Table of Contents
terms, including maturity dates and interest rates as the original securities issued. On these payment dates, the Company capitalizes the accrued interest or dividends receivable (reflecting such amounts as the basis in the additional securities received). PIK generally becomes due at maturity of the investment or upon the investment being called by the issuer. In order to maintain the Company’s status as a RIC, this non-cash source of income must be paid out to stockholders annually in the form of dividends, even though the Company has not yet collected the cash. For the fiscal year ended March 31, 2013, accrued PIK totaled $20.3 million, on total investment income of $332.0 million. At March 31, 2013, the Company had $536 million in borrowings outstanding on its Senior Secured Facility and $604 million of unused capacity. As of March 31, 2013, aggregate lender commitments under the Senior Secured Facility totaled $1.140 billion.
On September 30, 2010, the Company entered into a note purchase agreement, providing for a private placement issuance of $225 million in aggregate principal amount of five-year, senior secured notes with a fixed interest rate of 6.25% and a maturity date of October 4, 2015 (the “Senior Secured Notes”). On October 4, 2010, the Senior Secured Notes were sold to certain institutional accredited investors pursuant to an exemption from registration under the Securities Act of 1933, as amended. Interest on the Senior Secured Notes will be due semi-annually on April 4 and October 4, commencing on April 4, 2011. The proceeds from the issuance of the Senior Secured Notes were primarily used to reduce other outstanding borrowings and/or commitments on the Company’s Senior Secured Facility.
On January 25, 2011, we closed a private offering of $200 million aggregate principal amount of senior unsecured convertible notes (the “Convertible Notes”). The Convertible Notes were issued in a private placement only to qualified institutional buyers pursuant to Rule 144A under the Securities Act of 1933. The Convertible Notes bear interest at an annual rate of 5.75%, payable semi-annually in arrears on January 15 and July 15 of each year, commencing on July 15, 2011. The Convertible Notes will mature on January 15, 2016 unless earlier converted or repurchased at the holder’s option. Prior to December 15, 2015, the Convertible Notes will be convertible only upon certain corporate reorganizations, dilutive recapitalizations or dividends, or if, during specified periods our shares trade at more than 130% of the then applicable conversion price or the Convertible Notes trade at less than 97% of their conversion value and, thereafter, at any time. The Convertible Notes will be convertible by the holders into shares of common stock, initially at a conversion rate of 72.7405 shares of the Company’s common stock per $1,000 principal amount of Convertible Notes (14,548,100 common shares) corresponding to an initial conversion price of approximately $13.75, which represents a premium of 17.5% to the $11.70 per share closing price of the Company’s common stock on The NASDAQ Global Select Market on January 19, 2011. The conversion rate will be subject to adjustment upon certain events, such as stock splits and combinations, mergers, spin-offs, increases in dividends in excess of $0.28 per share per quarter and certain changes in control. Certain of these adjustments, including adjustments for increases in dividends, are subject to a conversion price floor of $11.70 per share. The Convertible Notes are senior unsecured obligations and rank senior in right of payment to our existing and future indebtedness that is expressly subordinated in right of payment to the Convertible Notes; equal in right of payment to our existing and future unsecured indebtedness that is not so subordinated; effectively junior in right of payment to any of our secured indebtedness (including existing unsecured indebtedness that we later secure) to the extent of the value of the assets securing such indebtedness; and structurally junior to all existing and future indebtedness (including trade payables) incurred by our subsidiaries, financing vehicles or similar facilities.
On August 11, 2011, the Company adopted a plan for the purpose of repurchasing up to $200 million of its common stock in accordance with the guidelines specified in Rule 10b-18 and Rule 10b5-1 of the Securities Exchange Act of 1934. The Company’s plan was designed to allow it to repurchase its shares both during its open window periods and at times when it otherwise might be prevented from doing so under insider trading laws or because of self-imposed trading blackout periods. A broker selected by the Company will have the authority under the terms and limitations specified in the plan to repurchase shares on the Company’s behalf in accordance with the terms of the plan. Repurchases are subject to SEC regulations as well as certain price, market volume and timing constraints specified in the plan. While the portion of the plan reliant on Rule 10b-18 remains in effect, the portion reliant on Rule 10b5-1 is subject to periodic renewal and is not currently in effect. As of March 31, 2013, no shares have been repurchased.
45
Table of Contents
On September 29, 2011, the Company closed a private offering of $45 million aggregate principal amount of senior secured notes (the “Notes”) consisting of two series: (1) 5.875% Senior Secured Notes, Series A, of the Company due September 29, 2016 in the aggregate principal amount of $29 million; and (2) 6.250% Senior Secured Notes, Series B, of the Company due September 29, 2018, in the aggregate principal amount of $16 million. The Notes were issued in a private placement only to qualified institutional buyers pursuant to Rule 144A under the Securities Act of 1933, as amended.
In April 2012, the Company announced that a subsidiary of Apollo Global Management, LLC purchased 5,847,953 newly issued shares of the Company based on the NAV as of March 31, 2012 of $8.55 per share. AIM has agreed to waive the base management and incentive fees associated with this equity capital for the time period beginning April 2, 2012 through March 31, 2014.
On October 9, 2012, the Company issued $150 million in aggregate principal amount of 6.625% senior unsecured notes due 2042 for net proceeds of $145.3 million (the “2042 Notes”). Interest on the 2042 Notes is paid quarterly on January 15, April 15, July 15 and October 15, at a rate of 6.625% per year, commencing on January 15, 2013. The 2042 Notes mature on October 15, 2042. The Company may redeem the 2042 Notes in whole or in part at any time or from time to time on or after October 15, 2017.
Cash Equivalents
We deem certain U.S. Treasury bills, repurchase agreements and other high-quality, short-term debt securities as cash equivalents. (See note 2n) within the accompanying financial statements.) At the end of each fiscal quarter, we consider taking proactive steps utilizing cash equivalents with the objective of enhancing our investment flexibility during the following quarter, pursuant to Section 55 of the 1940 Act. More specifically, we may purchase U.S. Treasury bills from time-to-time on the last business day of the quarter and typically close out that position on the following business day, settling the sale transaction on a net cash basis with the purchase, subsequent to quarter end. Apollo Investment may also utilize repurchase agreements or other balance sheet transactions, including drawing down on our Senior Secured Facility, as we deem appropriate. The amount of these transactions or such drawn cash for this purpose is excluded from total assets for purposes of computing the asset base upon which the management fee is determined. There were no cash equivalents held as of March 31, 2013.
Contractual Obligations
| Payments due by Period as of March 31, 2013 (dollars in millions) | ||||||||||||||||||||
| Total | Less than 1 year |
1-3 years | 3-5 years | More than 5 years |
||||||||||||||||
| Senior Secured Facility(1) |
$ | 536 | $ | — | $ | 447 | $ | 89 | $ | — | ||||||||||
| Senior Secured Notes |
$ | 225 | $ | — | $ | 225 | $ | — | $ | — | ||||||||||
| Senior Secured Notes (Series A) |
$ | 29 | $ | — | $ | — | $ | 29 | $ | — | ||||||||||
| Senior Secured Notes (Series B) |
$ | 16 | $ | — | $ | — | $ | — | $ | 16 | ||||||||||
| 2042 Notes |
$ | 150 | $ | — | $ | — | $ | — | $ | 150 | ||||||||||
| Convertible Notes |
$ | 200 | $ | — | $ | — | $ | 200 | $ | — | ||||||||||
| (1) | At March 31, 2013, the Senior Secured Facility had $604 million of unused capacity. |
We have entered into two contracts under which we have future commitments: the Investment Advisory Agreement, pursuant to which AIM has agreed to serve as our investment adviser, and the Administration Agreement, pursuant to which AIA has agreed to furnish us with the facilities and administrative services necessary to conduct our day-to-day operations and provide on our behalf managerial assistance to those portfolio companies to which we are required to provide such assistance. Payments under the Investment Advisory Agreement are equal to (1) a percentage of the value of our average gross assets and (2) a two-part incentive fee. Payments under the Administration Agreement are equal to an amount based upon our allocable portion of AIA’s overhead in performing its obligations under the Administration Agreement, including rent, technology systems, insurance and our allocable portion of the costs of our chief financial officer and chief
46
Table of Contents
compliance officer and their respective staffs. Either party may terminate each of the Investment Advisory Agreement and Administration Agreement without penalty upon not more than 60 days’ written notice to the other. Please see note 3 within our financial statements for more information.
Off-Balance Sheet Arrangements
As of March 31, 2013, the Company had outstanding commitments with banks to purchase secured term loans and unsecured bridge loans in the aggregate amount of $105 million. AIC’s commitments are subject to the consummation of the underlying corporate transactions and conditional upon receipt of all necessary shareholder, regulatory and other applicable approvals.
As of May 23, 2013 the outstanding commitments with banks to purchase secured term loans and unsecured bridge loans in the aggregate was $220 million.
The Company had unfunded commitments on senior loans as of March 31, 2013 of $59 million. The Company also had unfunded commitments on senior loans of $83 million which require the borrower to meet certain performance thresholds before the Company is obligated to fulfill the commitments. Those performance thresholds were not met as of March 31, 2013.
AIC Credit Opportunity Fund LLC (currencies in thousands)
We own all of the common member interests in AIC Credit Opportunity Fund LLC (“AIC Holdco”). AIC Holdco was formed for the purpose of holding various financed investments. AIC Holdco wholly owns three special purpose entities, each of which in 2008 acquired directly or indirectly an investment in a particular security from an unaffiliated entity that provided leverage for the investment as part of the sale. Each of these transactions is described in more detail below together with summary financial information.
In the first of these investments, in June 2008 we invested through AIC Holdco $39,500 in AIC (FDC) Holdings LLC (“Apollo FDC”). Apollo FDC used the proceeds to purchase a Junior Profit-Participating Note due 2013 in principal amount of $39,500 (the “Junior Note”) issued by Apollo I Trust (the “Trust”). The Trust also issued a Senior Floating Rate Note due 2013 (the “Senior Note”) to an unaffiliated third party in principal amount of $39,500 paying interest at LIBOR plus 1.50%, increasing over time to LIBOR plus 2.0%. The Trust used the aggregate $79,000 proceeds to acquire $100,000 face value of a senior subordinated loan of First Data Corporation (the “FDC Loan”) due 2016. The FDC Loan pays interest at 11.25% per year. The Junior Note of the Trust owned by Apollo FDC pays to Apollo FDC all of the interest and other proceeds received by the Trust on the FDC Loan after satisfying the Trust’s obligations on the Senior Note. The holder of the Senior Note has no recourse to Apollo FDC, AIC Holdco or us with respect to any interest on, or principal of, the Senior Note. However, if the value of the FDC Loan held by the Trust declines sufficiently, the investment would be unwound unless Apollo FDC posts additional collateral for the benefit of the Senior Note. Consequently, the maximum exposure on this investment is the amount of our investment in the Junior Note and any additional collateral we determine to post. During the fiscal year ended March 31, 2012 the Trust sold $47,145 face value of the FDC Loan. As a result of this transaction, as of March 31, 2013, the FDC Loan balance is $52,855, the Junior Note balance is $21,472 and the Senior Note balance is $20,283.
In the second of these investments, in June 2008 we invested through AIC Holdco $11,375 in AIC (TXU) Holdings LLC (“Apollo TXU”). Apollo TXU acquired exposure to $50,000 notional amount of a LIBOR plus 3.5% senior secured delayed draw term loan of Texas Competitive Electric Holdings (“TXU”) due 2014 through a non-recourse total return swap (the “TRS”) with an unaffiliated third party expiring on October 10, 2013. Pursuant to such delayed draw term loan, Apollo TXU pays an unaffiliated third-party interest at LIBOR plus 1.5% and generally receives all proceeds due under the delayed draw term loan of TXU (the “TXU Term Loan”). Like Apollo FDC, Apollo TXU is entitled to 100% of any realized appreciation in the TXU Term Loan and, since the TRS is a non-recourse arrangement, Apollo TXU is exposed only up to the amount of its investment in
47
Table of Contents
the TRS, plus any additional margin we decide to post, if any, during the term of the financing. The TRS does not constitute a senior security or a borrowing of Apollo TXU. In connection with the amendment and extension of the TXU Term Loan in April 2011, for which Apollo TXU received a consent fee along with an increase in the rate of the TXU Term Loan to LIBOR plus 4.5%, Apollo TXU extended its TRS to 2016 at a rate of LIBOR plus 2.0%. As of March 31, 2013, Apollo TXU’s notional exposure to the TXU term loan is $47,471.
In the third of these investments, in September 2008 we invested through AIC Holdco $10,022 in AIC (Boots) Holdings, LLC (“Apollo Boots”). Apollo Boots acquired €23,383 and £12,465 principal amount of senior term loans of AB Acquisitions Topco 2 Limited, a holding company for the Alliance Boots group of companies (the “Boots Term Loans”), out of the proceeds of our investment and a multicurrency $40,876 equivalent non-recourse loan to Apollo Boots (the “Acquisition Loan”) by an unaffiliated third party that was scheduled to mature in September 2013 and paid interest at LIBOR plus 1.25% or, in certain cases, the higher of the Federal Funds Rate plus 0.50% or the lender’s prime-rate. The Boots Term Loans paid interest at the rate of LIBOR plus 3% per year and are scheduled to mature in June 2015. During the fiscal year ended March 31, 2013, Apollo Boots sold the entire position of the Boots Term Loans in the amount of €23,383 and £12,465 of principal. At March 31, 2013, there was no outstanding principal balance of the Boots Term Loans.
We do not consolidate AIC Holdco or its wholly owned subsidiaries and accordingly only the value of our investment in AIC Holdco is included on our statement of assets and liabilities. Our investment in AIC Holdco is valued in accordance with our normal valuation procedures and is based on the values of the underlying assets held by each of Apollo FDC, Apollo TXU and Apollo Boots net of associated liabilities.
The Senior Note, TRS and Acquisition Loan are non-recourse to AIC Holdco, its subsidiaries and us and have standard events of default including failure to pay contractual amounts when due and failure by each of the underlying Apollo special purpose entities to provide additional credit support, sell assets or prepay a portion of its obligations if the value of the FDC Term Loan, the TXU Term Loan or the Boots Term Loans, as applicable, declines below specified levels. We may unwind any of these transactions at any time without penalty. From time to time we may provide additional capital to AIC Holdco for purposes of reserving for or funding margin calls under one or more of the transactions described above among other reasons. During the fiscal year ended March 31, 2011, $1,700 of net capital was provided to AIC Holdco. During the fiscal year ended March 31, 2012, $8,712 of net capital was returned to us from AIC Holdco. During the fiscal year ended March 31, 2013, $17,891 of net capital was returned to us from AIC Holdco. The Junior Note, TRS and Boots Term Loans were performing assets as of the date of these financial statements.
48
Table of Contents
Below is summarized financial information for AIC Holdco for the fiscal years ended March 31, 2013 and March 31, 2012.
| March 31, 2013 | March 31, 2012 | |||||||
| Assets |
||||||||
| Cash |
$ | 10 | $ | 15 | ||||
| Apollo FDC(1) |
32,981 | 27,947 | ||||||
| Apollo TXU(2) |
26,641 | 26,066 | ||||||
| Apollo Boots(3) |
— | 47,999 | ||||||
| Other Assets |
2,702 | 2,886 | ||||||
|
|
|
|
|
|||||
| Total Assets |
$ | 62,334 | $ | 104,913 | ||||
|
|
|
|
|
|||||
| Liabilities |
||||||||
| Apollo FDC(4) |
$ | — | $ | — | ||||
| Apollo TXU(5) |
8,936 | 16,045 | ||||||
| Apollo Boots(6) |
— | 29,948 | ||||||
| Other Liabilities |
2,702 | 2,886 | ||||||
|
|
|
|
|
|||||
| Total Liabilities |
$ | 11,638 | $ | 48,879 | ||||
|
|
|
|
|
|||||
| Net Assets |
||||||||
| Apollo FDC |
$ | 32,981 | $ | 27,947 | ||||
| Apollo TXU |
17,705 | 10,021 | ||||||
| Apollo Boots |
— | 18,051 | ||||||
| Other |
10 | 15 | ||||||
|
|
|
|
|
|||||
| Total Net Assets |
$ | 50,696 | $ | 56,034 | ||||
|
|
|
|
|
|||||
| Fiscal Year End March 31, 2013 |
Fiscal Year End March 31, 2012 |
|||||||
| Net Operating Income (Loss) |
||||||||
| Apollo FDC(7) |
$ | 5,388 | $ | 9,412 | ||||
| Apollo TXU(7) |
1,237 | 2,809 | ||||||
| Apollo Boots(7) |
745 | 1,243 | ||||||
| Other |
(5 | ) | (26 | ) | ||||
|
|
|
|
|
|||||
| Total Operating Income |
$ | 7,365 | $ | 13,438 | ||||
|
|
|
|
|
|||||
| Net Realized Gain |
||||||||
| Apollo Boots |
$ | 659 | $ | — | ||||
| Apollo FDC |
— | 2,862 | ||||||
|
|
|
|
|
|||||
| Total Net Realized Gain (Loss) |
$ | 659 | $ | 2,862 | ||||
|
|
|
|
|
|||||
| Net Change in Unrealized Gain (Loss) |
||||||||
| Apollo FDC |
$ | 5,034 | $ | (14,484 | ) | |||
| Apollo TXU |
7,110 | (13,126 | ) | |||||
| Apollo Boots |
(244 | ) | (2,852 | ) | ||||
|
|
|
|
|
|||||
| Total Net Change in Unrealized Gain (Loss) |
$ | 11,900 | $ | (30,462 | ) | |||
|
|
|
|
|
|||||
| Net Income (Loss)(8) |
||||||||
| Apollo FDC |
$ | 10,422 | $ | (2,210 | ) | |||
| Apollo TXU |
8,347 | (10,317 | ) | |||||
| Apollo Boots |
1,160 | (1,609 | ) | |||||
| Other |
(5 | ) | (26 | ) | ||||
|
|
|
|
|
|||||
| Total Net Income (Loss) |
$ | 19,924 | $ | (14,162 | ) | |||
|
|
|
|
|
|||||
49
Table of Contents
| (1) | Includes fair value of the Junior Note held by Apollo FDC. Cost: $21,472 and $21,472, respectively. |
| (2) | Represents fair value of collateral posted in relation to the TRS held by Apollo TXU. Cost: $26,641 and $26,066, respectively. |
| (3) | Represents fair value of the Boots Term Loans held by Apollo Boots and fair value of receivable for Boots Term Loans sold during the period. Cost of outstanding par was $50,109 at March 31, 2012. There was no outstanding par at March 31, 2013. |
| (4) | Apollo FDC’s interest in the Trust is subject to a senior note of a separate entity of $20,283 and $20,283 at March 31, 2013 and March 31, 2012, respectively; However, Apollo FDC has no liability for such senior note. |
| (5) | Represents liability on the TRS held by Apollo TXU. |
| (6) | Represents liability of Apollo Boots on the Acquisition Loan. |
| (7) | In the case of Apollo FDC, net operating income consists of interest income on the Junior Note less interest paid on the senior note together with immaterial administrative expenses. In the case of Apollo TXU, net operating income consists of net payments from (to) the swap counterparty of Apollo TXU’s obligation to pay interest and its right to receive the proceeds in respect of the reference asset, together with immaterial administrative expenses. In the case of AIC Boots, net operating income consists of interest income on the Boots Term Loans, less interest payments on the Acquisition Loan together with immaterial administrative expenses. There are no management or incentive fees. |
| (8) | Net income is the sum of operating income, realized gain (loss) and net change in unrealized appreciation / depreciation. |
Dividends
Dividends paid to stockholders for the fiscal years ended March 31, 2013, 2012 and 2011 totaled $162.3 million or $0.80 per share, $204.4 million or $1.04 per share, and $218.1 million or $1.12 per share, respectively. Tax characteristics of all dividends will be reported to shareholders on Form 1099 after the end of the calendar year. Our quarterly dividends, if any, will be determined by our Board of Directors.
The following table summarizes our quarterly dividends paid to stockholders for the fiscal years ended March 31, 2013, 2012 and 2011, respectively:
| Declared Dividends | ||||
| Fiscal Year Ending March 31, 2013 |
||||
| Fourth Fiscal Quarter |
$ | 0.20 | ||
| Third Fiscal Quarter |
$ | 0.20 | ||
| Second Fiscal Quarter |
$ | 0.20 | ||
| First Fiscal Quarter |
$ | 0.20 | ||
| Fiscal Year Ending March 31, 2012 |
||||
| Fourth Fiscal Quarter |
$ | 0.20 | ||
| Third Fiscal Quarter |
$ | 0.28 | ||
| Second Fiscal Quarter |
$ | 0.28 | ||
| First Fiscal Quarter |
$ | 0.28 | ||
| Fiscal Year Ending March 31, 2011 |
||||
| Fourth Fiscal Quarter |
$ | 0.28 | ||
| Third Fiscal Quarter |
$ | 0.28 | ||
| Second Fiscal Quarter |
$ | 0.28 | ||
| First Fiscal Quarter |
$ | 0.28 | ||
We have elected to be taxed as a RIC under Subchapter M of the Code. To maintain our RIC status, we must distribute at least 90% of our ordinary income and realized net short-term capital gains in excess of realized net long-term capital losses, if any, out of the assets legally available for distribution. In addition, although we
50
Table of Contents
currently intend to distribute realized net capital gains (i.e., net long-term capital gains in excess of short-term capital losses), if any, at least annually, out of the assets legally available for such distributions, we may in the future decide to retain such capital gains for investment.
We maintain an “opt out” dividend reinvestment plan for our common stockholders. As a result, if we declare a dividend, then stockholders’ cash dividends will be automatically reinvested in additional shares of our common stock, unless they specifically “opt out” of the dividend reinvestment plan so as to receive cash dividends.
We may not be able to achieve operating results that will allow us to make distributions at a specific level or to increase the amount of these distributions from time to time. In addition, due to the asset coverage test applicable to us as a business development company, we may in the future be limited in our ability to make distributions. Also, our revolving credit facility may limit our ability to declare dividends if we default under certain provisions or fail to satisfy certain other conditions. If we do not distribute a certain percentage of our income annually, we may suffer adverse tax consequences, including possible loss of the tax benefits available to us as a regulated investment company. In addition, in accordance with U.S. generally accepted accounting principles and tax regulations, we include in income certain amounts that we have not yet received in cash, such as contractual payment-in-kind interest, which represents contractual interest added to the loan balance that becomes due at the end of the loan term, or the accrual of original issue or market discount. Since we may recognize income before or without receiving cash representing such income, we may not be able to meet the requirement to distribute at least 90% of our investment company taxable income to obtain tax benefits as a regulated investment company.
With respect to the dividends to stockholders, income from origination, structuring, closing, commitment and other upfront fees associated with investments in portfolio companies is treated as taxable income and accordingly, distributed to stockholders.
Recent Events
The Board of Directors declared a dividend of $0.20 per share for the first fiscal quarter of 2014, payable on July 5, 2013 to stockholders of record as of June 20, 2013.
On May 20, 2013, we issued 21.85 million shares of our common stock at $8.60 per share (or $8.342 per share net proceeds before estimated expenses), raising $181.9 million of net proceeds. Apollo Investment Management, L.P. (“AIM”), our investment adviser, has agreed to waive the base management and incentive fees associated with the incremental shares issued in the offering through March 31, 2014.
Item 7A. Quantitative and Qualitative Disclosure about Market Risk
We are subject to financial market risks, including changes in interest rates. During the fiscal year ended March 31, 2013, many of the loans in our portfolio had floating interest rates. These loans are usually based on floating LIBOR and typically have durations of one to six months after which they reset to current market interest rates. As the percentage of our U.S. mezzanine and other subordinated loans increase as a percentage of our total investments, we expect that more of the loans in our portfolio will have fixed rates. The Company also has a revolving credit facility that is based on floating LIBOR rates. Assuming no changes to our balance sheet as of March 31, 2013, a hypothetical one percent increase in LIBOR on our floating rate assets and liabilities would decrease our earnings by approximately two cents per average share over the next twelve months. Assuming no changes to our balance sheet as of March 31, 2013, a hypothetical two percent increase in LIBOR on our floating rate assets and liabilities would increase our earnings by three cents per average share over the next twelve months. Assuming no changes to our balance sheet as of March 31, 2013, a hypothetical three percent increase in LIBOR on our floating rate assets and liabilities would increase our earnings by approximately five cents per average share over the next twelve months. However, we may hedge against interest rate fluctuations from time-to-time by using standard hedging instruments such as futures, options and forward contracts subject to the requirements of the 1940 Act and applicable commodities laws. While hedging activities may insulate us against adverse changes in interest rates, they may also limit our ability to participate in the benefits of lower interest rates with respect to our portfolio of investments. During the fiscal year ended March 31, 2013, we did not engage in interest rate hedging activities.
51
Table of Contents
Item 8. Financial Statements and Supplementary Data
| Index to Financial Statements |
||||
| Management’s Report on Internal Control over Financial Reporting |
53 | |||
| Report of Independent Registered Public Accounting Firm |
54 | |||
| Statements of Assets & Liabilities as of March 31, 2013 and March 31, 2012 |
55 | |||
| Statement of Operations for the years ended March 31, 2013, March 31, 2012 and March 31, 2011 |
56 | |||
| Statement of Changes in Net Assets for the years ended March 31, 2013, March 31, 2012 and March 31, 2011 |
57 | |||
| Statement of Cash Flows for the years ended March 31, 2013, March 31, 2012 and March 31, 2011 |
58 | |||
| Schedule of Investments as of March 31, 2013 and March 31, 2012 |
59 | |||
| Notes to Financial Statements |
76 | |||
52
Table of Contents
MANAGEMENT’S REPORT ON INTERNAL CONTROL OVER FINANCIAL REPORTING
Management is responsible for establishing and maintaining adequate internal control over financial reporting, and for performing an assessment of the effectiveness of internal control over financial reporting as of March 31, 2013. Internal control over financial reporting is a process designed to provide reasonable assurance regarding the reliability of financial reporting and the preparation of financial statements for external purposes in accordance with generally accepted accounting principles. The Company’s internal control over financial reporting includes those policies and procedures that (i) pertain to assets of the Company; (ii) provide reasonable assurance that transactions are recorded as necessary to permit preparation of financial statements in accordance with generally accepted accounting principles, and that receipts and expenditures of the Company are being made only in accordance with authorizations of management and directors of the Company; and (iii) provide reasonable assurance regarding prevention or timely detection of unauthorized acquisition, use, or disposition of the Company’s assets that could have a material effect on the financial statements.
Management performed an assessment of the effectiveness of the Company’s internal control over financial reporting as of March 31, 2013 based upon criteria in Internal Control — Integrated Framework issued by the Committee of Sponsoring Organizations of the Treadway Commission (“COSO”). Based on our assessment, management determined that the Company’s internal control over financial reporting was effective as of March 31, 2013 based on the criteria on Internal Control — Integrated Framework issued by COSO.
The effectiveness of the Company’s internal control over financial reporting as of March 31, 2013 has been audited by PricewaterhouseCoopers LLP, an independent registered public accounting firm, as stated in their report which appears herein.
53
Table of Contents
Report of Independent Registered Public Accounting Firm
To the Board of Directors and Shareholders of
Apollo Investment Corporation:
In our opinion, the accompanying statements of assets and liabilities including the schedules of investments, and the related statements of operations, changes in net assets and cash flows present fairly, in all material respects, the financial position of Apollo Investment Corporation (“the Company”) at March 31, 2013 and March 31, 2012, and the results of its operations, the changes in net assets, and its cash flows for each of the three years in the period ended March 31, 2013 in conformity with accounting principles generally accepted in the United States of America. Also in our opinion, the Company maintained, in all material respects, effective internal control over financial reporting as of March 31, 2013, based on criteria established in Internal Control — Integrated Framework issued by the Committee of Sponsoring Organizations of the Treadway Commission (COSO). The Company’s management is responsible for these financial statements, for maintaining effective internal control over financial reporting and for its assessment of the effectiveness of internal control over financial reporting, included in Management’s Report on Internal Control over Financial Reporting appearing on page 53 of the annual report to shareholders. Our responsibility is to express opinions on these financial statements and on the Company’s internal control over financial reporting based on our integrated audits. We conducted our audits in accordance with the standards of the Public Company Accounting Oversight Board (United States). Those standards require that we plan and perform the audits to obtain reasonable assurance about whether the financial statements are free of material misstatement and whether effective internal control over financial reporting was maintained in all material respects. Our audits of the financial statements included examining, on a test basis, evidence supporting the amounts and disclosures in the financial statements, assessing the accounting principles used and significant estimates made by management, and evaluating the overall financial statement presentation. Our audit of internal control over financial reporting included obtaining an understanding of internal control over financial reporting, assessing the risk that a material weakness exists, and testing and evaluating the design and operating effectiveness of internal control based on the assessed risk. Our audits also included performing such other procedures as we considered necessary in the circumstances. Our procedures included confirmation of securities at March 31, 2013 by correspondence with the custodian, and where replies were not received, we performed other auditing procedures. We believe that our audits provide a reasonable basis for our opinions.
A company’s internal control over financial reporting is a process designed to provide reasonable assurance regarding the reliability of financial reporting and the preparation of financial statements for external purposes in accordance with generally accepted accounting principles. A company’s internal control over financial reporting includes those policies and procedures that (i) pertain to the maintenance of records that, in reasonable detail, accurately and fairly reflect the transactions and dispositions of the assets of the company; (ii) provide reasonable assurance that transactions are recorded as necessary to permit preparation of financial statements in accordance with generally accepted accounting principles, and that receipts and expenditures of the company are being made only in accordance with authorizations of management and directors of the company; and (iii) provide reasonable assurance regarding prevention or timely detection of unauthorized acquisition, use, or disposition of the company’s assets that could have a material effect on the financial statements.
Because of its inherent limitations, internal control over financial reporting may not prevent or detect misstatements. Also, projections of any evaluation of effectiveness to future periods are subject to the risk that controls may become inadequate because of changes in conditions, or that the degree of compliance with the policies or procedures may deteriorate.
/s/ PricewaterhouseCoopers LLP
New York, New York
May 23, 2013
54
Table of Contents
APOLLO INVESTMENT CORPORATION
STATEMENTS OF ASSETS AND LIABILITIES
(in thousands, except per share amounts)
| March 31, 2013 | March 31, 2012 | |||||||
| Assets |
||||||||
| Non-controlled/non-affiliated investments, at value (cost — $2,550,091 and $2,642,702, respectively) |
$ | 2,414,307 | $ | 2,490,672 | ||||
| Controlled investments, at value (cost — $469,210 and $208,882, respectively) |
436,092 | 186,408 | ||||||
| Cash |
3,902 | 1,665 | ||||||
| Foreign currency (cost — $2,293 and $1,013, respectively) |
2,295 | 1,013 | ||||||
| Receivable for investments sold |
5,713 | 19,606 | ||||||
| Interest receivable |
51,990 | 54,409 | ||||||
| Dividends receivable |
2,703 | 2,898 | ||||||
| Deferred financing costs |
26,990 | 17,309 | ||||||
| Prepaid expenses and other assets |
320 | 1,283 | ||||||
|
|
|
|
|
|||||
| Total assets |
$ | 2,944,312 | $ | 2,775,263 | ||||
|
|
|
|
|
|||||
| Liabilities |
||||||||
| Debt (see note 7 & 12) |
$ | 1,156,067 | $ | 1,009,337 | ||||
| Payable for investments purchased |
26,021 | — | ||||||
| Dividends payable |
40,578 | 39,409 | ||||||
| Management and performance-based incentive fees payable (see note 3) |
26,509 | 24,402 | ||||||
| Interest payable |
12,012 | 10,102 | ||||||
| Accrued administrative expenses |
2,219 | 3,420 | ||||||
| Other liabilities and accrued expenses |
3,517 | 3,362 | ||||||
|
|
|
|
|
|||||
| Total liabilities |
$ | 1,266,923 | $ | 1,090,032 | ||||
|
|
|
|
|
|||||
| Net Assets |
||||||||
| Common stock, par value $.001 per share, 400,000 and 400,000 common shares authorized, respectively, and 202,891 and 197,043 issued and outstanding, respectively |
$ | 203 | $ | 197 | ||||
| Paid-in capital in excess of par (see note 2f) |
2,933,636 | 2,886,327 | ||||||
| Over-distributed net investment income (see note 2f) |
(44,183 | ) | (34,896 | ) | ||||
| Accumulated net realized loss (see note 2f) |
(1,053,080 | ) | (995,426 | ) | ||||
| Net unrealized depreciation |
(159,187 | ) | (170,971 | ) | ||||
|
|
|
|
|
|||||
| Total net assets |
$ | 1,677,389 | $ | 1,685,231 | ||||
|
|
|
|
|
|||||
| Total liabilities and net assets |
$ | 2,944,312 | $ | 2,775,263 | ||||
|
|
|
|
|
|||||
| Net asset value per share |
$ | 8.27 | $ | 8.55 | ||||
|
|
|
|
|
|||||
See notes to financial statements.
55
Table of Contents
APOLLO INVESTMENT CORPORATION
STATEMENTS OF OPERATIONS
(in thousands, except per share amounts)
| Year Ended March 31, | ||||||||||||
| 2013 | 2012 | 2011 | ||||||||||
| INVESTMENT INCOME: |
||||||||||||
| From non-controlled/non-affiliated investments: |
||||||||||||
| Interest |
$ | 287,032 | $ | 313,992 | $ | 316,183 | ||||||
| Dividends |
4,813 | 6,998 | 4,713 | |||||||||
| Other income |
16,532 | 18,505 | 15,143 | |||||||||
| From non-controlled/affiliated investments: |
||||||||||||
| Interest |
— | 899 | 10,296 | |||||||||
| From controlled investments: |
||||||||||||
| Interest |
9,173 | 3,746 | — | |||||||||
| Dividends |
14,247 | 13,444 | 12,334 | |||||||||
| Other income |
197 | — | 110 | |||||||||
|
|
|
|
|
|
|
|||||||
| Total Investment Income |
$ | 331,994 | $ | 357,584 | $ | 358,779 | ||||||
|
|
|
|
|
|
|
|||||||
| EXPENSES: |
||||||||||||
| Management fees (see note 3) |
$ | 54,115 | $ | 60,321 | $ | 59,831 | ||||||
| Performance-based incentive fees (see note 3) |
39,961 | 39,651 | 47,793 | |||||||||
| Interest and other debt expenses |
58,200 | 66,360 | 48,025 | |||||||||
| Administrative services expense |
4,389 | 5,387 | 5,529 | |||||||||
| Other general and administrative expenses |
7,969 | 13,123 | 6,429 | |||||||||
|
|
|
|
|
|
|
|||||||
| Total expenses |
164,634 | 184,842 | 167,607 | |||||||||
|
|
|
|
|
|
|
|||||||
| Net investment income |
$ | 167,360 | $ | 172,742 | $ | 191,172 | ||||||
|
|
|
|
|
|
|
|||||||
| REALIZED AND UNREALIZED GAIN (LOSS) ON INVESTMENTS, CASH EQUIVALENTS AND FOREIGN CURRENCIES: |
||||||||||||
| Net realized loss: |
||||||||||||
| Investments and cash equivalents |
$ | (75,644 | ) | $ | (340,915 | ) | $ | (144,350 | ) | |||
| Foreign currencies |
971 | (528 | ) | (7,667 | ) | |||||||
|
|
|
|
|
|
|
|||||||
| Net realized loss |
(74,673 | ) | (341,443 | ) | (152,017 | ) | ||||||
|
|
|
|
|
|
|
|||||||
| Net change in unrealized depreciation/appreciation: |
||||||||||||
| Investments and cash equivalents |
5,604 | 74,233 | 140,227 | |||||||||
| Foreign currencies |
6,180 | 8,204 | 1,030 | |||||||||
|
|
|
|
|
|
|
|||||||
| Net change in unrealized depreciation/appreciation |
11,784 | 82,437 | 141,257 | |||||||||
|
|
|
|
|
|
|
|||||||
| Net realized and unrealized gain (loss) from investments, cash equivalents and foreign currencies |
(62,889 | ) | (259,006 | ) | (10,760 | ) | ||||||
|
|
|
|
|
|
|
|||||||
| NET INCREASE (DECREASE) IN NET ASSETS RESULTING FROM OPERATIONS |
$ | 104,471 | $ | (86,264 | ) | $ | 180,412 | |||||
|
|
|
|
|
|
|
|||||||
| EARNINGS GAIN (LOSS) PER SHARE — BASIC (see note 5) |
$ | 0.51 | $ | (0.44 | ) | $ | 0.93 | |||||
|
|
|
|
|
|
|
|||||||
| EARNINGS GAIN (LOSS) PER SHARE — DILUTED (see note 5) |
$ | 0.51 | $ | (0.44 | ) | $ | 0.93 | |||||
|
|
|
|
|
|
|
|||||||
See notes to financial statements.
56
Table of Contents
APOLLO INVESTMENT CORPORATION
STATEMENTS OF CHANGES IN NET ASSETS
(in thousands, except shares)
| Year Ended March 31, | ||||||||||||
| 2013 | 2012 | 2011 | ||||||||||
| Increase (decrease) in net assets from operations: |
||||||||||||
| Net investment income |
$ | 167,360 | $ | 172,742 | $ | 191,172 | ||||||
| Net realized loss |
(74,673 | ) | (341,443 | ) | (152,017 | ) | ||||||
| Net change in unrealized depreciation/appreciation |
11,784 | 82,437 | 141,257 | |||||||||
|
|
|
|
|
|
|
|||||||
| Net increase (decrease) in net assets resulting from operations |
104,471 | (86,264 | ) | 180,412 | ||||||||
|
|
|
|
|
|
|
|||||||
| Dividends and distributions to stockholders (see note 13): |
(162,313 | ) | (204,427 | ) | (218,079 | ) | ||||||
|
|
|
|
|
|
|
|||||||
| Capital share transactions: |
||||||||||||
| Net proceeds from shares sold |
50,000 | — | 204,275 | |||||||||
| Less offering costs |
— | (6 | ) | (233 | ) | |||||||
| Reinvestment of dividends |
— | 14,897 | 21,850 | |||||||||
|
|
|
|
|
|
|
|||||||
| Net increase in net assets from capital share transactions |
50,000 | 14,891 | 225,892 | |||||||||
|
|
|
|
|
|
|
|||||||
| Total decrease (increase) in net assets: |
(7,842 | ) | (275,800 | ) | 188,225 | |||||||
| Net assets at beginning of period |
1,685,231 | 1,961,031 | 1,772,806 | |||||||||
|
|
|
|
|
|
|
|||||||
| Net assets at end of period |
$ | 1,677,389 | $ | 1,685,231 | $ | 1,961,031 | ||||||
|
|
|
|
|
|
|
|||||||
| Capital share activity |
||||||||||||
| Shares sold |
5,847,953 | — | 17,250,000 | |||||||||
| Shares issued from reinvestment of dividends |
— | 1,541,849 | 2,037,631 | |||||||||
|
|
|
|
|
|
|
|||||||
| Net increase from capital share activity |
5,847,953 | 1,541,849 | 19,287,631 | |||||||||
|
|
|
|
|
|
|
|||||||
See notes to financial statements.
57
Table of Contents
APOLLO INVESTMENT CORPORATION
STATEMENTS OF CASH FLOWS
(in thousands)
| Year Ended March 31, | ||||||||||||
| 2013 | 2012 | 2011 | ||||||||||
| CASH FLOWS FROM OPERATING ACTIVITIES: |
||||||||||||
| Net increase (decrease) in net assets resulting from |
$ | 104,471 | $ | (86,264 | ) | $ | 180,412 | |||||
| Adjustments to reconcile net increase (decrease): |
||||||||||||
| PIK interest and dividends |
(17,891 | ) | (14,915 | ) | (39,853 | ) | ||||||
| Net amortization on investments |
(25,579 | ) | (18,807 | ) | (41,433 | ) | ||||||
| Amortization of deferred financing costs |
8,889 | 10,014 | 8,393 | |||||||||
| Increase (decrease) from foreign currency transactions |
769 | (660 | ) | (7,520 | ) | |||||||
| Net change in unrealized depreciation/(appreciation) on investments, cash equivalents and foreign currencies |
(11,784 | ) | (82,437 | ) | (141,257 | ) | ||||||
| Net realized loss on investments, cash equivalents and foreign currencies |
74,673 | 341,443 | 152,017 | |||||||||
| Changes in operating assets and liabilities: |
||||||||||||
| Purchase of investments |
(1,537,366 | ) | (1,517,735 | ) | (1,070,581 | ) | ||||||
| Proceeds from disposition of investments and cash equivalents |
1,337,427 | 1,657,907 | 951,168 | |||||||||
| Decrease (increase) in interest and dividends receivable (see note 2) |
2,614 | (6,490 | ) | (1,978 | ) | |||||||
| Decrease in prepaid expenses and other assets |
963 | 227 | 837 | |||||||||
| Increase (decrease) in management and performance-based incentive fees payable |
2,107 | (3,151 | ) | 1,190 | ||||||||
| Increase in interest payable |
1,910 | 399 | 7,571 | |||||||||
| Decrease (increase) in accrued expenses and other liabilities |
(1,046 | ) | 1,821 | 111 | ||||||||
| Increase (decrease) in payable for investments purchased |
26,021 | (37,382 | ) | (511,627 | ) | |||||||
| Decrease (increase) in receivables for investments sold |
13,893 | (6,145 | ) | 36,182 | ||||||||
|
|
|
|
|
|
|
|||||||
| Net cash provided used in (provided by) operating activities |
$ | (19,929 | ) | $ | 237,825 | $ | (476,368 | ) | ||||
|
|
|
|
|
|
|
|||||||
| CASH FLOWS FROM FINANCING ACTIVITIES: |
||||||||||||
| Net proceeds from the issuance of common stock |
$ | 50,000 | $ | — | $ | 204,275 | ||||||
| Offering costs from the issuance of common stock |
— | (6 | ) | (233 | ) | |||||||
| Dividends paid in cash |
(161,144 | ) | (204,861 | ) | (190,829 | ) | ||||||
| Proceeds from debt |
1,374,940 | 2,034,652 | 2,260,795 | |||||||||
| Payments on debt |
(1,221,780 | ) | (2,070,474 | ) | (2,267,076 | ) | ||||||
| Deferred financing costs paid |
(18,570 | ) | (810 | ) | (11,785 | ) | ||||||
|
|
|
|
|
|
|
|||||||
| Net cash provided by (used in) financing activities |
$ | 23,446 | $ | (241,499 | ) | $ | (4,853 | ) | ||||
|
|
|
|
|
|
|
|||||||
| NET INCREASE (DECREASE) IN CASH AND CASH EQUIVALENTS |
$ | 3,517 | $ | (3,674 | ) | $ | (481,221 | ) | ||||
| Effect of exchange rates on cash balances |
2 | (2 | ) | (10 | ) | |||||||
| CASH AND CASH EQUIVALENTS, BEGINNING OF YEAR |
$ | 2,678 | $ | 6,354 | $ | 487,585 | ||||||
|
|
|
|
|
|
|
|||||||
| CASH AND CASH EQUIVALENTS, END OF YEAR |
$ | 6,197 | $ | 2,678 | $ | 6,354 | ||||||
|
|
|
|
|
|
|
|||||||
| SUPPLEMENTAL DISCLOSURE OF CASH FLOW INFORMATION |
||||||||||||
| Cash interest paid during the year |
$ | 44,757 | $ | 53,407 | $ | 29,205 | ||||||
Non-cash financing activities consist of the reinvestment of dividends totaling $0, $14,897 and $21,850, respectively.
See notes to financial statements.
58
Table of Contents
APOLLO INVESTMENT CORPORATION
SCHEDULE OF INVESTMENTS
March 31, 2013
(in thousands)
| INVESTMENTS IN NON-CONTROLLED/NON- |
Industry | Par Amount* |
Cost | Fair Value(1) |
||||||||||
| CORPORATE DEBT — 138.7% |
||||||||||||||
| SECURED DEBT — 68.5% |
||||||||||||||
| 1st Lien Secured Debt — 21.9% |
||||||||||||||
| Amaya Gaming Group, Inc., L+775, 11/05/15 |
Consumer Products |
$ | 14,813 | $ | 14,617 | $ | 14,813 | |||||||
| ATI Acquisition Company, P+1400 (P+10.00% Cash/4.00% PIK), 6/30/12 *** † |
Education | 4,676 | 3,895 | 500 | ||||||||||
| ATI Acquisition Company, P+900 (P+5.00% Cash/4.00% PIK), 12/30/14 *** † |
Education | 15,491 | 12,596 | — | ||||||||||
| Aventine Renewable Energy Holdings, Inc., |
Chemicals | 3,966 | 3,850 | 3,866 | ||||||||||
| Aventine Renewable Energy Holdings, Inc., 10.50% Cash or 15.00% PIK, 9/24/17 † |
Chemicals | 12,102 | 16,007 | 9,682 | ||||||||||
| Aveta, Inc., L+825, 12/12/17 |
Healthcare | 69,594 | 67,607 | 69,985 | ||||||||||
| Dark Castle Holdings, LLC, L+225, 3/25/13 |
Media | 34,777 | 11,061 | 13,260 | ||||||||||
| Delta Educational Systems, Inc., 16.00% (8.00% Cash/8.00% PIK), 12/11/16 |
Education | 5,018 | 5,018 | 5,018 | ||||||||||
| Endeavour International, 12.00%, 3/01/18 ‡ |
Oil and Gas | 14,993 | 14,471 | 14,421 | ||||||||||
| Evergreen Tank Solutions, Inc., L+800, 9/28/18 |
Manufacturing | 31,600 | 31,004 | 31,580 | ||||||||||
| Garden Fresh Restaurant Corp., L+525 (L+475 Cash/0.5% PIK), 6/11/13 † |
Retail | 2,503 | 2,503 | 2,503 | ||||||||||
| Garden Fresh Restaurant Corp., L+625 (L+575 Cash/0.5% PIK), 6/11/13 † |
Retail | 2,503 | 2,481 | 2,503 | ||||||||||
| Miller Energy Resources, Inc., 18.00% (15.00% Cash/3.00% PIK Option), 6/29/17 |
Energy | 45,307 | 45,307 | 45,307 | ||||||||||
| Nara Cable Funding Limited, |
Broadcasting & Entertainment |
6,284 | 5,424 | 6,497 | ||||||||||
| Osage Exploration & Development, Inc., |
Energy | 7,000 | 6,872 | 7,000 | ||||||||||
| Panda Sherman Power, LLC, L+750, 9/14/18 |
Power | 15,000 | 14,790 | 15,338 | ||||||||||
| Panda Temple Power, LLC, L+1000, 7/18/18 |
Power | 25,500 | 25,031 | 26,233 | ||||||||||
| Pelican Energy, LLC, 10.00% (7% Cash/3% PIK), |
Energy | 8,371 | 8,176 | 8,539 | ||||||||||
| Penton Media, Inc., L+400 (L+300 Cash/2.00% PIK), 8/01/14 |
Printing & Publishing |
29,923 | 27,404 | 28,876 | ||||||||||
| Spotted Hawk Development LLC, 14.00% (13.00% Cash/ 1.00% PIK), 6/30/16 ‡ |
Energy | 24,003 | 23,200 | 22,983 | ||||||||||
| Sunrun Solar Owner IX, LLC, 9.079%, 12/31/24 Financial Services |
Energy | 1,103 | 1,053 | 1,103 | ||||||||||
| Texas Competitive Electric Holdings, 11.50%, 10/01/20 ¨ |
Utilities | 50,000 | 49,693 | 37,656 | ||||||||||
|
|
|
|
|
|||||||||||
| Total 1st Lien Secured Debt |
$ | 392,060 | $ | 367,663 | ||||||||||
|
|
|
|
|
|||||||||||
See notes to financial statements.
59
Table of Contents
APOLLO INVESTMENT CORPORATION
SCHEDULE OF INVESTMENTS (continued)
March 31, 2013
(in thousands)
| INVESTMENTS IN NON-CONTROLLED/NON- |
Industry | Par Amount* |
Cost | Fair Value(1) |
||||||||||
| 2nd Lien Secured Debt — 46.6% |
||||||||||||||
| AI Chem & Cy US AcquiCo, Inc. (Monarch) L+700, 3/20/20 ‡× |
Chemicals | $ | 10,000 | $ | 9,950 | $ | 10,263 | |||||||
| Allied Security Holdings, LLC, L+825, 2/02/18 |
Business Services | 31,000 | 30,764 | 31,194 | ||||||||||
| Ardent Medical Services, Inc, L+950, 7/02/19 |
Healthcare | 20,000 | 19,515 | 20,500 | ||||||||||
| Avaya Inc., 10.5% Cash, 3/01/21 ¨ |
Telecommunications | 16,577 | 15,835 | 15,824 | ||||||||||
| Brock Holdings III, Inc., L+825, 3/16/18 |
Environmental & Facilities Services |
27,000 | 26,579 | 27,439 | ||||||||||
| Cengage Learning Acquisitions Inc., 12.00%, 6/30/19 *** |
Education | 69,597 | 59,918 | 15,659 | ||||||||||
| Clean Earth, Inc., 13.00%, 8/1/14 |
Environmental & Facilities Services |
25,000 | 25,000 | 25,000 | ||||||||||
| Confie Seguros II, L+900, 5/8/19 |
Consumer Products | 15,000 | 14,711 | 15,375 | ||||||||||
| EZE Software Group LLC, L+750 3/14/21 × |
Business Services | 6,132 | 6,071 | 6,270 | ||||||||||
| Garden Fresh Restaurant Corp., L+1175 (L+975 Cash/2.00% PIK), 12/11/13 |
Retail | 47,075 | 47,790 | 32,952 | ||||||||||
| GCA Services Group, Inc., L+800, 10/31/20 |
Environmental & Facilities Services |
19,547 | 19,358 | 19,596 | ||||||||||
| Grocery Outlet Inc., L+925, 6/17/19 |
Grocery | 10,500 | 10,296 | 10,539 | ||||||||||
| Healogics Inc., L+800, 2/05/20 |
Healthcare | 5,000 | 4,951 | 5,181 | ||||||||||
| Insight Pharmaceuticals, LLC., L+1175, 8/25/17 |
Consumer Products | 15,448 | 15,199 | 15,603 | ||||||||||
| IPC Systems, Inc., L+525, 5/31/15 |
Telecommunications | 44,250 | 42,752 | 39,604 | ||||||||||
| Kronos, Inc., L+850, 4/26/20 |
Electronics | 56,358 | 55,269 | 59,035 | ||||||||||
| Ozburn-Hessey Holding Company LLC, L+950, 10/11/16 |
Transportation | 25,333 | 25,309 | 24,320 | ||||||||||
| PH Holdings LLC, 9.75%, 12/31/17 |
Homebuilding | 20,000 | 19,631 | 20,800 | ||||||||||
| Ranpak Corp., L+750, 10/20/17 † |
Packaging | 85,000 | 85,000 | 85,000 | ||||||||||
| Ranpak Corp., E+775, 10/20/17 † |
Packaging | € | 40,000 | 58,042 | 51,364 | |||||||||
| Sedgwick Holdings, Inc., L+750, 5/28/17 |
Business Services | $ | 15,225 | 15,072 | 15,453 | |||||||||
| SESAC International LLC, L+875, 8/08/19 |
Broadcasting & Entertainment |
4,500 | 4,433 | 4,613 | ||||||||||
| Smart & Final Stores LLC, L+925, 11/08/20 |
Grocery | 17,260 | 16,756 | 17,929 | ||||||||||
| SquareTwo Financial Corp. (Collect America, Ltd.), 11.625%, 4/01/17 ‡ |
Finance | 51,079 | 49,432 | 52,037 | ||||||||||
| TransFirst Holdings Inc., L+9.75%, 6/27/18 |
Financial Services | 61,250 | 59,476 | 62,858 | ||||||||||
| U.S. Renal Care, Inc., L+900, 1/03/20 |
Healthcare | 4,910 | 4,818 | 5,008 | ||||||||||
| Valerus Compression Services, LP, 11.50%, 3/26/18 |
Manufacturing | 40,000 | 40,000 | 41,200 | ||||||||||
| Vertafore, Inc., L+825, 10/29/17 |
Business Services | 49,260 | 48,901 | 50,615 | ||||||||||
|
|
|
|
|
|||||||||||
| Total 2nd Lien Secured Debt |
$ | 830,828 | $ | 781,231 | ||||||||||
|
|
|
|
|
|||||||||||
| TOTAL SECURED DEBT |
$ | 1,222,888 | $ | 1,148,894 | ||||||||||
|
|
|
|
|
|||||||||||
See notes to financial statements.
60
Table of Contents
APOLLO INVESTMENT CORPORATION
SCHEDULE OF INVESTMENTS (continued)
March 31, 2013
(in thousands)
| INVESTMENTS IN NON-CONTROLLED/NON- |
Industry | Par Amount* |
Cost | Fair Value (1) |
||||||||||
| UNSECURED DEBT — 70.2% |
||||||||||||||
| Advantage Sales & Marketing, Inc., |
Grocery | $ | 25,000 | $ | 25,000 | $ | 25,000 | |||||||
| Altegrity, Inc., 0.00%, 8/02/16 ¨ † |
Diversified Service |
3,545 | 2,358 | 1,524 | ||||||||||
| Altegrity, Inc., 11.75%, 5/01/16 ¨ † |
Diversified Service |
14,639 | 11,885 | 10,394 | ||||||||||
| Altegrity, Inc., 12.00%, 11/01/15 ¨ † |
Diversified Service |
100,000 | 100,000 | 89,000 | ||||||||||
| American Tire Distributors, Inc., |
Distribution | 25,000 | 25,000 | 26,300 | ||||||||||
| Angelica Corporation, 15.00% (12.00% Cash/3.00% PIK), 10/15/16 |
Healthcare | 46,284 | 46,284 | 47,210 | ||||||||||
| ATI Acquisition Company, P+1400 (P+10.00% Cash/4.00% PIK), 12/30/15 *** |
Education | 45,153 | 37,867 | — | ||||||||||
| BCA Osprey II Limited (British Car Auctions), 12.50% PIK, 8/17/17 ‡ |
Transportation | £ | 25,609 | 40,643 | 36,359 | |||||||||
| BCA Osprey II Limited (British Car Auctions), 12.50% PIK, 8/17/17 ‡ |
Transportation | € | 15,528 | 21,507 | 18,643 | |||||||||
| Ceridian Corp., 12.25% Cash or 13.00% PIK, |
Diversified Service |
$ | 80,950 | 80,892 | 83,803 | |||||||||
| Ceridian Corp., 11.25%, 11/15/15 † |
Diversified Service |
35,800 | 35,812 | 37,023 | ||||||||||
| Ceridian Corp., 11.00%, 3/15/21 ¨ † |
Diversified Service |
67,500 | 67,500 | 72,731 | ||||||||||
| Delta Educational Systems, Inc., 16.00% (10.00% Cash/ 6% PIK), 5/12/17 |
Education | 20,430 | 20,024 | 19,143 | ||||||||||
| Denver Parent (Venoco, Inc.), 18.00%, 10/03/15 ¨ |
Energy | 20,000 | 20,000 | 23,400 | ||||||||||
| Exova Limited, 10.50%, 10/15/18 ¨ ‡ † |
Business Services |
£ | 10,000 | 16,013 | 16,627 | |||||||||
| Exova Limited, 10.50%, 10/15/18 ‡† |
Business Services |
£ | 12,655 | 17,116 | 21,041 | |||||||||
| First Data Corporation, 11.25%, 1/15/21¨ † |
Financial Services |
$ | 67,000 | 66,975 | 69,868 | |||||||||
| First Data Corporation, 10.625% 06/15/21 †× |
Financial Services |
10,000 | 10,000 | 10,150 | ||||||||||
| Intelsat Bermuda Ltd., 11.25%, 2/04/17 ‡ |
Broadcasting & Entertainment |
44,000 | 45,153 | 46,877 | ||||||||||
| Intelsat Bermuda Ltd., 11.50% Cash or 12.50% PIK, 2/04/17 ¨ ‡ |
Broadcasting & Entertainment |
20,000 | 20,035 | 21,250 | ||||||||||
| inVentiv Health, Inc., 11.00%, 8/15/18 ¨ |
Healthcare | 160,000 | 160,000 | 139,200 | ||||||||||
See notes to financial statements.
61
Table of Contents
APOLLO INVESTMENT CORPORATION
SCHEDULE OF INVESTMENTS (continued)
March 31, 2013
(in thousands, except shares)
| INVESTMENTS IN NON-CONTROLLED/NON- |
Industry | Par Amount* |
Cost | Fair Value(1) |
||||||||||
| UNSECURED DEBT — (continued) |
||||||||||||||
| Laureate Education, Inc., |
Education | $ | 53,540 | $ | 55,012 | $ | 57,823 | |||||||
| Lonestar Intermediate Super Holdings (Asurion), LLC, L+950, 9/02/19 |
Insurance | 41,922 | 41,776 | 45,223 | ||||||||||
| Molycorp Inc., 10.00%, 6/01/20 ‡ |
Precious Metals & Minerals |
5,158 | 4,990 | 5,123 | ||||||||||
| Niacet Corp., 13.00%, 8/28/18 |
Chemicals | 12,500 | 12,500 | 12,500 | ||||||||||
| SeaCube Container Leasing Ltd., |
Transportation | 50,000 | 50,000 | 51,500 | ||||||||||
| Univar Inc., 10.50%, 6/30/18 |
Distribution | 20,000 | 20,000 | 20,000 | ||||||||||
| U.S. Security Associates Holdings, Inc., 11.00%, 7/28/18 |
Business Services | 135,000 | 135,000 | 139,455 | ||||||||||
| Varietal Distribution, 10.75%, 6/30/17 ¨ † |
Distribution | € | 5,187 | 6,385 | 6,994 | |||||||||
| Varietal Distribution, 10.75%, 6/30/17 ¨ † |
Distribution | $ | 22,204 | 21,837 | 23,328 | |||||||||
|
|
|
|
|
|||||||||||
| TOTAL UNSECURED DEBT |
$ | 1,217,564 | $ | 1,177,489 | ||||||||||
|
|
|
|
|
|||||||||||
| TOTAL CORPORATE DEBT |
$ | 2,440,452 | $ | 2,326,383 | ||||||||||
|
|
|
|
|
|||||||||||
| STRUCTURED PRODUCTS — 0.6% |
||||||||||||||
| Westbrook CLO Ltd., Series 2006-1A Class E, L+370, 12/20/20 ‡ ¨ |
Finance | 11,000 | $ | 7,367 | $ | 9,625 | ||||||||
|
|
|
|
|
|||||||||||
| TOTAL STRUCTURED PRODUCTS |
$ | 7,367 | $ | 9,625 | ||||||||||
|
|
|
|
|
|||||||||||
| Shares | ||||||||||||||
| PREFERRED EQUITY — 0.7% |
||||||||||||||
| CA Holding, Inc. (Collect America, Ltd.), |
Finance | 7,961 | $ | 788 | $ | 1,592 | ||||||||
| Gryphon Colleges Corporation (Delta Educational Systems, Inc.), 13.50% PIK, 05/12/14 *** |
Education | 12,360 | 27,685 | 7,208 | ||||||||||
| Gryphon Colleges Corporation (Delta Educational Systems, Inc.), 12.50% PIK, (Convertible) *** |
Education | 332,500 | 6,863 | — | ||||||||||
| Varietal Distribution Holdings, LLC, Class A, 8.00% PIK |
Distribution | 3,097 | 4,885 | 2,750 | ||||||||||
|
|
|
|
|
|||||||||||
| TOTAL PREFERRED EQUITY |
$ | 40,221 | $ | 11,550 | ||||||||||
|
|
|
|
|
|||||||||||
| EQUITY — 3.9% |
||||||||||||||
| Common Equity/Interests — 3.4% |
||||||||||||||
| Accelerate Parent Corp. (American Tire |
Distribution | 3,125,000 | $ | 3,125 | $ | 4,160 | ||||||||
| AHC Mezzanine LLC (Advanstar) ** |
Media | — | 1,063 | 242 | ||||||||||
| Altegrity Holding Corp. ** |
Diversified Service | 353,399 | 13,797 | 1,111 | ||||||||||
| Aventine Renewable Energy |
Chemicals | 262,036 | 4,684 | 2,347 | ||||||||||
See notes to financial statements.
62
Table of Contents
APOLLO INVESTMENT CORPORATION
SCHEDULE OF INVESTMENTS (continued)
March 31, 2013
(in thousands, except shares and warrants)
| INVESTMENTS IN NON-CONTROLLED/NON- |
Industry | Shares | Cost | Fair Value(1) |
||||||||||
| Common Equity/Interests — (continued) |
||||||||||||||
| CA Holding, Inc. (Collect America, Ltd.) |
Finance | 25,000 | $ | 2,500 | $ | 2,498 | ||||||||
| CA Holding, Inc. (Collect America, Ltd.) |
Finance | 4,294 | 429 | 859 | ||||||||||
| Clothesline Holdings, Inc. (Angelica |
Healthcare | 6,000 | 6,000 | 3,059 | ||||||||||
| Explorer Coinvest LLC (Booz Allen) ** ‡ |
Consulting Services | 430 | 3,322 | 5,319 | ||||||||||
| Garden Fresh Restaurant Holding, LLC ** |
Retail | 50,000 | 5,000 | — | ||||||||||
| Gryphon Colleges Corporation (Delta Educational Systems, Inc.) ** |
Education | 17,500 | 175 | — | ||||||||||
| GS Prysmian Co-Invest L.P. (Prysmian Cables & Systems) (2,3) ** ‡ |
Manufacturing | — | — | 123 | ||||||||||
| JV Note Holdco LLC (DSI Renal Inc.) ** |
Healthcare | 9,303 | 85 | 91 | ||||||||||
| Pelican Energy, LLC ** ‡ |
Energy | — | 138 | 146 | ||||||||||
| Penton Business Media Holdings, LLC ** |
Printing & Publishing | 124 | 4,950 | 15,778 | ||||||||||
| RC Coinvestment, LLC (Ranpak Corp.) ** |
Packaging | 50,000 | 5,000 | 8,233 | ||||||||||
| Sorenson Communications Holdings, LLC |
Consumer Products | 454,828 | 45 | 1,990 | ||||||||||
| Univar Inc.** |
Distribution | 900,000 | 9,000 | 11,520 | ||||||||||
| Varietal Distribution Holdings, LLC Class A ** |
Distribution | 28,028 | 28 | — | ||||||||||
|
|
|
|
|
|||||||||||
| Total Common Equity/Interests |
$ | 59,341 | $ | 57,476 | ||||||||||
|
|
|
|
|
|||||||||||
| Warrants | ||||||||||||||
| Warrants — 0.5% |
||||||||||||||
| CA Holding, Inc. (Collect America, Ltd.), Common ** ‡ |
Finance | 7,961 | $ | 8 | — | |||||||||
| Fidji Luxco (BC) S.C.A., Common (FCI)(2) ** ‡ |
Electronics | 24,862 | 250 | $ | 5,788 | |||||||||
| Gryphon Colleges Corporation (Delta Educational Systems, Inc.), Common ** |
Education | 9,820 | 98 | — | ||||||||||
| Gryphon Colleges Corporation (Delta Educational Systems, Inc.), Class A-1 Preferred ** |
Education | 45,947 | 459 | — | ||||||||||
| Gryphon Colleges Corporation (Delta Educational Systems, Inc.), Class B-1 Preferred ** |
Education | 104,314 | 1,043 | — | ||||||||||
| Osage Exploration & Development, Inc. ** ‡ |
Energy | 1,496,843 | — | 1,841 | ||||||||||
| Spotted Hawk Development LLC, Common ** ‡ |
Energy | 54,545 | 852 | 1,644 | ||||||||||
|
|
|
|
|
|||||||||||
| Total Warrants |
$ | 2,710 | $ | 9,273 | ||||||||||
|
|
|
|
|
|||||||||||
| TOTAL EQUITY |
$ | 62,051 | $ | 66,749 | ||||||||||
|
|
|
|
|
|||||||||||
| Total Investments in Non-Controlled/ Non-Affiliated Investments |
$ | 2,550,091 | $ | 2,414,307 | ||||||||||
|
|
|
|
|
|||||||||||
See notes to financial statements.
63
Table of Contents
APOLLO INVESTMENT CORPORATION
SCHEDULE OF INVESTMENTS (continued)
March 31, 2013
(in thousands)
| INVESTMENTS IN CONTROLLED INVESTMENTS — 26.0% (4) |
Industry | Par Amount* |
Cost | Fair Value(1) |
||||||||||
| CORPORATE DEBT — 9.2% |
||||||||||||||
| SECURED DEBT— 6.7% |
||||||||||||||
| 1st Lien Secured Debt — 6.1% |
||||||||||||||
| Merx Aviation Finance Holdings, LLC, |
Aviation | $ | 92,000 | $ | 92,000 | $ | 92,000 | |||||||
| Merx Aviation Finance Holdings, LLC, |
Aviation | 5,303 | 5,303 | 5,303 | ||||||||||
| Merx Aviation Finance Holdings, LLC, |
Aviation | 4,684 | 4,684 | 4,684 | ||||||||||
|
|
|
|
|
|||||||||||
| Total 1st Lien Secured Debt |
$ | 101,987 | $ | 101,987 | ||||||||||
|
|
|
|
|
|||||||||||
| 2nd Lien Secured Debt — 0.6% |
||||||||||||||
| LVI Services, Inc., 12.50%, 3/06/2018 |
Environmental & Facilities Services |
$ | 10,000 | $ | 9,815 | $ | 10,000 | |||||||
|
|
|
|
|
|||||||||||
| Total 2nd Lien Secured Debt |
$ | 9,815 | $ | 10,000 | ||||||||||
|
|
|
|
|
|||||||||||
| TOTAL SECURED DEBT |
$ | 111,802 | $ | 111,987 | ||||||||||
|
|
|
|
|
|||||||||||
| UNSECURED DEBT — 2.5% |
||||||||||||||
| Playpower Holdings Inc., 14.00% PIK, 12/15/15 |
Leisure Equipment | € | 19,064 | $ | 25,285 | $ | 24,173 | |||||||
| Playpower, Inc., 12.50% PIK, 12/31/15 |
Leisure Equipment | £ | 12,310 | 18,838 | 18,458 | |||||||||
|
|
|
|
|
|||||||||||
| TOTAL UNSECURED DEBT |
$ | 44,123 | $ | 42,631 | ||||||||||
|
|
|
|
|
|||||||||||
| TOTAL CORPORATE DEBT |
$ | 155,925 | $ | 154,618 | ||||||||||
|
|
|
|
|
|||||||||||
| STRUCTURED PRODUCTS — 10.5% |
||||||||||||||
| AIC Credit Opportunity Fund LLC (5) |
Finance | — | $ | 48,102 | $ | 50,696 | ||||||||
| Highbridge Loan, Ltd., Preference Shares ** ‡ |
Finance | $ | 6,174 | 6,174 | 6,174 | |||||||||
| Jamestown CLO I LTD, Subordinated Notes, |
Finance | 15,075 | 14,053 | 13,568 | ||||||||||
| Jamestown CLO I LTD, Class D L+550, |
Finance | 3,800 | 3,373 | 3,537 | ||||||||||
| Jamestown CLO I LTD, Class C L+400, |
Finance | 1,120 | 1,024 | 1,109 | ||||||||||
| Kirkwood Fund II LLC, Common Interest ‡ |
Finance | — | 41,067 | 43,144 | ||||||||||
| MCF CLO I LLC, Membership Interests ‡ |
Finance | 38,918 | 38,918 | 38,918 | ||||||||||
| MCF CLO I LLC, Class E Notes L+575, |
Finance | 13,000 | 12,278 | 12,273 | ||||||||||
| Slater Mill Loan Fund LP, Common Stock ‡ |
Finance | 8,375 | 7,119 | 6,951 | ||||||||||
|
|
|
|
|
|||||||||||
| TOTAL STRUCTURED PRODUCTS |
$ | 172,108 | $ | 176,370 | ||||||||||
|
|
|
|
|
|||||||||||
See notes to financial statements.
64
Table of Contents
APOLLO INVESTMENT CORPORATION
SCHEDULE OF INVESTMENTS (continued)
March 31, 2013
(in thousands, except shares and warrants)
| INVESTMENTS IN CONTROLLED INVESTMENTS — 26.0%(4) |
Industry | Shares | Cost | Fair Value(1) |
||||||||||
| EQUITY — 6.3% |
||||||||||||||
| Common Equity/Interests — 6.3% |
||||||||||||||
| Generation Brands Holdings, Inc. (Quality Home Brands) ** |
Consumer Products | 9,007 | — | $ | 432 | |||||||||
| Generation Brands Holdings, Inc. Series H (Quality Home Brands) ** |
Consumer Products | 7,500 | $ | 2,297 | 360 | |||||||||
| Generation Brands Holdings, Inc. Series 2L (Quality Home Brands) ** |
Consumer Products | 36,700 | 11,242 | 1,760 | ||||||||||
| LVI Parent Corp. (LVI Services, Inc.) ** |
Environmental & Facilities Services |
14,981 | 16,096 | 30,575 | ||||||||||
| Merx Aviation Finance Holdings, LLC ** |
Aviation | — | 33,820 | 33,820 | ||||||||||
| Playpower Holdings Inc. ** |
Leisure Equipment | 1,000 | 77,722 | 38,157 | ||||||||||
|
|
|
|
|
|||||||||||
| Total Common Equity/Interests |
$ | 141,177 | $ | 105,104 | ||||||||||
|
|
|
|
|
|||||||||||
| TOTAL EQUITY |
$ | 141,177 | $ | 105,104 | ||||||||||
|
|
|
|
|
|||||||||||
| Total Investments in Controlled Investments |
$ | 469,210 | $ | 436,092 | ||||||||||
|
|
|
|
|
|||||||||||
| Total Investments — 169.9%(6,7) |
$ | 3,019,301 | $ | 2,850,399 | ||||||||||
| Liabilities in Excess of Other Assets — (69.9%) |
(1,173,010 | ) | ||||||||||||
|
|
|
|||||||||||||
| Net Assets — 100.0% |
$ | 1,677,389 | ||||||||||||
|
|
|
|||||||||||||
See notes to financial statements.
65
Table of Contents
APOLLO INVESTMENT CORPORATION
SCHEDULE OF INVESTMENTS (continued)
March 31, 2013
(in thousands)
| (1) | Fair value is determined in good faith by or under the direction of the Board of Directors of the Company (see Note 2). |
| (2) | Denominated in foreign currency as indicated. |
| (3) | The Company is the sole Limited Partner in GS Prysmian Co-Invest L.P. |
| (4) | Denotes investments in which we are deemed to exercise a controlling influence over the management or policies of a company, as defined in the 1940 Act, due to beneficially owning, either directly or through one or more controlled companies, more than 25% of the outstanding voting securities of the investment. Transactions during the fiscal year ended March 31, 2013 in these Controlled investments are as follows: |
| Name of Issuer |
Fair Value at March 31, 2012 |
Gross Additions |
Gross Reductions |
Interest/Dividend/ Other Income |
Fair Value at March 31,2013 |
|||||||||||||||
| Merx Aviation Finance Holdings, LLC, |
N/A | $ | 92,000 | $ | — | $ | 2,480 | $ | 92,000 | |||||||||||
| Merx Aviation Finance Holdings, LLC, |
N/A | 5,303 | — | 103 | 5,303 | |||||||||||||||
| Merx Aviation Finance Holdings, LLC, |
N/A | 4,684 | — | 6 | 4,684 | |||||||||||||||
| LVI Services, Inc.,12.50%, 03/06/2018 |
N/A | 9,800 | — | 916 | 10,000 | |||||||||||||||
| Playpower Holdings, Inc., 14.00% PIK |
$ | 21,576 | 3,155 | — | 3,154 | 24,173 | ||||||||||||||
| Playpower, Inc., 12.50% PIK |
16,960 | 2,250 | — | 2,469 | 18,458 | |||||||||||||||
| AIC Credit Opportunity Fund LLC Common Equity |
56,034 | 575 | (18,466 | ) | 7,422 | 50,696 | ||||||||||||||
| Highbridge Loan, Ltd., Preference Shares **‡ |
N/A | 4,410 | — | — | 6,174 | |||||||||||||||
| Jamestown CLO I LTD, Subordinated Notes, 11/5/24 ‡† |
N/A | 14,020 | — | 34 | 13,568 | |||||||||||||||
| Jamestown CLO I LTD, Class D L+550, |
N/A | 3,364 | — | 101 | 3,537 | |||||||||||||||
| Jamestown CLO I LTD, Class C L+400, |
N/A | 1,021 | — | 23 | 1,109 | |||||||||||||||
| Kirkwood Fund II LLC, Common Interest ‡ |
N/A | 41,067 | — | — | 43,144 | |||||||||||||||
| MCF CLO I LLC, Membership Interests ‡ |
N/A | 40,385 | (1,467 | ) | 5,896 | 38,918 | ||||||||||||||
| MCF CLO I LLC, Class E Notes L+575, |
N/A | 12,273 | — | 84 | 12,273 | |||||||||||||||
| Slater Mill Loan Fund LP, Common Stock ‡ |
N/A | 7,370 | (251 | ) | 929 | 6,951 | ||||||||||||||
| Generation Brands Holdings, Inc. (Quality Home Brands) Common Equity |
130 | — | — | — | 432 | |||||||||||||||
| Generation Brands Holdings, Inc. (Quality Home Brands) Series H Common Equity |
1,300 | — | — | — | 360 | |||||||||||||||
| Generation Brands Holdings, Inc. (Quality Home Brands) Series 2L Common Equity |
7,793 | — | — | — | 1,760 | |||||||||||||||
| LVI Parent Corp. Common Equity |
21,504 | — | — | — | 30,575 | |||||||||||||||
| Merx Aviation Finance Holdings, LLC Equity Interest |
N/A | 33,820 | — | — | 33,820 | |||||||||||||||
| Playpower Holdings Inc. Common Equity |
61,111 | — | — | — | 38,157 | |||||||||||||||
|
|
|
|
|
|
|
|
|
|
|
|||||||||||
| $ | 186,408 | $ | 275,497 | $ | (20,184 | ) | $ | 23,617 | $ | 436,092 | ||||||||||
|
|
|
|
|
|
|
|
|
|
|
|||||||||||
See notes to financial statements.
66
Table of Contents
APOLLO INVESTMENT CORPORATION
SCHEDULE OF INVESTMENTS (continued)
March 31, 2013
(in thousands)
As of March 31, 2013, the Company has a 100%, 32%, 32%, 100%, 100%, 32%, 31%, 98%, 97%, and 26% equity ownership interest in AIC Credit Opportunity Fund LLC, Generation Brands Holdings, Inc., LVI Parent Corp., Playpower Holdings Inc., Merx Aviation Financing Holdings LLC, Highbridge Loan, Ltd, Jamestown CLO I Ltd, Kirkwood Fund II LLC, MCF CLO I LLC, and Slater Mill Loan Fund LP, respectively.
| (5) | See Note 6. |
| (6) | Aggregate gross unrealized appreciation for federal income tax purposes is $127,303; aggregate gross unrealized depreciation for federal income tax purposes is $396,790. Net unrealized depreciation is $269,487 based on a tax cost of $3,119,886. |
| (7) | Substantially all securities are pledged as collateral to our multicurrency revolving credit facility (the “Facility”). As such these securities are not available as collateral to our general creditors. |
| ¨ | These securities are exempt from registration under Rule 144A of the Securities Act of 1933. These securities may be resold in transactions that are exempt from registration, normally to qualified institutional buyers. |
| * | Denominated in USD unless otherwise noted. |
| ** | Non-income producing security |
| *** | Non-accrual status (see Note 2d) |
| † | Denotes debt securities where the Company owns multiple tranches of the same broad asset type but whose security characteristics differ. Such differences may include level of subordination, call protection and pricing, and differing interest rate characteristics, among other factors. Such factors are usually considered in the determination of fair values. |
| ‡ | Investments that the Company has determined are not “qualifying assets” under Section 55(a) of the 1940 Act. Under the 1940 Act, we may not acquire any non-qualifying asset unless, at the time such acquisition is made, qualifying assets represent at least 70% of our total assets. The status of these assets under the 1940 Act are subject to change. The Company monitors the status of these assets on an ongoing basis. |
| × | Denotes a “when issued” security that settled after March 31, 2013. |
See notes to financial statements.
67
Table of Contents
APOLLO INVESTMENT CORPORATION
SCHEDULE OF INVESTMENTS (continued)
| Industry Classification |
Percentage of Total Investments (at fair value) as of March 31, 2013 |
|||
| Diversified Service |
10.4% | |||
| Healthcare |
10.2% | |||
| Business Services |
9.8% | |||
| Finance |
8.5% | |||
| Packaging |
5.1% | |||
| Financial Services |
5.0% | |||
| Aviation |
4.8% | |||
| Transportation |
4.6% | |||
| Environmental & Facilities Services |
4.0% | |||
| Energy |
3.9% | |||
| Education |
3.7% | |||
| Distribution |
3.3% | |||
| Leisure Equipment |
2.8% | |||
| Broadcasting & Entertainment |
2.8% | |||
| Manufacturing |
2.5% | |||
| Electronics |
2.3% | |||
| Telecommunications |
1.9% | |||
| Grocery |
1.9% | |||
| Consumer Products |
1.8% | |||
| Insurance |
1.6% | |||
| Printing & Publishing |
1.6% | |||
| Power |
1.4% | |||
| Chemicals |
1.4% | |||
| Retail |
1.3% | |||
| Utilities |
1.3% | |||
| Homebuilding |
0.7% | |||
| Oil and Gas |
0.5% | |||
| Media |
0.5% | |||
| Consulting Services |
0.2% | |||
| Precious Metals and Minerals |
0.2% | |||
|
|
|
|||
| Total Investments |
100.0% | |||
|
|
|
|||
See notes to financial statements.
68
Table of Contents
APOLLO INVESTMENT CORPORATION
SCHEDULE OF INVESTMENTS
March 31, 2012
(in thousands)
| INVESTMENTS IN NON-CONTROLLED/NON AFFILIATED |
Industry | Par Amount* |
Cost | Fair Value(1) |
||||||||||
| CORPORATE DEBT — 139.2% |
||||||||||||||
| SECURED DEBT — 51.3% |
||||||||||||||
| 1st Lien Secured Debt — 7.5% |
||||||||||||||
| Advantage Sales & Marketing, Inc., P+300, 12/17/15 (Revolving loan) |
Grocery | $ | 5,500 | $ | 2,200 | $ | 2,035 | |||||||
| ATI Acquisition Company, P+1400 (P+1000 Cash/ 4.00% PIK), 6/30/12*** † |
Education | 4,494 | 4,015 | 3,600 | ||||||||||
| ATI Acquisition Company, P+900 (P+500 Cash/4.00% PIK), 12/30/14*** † |
Education | 14,889 | 12,596 | — | ||||||||||
| Aventine Renewable Energy Holdings, Inc., |
Chemicals | 24,937 | 20,009 | 19,825 | ||||||||||
| Eastman Kodak Company, DIP L+750, 7/20/13 |
Technology | 11,231 | 11,016 | 11,427 | ||||||||||
| Grocery Outlet Inc., L+900, 12/15/17 |
Grocery | 18,408 | 18,408 | 18,812 | ||||||||||
| Penton Media, Inc., L+400 (L+300 Cash/1.00% PIK), 8/1/14 |
Printing & Publishing |
34,906 | 29,986 | 27,794 | ||||||||||
| RBS Holding Company, LLC, L+500, 3/23/17 |
Business Services | 15,840 | 15,703 | 9,900 | ||||||||||
| Texas Competitive Electric Holdings Company LLC, 11.50%, 10/1/20 ¨ |
Utilities | 50,000 | 49,668 | 32,875 | ||||||||||
|
|
|
|
|
|||||||||||
| Total 1st Lien Secured Debt |
$ | 163,601 | $ | 126,268 | ||||||||||
|
|
|
|
|
|||||||||||
| 2nd Lien Secured Debt — 43.8% |
||||||||||||||
| Advantage Sales & Marketing, Inc., L+775, 6/18/18 |
Grocery | $ | 58,000 | $ | 57,571 | $ | 57,855 | |||||||
| Allied Security Holdings, LLC, L+750, 2/2/18 |
Business Services | 31,000 | 30,728 | 31,233 | ||||||||||
| Asurion Corporation, L+750, 5/24/19 |
Insurance | 78,111 | 77,959 | 79,234 | ||||||||||
| Brock Holdings III, Inc., L+825, 3/16/18 |
Environmental & Facilities Services |
39,000 | 38,302 | 38,561 | ||||||||||
| Clean Earth, Inc., 13.00%, 8/1/14 |
Environmental & Facilities Services |
25,000 | 25,000 | 24,875 | ||||||||||
| Garden Fresh Restaurant Corp., L+975, 12/11/13 |
Retail | 46,600 | 47,027 | 47,532 | ||||||||||
| Insight Pharmaceuticals, LLC, L+1175, 8/25/17 |
Consumer Products | 20,000 | 19,627 | 19,900 | ||||||||||
| IPC Systems, Inc., L+525, 6/1/15 |
Telecommunications | 44,250 | 42,170 | 38,497 | ||||||||||
| Kronos, Inc., L+1000, 6/11/18 |
Electronics | 35,000 | 35,000 | 35,700 | ||||||||||
| Ozburn-Hessey Holding Company LLC, |
Transportation | 38,000 | 37,971 | 30,780 | ||||||||||
| Ranpak Corp., L+750, 10/20/17 † |
Packaging | 85,000 | 85,000 | 82,025 | ||||||||||
| Ranpak Corp., E+775, 10/20/17 † |
Packaging | € | 40,000 | 58,042 | 52,602 | |||||||||
| Sedgwick Holdings, Inc., L+750, 5/26/17 |
Business Services | $ | 15,225 | 15,043 | 15,149 | |||||||||
| SquareTwo Financial Corp. (Collect America, Ltd.), 11.625%, 4/1/17 ¨ ‡ |
Finance | 40,000 | 39,450 | 39,800 | ||||||||||
| Sheridan Holdings, Inc., L+575 Cash or L+650 PIK, 6/15/15 |
Healthcare | 24,047 | 23,446 | 23,518 | ||||||||||
| TransFirst Holdings, Inc., L+600 Cash or |
Financial Services | 19,012 | 18,372 | 17,795 | ||||||||||
| Valerus Compression Services, LP, 11.50%, 3/26/18 |
Manufacturing | 40,000 | 40,000 | 40,680 | ||||||||||
| Vertafore, Inc., L+825, 10/29/17 |
Business Services | 49,260 | 48,842 | 49,383 | ||||||||||
| Wall Street Systems Holdings, Inc., L+750, 6/20/18 ‡ |
Software | 13,000 | 12,881 | 13,098 | ||||||||||
|
|
|
|
|
|||||||||||
| Total 2nd Lien Secured Debt |
$ | 752,431 | $ | 738,217 | ||||||||||
|
|
|
|
|
|||||||||||
| TOTAL SECURED DEBT |
$ | 916,032 | $ | 864,485 | ||||||||||
|
|
|
|
|
|||||||||||
See notes to financial statements.
69
Table of Contents
APOLLO INVESTMENT CORPORATION
SCHEDULE OF INVESTMENTS (continued)
March 31, 2012
(in thousands)
| INVESTMENTS IN NON-CONTROLLED/NON AFFILIATED |
Industry | Par Amount* |
Cost | Fair Value(1) |
||||||||||
| UNSECURED DEBT — 87.9% |
||||||||||||||
| AB Acquisitions UK Topco 2 Limited (Alliance Boots), GBP L+650 (GBP L+300 Cash/3.50% PIK), 7/9/17 ‡ |
Retail | £ | 22,580 | $ | 44,368 | $ | 33,612 | |||||||
| Advantage Sales & Marketing, Inc., 13.00%, 12/31/18 |
Grocery | $ | 25,000 | 25,000 | 24,625 | |||||||||
| Altegrity Inc., 0.00%, 8/2/16 ¨ † |
Diversified Service | 3,545 | 2,087 | 1,965 | ||||||||||
| Altegrity Inc., 11.75%, 5/1/16 ¨ † |
Diversified Service | 14,639 | 11,112 | 13,907 | ||||||||||
| Altegrity Inc., 12.00%, 11/1/15 ¨ † |
Diversified Service | 100,000 | 100,000 | 100,600 | ||||||||||
| Altegrity Inc., 10.50%, 11/1/15 ¨ † |
Diversified Service | 13,475 | 12,387 | 12,869 | ||||||||||
| American Tire Distributors, Inc., 11.50%, 6/1/18 ¨ |
Distribution | 25,000 | 25,000 | 26,450 | ||||||||||
| Angelica Corporation, 15.00% (12.00% Cash/3.00% PIK), 10/15/16 |
Healthcare | 53,343 | 53,343 | 52,756 | ||||||||||
| ATI Acquisition Company, P+1400 (P+1000 Cash/ |
Education | 43,296 | 37,867 | — | ||||||||||
| Avaya Inc., 10.125% Cash or 10.875% PIK, 11/1/15 |
Telecommunications | 43,577 | 40,713 | 43,468 | ||||||||||
| BCA Osprey II Limited (British Car Auctions), 12.50% PIK, 8/17/17 ‡ |
Transportation | £ | 22,750 | 35,957 | 32,078 | |||||||||
| BCA Osprey II Limited (British Car Auctions), 12.50% PIK, 8/17/17 ‡ |
Transportation | € | 13,773 | 19,138 | 16,186 | |||||||||
| Catalina Marketing Corporation, 11.625%, 10/1/17 ¨ |
Grocery | $ | 27,175 | 27,157 | 25,001 | |||||||||
| Ceridian Corp., 12.25% Cash or 13.00% PIK, |
Diversified Service | 55,950 | 55,845 | 51,334 | ||||||||||
| Ceridian Corp., 11.25%, 11/15/15 † |
Diversified Service | 34,300 | 34,035 | 31,642 | ||||||||||
| Clearwire Communications, 12.00%, 12/1/15 ¨† ‡ |
Telecommunications | 24,843 | 24,289 | 24,595 | ||||||||||
| Clearwire Communications, 14.75%, 12/1/16 ¨† ‡ |
Telecommunications | 1,000 | 1,000 | 1,098 | ||||||||||
| Delta Educational Systems, Inc., 14.20% (13.00% Cash/ 1.20% PIK), 5/12/13 |
Education | 19,991 | 19,828 | 20,221 | ||||||||||
| Exova Limited, 10.50%, 10/15/18 ¨ ‡ |
Business Services | £ | 18,000 | 28,823 | 25,524 | |||||||||
| Exova Limited, 10.50%, 10/15/18 ‡ |
Business Services | 17,655 | 24,942 | 25,035 | ||||||||||
| FoxCo Acquisition Sub LLC, 13.375%, 7/15/16 ¨ |
Broadcasting & Entertainment |
$ | 26,125 | 26,620 | 28,607 | |||||||||
| Hub International Holdings, 10.25%, 6/15/15 ¨ |
Insurance | 36,232 | 35,228 | 37,410 | ||||||||||
| Intelsat Bermuda Ltd., 11.25%, 2/4/17 † ‡ |
Broadcasting & Entertainment |
84,000 | 86,285 | 87,570 | ||||||||||
| Intelsat Bermuda Ltd., 11.50% Cash or 12.50% PIK, 2/4/17 † ‡ |
Broadcasting & Entertainment |
20,000 | 19,500 | 20,850 | ||||||||||
| inVentiv Health, Inc., 11.00%, 8/15/18 |
Healthcare | 160,000 | 160,000 | 144,000 | ||||||||||
| Laureate Education, Inc., 12.75%, 8/15/17 ¨‡ |
Education | 53,540 | 53,512 | 57,422 | ||||||||||
| Lonestar Intermediate Super Holdings (Asurion), LLC, L+950, 9/2/19 |
Insurance | 26,922 | 26,116 | 27,376 | ||||||||||
| SeaCube Container Leasing Ltd., 11.00%, 4/28/16 ‡ |
Transportation | 50,000 | 50,000 | 51,250 | ||||||||||
| Sorenson Communications, Inc., 10.50%, 2/1/15 ¨ |
Consumer Services | 16,500 | 16,303 | 13,695 | ||||||||||
| SRA International, Inc., 11.00%, 10/1/19 |
Consulting Services | 25,000 | 25,000 | 26,500 | ||||||||||
See notes to financial statements.
70
Table of Contents
APOLLO INVESTMENT CORPORATION
SCHEDULE OF INVESTMENTS (continued)
March 31, 2012
(in thousands, except shares)
| INVESTMENTS IN NON-CONTROLLED/NON AFFILIATED INVESTMENTS — 147.9% |
Industry | Par Amount* |
Cost | Fair Value(1) |
||||||||||
| UNSECURED DEBT — (continued) |
||||||||||||||
| The ServiceMaster Company, 10.75% Cash or |
Diversified Service |
$ | 15,731 | $ | 15,967 | $ | 16,596 | |||||||
| TL Acquisitions, Inc. (Thomson Learning), |
Education | 120,500 | 101,356 | 94,291 | ||||||||||
| Travelport LLC, 9.875%, 9/1/14 † ‡ |
Business Services |
19,779 | 18,606 | 12,733 | ||||||||||
| Travelport LLC, L+462.5, 9/1/14 † ‡ |
Business Services |
13,000 | 10,970 | 7,150 | ||||||||||
| Univar Inc., 12.00%, 6/30/18 |
Distribution | 78,750 | 79,652 | 78,830 | ||||||||||
| U.S. Renal Care, Inc., 13.25% (11.25% Cash/ |
Healthcare | 50,824 | 50,824 | 52,603 | ||||||||||
| U.S. Security Associates Holdings, Inc., |
Business Services |
135,000 | 135,000 | 138,110 | ||||||||||
| Varietal Distribution, 10.75%, 6/30/17 ‡ |
Distribution | € | 1,127 | 1,408 | 1,497 | |||||||||
| Varietal Distribution, 10.75%, 6/30/17 |
Distribution | $ | 22,204 | 21,773 | 22,160 | |||||||||
|
|
|
|
|
|||||||||||
| TOTAL UNSECURED DEBT |
$ | 1,557,011 | $ | 1,481,616 | ||||||||||
|
|
|
|
|
|||||||||||
| TOTAL CORPORATE DEBT |
$ | 2,473,043 | $ | 2,346,101 | ||||||||||
|
|
|
|
|
|||||||||||
| STRUCTURED PRODUCTS — 0.5% |
||||||||||||||
| Westbrook CLO Ltd., Series 2006-1A, L+370, 12/20/20 ¨‡ |
Finance | $ | 11,000 | $ | 7,109 | $ | 7,691 | |||||||
|
|
|
|
|
|||||||||||
| TOTAL STRUCTURED PRODUCTS |
$ | 7,109 | $ | 7,691 | ||||||||||
|
|
|
|
|
|||||||||||
| Shares | ||||||||||||||
| PREFERRED EQUITY — 2.1% |
||||||||||||||
| CA Holding, Inc. (Collect America, Ltd.) |
Finance | 7,961 | $ | 788 | $ | 1,592 | ||||||||
| Gryphon Colleges Corporation (Delta Educational Systems, Inc.), 13.50% PIK, 5/12/14 |
Education | 12,360 | 25,789 | 26,207 | ||||||||||
| Gryphon Colleges Corporation (Delta Educational Systems, Inc.), 12.50% PIK (Convertible) |
Education | 332,500 | 6,863 | 3,708 | ||||||||||
| Varietal Distribution Holdings, LLC, 8.00% PIK |
Distribution | 3,097 | 4,514 | 3,141 | ||||||||||
|
|
|
|
|
|||||||||||
| TOTAL PREFERRED EQUITY |
$ | 37,954 | $ | 34,648 | ||||||||||
|
|
|
|
|
|||||||||||
| EQUITY — 6.1% |
||||||||||||||
| Common Equity/Interests — 5.5% |
||||||||||||||
| AB Capital Holdings LLC (Allied Security) |
Business Services |
2,000,000 | $ | 2,000 | $ | 3,040 | ||||||||
| Accelerate Parent Corp. (American Tire) ** |
Distribution | 3,125,000 | 3,125 | 4,750 | ||||||||||
| AHC Mezzanine LLC (Advanstar) ** |
Media | — | 1,063 | 279 | ||||||||||
| Altegrity Holding Corp.** |
Diversified Service |
353,399 | 13,797 | 9,063 | ||||||||||
See notes to financial statements.
71
Table of Contents
APOLLO INVESTMENT CORPORATION
SCHEDULE OF INVESTMENTS (continued)
March 31, 2012
(in thousands, except shares and warrants)
| INVESTMENTS IN NON-CONTROLLED/NON |
Industry | Shares | Cost | Fair Value(1) |
||||||||||
| Common Equity/Interests — (continued) |
||||||||||||||
| CA Holding, Inc. (Collect America, Ltd.) |
Finance | 25,000 | $ | 2,500 | $ | 1,058 | ||||||||
| CA Holding, Inc. (Collect America, Ltd.) |
Finance | 4,294 | 429 | 859 | ||||||||||
| Clothesline Holdings, Inc. (Angelica) ** |
Healthcare | 6,000 | 6,000 | 1,729 | ||||||||||
| Explorer Coinvest LLC (Booz Allen) ** ‡ |
Consulting Services | 430 | 4,300 | 6,810 | ||||||||||
| Garden Fresh Restaurant Holding, LLC ** |
Retail | 50,000 | 5,000 | 7,600 | ||||||||||
| Gryphon Colleges Corporation (Delta Educational |
Education | 17,500 | 175 | — | ||||||||||
| GS Prysmian Co-Invest L.P. (Prysmian Cables & |
Manufacturing | — | — | 208 | ||||||||||
| JV Note Holdco LLC (DSI Renal Inc.) |
Healthcare | 9,303 | 85 | 84 | ||||||||||
| New Omaha Holdings Co-Invest LP |
Financial Services | 13,000,000 | 65,000 | 24,960 | ||||||||||
| Penton Business Media Holdings, LLC ** |
Printing & Publishing |
124 | 4,950 | 8,308 | ||||||||||
| RC Coinvestment, LLC (Ranpak Corp.) ** ‡ |
Packaging | 50,000 | 5,000 | 8,535 | ||||||||||
| Sorenson Communications Holdings, LLC |
Consumer Products |
454,828 | 45 | 1,380 | ||||||||||
| Univar Inc. ** |
Distribution | 900,000 | 9,000 | 13,840 | ||||||||||
| Varietal Distribution Holdings, LLC Class A ** |
Distribution | 28,028 | 28 | — | ||||||||||
|
|
|
|
|
|||||||||||
| Total Common Equity/Interests |
$ | 122,497 | $ | 92,503 | ||||||||||
|
|
|
|
|
|||||||||||
| Warrants | ||||||||||||||
| Warrants—0.6% |
||||||||||||||
| CA Holding, Inc. (Collect America, Ltd.), |
Finance | 7,961 | $ | 8 | $ | — | ||||||||
| Fidji Luxco (BC) S.C.A., Common (FCI) (2) ** ‡ |
Electronics | 48,769 | 491 | 7,619 | ||||||||||
| Gryphon Colleges Corporation (Delta Educational |
Education | 9,820 | 98 | — | ||||||||||
| Gryphon Colleges Corporation (Delta Educational |
Education | 45,947 | 459 | 947 | ||||||||||
| Gryphon Colleges Corporation (Delta Educational |
Education | 104,314 | 1,043 | 1,163 | ||||||||||
|
|
|
|
|
|||||||||||
| Total Warrants |
$ | 2,099 | $ | 9,729 | ||||||||||
|
|
|
|
|
|||||||||||
| TOTAL EQUITY |
$ | 124,596 | $ | 102,232 | ||||||||||
|
|
|
|
|
|||||||||||
| Total Investments in Non-Controlled/ |
$ | 2,642,702 | $ | 2,490,672 | ||||||||||
|
|
|
|
|
|||||||||||
See notes to financial statements.
72
Table of Contents
APOLLO INVESTMENT CORPORATION
SCHEDULE OF INVESTMENTS (continued)
March 31, 2012
(in thousands, except shares)
| INVESTMENTS IN CONTROLLED INVESTMENTS — 11.0%(4) |
Industry | Par Amount* |
Cost | Fair Value (1) |
||||||||||
| CORPORATE DEBT — 2.3% |
||||||||||||||
| Unsecured Debt — 2.3% |
||||||||||||||
| Playpower Holdings Inc., 14.00% PIK, 12/15/15 |
Leisure Equipment | € | 16,617 | $ | 22,129 | $ | 21,576 | |||||||
| Playpower, Inc., 12.50% PIK, 12/31/15 |
Leisure Equipment | £ | 10,887 | 16,367 | 16,960 | |||||||||
|
|
|
|
|
|||||||||||
| Total Unsecured Debt |
$ | 38,496 | $ | 38,536 | ||||||||||
|
|
|
|
|
|||||||||||
| TOTAL CORPORATE DEBT |
$ | 38,496 | $ | 38,536 | ||||||||||
|
|
|
|
|
|||||||||||
| STRUCTURED PRODUCTS — 3.3% |
||||||||||||||
| AIC Credit Opportunity Fund LLC (5) ‡ |
Finance | — | $ | 63,029 | $ | 56,034 | ||||||||
|
|
|
|
|
|||||||||||
| TOTAL STRUCTURED PRODUCTS |
$ | 63,029 | $ | 56,034 | ||||||||||
|
|
|
|
|
|||||||||||
| Shares | ||||||||||||||
|
|
|
|||||||||||||
| EQUITY — 5.4% |
||||||||||||||
| Common Equity/Interests — 5.4% |
||||||||||||||
| Generation Brands Holdings, Inc. (Quality Home Brands) ** |
Consumer Products | 750 | $ | — | $ | 130 | ||||||||
| Generation Brands Holdings, Inc. Series H (Quality Home Brands) ** |
Consumer Products | 7,500 | 2,297 | 1,300 | ||||||||||
| Generation Brands Holdings, Inc. Series 2L (Quality Home Brands) ** |
Consumer Products | 44,957 | 11,242 | 7,793 | ||||||||||
| LVI Parent Corp. (LVI Services, Inc.) |
Environmental & Facilities Services |
14,981 | 16,096 | 21,504 | ||||||||||
| Playpower Holdings Inc. |
Leisure Equipment | 1,000 | 77,722 | 61,111 | ||||||||||
|
|
|
|
|
|||||||||||
| Total Common Equity/Interests |
$ | 107,357 | $ | 91,838 | ||||||||||
|
|
|
|
|
|||||||||||
| TOTAL EQUITY |
$ | 107,357 | $ | 91,838 | ||||||||||
|
|
|
|
|
|||||||||||
| Total Investments in Controlled Investments |
$ | 208,882 | $ | 186,408 | ||||||||||
|
|
|
|
|
|||||||||||
| Total Investments — 158.9%(6,7) |
$ | 2,851,584 | $ | 2,677,080 | ||||||||||
| Liabilities in Excess of Other Assets — (58.9%) |
(991,849 | ) | ||||||||||||
|
|
|
|||||||||||||
| Net Assets — 100.0% |
$ | 1,685,231 | ||||||||||||
|
|
|
|||||||||||||
See notes to financial statements.
73
Table of Contents
APOLLO INVESTMENT CORPORATION
SCHEDULE OF INVESTMENTS (continued)
March 31, 2012
(in thousands)
| (1) | Fair value is determined in good faith by or under the direction of the Board of Directors of the Company (see Note 2). |
| (2) | Denominated in foreign currency as indicated. |
| (3) | The Company is the sole Limited Partner in GS Prysmian Co-Invest L.P. |
| (4) | Denotes investments in which we are deemed to exercise a controlling influence over the management or policies of a company, as defined in the 1940 Act, due to beneficially owning, either directly or through one or more controlled companies, more than 25% of the outstanding voting securities of the investment. Transactions during the fiscal year ended March 31, 2012 in these Controlled investments are as follows: |
| Name of Issuer |
Fair Value at March 31, 2011 |
Gross Additions |
Gross Reductions |
Interest/Dividend/ Other Income |
Fair Value at March 31,2012 |
|||||||||||||||
| Playpower Holdings, Inc., 14.00% PIK |
$ | — | $ | 22,129 | $ | — | $ | 2,195 | $ | 21,576 | ||||||||||
| Playpower, Inc., 12.50% PIK |
— | 16,366 | — | 1,551 | 16,960 | |||||||||||||||
| AIC Credit Opportunity Fund LLC Common Equity |
95,212 | 9,317 | 20,889 | 13,444 | 56,034 | |||||||||||||||
| Generation Brands Holdings, Inc. (Quality Home Brands) Common Equity |
8 | — | — | — | 130 | |||||||||||||||
| GenerationBrandsHoldings,Inc. (Quality Home Brands) Series H Common Equity |
77 | — | — | — | 1,300 | |||||||||||||||
| Generation Brands Holdings, Inc. (Quality Home Brands) Series 2L Common Equity |
379 | — | — | — | 7,793 | |||||||||||||||
| LVI Parent Corp. Common Equity |
15,892 | — | — | — | 21,504 | |||||||||||||||
| Playpower Holdings Inc. Common Equity |
— | 77,722 | — | — | 61,111 | |||||||||||||||
|
|
|
|
|
|
|
|
|
|
|
|||||||||||
| $ | 111,568 | $ | 125,534 | $ | 20,889 | $ | 17,190 | $ | 186,408 | |||||||||||
|
|
|
|
|
|
|
|
|
|
|
|||||||||||
As of March 31, 2012, the Company has a 100%, 32%, 34% and 100% equity ownership interest in AIC Credit Opportunity Fund LLC, Generation Brands Holdings, Inc., LVI Parent Corp. and Playpower Holdings Inc., respectively.
| (5) | See Note 6. |
| (6) | Aggregate gross unrealized appreciation for federal income tax purposes is $85,025; aggregate gross unrealized depreciation for federal income tax purposes is $363,967. Net unrealized depreciation is $278,942 based on a tax cost of $2,956,022. |
| (7) | Substantially all securities are pledged as collateral to our multicurrency revolving credit facility (the “Senior Secured Facility”). As such these securities are not available as collateral to our general creditors. |
| ¨ | These securities are exempt from registration under Rule 144A of the Securities Act of 1933. These securities may be resold in transactions that are exempt from registration, normally to qualified institutional buyers. |
| * | Denominated in USD unless otherwise noted. |
| ** | Non-income producing security |
| *** | Non-accrual status (see Note 2d) |
| † | Denotes debt securities where the Company owns multiple tranches of the same broad asset type but whose security characteristics differ. Such differences may include level of subordination, call protection and pricing, differing interest rate characteristics, among other factors. Such factors are usually considered in the determination of fair values. |
| ‡ | Investments that the Company has determined are not “qualifying assets” under Section 55(a) of the 1940 Act. Under the 1940 Act, we may not acquire any non-qualifying asset unless, at the time such acquisition is made, qualifying assets represent at least 70% of our total assets. The status of these assets under the 1940 Act are subject to change. The Company monitors the status of these assets on an ongoing basis. |
See notes to financial statements.
74
Table of Contents
APOLLO INVESTMENT CORPORATION
SCHEDULE OF INVESTMENTS (continued)
| Industry Classification |
Percentage of Total Investments (at fair value) as of March 31, 2012 |
|||
| Business Services |
11.9% | |||
| Healthcare |
10.3% | |||
| Diversified Service |
8.9% | |||
| Education |
7.8% | |||
| Distribution |
5.6% | |||
| Insurance |
5.4% | |||
| Packaging |
5.4% | |||
| Broadcasting & Entertainment |
5.1% | |||
| Transportation |
4.9% | |||
| Grocery |
4.8% | |||
| Telecommunications |
4.0% | |||
| Finance |
4.0% | |||
| Leisure Equipment |
3.7% | |||
| Retail |
3.3% | |||
| Environmental & Facilities Services |
3.2% | |||
| Electronics |
1.6% | |||
| Financial Services |
1.6% | |||
| Manufacturing |
1.5% | |||
| Printing & Publishing |
1.4% | |||
| Consulting Services |
1.2% | |||
| Utilities |
1.2% | |||
| Consumer Products |
1.1% | |||
| Chemicals |
0.7% | |||
| Consumer Services |
0.5% | |||
| Software |
0.5% | |||
| Technology |
0.4% | |||
| Media |
0.0% | |||
|
|
|
|||
| Total Investments |
100.0% | |||
|
|
|
|||
See notes to financial statements.
75
Table of Contents
APOLLO INVESTMENT CORPORATION
NOTES TO FINANCIAL STATEMENTS
(in thousands except share and per share amounts)
Note 1. Organization
Apollo Investment Corporation (“Apollo Investment”, the “Company”, “AIC”, “we”, “us”, or “our”), a Maryland corporation organized on February 2, 2004, is a closed-end, externally managed, non-diversified management investment company that has elected to be treated as a business development company (“BDC”) under the Investment Company Act of 1940 (the “1940 Act”). In addition, for tax purposes we have elected to be treated as a regulated investment company (“RIC”), under the Internal Revenue Code of 1986, as amended (“the Code”). Our investment objective is to generate current income and capital appreciation. We invest primarily in various forms of debt investments, including secured and unsecured loans, mezzanine investments, and/or equity in private middle-market companies. We may also invest in the securities of public companies and structured products such as collateralized loan obligations. Our portfolio is comprised primarily of investments in debt, including secured, unsecured and mezzanine debt of private-middle market companies that, in the case of senior secured loans, generally are not broadly syndicated and whose aggregate tranche size is typically less than $250 million. Our portfolio also includes equity interests such as common stock, preferred stock, warrants or options.
Apollo Investment commenced operations on April 8, 2004 receiving net proceeds of $870,000 from its initial public offering by selling 62 million shares of common stock at a price of $15.00 per share. Since then, and through March 31, 2013, we have raised approximately $1.9 billion in net proceeds from additional offerings of common stock.
Note 2. Significant Accounting Policies
The preparation of financial statements in conformity with accounting principles generally accepted in the United States of America (“GAAP”) requires management to make estimates and assumptions that affect the reported amount of assets and liabilities at the date of the financial statements and the reported amounts of income and expenses during the reported periods. Changes in the economic environment, financial markets and any other parameters used in determining these estimates could cause actual results to differ materially.
Financial statements are prepared in accordance with GAAP and pursuant to the requirements for reporting on Form 10-K and Regulation S-X, as appropriate. In the opinion of management, all adjustments, which are of a normal recurring nature, considered necessary for the fair presentation of financial statements have been included. Certain industries were reclassified on the Schedule of Investments for March 31, 2012 to conform to the current period’s presentation. Additionally, in the March 31, 2012 Schedule of Investments, secured debt positions were identified as bank debt/senior secured loans and unsecured debt was identified as subordinated debt/corporate notes. The naming of these categories has been updated to reflect the current period presentation. For the fiscal year ended March 31, 2013, approximately $2.3 million of investment income previously classified as investment income from controlled investments was reclassified to investment income from non-controlled/non-affiliated investments.
The significant accounting policies consistently followed by Apollo Investment are:
(a) Security transactions are accounted for on the trade date;
(b) Under procedures established by our board of directors, we value investments, including certain secured debt, unsecured debt and other debt securities with maturities greater than 60 days, for which market quotations are readily available, at such market quotations (unless they are deemed not to represent fair value). We attempt to obtain market quotations from at least two brokers or dealers (if available, otherwise from a principal market maker or a primary market dealer or other independent pricing service). We utilize mid-market pricing as a practical expedient for fair value unless a different point within the range
76
Table of Contents
APOLLO INVESTMENT CORPORATION
NOTES TO FINANCIAL STATEMENTS (continued)
(in thousands except share and per share amounts)
is more representative. If and when market quotations are deemed not to represent fair value, we typically utilize independent third party valuation firms to assist us in determining fair value. Accordingly, such investments go through our multi-step valuation process as described below. In each case, our independent valuation firms consider observable market inputs together with significant unobservable inputs in arriving at their valuation recommendations for such Level 3 categorized assets. Debt investments with remaining maturities of 60 days or less shall each be valued at cost with interest accrued or discount amortized to the date of maturity, unless such valuation, in the judgment of our investment adviser, does not represent fair value, in which case such investments shall be valued at fair value as determined in good faith by or under the direction of our board of directors. Investments that are not publicly traded or whose market quotations are not readily available are valued at fair value as determined in good faith by or under the direction of our board of directors. Such determination of fair values may involve subjective judgments and estimates.
With respect to investments for which market quotations are not readily available or when such market quotations are deemed not to represent fair value, our board of directors has approved a multi-step valuation process each quarter, as described below:
(1) our quarterly valuation process begins with each portfolio company or investment being initially valued by the investment professionals of our investment adviser responsible for the portfolio investment;
(2) preliminary valuation conclusions are then documented and discussed with senior management of our investment adviser;
(3) independent valuation firms are engaged by our board of directors to conduct independent appraisals by reviewing our investment adviser’s preliminary valuations and then making their own independent assessment;
(4) the audit committee of the board of directors reviews the preliminary valuation of our investment adviser and the valuation prepared by the independent valuation firm and responds to the valuation recommendation of the independent valuation firm to reflect any comments; and
(5) the board of directors discusses valuations and determines the fair value of each investment in our portfolio in good faith based on the input of our investment adviser, the respective independent valuation firm, third party pricing services and the audit committee.
Investments in all asset classes are valued utilizing a market approach, an income approach, or both approaches, as appropriate. The market approach uses prices and other relevant information generated by market transactions involving identical or comparable assets or liabilities (including a business). The income approach uses valuation techniques to convert future amounts (for example, cash flows or earnings) to a single present amount (discounted). The measurement is based on the value indicated by current market expectations about those future amounts. In following these approaches, the types of factors that we may take into account in fair value pricing our investments include, as relevant: available current market data, including relevant and applicable market trading and transaction comparables, applicable market yields and multiples, security covenants, call protection provisions, information rights, the nature and realizable value of any collateral, the portfolio company’s ability to make payments, its earnings and discounted cash flows, the markets in which the portfolio company does business, comparisons of financial ratios of peer companies that are public, M&A comparables, our principal market (as the reporting entity) and enterprise values, among other factors. When readily available, broker quotations and/or quotations provided by pricing services are considered as an input in the valuation process. For the fiscal year ended March 31, 2013, there has been no change to the Company’s valuation techniques and related inputs considered in the valuation process.
77
Table of Contents
APOLLO INVESTMENT CORPORATION
NOTES TO FINANCIAL STATEMENTS (continued)
(in thousands except share and per share amounts)
Accounting Standards Codification (“ASC”) 820 classifies the inputs used to measure these fair values into the following hierarchy:
Level 1: Quoted prices in active markets for identical assets or liabilities, accessible by the Company at the measurement date.
Level 2: Quoted prices for similar assets or liabilities in active markets, or quoted prices for identical or similar assets or liabilities in markets that are not active, or other observable inputs other than quoted prices.
Level 3: Unobservable inputs for the asset or liability.
In all cases, the level in the fair value hierarchy within which the fair value measurement in its entirety falls has been determined based on the lowest level of input that is significant to the fair value measurement. Our assessment of the significance of a particular input to the fair value measurement in its entirety requires judgment and considers factors specific to each investment.
(c) Gains or losses on investments are calculated by using the specific identification method.
(d) The Company records interest and dividend income, adjusted for amortization of premium and accretion of discount, on an accrual basis. Some of our loans and other investments, including certain preferred equity investments, may have contractual payment-in-kind (“PIK”) interest or dividends. PIK interest and dividends computed at the contractual rate are accrued into income and reflected as receivable up to the capitalization date. PIK investments offer issuers the option at each payment date of making payments in cash or in additional securities. When additional securities are received, they typically have the same terms, including maturity dates and interest rates as the original securities issued. On these payment dates, the Company capitalizes the accrued interest or dividends receivable (reflecting such amounts as the basis in the additional securities received). PIK generally becomes due at maturity of the investment or upon the investment being called by the issuer. At the point the Company believes PIK is not expected to be realized, the PIK investment will be placed on non-accrual status. When a PIK investment is placed on non-accrual status, the accrued, uncapitalized interest or dividends are reversed from the related receivable through interest or dividend income, respectively. The Company does not reverse previously capitalized PIK interest or dividends. Upon capitalization, PIK is subject to the fair value estimates associated with their related investments. PIK investments on non-accrual status are restored to accrual status if the Company believes that PIK is expected to be realized. For the fiscal year ended March 31, 2013, accrued PIK totaled $20,292, on total investment income of $331,994. Loan origination fees, original issue discount, and market discounts are capitalized and amortized into income using the interest method or straight-line, as applicable. Upon the prepayment of a loan, any unamortized loan origination fees are recorded as interest income. We record prepayment premiums on loans and other investments as interest income when we receive such amounts. Structuring fees are recorded as other income when earned. Investments that are expected to pay regularly scheduled interest and/or dividends in cash are generally placed on non-accrual status when principal or interest/dividend cash payments are past due 30 days or more and/or when it is no longer probable that principal or interest/dividend cash payments will be collected. Such non-accrual investments are restored to accrual status if past due principal and interest or dividends are paid in cash, and in management’s judgment, are likely to continue timely payment of their remaining interest or dividend obligations. Interest or dividend cash payments received on non-accrual designated investments may be recognized as income or applied to principal depending upon management’s judgment.
(e) The Company intends to comply with the applicable provisions of the Code pertaining to regulated investment companies to make distributions of taxable income sufficient to relieve it of substantially all Federal income taxes. The Company, at its discretion, may carry forward taxable income in excess of calendar year distributions and pay a 4% excise tax on this income. The Company will accrue excise tax on estimated excess taxable income, if any, as required.
78
Table of Contents
APOLLO INVESTMENT CORPORATION
NOTES TO FINANCIAL STATEMENTS (continued)
(in thousands except share and per share amounts)
(f) Book and tax basis differences relating to stockholder dividends and distributions and other permanent book and tax differences are reclassified among the Company’s capital accounts. In addition, the character of income and gains to be distributed is determined in accordance with income tax regulations that may differ from accounting principles generally accepted in the United States of America; accordingly, at March 31, 2013, $17,019 was reclassified on our statement of asset and liabilities between accumulated net realized loss and over-distributed net investment income and $2,684 was reclassified between accumulated over-distributed net investment income and paid-in capital in excess of par. Total earnings and net asset value are not affected.
(g) Dividends and distributions to common stockholders are recorded as of the record date. The amount to be paid out as a dividend is determined by the board of directors each quarter. Net realized capital gains, if any, are generally distributed or deemed distributed at least annually.
(h) Securities that have been called by the issuer are recorded at the call price on the call effective date.
(i) In accordance with Regulation S-X, the Company generally will not consolidate its interest in any company other than in investment company subsidiaries and controlled operating companies substantially all of whose business consists of providing services to the Company. Consequently, the Company has not consolidated special purpose entities through which the special purpose entity acquired and holds investments subject to financing with third parties. At March 31, 2013, the Company did not have any subsidiaries or controlled operating companies that were consolidated. See additional information within note 6.
(j) The accounting records of the Company are maintained in U.S. dollars. All assets and liabilities denominated in foreign currencies are translated into U.S. dollars based on the rate of exchange of such currencies against U.S. dollars on the date of valuation. The Company does not isolate that portion of the results of operations resulting from changes in foreign exchange rates on investments from the fluctuations arising from changes in market prices of securities held. Such fluctuations are included with the net realized gains or losses and unrealized depreciation or appreciation from investments. The Company’s investments in foreign securities may involve certain risks, including without limitation: foreign exchange restrictions, expropriation, taxation or other political, social or economic risks, all of which could affect the market and/or credit risk of the investment. In addition, changes in the relationship of foreign currencies to the U.S. dollar can significantly affect the value of these investments and therefore the earnings of the Company.
(k) The Company may enter into forward exchange contracts in order to hedge against foreign currency risk. These contracts are marked-to-market by recognizing the difference between the contract exchange rate and the current market rate as unrealized appreciation or depreciation. Realized gains or losses are recognized when contracts are settled.
(l) The Company records origination and other expenses related to its debt obligations as deferred financing costs in the Statement of Assets and Liabilities. These expenses are deferred and amortized using the straight-line method over the stated life of the obligation which closely approximates the effective yield method.
(m) The Company records expenses related to shelf filings and applicable offering costs as deferred financing costs in the Statement of Assets and Liabilities. These expenses are charged as a reduction of capital upon utilization, in accordance with the ASC 946-20-25.
(n) The Company defines cash equivalents as securities that are readily convertible into known amounts of cash and so near their maturity that they present insignificant risk of changes in value because of changes in interest rates. Generally, only securities with a maturity of three months or less from the date of purchase would qualify, with limited exceptions. The Company deems that certain U.S. Treasury bills, repurchase agreements and other high-quality, short-term debt securities would qualify as cash equivalents.
79
Table of Contents
APOLLO INVESTMENT CORPORATION
NOTES TO FINANCIAL STATEMENTS (continued)
(in thousands except share and per share amounts)
Recent Accounting Pronouncements
In December 2011, the FASB issued guidance to enhance disclosures about financial instruments and derivative instruments that are either (1) offset or (2) subject to an enforceable master netting arrangement or similar agreement, irrespective of whether they are offset. Under the amended guidance, an entity is required to disclose quantitative information relating to recognized assets and liabilities that are offset or subject to an enforceable master netting arrangement or similar agreement, including the gross amounts of those recognized assets and liabilities, the amounts offset to determine the net amount presented in the statement of financial position, and the net amount presented in the statement of financial position. With respect to amounts subject to an enforceable master netting arrangement or similar agreement which are not offset, disclosure is required of the amounts related to recognized financial instruments and other derivative instruments, the amount related to financial collateral (including cash collateral), and the overall net amount after considering amounts that have not been offset. The guidance is effective for annual reporting periods beginning on or after January 1, 2013 and interim periods within those annual periods and retrospective application is required. As the amendments are limited to disclosure only, the adoption of this guidance is not expected to have a material impact on the financial statements of the Company.
In January 2013, the FASB issued an update which includes amendments to clarify that the scope of FASB Accounting Standards Update 2011-11 applies to derivatives, including bifurcated embedded derivatives, repurchase agreements and reverse repurchase agreements, and securities borrowing and securities lending transactions that are either offset or subject to an enforceable master netting arrangement or similar agreement. For both public and non-public entities that have derivatives accounted for under Topic 815 Derivatives and Hedging, the amendments are effective for fiscal years beginning on or after January 1, 2013, and interim periods within those annual periods. An entity should provide the required disclosures retrospectively for all comparative periods presented. The adoption of this guidance is not expected to have a material impact on the Company’s financial statements.
Note 3. Agreements
The Company has an Investment Advisory and Management Agreement (the “Investment Advisory Agreement”) with Apollo Investment Management, L.P. (the “Investment Adviser” or “AIM”), under which the Investment Adviser, subject to the overall supervision of our board of directors, manages the day-to-day operations of, and provides investment advisory services to the Company. For providing these services, the Investment Adviser receives a fee from the Company, consisting of two components — a base management fee and a performance-based incentive fee. The base management fee is determined by taking the average value of our gross assets, net of payable for investments and cash equivalents purchased at the end of the two most recently completed calendar quarters calculated at an annual rate of 2.00%. The incentive fee has two parts, as follows: one part is calculated and payable quarterly in arrears based on our pre-incentive fee net investment income for the immediately preceding calendar quarter. For this purpose, pre-incentive fee net investment income means interest income, dividend income and any other income including any other fees (other than fees for providing managerial assistance), such as commitment, origination, structuring, diligence and consulting fees or other fees that we receive from portfolio companies accrued during the calendar quarter, minus our operating expenses for the quarter (including the base management fee, any expenses payable under an administration agreement (the “Administration Agreement”) between the Company and Apollo Investment Administration, LLC (the “Administrator”), and any interest expense and dividends paid on any issued and outstanding preferred stock, but excluding the incentive fee). Pre-incentive fee net investment income does not include any realized capital gains computed net of all realized capital losses and unrealized capital depreciation. Pre-incentive fee net investment income, expressed as a rate of return on the value of our net assets at the end of the immediately preceding
80
Table of Contents
APOLLO INVESTMENT CORPORATION
NOTES TO FINANCIAL STATEMENTS (continued)
(in thousands except share and per share amounts)
calendar quarter, is compared to the rate of 1.75% per quarter (7% annualized). Our net investment income used to calculate this part of the incentive fee is also included in the amount of our gross assets used to calculate the 2% base management fee. For the time period between April 2, 2012 and March 31, 2014, AIM has agreed to voluntarily waive the management fee and incentive fee on the proceeds of the April 2, 2012 common equity issuance. For the fiscal year ended March 31, 2013, total management fees waived were $1,602. For the fiscal year ended March 31, 2013, total incentive fees waived were $1,183.
The Company pays the Investment Adviser an incentive fee with respect to our pre-incentive fee net investment income in each calendar quarter as follows: (1) no incentive fee in any calendar quarter in which our pre-incentive fee net investment income does not exceed 1.75%, which we commonly refer to as the performance threshold; (2) 100% of our pre-incentive fee net investment income with respect to that portion of such pre-incentive fee net investment income, if any, that exceeds 1.75% but does not exceed 2.1875% in any calendar quarter; and (3) 20% of the amount of our pre-incentive fee net investment income, if any, that exceeds 2.1875% in any calendar quarter. These calculations are appropriately pro rated for any period of less than three months. The effect of the fee calculation described above is that if pre-incentive fee net investment income is equal to or exceeds 2.1875%, the Investment Adviser will receive a fee of 20% of our pre-incentive fee net investment income for the quarter. The second part of the incentive fee is determined and payable in arrears as of the end of each calendar year (or upon termination of the Investment Advisory Agreement, as of the termination date) and will equal 20% of our cumulative realized capital gains less cumulative realized capital losses, unrealized capital depreciation (unrealized depreciation on a gross investment-by-investment basis at the end of each calendar year) and all capital gains upon which prior performance-based capital gains incentive fee payments were previously made to the Investment Adviser. For accounting purposes only, we are required under GAAP to accrue a theoretical capital gains incentive fee based upon net realized capital gains and unrealized capital appreciation and depreciation on investments held at the end of each period.
The accrual of this theoretical capital gains incentive fee assumes all unrealized capital appreciation and depreciation is realized in order to reflect a theoretical capital gains incentive fee that would be payable to the Investment Adviser at each measurement date. There was no such fee for the fiscal years ended March 31, 2013, 2012 and 2011. It should be noted that a fee so calculated and accrued would not be payable under the Investment Advisers Act of 1940 (“Advisers Act”) or the Investment Advisory Agreement, and would not be paid based upon such computation of capital gains incentive fees in subsequent periods. Amounts actually paid to the Investment Adviser will be consistent with the Advisers Act and formula reflected in the Investment Advisory Agreement which specifically excludes consideration of unrealized capital appreciation.
For the fiscal years ended March 31, 2013, 2012 and 2011, the Company recognized $54,115, $60,321 and $59,831, respectively, in base management fees and $39,961, $39,651 and $47,793, respectively, in performance-based incentive fees. The fees for the fiscal year ended March 31, 2012 reflect a reduction due to a prior payment of an unearned portion of the fees to the Investment Adviser of $2,783, respectively.
For the time period between April 1, 2013 and March 31, 2014, AIM will not be paid the portion of the incentive fee that is attributable to deferred interest, such as PIK, until the Company receives such interest in cash. The accrual of incentive fees shall be reversed if such interest is reversed in connection with any write off or similar treatment of the investment. Upon payment of the deferred incentive fee, AIM will also receive interest on the deferred interest for the period between the date in which the incentive fee is earned and the date of payment. The amount of the deferred fees for the fiscal year ended March 31, 2013 is $3,935.
The Company has also entered into an Administration Agreement with the Administrator under which the Administrator provides administrative services for the Company. For providing these services, facilities and
81
Table of Contents
APOLLO INVESTMENT CORPORATION
NOTES TO FINANCIAL STATEMENTS (continued)
(in thousands except share and per share amounts)
personnel, the Company reimburses the Administrator for the allocable portion of overhead and other expenses incurred by the Administrator and requested to be reimbursed in performing its obligations under the Administration Agreement, including rent and the Company’s allocable portion of its chief financial officer and chief compliance officer and their respective staffs. The Administrator will also provide, on our behalf, managerial assistance to those portfolio companies to which the Company is required to provide such assistance. For the fiscal years ended March 31, 2013, 2012 and 2011 the Company recognized expenses under the Administration Agreement of $4,389, $5,387 and $5,529, respectively.
Note 4. Net Asset Value Per Share
At March 31, 2013, the Company’s net assets and net asset value per share were $1,677,389 and $8.27, respectively. This compares to net assets and net asset value per share at March 31, 2012 of $1,685,231 and $8.55, respectively.
Note 5. Earnings (Loss) Per Share
The following table sets forth the computation of basic and diluted earnings (loss) per share, pursuant to ASC 260-10, for the years ended March 31, 2013, 2012 and 2011, respectively:
| Year Ended March 31, | ||||||||||||
| 2013 | 2012 | 2011 | ||||||||||
| Earnings per share — basic Numerator for increase (decrease) in net assets per share: |
$ | 104,471 | $ | (86,264 | ) | $ | 180,412 | |||||
| Denominator for basic weighted average shares: |
202,875,329 | 196,583,804 | 193,192,475 | |||||||||
| Basic earnings (loss) per share: |
0.51 | (0.44 | ) | 0.93 | ||||||||
| Earnings per share — diluted Numerator for increase (decrease) in net assets per share: |
$ | 104,471 | $ | (86,264 | ) | $ | 180,412 | |||||
| Adjustment for interest on convertible notes and for incentive fees, net |
10,308 | 10,302 | 1,883 | |||||||||
|
|
|
|
|
|
|
|||||||
| Numerator for increase (decrease) in net assets per share, as adjusted |
$ | 114,779 | $ | (75,962 | ) | $ | 182,295 | |||||
| Denominator for weighted average shares, as adjusted for dilutive effect of convertible notes: |
217,423,429 | 211,131,904 | 195,823,090 | |||||||||
| Diluted earnings (loss) per share*: |
0.51 | * | (0.44 | )* | 0.93 | |||||||
| * | In applying the if-converted method, conversion shall not be assumed for purposes of computing diluted EPS if the effect would be anti-dilutive. For the fiscal year ended March 31, 2013 and March 31, 2012, anti-dilution would total $0.02 and $0.08, respectively. |
Note 6. Investments
AIC Credit Opportunity Fund LLC — We own all of the common member interests in AIC Credit Opportunity Fund LLC (“AIC Holdco”). AIC Holdco was formed for the purpose of holding various financed investments. AIC Holdco wholly owns three special purpose entities, each of which in 2008 acquired directly or indirectly an investment in a particular security from an unaffiliated entity that provided leverage for the investment as part of the sale. Each of these transactions is described in more detail below together with summary financial information.
82
Table of Contents
APOLLO INVESTMENT CORPORATION
NOTES TO FINANCIAL STATEMENTS (continued)
(in thousands except share and per share amounts)
In the first of these investments, in June 2008 we invested through AIC Holdco $39,500 in AIC (FDC) Holdings LLC (“Apollo FDC”). Apollo FDC used the proceeds to purchase a Junior Profit-Participating Note due 2013 in principal amount of $39,500 (the “Junior Note”) issued by Apollo I Trust (the “Trust”). The Trust also issued a Senior Floating Rate Note due 2013 (the “Senior Note”) to an unaffiliated third party in principal amount of $39,500 paying interest at the London Interbank Offered Rate (“LIBOR”) plus 1.50%, increasing over time to LIBOR plus 2.0%. The Trust used the aggregate $79,000 proceeds to acquire $100,000 face value of a senior subordinated loan of First Data Corporation (the “FDC Loan”) due 2016. The FDC Loan pays interest at 11.25% per year. The Junior Note of the Trust owned by Apollo FDC pays to Apollo FDC all of the interest and other proceeds received by the Trust on the FDC Loan after satisfying the Trust’s obligations on the Senior Note. The holder of the Senior Note has no recourse to Apollo FDC, AIC Holdco or us with respect to any interest on, or principal of, the Senior Note. However, if the value of the FDC Loan held by the Trust declines sufficiently, the investment would be unwound unless Apollo FDC posts additional collateral for the benefit of the Senior Note. Consequently, the maximum exposure on this investment is the amount of our investment in the Junior Note and any additional collateral we determine to post. During the fiscal year ended March 31, 2012, the Trust sold $47,145 face value of the FDC Loan. As a result of this transaction, as of March 31, 2013, the FDC Loan par balance outstanding is $52,855, the Junior Note balance is $21,472 and the Senior Note balance is $20,283.
In the second of these investments, in June 2008 we invested through AIC Holdco $11,375 in AIC (TXU) Holdings LLC (“Apollo TXU”). Apollo TXU acquired exposure to $50,000 notional amount of a LIBOR plus 3.5% senior secured delayed draw term loan of Texas Competitive Electric Holdings (“TXU”) due 2014 through a non-recourse total return swap (the “TRS”) with an unaffiliated third party expiring on October 10, 2013. Pursuant to such delayed draw term loan, Apollo TXU pays an unaffiliated third-party interest at LIBOR plus 1.5% and generally receives all proceeds due under the delayed draw term loan of TXU (the “TXU Term Loan”). Like Apollo FDC, Apollo TXU is entitled to 100% of any realized appreciation in the TXU Term Loan and, since the TRS is a non-recourse arrangement, Apollo TXU is exposed only up to the amount of its investment in the TRS, plus any additional margin we decide to post, if any, during the term of the financing. The TRS does not constitute a senior security or a borrowing of Apollo TXU. In connection with the amendment and extension of the TXU Term Loan in April 2011, for which Apollo TXU received a consent fee along with an increase in the rate of the TXU Term Loan to LIBOR plus 4.5%, Apollo TXU extended its TRS to 2016 at a rate of LIBOR plus 2.0%. As of March 31, 2013, Apollo TXU’s notional exposure to the TXU term loan is $47,471.
In the third of these investments, in September 2008 we invested through AIC Holdco $10,022 in AIC (Boots) Holdings, LLC (“Apollo Boots”). Apollo Boots acquired €23,383 and £12,465 principal amount of senior term loans of AB Acquisitions Topco 2 Limited, a holding company for the Alliance Boots group of companies (the “Boots Term Loans”), out of the proceeds of our investment and a multicurrency $40,876 equivalent non-recourse loan to Apollo Boots (the “Acquisition Loan”) by an unaffiliated third party that was scheduled to mature in September 2013 and paid interest at LIBOR plus 1.25% or, in certain cases, the higher of the Federal Funds Rate plus 0.50% or the lender’s prime-rate. The Boots Term Loans paid interest at the rate of LIBOR plus 3% per year and are scheduled to mature in June 2015. During the fiscal year ended March 31, 2013, Apollo Boots sold the entire position of the Boots Term Loans in the amount of €23,383 and £12,465 of principal. At March 31, 2013, there was no outstanding principal balance of the Boots Term Loans.
We do not consolidate AIC Holdco or its wholly owned subsidiaries and accordingly only the value of our investment in AIC Holdco is included on our statement of assets and liabilities. Our investment in AIC Holdco is valued in accordance with our normal valuation procedures and is based on the values of the underlying assets held by each of Apollo FDC, Apollo TXU and Apollo Boots net of associated liabilities.
83
Table of Contents
APOLLO INVESTMENT CORPORATION
NOTES TO FINANCIAL STATEMENTS (continued)
(in thousands except share and per share amounts)
The Senior Note, TRS and Acquisition Loan are non-recourse to AIC Holdco, its subsidiaries and us and have standard events of default including failure to pay contractual amounts when due and failure by each of the underlying Apollo special purpose entities to provide additional credit support, sell assets or prepay a portion of its obligations if the value of the FDC Term Loan, the TXU Term Loan or the Boots Term Loans, as applicable, declines below specified levels. We may unwind any of these transactions at any time without penalty. From time to time we may provide additional capital to AIC Holdco for purposes of reserving for or funding margin calls under one or more of the transactions described above among other reasons. During the fiscal year ended March 31, 2011, $1,700 of net capital was provided to AIC Holdco. During the fiscal year ended March 31, 2012, $8,712 of net capital was returned to us from AIC Holdco. During the fiscal year ended March 31, 2013, $17,891 of net capital was returned to us from AIC Holdco. The Junior Note and TRS were performing assets as of the date of these financial statements.
Below is summarized financial information for AIC Holdco for the fiscal years ended March 31, 2013 and March 31, 2012.
| March 31, 2013 | March 31, 2012 | |||||||
| Assets |
||||||||
| Cash |
$ | 10 | $ | 15 | ||||
| Apollo FDC(1) |
32,981 | 27,947 | ||||||
| Apollo TXU(2) |
26,641 | 26,066 | ||||||
| Apollo Boots(3) |
— | 47,999 | ||||||
| Other Assets |
2,702 | 2,886 | ||||||
|
|
|
|
|
|||||
| Total Assets |
$ | 62,334 | $ | 104,913 | ||||
|
|
|
|
|
|||||
| Liabilities |
||||||||
| Apollo FDC(4) |
$ | — | $ | — | ||||
| Apollo TXU(5) |
8,936 | 16,045 | ||||||
| Apollo Boots(6) |
— | 29,948 | ||||||
| Other Liabilities |
2,702 | 2,886 | ||||||
|
|
|
|
|
|||||
| Total Liabilities |
$ | 11,638 | $ | 48,879 | ||||
|
|
|
|
|
|||||
| Net Assets |
||||||||
| Apollo FDC |
$ | 32,981 | $ | 27,947 | ||||
| Apollo TXU |
17,705 | 10,021 | ||||||
| Apollo Boots |
— | 18,051 | ||||||
| Cash and Other |
10 | 15 | ||||||
|
|
|
|
|
|||||
| Total Net Assets |
$ | 50,696 | $ | 56,034 | ||||
|
|
|
|
|
|||||
| Fiscal Year End March 31, 2013 |
Fiscal Year End March 31, 2012 |
|||||||
| Net Operating Income (Loss) |
||||||||
| Apollo FDC(7) |
$ | 5,388 | $ | 9,412 | ||||
| Apollo TXU(7) |
1,237 | 2,809 | ||||||
| Apollo Boots(7) |
745 | 1,243 | ||||||
| Other |
(5 | ) | (26 | ) | ||||
|
|
|
|
|
|||||
| Total Operating Income |
$ | 7,365 | $ | 13,438 | ||||
|
|
|
|
|
|||||
84
Table of Contents
APOLLO INVESTMENT CORPORATION
NOTES TO FINANCIAL STATEMENTS (continued)
(in thousands except share and per share amounts)
| Fiscal Year End March 31, 2013 |
Fiscal Year End March 31, 2012 |
|||||||
| Net Realized Gain (Loss) |
||||||||
| Apollo FDC |
$ | — | $ | 2,862 | ||||
| Apollo Boots |
659 | — | ||||||
|
|
|
|
|
|||||
| Total Net Realized Gain (Loss) |
$ | 659 | $ | 2,862 | ||||
|
|
|
|
|
|||||
| Net Change in Unrealized Appreciation/Depreciation |
||||||||
| Apollo FDC |
$ | 5,034 | $ | (14,484 | ) | |||
| Apollo TXU |
7,110 | (13,126 | ) | |||||
| Apollo Boots |
(244 | ) | (2,852 | ) | ||||
|
|
|
|
|
|||||
| Total Net Change in Unrealized Appreciation/Depreciation |
$ | 11,900 | $ | (30,462 | ) | |||
|
|
|
|
|
|||||
| Net Income (Loss)(8) |
||||||||
| Apollo FDC |
$ | 10,422 | $ | (2,210 | ) | |||
| Apollo TXU |
8,347 | (10,317 | ) | |||||
| Apollo Boots |
1,160 | (1,609 | ) | |||||
| Other |
(5 | ) | (26 | ) | ||||
|
|
|
|
|
|||||
| Total Net Income (Loss) |
$ | 19,924 | $ | (14,162 | ) | |||
|
|
|
|
|
|||||
| (1) | Includes fair value of the Junior Note held by Apollo FDC. Cost: $21,472 and $21,472, at March 31, 2013 and March 31, 2012, respectively. |
| (2) | Represents fair value of collateral posted in relation to the TRS held by Apollo TXU. Cost: $26,641 and $26,066, at March 31, 2013 and March 31, 2012, respectively. |
| (3) | Represents fair value of the Boots Term Loans held by Apollo Boots and fair value of receivable for Boots Term Loans sold during the period. Cost of outstanding par was $50,109 at March 31, 2012. There was no outstanding principal balance of the Boots Term loans at March 31, 2013. |
| (4) | Apollo FDC’s interest in the Trust is subject to a senior note of a separate entity of $20,283 and $20,283 at March 31, 2013 and March 31, 2012, respectively; however, Apollo FDC has no liability for such senior note. |
| (5) | Represents liability on the TRS held by Apollo TXU. |
| (6) | Represents liability of Apollo Boots on the Acquisition Loan. |
| (7) | In the case of Apollo FDC, net operating income consists of interest income on the Junior Note less interest paid on the senior note together with immaterial administrative expenses. In the case of Apollo TXU, net operating income consists of net payments from (to) the swap counterparty of Apollo TXU’s obligation to pay interest and its right to receive the proceeds in respect of the reference asset, together with immaterial administrative expenses. In the case of AIC Boots, net operating income consists of interest income on the Boots Term Loans, less interest payments on the Acquisition Loan together with immaterial administrative expenses. There are no management or incentive fees. |
| (8) | Net income is the sum of operating income, realized gain (loss) and net change in unrealized appreciation/ deprecation. |
85
Table of Contents
APOLLO INVESTMENT CORPORATION
NOTES TO FINANCIAL STATEMENTS (continued)
(in thousands except share and per share amounts)
Investments for the Company
Investments for the Company consisted of the following as of March 31, 2013 and March 31, 2012.
| March 31, 2013 | March 31, 2012 | |||||||||||||||
| Cost | Fair Value | Cost | Fair Value | |||||||||||||
| Secured Debt |
$ | 1,334,690 | $ | 1,260,881 | $ | 916,032 | $ | 864,485 | ||||||||
| Unsecured Debt |
1,261,687 | 1,220,120 | 1,595,507 | 1,520,152 | ||||||||||||
| Structured Products |
179,475 | 185,995 | 70,138 | 63,725 | ||||||||||||
| Preferred Equity |
40,221 | 11,550 | 37,954 | 34,648 | ||||||||||||
| Common Equity/Interests |
200,518 | 162,580 | 229,854 | 184,341 | ||||||||||||
| Warrants |
2,710 | 9,273 | 2,099 | 9,729 | ||||||||||||
|
|
|
|
|
|
|
|
|
|||||||||
| Total Investments |
$ | 3,019,301 | $ | 2,850,399 | $ | 2,851,584 | $ | 2,677,080 | ||||||||
|
|
|
|
|
|
|
|
|
|||||||||
At March 31, 2013, our investments were categorized as follows in the fair value hierarchy for ASC 820 purposes:
| Fair Value Measurement at Reporting Date Using: | ||||||||||||||||
| Description |
March 31, 2013 |
Quoted Prices in Active Markets for Identical Assets (Level 1) |
Significant Other Observable Inputs (Level 2) |
Significant Unobservable Inputs (Level 3) |
||||||||||||
| Secured Debt |
$ | 1,260,881 | $ | — | $ | 620,072 | $ | 640,809 | ||||||||
| Unsecured Debt |
1,220,120 | — | 589,073 | 631,047 | ||||||||||||
| Structured Products |
185,995 | — | — | 185,995 | ||||||||||||
| Preferred Equity |
11,550 | — | — | 11,550 | ||||||||||||
| Common Equity/Interests |
162,580 | — | — | 162,580 | ||||||||||||
| Warrants |
9,273 | — | — | 9,273 | ||||||||||||
|
|
|
|
|
|
|
|
|
|||||||||
| Total Investments |
$ | 2,850,399 | $ | — | $ | 1,209,145 | $ | 1,641,254 | ||||||||
|
|
|
|
|
|
|
|
|
|||||||||
At March 31, 2012, our investments were categorized as follows in the fair value hierarchy for ASC 820 purposes:
| Fair Value Measurement at Reporting Date Using: | ||||||||||||||||
| Description |
March 31, 2012 |
Quoted Prices in Active Markets for Identical Assets (Level 1) |
Significant Other Observable Inputs (Level 2) |
Significant Unobservable Inputs (Level 3) |
||||||||||||
| Secured Debt |
$ | 864,485 | $ | — | $ | — | $ | 864,485 | ||||||||
| Unsecured Debt |
1,520,152 | — | — | 1,520,152 | ||||||||||||
| Structured Products |
63,725 | — | — | 63,725 | ||||||||||||
| Preferred Equity |
34,648 | — | — | 34,648 | ||||||||||||
| Common Equity/Interests |
184,341 | — | — | 184,341 | ||||||||||||
| Warrants |
9,729 | — | — | 9,729 | ||||||||||||
|
|
|
|
|
|
|
|
|
|||||||||
| Total Investments |
$ | 2,677,080 | $ | — | $ | — | $ | 2,677,080 | ||||||||
|
|
|
|
|
|
|
|
|
|||||||||
86
Table of Contents
APOLLO INVESTMENT CORPORATION
NOTES TO FINANCIAL STATEMENTS (continued)
(in thousands except share and per share amounts)
The following chart shows the components of change in our investments categorized as Level 3, for the fiscal year ended March 31, 2013.
| Fair Value Measurements Using Significant Unobservable Inputs (Level 3)* | ||||||||||||||||||||||||||||
| Secured Debt | Unsecured Debt |
Structured Products |
Preferred Equity |
Common Equity/Interests |
Warrants | Total | ||||||||||||||||||||||
| Beginning Balance, March 31, 2012 |
$ | 864,485 | $ | 1,520,152 | $ | 63,725 | $ | 34,648 | $ | 184,341 | $ | 9,729 | $ | 2,677,080 | ||||||||||||||
| Total realized gains (losses) included in earnings |
(29,936 | ) | (11,464 | ) | 2,965 | — | (42,639 | ) | 5,384 | (75,690 | ) | |||||||||||||||||
| Total change in unrealized depreciation / appreciation included in earnings |
(22,776 | ) | 33,653 | 12,923 | (25,366 | ) | 7,575 | (1,067 | ) | 4,942 | ||||||||||||||||||
| Net amortization on investments |
9,981 | 15,183 | 318 | 97 | — | — | 25,579 | |||||||||||||||||||||
| Purchases, including capitalized PIK |
883,188 | 482,818 | 126,249 | 2,171 | 33,958 | 852 | 1,529,236 | |||||||||||||||||||||
| Sales |
(455,911 | ) | (830,372 | ) | (20,185 | ) | — | (25,338 | ) | (5,625 | ) | (1,337,431 | ) | |||||||||||||||
| Transfers(1) |
(608,222 | ) | (578,923 | ) | — | — | 4,683 | — | (1,182,462 | ) | ||||||||||||||||||
|
|
|
|
|
|
|
|
|
|
|
|
|
|
|
|||||||||||||||
| Ending Balance, March 31, 2013 |
$ | 640,809 | $ | 631,047 | $ | 185,995 | $ | 11,550 | $ | 162,580 | $ | 9,273 | $ | 1,641,254 | ||||||||||||||
|
|
|
|
|
|
|
|
|
|
|
|
|
|
|
|||||||||||||||
| The amount of total gains or losses for the period included in earnings attributable to the change in unrealized depreciation / appreciation relating to our Level 3 assets still held at the reporting date and reported within the net change in unrealized depreciation / appreciation on investments in our Statement of Operations. |
$ | (11,447 | ) | $ | (5,898 | ) | $ | 12,934 | $ | (25,366 | ) | $ | (31,426 | ) | $ | 542 | $ | (60,661 | ) | |||||||||
|
|
|
|
|
|
|
|
|
|
|
|
|
|
|
|||||||||||||||
| (1) | Transfers represent (a) a transfer of $4,683 out of Secured Debt into Common Equity/Interests due to the restructuring of a portfolio company which altered the securities held by the Company and (b) transfers between level 3 and level 2. Transfers are assumed to have occurred at the end of the period. The measurement was reclassified within the fair value hierarchy due to significant inputs that were previously unobservable which became observable given transactions that were observed around the measurement date. There were no transfers between Level 1 and Level 2 fair value measurements during the period shown. |
| * | Pursuant to fair value measurement and disclosure guidance, the Company currently categorizes investments by class as shown above. |
87
Table of Contents
APOLLO INVESTMENT CORPORATION
NOTES TO FINANCIAL STATEMENTS (continued)
(in thousands except share and per share amounts)
Accumulated PIK income activity for the fiscal year ended March 31, 2013:
| Fiscal Year End March 31, 2013 |
||||
| PIK balance at beginning of period |
$ | 32,963 | ||
| Gross PIK income capitalized |
17,891 | |||
| Adjustments due to investment exits |
— | |||
| PIK income received in cash |
(5,196 | ) | ||
|
|
|
|||
| PIK balance at end of period |
$ | 45,658 | ||
|
|
|
|||
The following chart shows the components of change in our investments categorized as Level 3, for the fiscal year ended March 31, 2012.
| Fair Value Measurements Using Significant Unobservable Inputs (Level 3)* | ||||||||||||||||||||||||||||
| Secured Debt | Unsecured Debt |
Structured Products |
Preferred Equity |
Common Equity/Interests |
Warrants | Total | ||||||||||||||||||||||
| Beginning Balance, March 31, 2011 |
$ | 1,013,745 | $ | 1,730,656 | $ | 28,770 | $ | 33,132 | $ | 227,771 | $ | 16,084 | $ | 3,050,158 | ||||||||||||||
| Total realized gains or losses included in earnings |
3,296 | (88,271 | ) | — | (102,012 | ) | (161,071 | ) | 7,198 | (340,860 | ) | |||||||||||||||||
| Total change in unrealized depreciation/appreciation included in earnings |
(54,105 | ) | (102,966 | ) | (3,439 | ) | 99,207 | 139,469 | (3,933 | ) | 74,233 | |||||||||||||||||
| Net amortization on investments |
3,764 | 13,735 | 1,113 | 194 | — | — | 18,806 | |||||||||||||||||||||
| Purchases, including capitalized PIK |
456,743 | 984,376 | — | 4,406 | 87,125 | — | 1,532,650 | |||||||||||||||||||||
| Sales |
(631,633 | ) | (944,703 | ) | (18,753 | ) | — | (53,198 | ) | (9,620 | ) | (1,657,907 | ) | |||||||||||||||
| Transfer between asset categories within |
72,675 | (72,675 | ) | 56,034 | (279 | ) | (55,755 | ) | — | — | ||||||||||||||||||
|
|
|
|
|
|
|
|
|
|
|
|
|
|
|
|||||||||||||||
| Ending Balance, March 31, 2012 |
$ | 864,485 | $ | 1,520,152 | $ | 63,725 | $ | 34,648 | $ | 184,341 | $ | 9,729 | $ | 2,677,080 | ||||||||||||||
|
|
|
|
|
|
|
|
|
|
|
|
|
|
|
|||||||||||||||
| The amount of total gains or losses for the period included in earnings attributable to the change in unrealized depreciation/appreciation relating to our Level 3 assets still held at the reporting date and reported within the net change in unrealized depreciation/appreciation on investments in our Statement of Operations |
$ | (44,272 | ) | $ | (140,846 | ) | $ | (925 | ) | $ | (2,805 | ) | $ | (28,485 | ) | $ | 1,319 | $ | (216,014 | ) | ||||||||
|
|
|
|
|
|
|
|
|
|
|
|
|
|
|
|||||||||||||||
| (1) | There were also no transfers into or out of Level 1 or Level 2 fair value measurements during the period shown. |
88
Table of Contents
APOLLO INVESTMENT CORPORATION
NOTES TO FINANCIAL STATEMENTS (continued)
(in thousands except share and per share amounts)
The following table provides quantitative information about our Level 3 fair value measurements of our in Accumulated PIK income activity for the fiscal year ended March 31, 2012:
| Fiscal Year End March 31, 2012 |
||||
| PIK balance at beginning of period |
$ | 165,651 | ||
| Gross PIK income capitalized |
14,915 | |||
| Adjustments due to investment exits |
(87,687 | ) | ||
| PIK income received in cash |
(59,916 | ) | ||
|
|
|
|||
| PIK balance at end of period |
$ | 32,963 | ||
|
|
|
|||
The following table summarizes the significant unobservable inputs the Company used to value the majority of its investments categorized within Level 3 as of March 31, 2013. In addition to the techniques and inputs noted in the table below, according to our valuation policy we may also use other valuation techniques and methodologies when determining our fair value measurements. The below table is not intended to be all-inclusive, but rather provides information on the significant unobservable inputs as they relate to the Company’s determination of fair values.
| Quantitative Information about Level 3 Fair Value Measurements | ||||||||||
| Fair Value as of March 31, 2013 |
Valuation Techniques/ Methodologies |
Unobservable |
Range (Weighted Average) | |||||||
| Secured Debt |
$ | 32,952 | Market Comparable Approach |
Comparable Multiple | 6.0x – 6.0x (6.0x) | |||||
| 422,766 | Yield Analysis | Discount Rate | 8.0% - 18.0% (12.1%) | |||||||
| Unsecured Debt |
504,263 | Yield Analysis | Discount Rate | 10.1% - 25.0% (13.8%) | ||||||
| Structured Products |
43,144 | Discounted Cash Flow |
Discount Rate | 13.0% - 13.0% (13.0%) | ||||||
| 6,174 | Recent Transactions | Recent Transactions | n/a | |||||||
| 50,697 | Net Asset Value | Underlying Assets/ Liabilities | n/a | |||||||
|
Preferred Equity |
11,550 | Market Comparable Approach |
Comparable Multiple | 4.3x – 10.4x (6.5x) | ||||||
| Common Equity/Interests
|
33,911 | Discounted Cash Flow |
Discount Rate | 8.0% - 12.5% (12.5%) | ||||||
| 123,081 | Market Comparable Approach |
Comparable Multiple | 2.0x - 10.8x (8.0x) | |||||||
| 123 | Net Asset Value | Underlying Assets/Liabilities | n/a | |||||||
| 146 | Yield Analysis | Discount Rate | 20.0% - 20.0% (20.0%) | |||||||
| 5,319 | Other | Illiquidity/Restrictive discount | 7.0% - 7.0% (7.0%) | |||||||
|
| ||||||||||
89
Table of Contents
APOLLO INVESTMENT CORPORATION
NOTES TO FINANCIAL STATEMENTS (continued)
(in thousands except share and per share amounts)
| Quantitative Information about Level 3 Fair Value Measurements | ||||||||||
| Fair Value as of March 31, 2013 |
Valuation Techniques/ Methodologies |
Unobservable |
Range (Weighted Average) | |||||||
| Warrants |
7,432 | Market Comparable Approach |
Comparable Multiple | 4.3x — 5.9x (5.4x) | ||||||
| 1,841 | Other | Illiquidity/ Restrictive discount | 20.0% - 20.0%(20.0%) | |||||||
|
| ||||||||||
n/a – Not applicable
| Quantitative Information about Level 3 Fair Value Measurements | ||||||||||
| Fair Value as of March 31, 2012 |
Valuation Techniques/ Methodologies |
Unobservable Input |
Range (Weighted Average) | |||||||
| Secured Debt & Structured Products |
$ | 1,517,432 | Broker quoted | Bid-Ask Spread | n/a | |||||
|
| ||||||||||
| Secured Debt & Structured Products |
871,296 | Market Rate Approach |
Market Interest Rate |
7.7% - 16.5% (11.6%) | ||||||
|
| ||||||||||
| Equity(1, 2) |
232,111 | Market Comparable Companies |
EBITDA Multiples |
4.0x - 15.2x (8.5x) | ||||||
|
| ||||||||||
| (1) | Includes $3,600 of certain non-performing debt investments that are valued using equity valuation techniques. |
| (2) | Excludes $56,241 of equity securities that are valued on the basis of the net asset value of their underlying holdings. |
n/a – Not applicable
The significant unobservable inputs used in the fair value measurement of the Company’s debt and equity securities are primarily earnings before interest, taxes, depreciation and amortization (“EBITDA”) comparable multiples and market discount rates. The Company uses EBITDA comparable multiples on its equity securities to determine the fair value of investments. The Company uses market discount rates for debt securities to determine if the effective yield on a debt security is commensurate with the market yields for that type of debt security. If a debt security’s effective yield is significantly less than the market yield for a similar debt security with a similar credit profile, then the resulting fair value of the debt security may be lower. Significant increases or decreases in either of these inputs in isolation would result in a significantly lower or higher fair value measurement. The significant unobservable inputs used in the fair value measurement of the structured products include the discount rate applied in the valuation models in addition to default and recovery rates applied to projected cash flows in the valuation models. Specifically, when a discounted cash flow model is used to determine fair value, the significant input used in the valuation model is the discount rate applied to present value the projected cash flows. Increases in the discount rate can significantly lower the fair value of an investment; conversely decreases in the discount rate can significantly increase the fair value of an investment. The discount rate is determined based on the market rates an investor would expect for a similar investment with similar risks.
90
Table of Contents
APOLLO INVESTMENT CORPORATION
NOTES TO FINANCIAL STATEMENTS (continued)
(in thousands except share and per share amounts)
Note 7. Foreign Currency Transactions and Translations
At March 31, 2013, the Company had outstanding non-US borrowings on its Senior Secured Facility (as defined herein) denominated in Euros and British Pounds. Unrealized appreciation on these outstanding borrowings is indicated in the table below:
| Foreign Currency |
Local Currency |
Original Borrowing Cost |
Current Value |
Reset Date | Unrealized Appreciation (Depreciation) |
|||||||||||||||
| British Pound |
£ | 5,300 | $ | 8,409 | $ | 8,048 | 04/19/2013 | $ | 361 | |||||||||||
| Euro |
€ | 77,000 | 103,544 | 98,876 | 04/30/2013 | 4,668 | ||||||||||||||
| British Pound |
£ | 62,000 | 99,087 | 94,144 | 04/30/2013 | 4,943 | ||||||||||||||
|
|
|
|
|
|
|
|||||||||||||||
| $ | 211,040 | $ | 201,068 | $ | 9,972 | |||||||||||||||
|
|
|
|
|
|
|
|||||||||||||||
At March 31, 2012, the Company had outstanding non-US borrowings on its Senior Secured Facility denominated in Euros and British Pounds. Unrealized appreciation or depreciation on these outstanding borrowings is indicated in the table below:
| Foreign Currency |
Local Currency |
Original Borrowing Cost |
Current Value |
Reset Date | Unrealized Appreciation (Depreciation) |
|||||||||||||||
| British Pound |
£ | 3,000 | $ | 4,791 | $ | 4,793 | 04/10/2012 | $ | (2 | ) | ||||||||||
| Euro |
€ | 5,500 | 7,976 | 7,324 | 04/23/2012 | 652 | ||||||||||||||
| British Pound |
£ | 13,500 | 21,485 | 21,570 | 04/23/2012 | (85 | ) | |||||||||||||
| Euro |
€ | 63,218 | 86,951 | 84,187 | 04/30/2012 | 2,764 | ||||||||||||||
| British Pound |
£ | 63,500 | 101,968 | 101,753 | 04/30/2012 | 215 | ||||||||||||||
|
|
|
|
|
|
|
|||||||||||||||
| $ | 223,171 | $ | 219,627 | $ | 3,544 | |||||||||||||||
|
|
|
|
|
|
|
|||||||||||||||
Note 8. Expense Offset Arrangement
The Company benefits from an expense offset arrangement with JPMorgan Chase Bank, N.A. (“custodian bank”) whereby the Company earns credits on any uninvested US dollar cash balances held by the custodian bank. These credits are applied by the custodian bank as a reduction of the monthly custody fees charged to the Company. There were no credits earned during the years ended March 31, 2013, 2012, and 2011.
Note 9. Cash Equivalents
The Company held cash equivalents during the years ended March 31, 2013 and March 31, 2012. There were no cash equivalents held as of March 31, 2013 and March 31, 2012.
Note 10. Repurchase Agreements
The Company may enter into repurchase agreements as part of its investment program. The Company’s custodian takes possession of collateral pledged by the counterparty. The collateral is marked-to-market daily to ensure that the value, plus accrued interest, is at least equal to the repurchase price. In the event of default of the obligor to repurchase, the Company has the right to liquidate the collateral and apply the proceeds in satisfaction of the obligation. Under certain circumstances, in the event of default or bankruptcy by the counterparty to the agreement, realization and/or retention of the collateral or proceeds may be subject to legal proceedings. There were no repurchase agreements outstanding at March 31, 2013 or March 31, 2012.
91
Table of Contents
APOLLO INVESTMENT CORPORATION
NOTES TO FINANCIAL STATEMENTS (continued)
(in thousands except share and per share amounts)
Note 11. Financial Highlights
The following is a schedule of financial highlights for the years ended March 31, 2013, 2012, 2011, 2010, and 2009:
| Fiscal Year Ended March 31, | ||||||||||||||||||||
| 2013 | 2012 | 2011 | 2010 | 2009 | ||||||||||||||||
| Per Share Data: |
||||||||||||||||||||
| Net asset value, beginning of period |
$ | 8.55 | $ | 10.03 | $ | 10.06 | $ | 9.82 | $ | 15.83 | ||||||||||
|
|
|
|
|
|
|
|
|
|
|
|||||||||||
| Net investment income |
0.83 | *** | 0.88 | 0.99 | 1.26 | 1.48 | ||||||||||||||
| Net realized and unrealized gain (loss) |
(0.31 | )*** | (1.32 | ) | (0.05 | ) | 0.45 | (5.74 | ) | |||||||||||
|
|
|
|
|
|
|
|
|
|
|
|||||||||||
| Net increase (decrease) in net assets resulting from operations |
0.51 | *** | (0.44 | ) | 0.94 | 1.71 | (4.26 | ) | ||||||||||||
| Dividends to stockholders from net investment income(1) |
(0.80 | ) | (1.04 | ) | (1.13 | ) | (1.14 | ) | (1.86 | ) | ||||||||||
| Effect of anti-dilution (dilution) |
— | * | — | * | 0.16 | (0.33 | ) | 0.11 | ||||||||||||
| Offering costs |
— | * | — | * | — | * | — | * | — | * | ||||||||||
|
|
|
|
|
|
|
|
|
|
|
|||||||||||
| Net asset value at end of period |
$ | 8.27 | $ | 8.55 | $ | 10.03 | $ | 10.06 | $ | 9.82 | ||||||||||
|
|
|
|
|
|
|
|
|
|
|
|||||||||||
| Per share market value at end of period |
$ | 8.36 | $ | 7.17 | $ | 12.07 | $ | 12.73 | $ | 3.48 | ||||||||||
|
|
|
|
|
|
|
|
|
|
|
|||||||||||
| Total return(2) |
28.24 | % | (32.4 | )% | 5.1 | % | 313.0 | % | (73.90 | )% | ||||||||||
|
|
|
|
|
|
|
|
|
|
|
|||||||||||
| Shares outstanding at end of period |
202,891,351 | 197,043,398 | 195,501,549 | 176,213,918 | 142,221,335 | |||||||||||||||
|
|
|
|
|
|
|
|
|
|
|
|||||||||||
| Ratio/Supplemental Data: |
||||||||||||||||||||
| Net assets at end of period (in millions) |
$ | 1,677.4 | $ | 1,685.2 | $ | 1,961.0 | $ | 1,772.8 | $ | 1,396.1 | ||||||||||
|
|
|
|
|
|
|
|
|
|
|
|||||||||||
| Ratio of net investment income to average net assets |
9.87 | % | 9.77 | % | 10.19 | % | 12.36 | % | 10.71 | % | ||||||||||
|
|
|
|
|
|
|
|
|
|
|
|||||||||||
| Ratio of operating expenses to average net assets(3) |
6.28 | %** | 6.70 | % | 6.37 | % | 7.21 | % | 6.35 | % | ||||||||||
| Ratio of interest and other debt expenses to average net assets |
3.43 | % | 3.76 | % | 2.56 | % | 1.52 | % | 2.54 | % | ||||||||||
|
|
|
|
|
|
|
|
|
|
|
|||||||||||
| Ratio of total expenses to average net assets(3) |
9.71 | %** | 10.46 | % | 8.93 | % | 8.73 | % | 8.89 | % | ||||||||||
|
|
|
|
|
|
|
|
|
|
|
|||||||||||
| Average debt outstanding |
$ | 1,036,780 | $ | 1,213,943 | $ | 1,072,646 | $ | 1,041,084 | $ | 1,193,809 | ||||||||||
|
|
|
|
|
|
|
|
|
|
|
|||||||||||
| Average debt per share |
$ | 5.11 | $ | 6.18 | $ | 5.55 | $ | 6.53 | $ | 8.56 | ||||||||||
|
|
|
|
|
|
|
|
|
|
|
|||||||||||
| Portfolio turnover ratio |
49.9 | % | 50.6 | % | 33.6 | % | 17.2 | % | 11.2 | % | ||||||||||
|
|
|
|
|
|
|
|
|
|
|
|||||||||||
| (1) | Dividends and distributions are determined based on taxable income calculated in accordance with income tax regulations which may differ from amounts determined under GAAP. Per share amounts reflect total dividends paid divided by average shares for the respective periods. |
| (2) | Total return is based on the change in market price per share during the respective periods. Total return also takes into account dividends and distributions, if any, reinvested in accordance with the Company’s dividend reinvestment plan. |
| (3) | The ratio of operating expenses to average net assets and the ratio of total expenses to average net assets are shown inclusive of the expense offset arrangement (see Note 8). For the years ended March 31, 2013, 2012, 2011, and 2010, there were no credits earned during these periods and as such, there was no effect on the ratio. At March 31, 2009, the ratios were 6.33% and 8.87%, respectively. |
| * | Represents less than one cent per average share. |
| ** | The ratio of operating expenses to average net assets and the ratio of total expenses to average net assets is shown net of all voluntary management and incentive fee waivers (see note 3). The ratio of annualized operating expenses to average net assets and the ratio of annualized total expenses to average net assets would be 6.44% and 9.87%, respectively, without the voluntary fee waivers. |
| *** | Represent rounded numbers. |
92
Table of Contents
APOLLO INVESTMENT CORPORATION
NOTES TO FINANCIAL STATEMENTS (continued)
(in thousands except share and per share amounts)
Information about our senior securities is shown in the following table as of each year ended March 31 since the Company commenced operations, unless otherwise noted. The “—” indicates information which the SEC expressly does not require to be disclosed for certain types of senior securities.
| Class and Year |
Total Amount Outstanding(1) |
Asset Coverage Per Unit(2) |
Involuntary Liquidating Preference Per Unit(3) |
Estimated Market Value |
||||||||||||
| Senior Secured Facility |
||||||||||||||||
| Fiscal 2013 |
$ | 536,067 | $ | 1,137 | $ | — | $ | 551,097 | ||||||||
| Fiscal 2012 |
539,337 | 1,427 | — | N/A | ||||||||||||
| Fiscal 2011 |
628,443 | 1,707 | — | N/A | ||||||||||||
| Fiscal 2010 |
1,060,616 | 2,671 | — | N/A | ||||||||||||
| Fiscal 2009 |
1,057,601 | 2,320 | — | N/A | ||||||||||||
| Fiscal 2008 |
1,639,122 | 2,158 | — | N/A | ||||||||||||
| Fiscal 2007 |
492,312 | 4,757 | — | N/A | ||||||||||||
| Fiscal 2006 |
323,852 | 4,798 | — | N/A | ||||||||||||
| Fiscal 2005 |
— | — | — | N/A | ||||||||||||
| Senior Secured Notes |
||||||||||||||||
| Fiscal 2013 |
$ | 270,000 | $ | 572 | $ | — | $ | 282,173 | ||||||||
| Fiscal 2012 |
270,000 | 714 | — | N/A | ||||||||||||
| Fiscal 2011 |
225,000 | 611 | — | N/A | ||||||||||||
| Fiscal 2010 |
— | — | — | N/A | ||||||||||||
| Fiscal 2009 |
— | — | — | N/A | ||||||||||||
| Fiscal 2008 |
— | — | — | N/A | ||||||||||||
| Fiscal 2007 |
— | — | — | N/A | ||||||||||||
| Fiscal 2006 |
— | — | — | N/A | ||||||||||||
| Fiscal 2005 |
— | — | — | N/A | ||||||||||||
| 2042 Notes |
||||||||||||||||
| Fiscal 2013 |
$ | 150,000 | $ | 318 | $ | — | $ | 148,920 | ||||||||
| Fiscal 2012 |
— | — | — | N/A | ||||||||||||
| Fiscal 2011 |
— | — | — | N/A | ||||||||||||
| Fiscal 2010 |
— | — | — | N/A | ||||||||||||
| Fiscal 2009 |
— | — | — | N/A | ||||||||||||
| Fiscal 2008 |
— | — | — | N/A | ||||||||||||
| Fiscal 2007 |
— | — | — | N/A | ||||||||||||
| Fiscal 2006 |
— | — | — | N/A | ||||||||||||
| Fiscal 2005 |
— | — | — | N/A | ||||||||||||
| Convertible Notes |
||||||||||||||||
| Fiscal 2013 |
$ | 200,000 | $ | 424 | $ | — | $ | 212,000 | ||||||||
| Fiscal 2012 |
200,000 | 529 | — | N/A | ||||||||||||
| Fiscal 2011 |
200,000 | 544 | — | N/A | ||||||||||||
| Fiscal 2010 |
— | — | — | N/A | ||||||||||||
| Fiscal 2009 |
— | — | — | N/A | ||||||||||||
| Fiscal 2008 |
— | — | — | N/A | ||||||||||||
| Fiscal 2007 |
— | — | — | N/A | ||||||||||||
| Fiscal 2006 |
— | — | — | N/A | ||||||||||||
| Fiscal 2005 |
— | — | — | N/A | ||||||||||||
| (1) | Total amount of each class of senior securities outstanding at the end of the period presented. |
| (2) | The asset coverage ratio for a class of senior securities representing indebtedness is calculated as our consolidated total assets, less all liabilities and indebtedness not represented by senior securities, divided by |
93
Table of Contents
APOLLO INVESTMENT CORPORATION
NOTES TO FINANCIAL STATEMENTS (continued)
(in thousands except share and per share amounts)
| senior securities representing indebtedness. This asset coverage ratio is multiplied by $1 to determine the Asset Coverage Per Unit. In order to determine the specific Asset Coverage Per Unit for each class of debt, the total Asset Coverage Per Unit was divided based on the amount outstanding at the end of the period for each. |
| (3) | The amount to which such class of senior security would be entitled upon the involuntary liquidation of the issuer in preference to any security junior to it. |
Note 12. Debt
The Company’s outstanding debt obligations as of March 31, 2013 were as follows:
| March 31, 2013 | ||||||||||||||||
| Date Issued / Amended |
Total Aggregate Principal Amount Committed |
Principal Amount Outstanding |
Final Maturity Date |
|||||||||||||
| Senior Secured Facility |
2012 | $ | 1,140,000 | $ | 536,067 | 2016 | ||||||||||
| Senior Secured Notes |
2010 | 225,000 | 225,000 | 2015 | ||||||||||||
| Senior Secured Notes (Series A) |
2011 | 29,000 | 29,000 | 2016 | ||||||||||||
| Senior Secured Notes (Series B) |
2011 | 16,000 | 16,000 | 2018 | ||||||||||||
| 2042 Notes |
2012 | 150,000 | 150,000 | 2042 | ||||||||||||
| Convertible Notes |
2011 | 200,000 | 200,000 | 2016 | ||||||||||||
|
|
|
|
|
|||||||||||||
| Total Debt Obligations |
$ | 1,760,000 | $ | 1,156,067 | ||||||||||||
|
|
|
|
|
|||||||||||||
Senior Secured Facility
On May 23, 2012, the Company amended and restated its senior secured, multi-currency, revolving credit facility (the “Senior Secured Facility”). The Senior Secured Facility extends the lenders’ commitments totaling approximately $1.14 billion through May, 2015, and allows the Company to seek additional commitments from new and existing lenders in the future, up to an aggregate facility size not to exceed $1.71 billion. The Senior Secured Facility is secured by substantially all of the assets in Apollo Investment’s portfolio, including cash and cash equivalents. The final maturity date of the Senior Secured Facility is May 23, 2016. Commencing June 23, 2015, the Company is required to repay, in twelve consecutive monthly installments of equal size, the outstanding amount under the Senior Secured Facility as of May 23, 2015. Pricing for Alternate Base Rate (ABR) borrowings will be 125 basis points over the applicable Prime Rate and pricing for eurocurrency borrowings will be 225 basis points over the LIBOR Rate. Terms used in the foregoing sentence have the meanings set forth in the Senior Secured Facility. The Senior Secured Facility contains affirmative and restrictive covenants, including: (a) periodic financial reporting requirements, (b) maintaining minimum stockholders’ equity of the greater of (i) 40% of the total assets of Apollo Investment and its consolidated subsidiaries as at the last day of any fiscal quarter and (ii) the sum of (A) $800,000 plus (B) 25% of the net proceeds from the sale of equity interests in Apollo Investment after the closing date of the Senior Secured Facility, (c) maintaining a ratio of total assets, less total liabilities (other than indebtedness) to total indebtedness, in each case of Apollo Investment and its consolidated subsidiaries, of not less than 2.0:1.0, (d) limitations on the incurrence of additional indebtedness, including a requirement to meet a certain minimum liquidity threshold before Apollo Investment can incur such additional debt, (e) limitations on liens, (f) limitations on investments (other than in the ordinary course of Apollo Investment’s business), (g) limitations on mergers and disposition of assets (other than in the normal course of Apollo Investment’s business activities), (h) limitations on the creation or existence of agreements that permit liens on properties of Apollo Investment’s consolidated subsidiaries and (i) limitations on the repurchase or redemption of certain unsecured debt and debt securities. In addition to the asset coverage
94
Table of Contents
APOLLO INVESTMENT CORPORATION
NOTES TO FINANCIAL STATEMENTS (continued)
(in thousands except share and per share amounts)
ratio described in clause (c) of the preceding sentence, borrowings under the Senior Secured Facility (and the incurrence of certain other permitted debt) are subject to compliance with a borrowing base that applies different advance rates to different types of assets in Apollo Investment’s portfolio. The remaining capacity under the Senior Secured Facility was $603,933 at March 31, 2013.
Senior Secured Notes
On September 30, 2010, the Company entered into a note purchase agreement with certain institutional accredited investors providing for a private placement issuance of $225,000 in aggregate principal amount of five-year, senior secured notes with a fixed interest rate of 6.25% and a maturity date of October 4, 2015 (the “Senior Secured Notes”). On October 4, 2010, the Senior Secured Notes issued by Apollo Investment were sold to certain institutional accredited investors pursuant to an exemption from registration under the Securities Act of 1933, as amended. Interest on the Senior Secured Notes is due semi-annually on April 4 and October 4, commencing on April 4, 2011.
On September 29, 2011, the Company closed a private offering of $45,000 aggregate principal amount of senior secured notes (the “Notes”) consisting of two series: (1) 5.875% Senior Secured Notes, Series A, of the Company due September 29, 2016 in the aggregate principal amount of $29,000; and (2) 6.250% Senior Secured Notes, Series B, of the Company due September 29, 2018, in the aggregate principal amount of $16,000. The Notes were issued in a private placement only to qualified institutional buyers pursuant to Rule 144A under the Securities Act of 1933, as amended.
2042 Notes
On October 9, 2012, the Company issued $150,000 in aggregate principal amount of 6.625% senior unsecured notes due 2042 for net proceeds of $145,275 (the “2042 Notes”). Interest on the 2042 Notes is paid quarterly on January 15, April 15, July 15 and October 15, at a rate of 6.625% per year, commencing on January 15, 2013. The 2042 Notes will mature on October 15, 2042. The Company may redeem the 2042 Notes in whole or in part at any time or from time to time on or after October 15, 2017. The 2042 Notes are general, unsecured obligations and rank equal in right of payment with all of our existing and future senior, unsecured indebtedness. The 2042 Notes are listed on The New York Stock Exchange under the ticker symbol “AIB”.
Convertible Notes
On January 25, 2011, the Company closed a private offering of $200,000 aggregate principal amount of senior unsecured convertible notes (the “Convertible Notes”). The Convertible Notes were issued in a private placement only to qualified institutional buyers pursuant to Rule 144A under the Securities Act of 1933, as amended. The Convertible Notes bear interest at an annual rate of 5.75%, payable semi-annually in arrears on January 15 and July 15 of each year, commencing on July 15, 2011. The Convertible Notes will mature on January 15, 2016 unless earlier converted or repurchased at the holder’s option. Prior to December 15, 2015, the Convertible Notes will be convertible only upon certain corporate reorganizations, dilutive recapitalizations or dividends, or if, during specified periods our shares trade at more than 130% of the then applicable conversion price or the Convertible Notes trade at less than 97% of their conversion value and, thereafter, at any time. The Convertible Notes will be convertible by the holders into shares of common stock, initially at a conversion rate of 72.7405 shares of the Company’s common stock per $1 principal amount of Convertible Notes (14,548,100 common shares) corresponding to an initial conversion price per share of approximately $13.75, which represents a premium of 17.5% to the $11.70 per share closing price of the Company’s common stock on The NASDAQ Global Select Market on January 19, 2011. The conversion rate will be subject to adjustment upon certain events,
95
Table of Contents
APOLLO INVESTMENT CORPORATION
NOTES TO FINANCIAL STATEMENTS (continued)
(in thousands except share and per share amounts)
such as stock splits and combinations, mergers, spin-offs, increases in dividends in excess of $0.28 per share per quarter and certain changes in control. Certain of these adjustments, including adjustments for increases in dividends, are subject to a conversion price floor of $11.70 per share. The Convertible Notes are senior unsecured obligations and rank senior in right of payment to our existing and future indebtedness that is expressly subordinated in right of payment to the Convertible Notes; equal in right of payment to our existing and future unsecured indebtedness that is not so subordinated; effectively junior in right of payment to any of our secured indebtedness (including existing unsecured indebtedness that we later secure) to the extent of the value of the assets securing such indebtedness; and structurally junior to all existing and future indebtedness (including trade payables) incurred by our subsidiaries, financing vehicles or similar facilities. As more fully reflected in Note 5, the issuance is to be considered as part of the if-converted method for calculation and statement of diluted EPS.
The average outstanding debt balance was $1,036,780 and $1,213,943 for the fiscal years ended March 31, 2013 and 2012, respectively. The weighted average annual interest cost for the fiscal year ended March 31, 2013 was 4.75%, exclusive of 0.86% for amortization of debt issuance costs. The weighted average annual interest cost for the fiscal year ended March 31, 2012 was 4.64%, exclusive of 0.82% amortization of debt issuance costs. This weighted average annual interest cost reflects the average interest cost for all debt. The maximum amount of debt outstanding during the fiscal years ended March 31, 2013 and 2012 was $1,231,035 and $1,429,163, respectively. As of March 31, 2013, the Company is in compliance with all debt covenants.
Note 13(a). Income Tax Information and Distributions to Stockholders
The tax character of dividends for the fiscal year ended March 31, 2013 was as follows:
| Ordinary income |
$ | 159,629 | ||
| Tax Return of Capital |
$ | 2,684 |
As of March 31, 2013, the components of accumulated losses on a tax basis were as follows(1):
| Distributable ordinary income |
$ | — | ||
| Capital loss carryforward(2)(3) |
(936,167 | ) | ||
| Other book/tax temporary differences |
(60,510 | ) | ||
| Unrealized depreciation |
(259,773 | ) | ||
|
|
|
|||
| Total accumulated losses |
$ | (1,256,450 | ) | |
|
|
|
As of March 31, 2013, we had a post-October short-term capital loss deferral of $15,997 which is deemed to arise on April 1, 2013.
| (1) | Tax information for the fiscal year ended March 31, 2013 is an estimate and will not be finally determined until the Company files its 2013 tax return in December 2013. |
| (2) | On March 31, 2013, the Company had net capital loss carryforwards of $36,089, $199,331 and $411,998 which expire in 2017, 2018 and 2019, respectively. These amounts will be available to offset like amounts of any future taxable gains. It is unlikely that capital gains distributions will be paid to shareholders of the Company until net gains have been realized in excess of such capital loss carryforward or the carryforward expires. |
| (3) | On December 22, 2010, the Regulated Investment Company Modernization Act of 2010 (the “Act”) was enacted which changed various technical rules governing the tax treatment of regulated investment companies. The changes are generally effective for taxable years beginning after the date of enactment. Under the Act, the fund will be permitted to carry forward capital losses incurred in taxable years beginning |
96
Table of Contents
APOLLO INVESTMENT CORPORATION
NOTES TO FINANCIAL STATEMENTS (continued)
(in thousands except share and per share amounts)
| after the date of enactment for an unlimited period. However, any losses incurred during those future taxable years will be required to be utilized prior to the losses incurred in pre-enactment taxable years, which carry an expiration date. As a result of this ordering rule, pre-enactment capital loss carryforwards may be more likely to expire unused. Additionally, post-enactment capital losses that are carried forward will retain their character as either short-term or long-term losses rather than being considered all short-term as under previous law. As of March 31, 2013, the Company had a post-enactment long-term capital loss carryforward of $288,749. This loss is deemed to arise on April 1, 2013. |
The tax character of dividends for the fiscal year ended March 31, 2012 was as follows:
| Ordinary income |
$ | 204,427 |
As of March 31, 2012, the components of accumulated losses on a tax basis were as follows:
| Distributable ordinary income |
$ | 906 | ||
| Capital loss carryforward (1)(2) |
(648,651 | ) | ||
| Other book/tax temporary differences |
(287,148 | ) | ||
| Unrealized depreciation |
(266,400 | ) | ||
|
|
|
|||
| Total accumulated losses |
$ | (1,201,293 | ) | |
|
|
|
As of March 31, 2012, we had a post-October capital loss deferral of $247,738.
| (1) | On March 31, 2012, the Company had net capital loss carryforwards of $37,323, $199,331 and $411,998 which expire in 2017, 2018 and 2019, respectively. These amounts will be available to offset like amounts of any future taxable gains. It is unlikely that capital gains distributions will be paid to shareholders of the Company until net gains have been realized in excess of such capital loss carryforward or the carryforward expires. |
| (2) | On December 22, 2010, the Regulated Investment Company Modernization Act of 2010 (the “Act”) was enacted which changed various technical rules governing the tax treatment of regulated investment companies. The changes are generally effective for taxable years beginning after the date of enactment. Under the Act, the fund will be permitted to carry forward capital losses incurred in taxable years beginning after the date of enactment for an unlimited period. However, any losses incurred during those future taxable years will be required to be utilized prior to the losses incurred in pre-enactment taxable years, which carry an expiration date. As a result of this ordering rule, pre-enactment capital loss carryforwards may be more likely to expire unused. Additionally, post-enactment capital losses that are carried forward will retain their character as either short-term or long-term losses rather than being considered all short-term as under previous law. |
Note 13(b). Other Tax Information
The percentage of ordinary income distributions paid during the fiscal year ended March 31, 2013 eligible for qualified dividend income treatment is 1.54%. The percentage of ordinary income distributions paid during the fiscal year ended March 31, 2013 eligible for the 70% dividends received deduction for corporate stockholders is 1.54%.
The percentage of ordinary income distributions paid during the fiscal year ended March 31, 2012 eligible for qualified dividend income treatment is 2.97%. The percentage of ordinary income distributions paid during the fiscal year ended March 31, 2012 eligible for the 70% dividends received deduction for corporate stockholders is 2.97%.
97
Table of Contents
APOLLO INVESTMENT CORPORATION
NOTES TO FINANCIAL STATEMENTS (continued)
(in thousands except share and per share amounts)
Note 14. Selected Quarterly Financial Data (unaudited)
| Quarter Ended |
Investment Income |
Net Investment Income |
Net Realized And Unrealized Gain (Loss) on Assets |
Net Increase (Decrease) In Net Assets From Operations (on a basic, non-diluted basis) |
Net Increase (Decrease) In Net Assets From Operations (on a diluted basis) |
|||||||||||||||||||||||||||||||||||
| Total | Per Share |
Total | Per Share |
Total | Per Share |
Total | Per Share |
Total | Per Share |
|||||||||||||||||||||||||||||||
| March 31, 2013 |
84,617 | 0.42 | 42,066 | 0.21 | 23,755 | 0.12 | 65,821 | 0.32 | 68,389 | 0.31 | ||||||||||||||||||||||||||||||
| December 31, 2012 |
83,212 | 0.41 | 42,080 | 0.21 | (64,824 | ) | (0.32 | ) | (22,744 | ) | (0.11 | ) | (20,169 | ) | (0.11 | ) | ||||||||||||||||||||||||
| September 30, 2012 |
83,832 | 0.41 | 44,482 | 0.22 | 28,554 | 0.14 | 73,036 | 0.36 | 75,610 | 0.35 | ||||||||||||||||||||||||||||||
| June 30, 2012 |
80,333 | 0.40 | 38,732 | 0.19 | (50,374 | ) | (0.25 | ) | (11,642 | ) | (0.06 | ) | (9,048 | ) | 0.06 | |||||||||||||||||||||||||
| March 31, 2012 |
85,196 | 0.43 | 41,010 | 0.21 | 76,223 | 0.39 | 117,233 | 0.60 | 119,806 | 0.57 | ||||||||||||||||||||||||||||||
| December 31, 2011 |
83,815 | 0.43 | 38,538 | 0.20 | 25,159 | 0.13 | 63,697 | 0.32 | 66,274 | 0.31 | ||||||||||||||||||||||||||||||
| September 30, 2011 |
93,981 | 0.48 | 45,532 | 0.23 | (312,782 | ) | (1.59 | ) | (267,250 | ) | (1.36 | ) | (264,673 | ) | (1.36 | ) | ||||||||||||||||||||||||
| June 30, 2011 |
94,592 | 0.48 | 47,662 | 0.24 | (47,606 | ) | (0.24 | ) | 56 | 0.00 | 2,631 | 0.00 | ||||||||||||||||||||||||||||
| March 31, 2011 |
94,715 | 0.48 | 50,037 | 0.26 | 62,014 | 0.32 | 112,052 | 0.57 | 113,935 | 0.55 | ||||||||||||||||||||||||||||||
| December 31, 2010 |
94,318 | 0.48 | 50,126 | 0.26 | 34,378 | 0.18 | 84,504 | 0.43 | N/A | N/A | ||||||||||||||||||||||||||||||
| September 30, 2010 |
91,499 | 0.47 | 50,182 | 0.26 | 17,984 | 0.09 | 68,166 | 0.35 | N/A | N/A | ||||||||||||||||||||||||||||||
| June 30, 2010 |
78,248 | 0.42 | 40,827 | 0.22 | (125,137 | ) | (0.67 | ) | (84,310 | ) | (0.45 | ) | N/A | N/A | ||||||||||||||||||||||||||
Note 15. Commitments and Contingencies
As of March 31, 2013, the Company had outstanding commitments with banks to purchase secured term loans and unsecured bridge loans in the aggregate amount of $105,000. AIC’s commitments are subject to the consummation of the underlying corporate transactions and conditional upon receipt of all necessary shareholder, regulatory and other applicable approvals.
As of May 23, 2013 the outstanding commitments with banks to purchase secured term loans and unsecured bridge loans in the aggregate was $220,000.
The Company had unfunded commitments on senior loans as of March 31, 2013 of $59,281. The Company also had unfunded commitments on senior loans of $82,667 which require the borrower to meet certain performance thresholds before the Company is obligated to fulfill the commitments and those performance thresholds were not met as of March 31, 2013.
Note 16. Subsequent Events
The Board of Directors declared a dividend of $0.20 per share for the first fiscal quarter of 2014, payable on July 5, 2013 to stockholders of record as of June 20, 2013.
On May 20, 2013, we issued 21.85 million shares of our common stock at $8.60 per share (or $8.342 per share net proceeds before estimated expenses), raising $181.9 million of net proceeds. Apollo Investment Management, L.P. (“AIM”), our investment adviser, has agreed to waive the base management and incentive fees associated with the incremental shares issued in the offering through March 31, 2014.
98
Table of Contents
Item 9. Changes in and Disagreements with Accountants on Accounting and Financial Disclosure
None.
Item 9A. Controls and Procedures
(a) Evaluation of Disclosure Controls and Procedures
As of March 31, 2013 (the end of the period covered by this report), we, including our Chief Executive Officer and Chief Financial Officer, evaluated the effectiveness of the design and operation of our disclosure controls and procedures (as defined in Rule 13a-15(e) of the 1934 Act). Based on that evaluation, our management, including the Chief Executive Officer and Chief Financial Officer, concluded that our disclosure controls and procedures were effective and provided reasonable assurance that information required to be disclosed in our periodic SEC filings is recorded, processed, summarized and reported within the time periods specified in the SEC’s rules and forms, and that such information is accumulated and communicated to our management, including our Chief Executive Officer and Chief Financial Officer, as appropriate, to allow timely decisions regarding required disclosure. However, in evaluating the disclosure controls and procedures, management recognized that any controls and procedures, no matter how well designed and operated can provide only reasonable assurance of achieving the desired control objectives, and management necessarily was required to apply its judgment in evaluating the cost-benefit relationship of such possible controls and procedures.
(b) Management’s Report on Internal Control Over Financial Reporting
Management’s Report on Internal Control Over Financial Reporting, which appears on page 53 of this Form 10-K, is incorporated by reference herein.
(c) Attestation Report of the Independent Registered Public Accounting Firm
Our independent registered public accounting firm, PricewaterhouseCoopers LLP, has issued an attestation report on the Company’s internal control over financial reporting, which is set forth above under the heading “Report of Independent Registered Public Accounting Firm” in Item 8.
(d) Changes in Internal Controls Over Financial Reporting
Management has not identified any change in the Company’s internal control over financing reporting that occurred during the fourth fiscal quarter of 2013 that has materially affected, or is reasonably likely to materially affect, the Company’s internal control over financial reporting.
None.
99
Table of Contents
Item 10. Directors, Executive Officers and Corporate Governance
MANAGEMENT
Our business and affairs are managed under the direction of our board of directors. The board of directors currently consists of eight members, six of whom are not “interested persons” of Apollo Investment as defined in Section 2(a)(19) of the 1940 Act. We refer to these individuals as our independent directors. Our board of directors elects our officers, who serve at the discretion of the board of directors.
BOARD OF DIRECTORS
Under our charter, our directors are divided into three classes. Each class of directors holds office for a three year term. At each annual meeting of our stockholders, the successors to the class of directors whose terms expire at such meeting will be elected to hold office for a term expiring at the annual meeting of stockholders held in the third year following the year of their election. Each director holds office for the term to which he or she is elected and until his or her successor is duly elected and qualifies.
Directors
Information regarding the board of directors is as follows:
| Name |
Age | Position |
Director Since |
Expiration of Term |
||||||||||
| Interested Directors |
||||||||||||||
| John J. Hannan |
60 | Chairman of the Board and Director | 2004 | 2015 | ||||||||||
| James C. Zelter |
50 | Chief Executive Officer and Director | 2008 | 2015 | ||||||||||
| Independent Directors |
||||||||||||||
| Ashok N. Bakhru |
71 | Director | 2008 | 2015 | ||||||||||
| Bradley J. Wechsler |
61 | Director | 2004 | 2013 | ||||||||||
| Carl Spielvogel |
84 | Director | 2004 | 2014 | ||||||||||
| Elliot Stein, Jr. |
64 | Director | 2004 | 2013 | ||||||||||
| Frank C. Puleo |
67 | Director | 2008 | 2014 | ||||||||||
| Jeanette Loeb |
60 | Director | 2011 | 2014 | ||||||||||
The address for each director is c/o Apollo Investment Corporation, 9 West 57th Street, New York, NY 10019.
Executive officers who are not directors
Information regarding our executive officers who are not directors is as follows:
| Name |
Age | Position | ||||
| Gregory W. Hunt |
56 | Chief Financial Officer and Treasurer | ||||
| Edward J. Goldthorpe |
36 | President and Chief Investment Officer | ||||
| Eileen M. Patrick |
45 | Executive Vice President of Corporate Strategy | ||||
| Cindy Z. Michel |
39 | Vice President and Chief Compliance Officer | ||||
| John J. Suydam |
53 | Vice President and Chief Legal Officer | ||||
| Joseph D. Glatt |
39 | Vice President and Secretary | ||||
The address for each executive officer is c/o Apollo Investment Corporation, 9 West 57th Street, New York, NY 10019.
100
Table of Contents
Biographical information
Directors
Our directors have been divided into two groups — independent directors and interested directors. Interested directors are interested persons as defined in the 1940 Act.
Independent Directors
Ashok N. Bakhru (71) Director. Mr. Bakhru became a Director of Apollo Investment Corporation on October 16, 2008. Mr. Bakhru currently serves as the Chairman of the Board of the Goldman Sachs Group of Mutual Funds. Mr. Bakhru served as the Chairman of GS Hedge Fund Partners Registered Fund LLC from 2004 to 2009 and Chairman of GS Hedge Fund Partners Registered Master Fund LLC from 2005 to 2009. Previously Mr. Bakhru was the Chief Financial Officer and Chief Administrative Officer of Coty Inc. in New York City. Prior to that he served at Scott Paper Company in Philadelphia, where he held several senior management positions including Senior Vice President and Chief Financial Officer roles. Mr. Bakhru also serves on the Board of Governors of the Investment Company Institute, the Governing Council of the Independent Directors Council, Mutual Fund Directors Forum and the Advisory Board of BoardIQ, an investment publication. He has been actively involved with Cornell University, having served on its Council and Administrative Board over the past several years.
Bradley J. Wechsler (61) Director. Mr. Wechsler became a Director of Apollo Investment Corporation in April 2004. Mr. Wechsler was the Co-Chairman and Co-Chief Executive Officer of IMAX Corporation from May, 1996 through April, 2009 and is currently Chairman. Previously Mr. Wechsler has had several executive positions in the entertainment and finance industries. Mr. Wechsler is a Vice-Chairman of the board of the NYU Hospital and Medical Center, a member of the Executive Committee and chairs its Finance Committee. In addition, he sits on the boards of Assay Healthcare Solutions, the Ethical Culture Fieldston Schools and Math for America. He is also a member of the Academy of Motion Picture Arts and Sciences.
Carl Spielvogel (84) Director. Ambassador Spielvogel became a Director of Apollo Investment Corporation in March 2004. Ambassador Spielvogel was and is currently Chairman and Chief Executive Officer of Carl Spielvogel Associates, Inc., an international management and counseling company, from 1997 to 2000, and from 2001 to present. From 2000-2001, Ambassador Spielvogel served as U.S. Ambassador to the Slovak Republic, based in Bratislava, Slovakia. He served as a Director of Interactive Data Corporation, Inc. from 1996 to 2009, and as a member of its Audit Committee and Chairman of the Independent Shareholders Committee. From 1994 to 1997, Ambassador Spielvogel was Chairman and Chief Executive Officer of the United Auto Group, Inc., one of the first publicly-owned auto dealership groups. Earlier, Ambassador Spielvogel was Chairman and Chief Executive Officer of Backer Spielvogel Bates Worldwide, a global marketing communications company from 1985 to 1994. Ambassador Spielvogel is a trustee of the Metropolitan Museum of Art; a member of the Board of Trustees and Chairman of the Business Council of the Asia Society; a member of the Board of Trustees of Lincoln Center for the Performing Arts; a member of the Council on Foreign Relations; a member of the Executive Committee of the Council of American Ambassadors’; a Trustee and member of the Executive Committee of the State University of New York, and a former Fellow of the Kennedy School of Government at Harvard University. Before becoming an Ambassador, he was a Governor of the United States Government Board of Broadcasting.
Elliot Stein, Jr. (64) Director. Mr. Stein became a Director of the Company in March 2004 and currently serves as lead Independent Director. Mr. Stein has also been a director of Apollo Senior Floating Rate Fund Inc. since 2011 and a director of Apollo Tactical Income Fund Inc since 2013. He is currently the Chair of Senturion Forecasting, LLC, a private company. He is also a Managing Director of Commonwealth Capital Partners and has served as Chairman of Caribbean International News Corporation since 1985. Mr. Stein is also a board member of various private companies including Multi-Pak Holdings, Cohere Communications and Assay Healthcare Solutions. Mr. Stein is a Trustee of Claremont Graduate University and the New School University. He is a member of the Council on Foreign Relations. He formerly served as a Director of VTG Holdings, Bargain Shop Holdings, Inc. and various other private companies.
101
Table of Contents
Frank C. Puleo (67) Director. Mr. Puleo became a Director of Apollo Investment Corporation on February 4, 2008. Mr. Puleo currently serves as a Director of CIFC Deerfield Corp., a credit asset manager, South Street Holdings, LLC. (formerly known as CMET Finance Holdings, Inc.), a company that finances securities inventory for customers and dealers and licenses trade processing software, SLM Corp., a student loan company, and Syncora Capital Assurance, Inc., a monoline financial guaranty and insurance company. Previously Mr. Puleo was a partner at Milbank, Tweed, Hadley & McCloy LLP where he advised clients on structured finance transactions, bank and bank holding company regulatory and securities law matters. Mr. Puleo became a partner of Milbank, Tweed, Hadley & McCloy LLP in 1978 and Co-Chair of the firm’s Global Finance Group in 1995 until retiring at the end of 2006. He was a member of the firm’s Executive Committee from 1982 to 1991 and from 1996 to 2002. Mr. Puleo served as a Lecturer at Columbia University School of Law from 1997 to 2001.
Jeanette Loeb (60) Director. Ms. Loeb became a Director of Apollo Investment Corporation on August 2011. Ms. Loeb currently serves as a Director of PetCareRx, and is a former Chairman and CEO of the company a leading e-commerce pet pharmacy that sells pet medications, supplies and food directly to the consumer. Ms. Loeb joined PetCareRx, Inc. in 2001. From 1977 until 1994, Ms. Loeb was an investment banker at Goldman Sachs, where she served as the head of the Structured Finance Department in the US. Ms. Loeb was named the first woman partner of Goldman Sachs in 1986 and served as a partner from 1986-1994. Ms. Loeb received an MBA from Harvard Business School and graduated Phi Beta Kappa from Wellesley College with a BA in economics. She currently serves on the board and the finance committee of New York City Center, the board and audit committee of the United Nations Development Corporation, the board for Alliance Bernstein Multi-Manager Alternative Fund and has previously been a member of the board of the Collegiate School, the Treasurer and a board member of the Society of Memorial Sloan Kettering and a founding member of the Wellesley Business Leadership Council.
Interested directors
John J. Hannan (60) Chairman of the Board of Directors. Mr. Hannan became a Director of Apollo Investment Corporation in March 2004 and was elected as Chairman of the Board of Directors in August 2006. He served as the Chief Executive Officer from February 2006 to November 2008. Mr. Hannan, a senior partner of Apollo Management, L.P., co-founded Apollo Management, L.P. in 1990. He formerly served as a director for Vail Resorts, Inc. and Goodman Global, Inc.
James C. Zelter (50) Chief Executive Officer and Director. Mr. Zelter joined Apollo in 2006. He became the Chief Executive Officer and a Director of Apollo Investment Corporation in November 2008. He is the Managing Partner of Apollo Capital Management (“ACM”). The funds in the ACM platform include: Apollo Strategic Value Fund, Apollo Credit Opportunity Fund I and II, Apollo Asia Opportunity Fund and Apollo European Principal Finance Fund. ACM also includes Apollo Investment Management, L.P. the investment manager to Apollo Investment Corporation. Prior to joining Apollo, Mr. Zelter was with Citigroup and its predecessor companies from 1994 to 2006. From 2003 to 2005, Mr. Zelter was Chief Investment Officer of Citigroup Alternative Investments, and prior to that he was responsible for the firm’s Global High Yield franchise.
Executive Officers who are not directors
Cindy Z. Michel (39) Chief Compliance Officer and Vice President. Ms. Michel was appointed Chief Compliance Officer and Vice President of Apollo Investment Corporation in 2010. Ms. Michel joined Apollo Global Management, LLC in 2007 as its Director of Compliance and continues to serve in this role. Prior to joining Apollo, Ms. Michel served as the Director of Compliance of the Private Equity Division at Lehman Brothers. Prior to that, she was associated with the investment bank Credit-Suisse Securities as a member of its Compliance Department supporting the Private Equity and Investment Banking businesses. Before joining Credit-Suisse, Ms. Michel was associated with the law firm of DLA Piper.
102
Table of Contents
Edward J. Goldthorpe (36) Chief Investment Officer and President. Mr. Goldthorpe began his term as President of Apollo Investment Corporation and as Chief Investment Officer of AIM in May 2012. Previously, Mr. Goldthorpe was employed by Goldman Sachs for 13 years. He served most recently as a Managing Director with the Bank Loan Distressed Investing Desk (2009 to 2012), and prior to that Mr. Goldthorpe was a Managing Director with the Special Situations Group within the firm’s Securities Division (2005 to 2009). Prior to that, Mr. Goldthorpe was a Vice President in the High Yield Distressed Group (2001 to 2005), an analyst in the Merchant Banking Division (2000 to 2001), and an analyst in the Investment Banking Division (1999 to 2000). Mr. Goldthorpe received a B.A. in Commerce from Queen’s University in Kingston, Ontario. Mr. Goldthorpe currently serves on the Global Advisory Board for the Queen’s School of Business. He is also the Chairman of the Young Fellowship of The Duke of Edinburgh’s Award.
Eileen M. Patrick (45) Executive Vice President of Corporate Strategy. Ms. Patrick was appointed Executive Vice President of Corporate Strategy of AIC in 2012. Ms. Patrick joined Apollo in 2010 working in its Capital Markets Division. She also serves as a Vice President and member of the Investment Committee for the manager of Apollo Residential Mortgage Inc. (NYSE: AMTG). Prior to joining Apollo, Ms. Patrick was a Managing Director at JP Morgan in the Financial Institutions Group. Prior to that she was a Senior Managing Director in the Financial Institutions Group at Bear Stearns. At Bear Stearns she oversaw the Specialty Finance Investment Banking effort. Prior to joining Bear Stearns, she was a Vice President at Salomon Smith Barney Citigroup in the Financial Institutions Investment Banking Group.
Gregory W. Hunt (56) Chief Financial Officer and Treasurer. Mr. Hunt began his term as Chief Financial Officer and Treasurer of Apollo Investment Corporation in May 2012. Previously, Mr. Hunt was Executive Vice President and Chief Financial Officer for Yankee Candle which he joined in April 2010. Prior to joining Yankee Candle, Mr. Hunt served as the Executive Vice President of Strategic and Commercial Development for Norwegian Cruise Lines from 2007 to 2009. Prior to joining Norwegian Cruise Lines, Mr. Hunt served as Chief Financial Officer and Chief Restructuring Officer of Tweeter Home Entertainment Group, Inc. from 2006 to 2007 and Chief Financial Officer and Co-Chief Executive of Syratech Corporation from 2001 to 2006. Prior to Syratech, Mr. Hunt held several senior financial leadership positions including Chief Financial Officer of NRT Inc., Culligan Water Technologies, Inc. and Samsonite Corporation. Mr. Hunt also serves as a member of the Board of Advisors for the University of Vermont School of Business.
John J. Suydam (53) Chief Legal Officer and Vice President. Mr. Suydam joined Apollo Investment Corporation in 2006. Mr. Suydam also serves as the Chief Legal Officer of Apollo Global Management, LLC, a position he has held since 2006. From 2002 to 2006, Mr. Suydam was a partner at O’Melveny & Myers LLP, where he served as head of Mergers & Acquisitions and co-head of the Corporate Department. Prior to that time, Mr. Suydam served as chairman of the law firm O’Sullivan, LLP which specialized in representing private equity investors. Mr. Suydam serves as a trustee of the New York University School of Law and is a member of the Department of Medicine Advisory Board of The Mount Sinai Medical Center. Mr. Suydam also serves as a member of the board of directors of the Big Apple Circus and Environmental Solutions Worldwide Inc. Mr. Suydam received his JD from New York University School of Law and graduated magna cum laude with a BA in History from the State University of New York at Albany.
Joseph D. Glatt (39) Secretary and Vice President. Mr. Glatt was appointed Secretary of Apollo Investment Corporation in 2010 and Vice President in 2009. Mr. Glatt is also currently General Counsel of Apollo Capital Management L.P., a position he has held since 2007 and since 2011 he has served as the Chief Legal Officer of Apollo Senior Floating Rate Fund Inc., and Apollo Tactical Income Fund Inc. Previously, Mr. Glatt was associated with the law firms of Simpson Thacher & Bartlett LLP from 1998 to 2003 and Schulte Roth & Zabel LLP from 2003 to 2007, in each case, primarily focusing on mergers and acquisitions, leveraged buyouts and capital markets activities.
Additional information required by this item, including for example, director qualifications, is contained in the Registrant’s definitive Proxy Statement for its 2013 Annual Stockholders Meeting under the caption, “Information about the Nominees and Directors” to be filed with the Securities and Exchange Commission within 120 days after March 31, 2013 and is incorporated herein by reference.
103
Table of Contents
The Audit Committee
The audit committee operates pursuant to an audit committee charter approved by the board of directors. The charter sets forth the responsibilities of the audit committee, which include selecting or retaining each year an independent registered public accounting firm (the “auditors”) to audit the accounts and records of the Company; reviewing and discussing with management and the auditors the annual audited financial statements of the Company, including disclosures made in management’s discussion and analysis, and recommending to the board of directors whether the audited financial statements should be included in the Company’s annual report on Form 10-K; reviewing and discussing with management and the auditors the Company’s quarterly financial statements prior to the filings of its quarterly reports on Form 10-Q; pre-approving the auditors’ engagement to render audit and/or permissible non-audit services; and evaluating the qualifications, performance and independence of the auditors. The audit committee is presently composed of six persons: Messrs. Bakhru, Puleo, Spielvogel, Stein, Wechsler, and Ms. Loeb, all of whom are independent directors and are otherwise considered independent under the listing standards of NASDAQ Marketplace Rule 5605(a)(2). The Company’s board of directors has determined that Mr. Bakhru is an “audit committee financial expert” as that term is defined under Item 401 of Regulation S-K under the Securities Exchange Act of 1934, as amended, (the “Exchange Act”). The Audit Committee Charter is available on the Company’s website (www.apolloic.com).
Section 16(a) Beneficial Ownership Reporting Compliance
Pursuant to Section 16(a) of the Exchange Act, the Company’s Directors and Executive Officers, and any persons holding more than 10% of its common stock, are required to report their beneficial ownership and any changes therein to the Securities and Exchange Commission (the “Commission”) and the Company. Specific due dates for those reports have been established, and the Company is required to report herein any failure to file such reports by those due dates. Based on the Company’s review of Forms 3, 4 and 5 filed by such persons and information provided by the Company’s Directors and officers, the Company believes that during the fiscal year ended March 31, 2013, all Section 16(a) filing requirements applicable to such persons were met in a timely manner, except that a change in Mr. Stein’s beneficial ownership of the Company’s common stock, due to administrative oversight, was reported on a Form 4 three business days later than required by Section 16(a) and the general instructions to Form 4.
Code of Conduct
We have adopted a code of conduct for all our directors and employees, including our Chief Executive Officer and Chief Financial Officer, as required under Item 406 of Regulation S-K under the Exchange Act and the listing standards of NASDAQ Marketplace Rule 5610. The code of conduct is available on our website located at www.apolloic.com. You may also read and copy the code of conduct at the SEC’s Public Reference Room in Washington, D.C. You may obtain information on operations of the Public Reference Room by calling the SEC at (202) 942-8090. In addition, the code of conduct will be available on the EDGAR Database on the SEC Internet site at http://www.sec.gov. You may also obtain copies of the code of conduct, after paying a duplicating fee, by electronic request at the following email address: publicinfo@sec.gov, or by writing to the SEC’s Public Reference Section, 450 5th Street, NW, Washington, D.C. 20549.
Item 11. Executive Compensation
COMPENSATION DISCUSSION AND ANALYSIS
Apollo Investment Corporation does not currently have any employees. The executive officers of the company are either employees of our investment adviser, Apollo Investment Management (“adviser”), or our administrator, Apollo Investment Administration (“administrator”). The adviser and administrator provide necessary services to the business, pursuant to the terms of our investment advisory and management agreement and our administration agreement. Our day-to-day investment operations are managed by our investment adviser. Most of the services necessary for the origination and administration of our investment portfolio are provided by investment professionals employed by the adviser. In addition, we generally reimburse the administrator for our allocable portion of expenses incurred by it in performing its obligations under the administration agreement, including our allocable portion of the cost of our chief financial officer, chief compliance officer and their respective staffs.
104
Table of Contents
Summary Compensation Table
The following table shows information regarding the compensation expected to be received by the independent directors and executive officers for the fiscal year ended March 31, 2013. No compensation is paid to directors who are “interested persons.”
| Name |
Aggregate compensation from Apollo Investment |
Pension or retirement benefits accrued as part of our expenses(1) |
Total compensation from Apollo Investment paid to director/ officer |
|||||||||
| Independent directors |
||||||||||||
| Ashok Bakhru |
$ | 153,072 | None | $ | 153,072 | |||||||
| Bradley J. Wechsler |
132,500 | None | 132,500 | |||||||||
| Carl Spielvogel |
132,500 | None | 132,500 | |||||||||
| Elliot Stein, Jr. |
136,572 | None | 136,572 | |||||||||
| Frank C. Puleo |
131,131 | None | 131,131 | |||||||||
| Jeanette Loeb |
135,500 | None | 135,500 | |||||||||
| Interested directors |
||||||||||||
| John J. Hannan |
None | None | None | |||||||||
| James C. Zelter(2) |
None | None | None | |||||||||
| Executive Officers |
||||||||||||
| Cindy Michel |
None | None | None | |||||||||
| Edward J. Goldthorpe |
None | None | None | |||||||||
| Eileen Patrick |
None | None | None | |||||||||
| Gregory W. Hunt |
None | None | None | |||||||||
| John J. Suydam |
None | None | None | |||||||||
| Joseph Glatt |
None | None | None | |||||||||
| (1) | We do not have a profit sharing or retirement plan, and directors do not receive any pension or retirement benefits. |
| (2) | James C. Zelter is also an executive officer of Apollo Investment Corporation. |
The independent directors’ annual fee is $100,000. The independent directors also receive $2,500 plus reimbursement of reasonable out-of-pocket expenses incurred in connection with attending each board meeting, $1,000 plus reimbursement of reasonable out-of-pocket expenses incurred in connection with each committee meeting attended, and $1,500 for each telephonic committee or board meeting attended. In addition, the Chairman of the Audit Committee receives an annual fee of $15,000 and each chairman of any other committee receives an annual fee of $2,500 for additional services in these capacities. Further, we purchase directors’ and officers’ liability insurance on behalf of our directors and officers. Independent directors have the option to receive their directors’ fees paid in shares of our common stock issued at a price per share equal to the greater of net asset value or the market price at the time of payment.
Additional information required by this item, including for example, compensation of officers and directors, is contained in the Registrant’s definitive Proxy Statement for its 2013 Annual Stockholders Meeting under the caption, “Compensation of Directors and Executive Officers” to be filed with the Securities and Exchange Commission within 120 days after March 31, 2013 and is incorporated herein by reference.
Item 12. Security Ownership of Certain Beneficial Owners and Management and Related Stockholder Matters
As of March 31, 2013, there were no persons that owned 25% or more of our outstanding voting securities, and no person would be deemed to control us, as such term is defined in the 1940 Act.
105
Table of Contents
Our directors have been divided into two groups — interested directors and independent directors. Interested directors are “interested persons” as defined in the Investment Company Act of 1940.
The following table sets forth, as of March 31, 2013, certain ownership information with respect to our common stock for those persons whom we believe, based on public filings and/or information provided by such persons, directly or indirectly owned, controlled or held with the power to vote, 5% or more of our outstanding common stock as of that date and all officers and directors, as a group. Unless otherwise indicated, we believe that each beneficial owner set forth in the table has sole voting and investment power.
| Name and address |
Type of ownership(1) | Shares owned | Percentage of common stock outstanding |
|||||||||
| BlackRock, Inc.(2) |
Beneficial | 13,869,896 | 6.84 | % | ||||||||
| Thornburg Investment Management Inc.(3) |
Beneficial | 13,495,010 | 6.65 | % | ||||||||
| All officers and directors as a group (13 persons)(4) |
Beneficial | 347,107 | * | |||||||||
| * | Represents less than 1%. |
| (1) | All of our common stock is owned of record by Cede & Co., as nominee of the Depository Trust Company. |
| (2) | The principal address for BlackRock, Inc. is 40 East 52nd Street, New York, NY 10022. |
| (3) | The principal address for Thornburg Investment Management Inc. is 2300 North Ridgetop Road, Santa Fe, New Mexico, 87506. |
| (4) | The address for all officers and directors is c/o Apollo Investment Corporation, 9 West 57th Street, New York, NY 10019. |
The following table sets forth the dollar range of our equity securities beneficially owned by each of our directors as of March 31, 2013. (We are not part of a “family of investment companies,” as that term is defined in the 1940 Act.)
| Name of Director |
Dollar Range of Equity Securities in Apollo Investment(1) |
|||
| Independent Directors |
||||
| Ashok Bakhru |
$ | 100,001 – $ 500,000 | ||
| Bradley J. Wechsler |
$ | 100,001 – $ 500,000 | ||
| Carl Spielvogel |
None | |||
| Elliot Stein, Jr. |
$ | 100,001 – $ 500,000 | ||
| Frank C. Puleo |
$ | 50,001 – $ 100,000 | ||
| Jeanette Loeb |
$ | 100,001 – $ 500,000 | ||
| Interested Directors |
||||
| James C. Zelter |
Over $1,000,000 | |||
| John J. Hannan |
$ | 500,001 – $1,000,000 | (2) | |
| (1) | Dollar ranges are as follows: None, $1 — $10,000, $10,001 — $50,000, $50,001 — $100,000, $100,001 — $500,000, $500,001 — $1,000,000 or over $1,000,000. |
| (2) | Dollar range includes shares held through indirect beneficial ownership of a family trust. |
Additional information required by this item, including for example, security ownership of management, is contained in the Registrant’s definitive Proxy Statement for its 2013 Annual Stockholders Meeting under the caption, “Security Ownership of Certain Beneficial Owners and Management” to be filed with the Securities and Exchange Commission within 120 days after March 31, 2013 and is incorporated herein by reference.
106
Table of Contents
Item 13. Certain Relationships and Related Transactions, and Director Independence
We have entered into an investment advisory and management agreement with AIM. Certain of our senior officers and our chairman of the board of directors have ownership and financial interests in AIM. Certain of our senior officers also serve as principals of other investment managers affiliated with AIM that may in the future manage investment funds with investment objectives similar to ours. In addition, our executive officers and directors and the partners of our investment adviser, AIM, serve or may serve as officers, directors or principals of entities that operate in the same or related line of business as we do, or of investment funds managed by its affiliates, although we may not be given the opportunity to participate in certain investments made by investment funds managed by advisers affiliated with AIM. However, our investment adviser and its affiliates intend to allocate investment opportunities in a fair and equitable manner consistent with our investment objectives and strategies so that we are not disadvantaged in relation to any other client.
We have entered into a royalty-free license agreement with AGM which we recently amended and restated, pursuant to which AGM has agreed to grant us a non-exclusive license to use the name “Apollo.” Under the license agreement, we have the right to use the “Apollo” name for so long as AIM or one of its affiliates remains our investment adviser. In addition, we rent office space from AIA, an affiliate of AIM, and pay Apollo Administration our allocable portion of overhead and other expenses incurred by Apollo Administration in performing its obligations under our administration agreement with AIA, including our allocable portion of the cost of our chief financial officer and chief compliance officer and their respective staffs, which can create conflicts of interest that our board of directors must monitor. We may invest, to the extent permitted by law, on a concurrent basis with affiliates of AIM, subject to compliance with applicable regulations and our allocation procedures.
Further information relating to relationships and director independence is hereby incorporated by reference from our 2012 Proxy Statement under the caption “Certain Relationships and Transactions.”
Item 14. Principal Accounting Fees and Services
The audit committee of the board of directors selected PricewaterhouseCoopers LLP as independent registered public accounting firm (the “auditors”) for the Company for the fiscal year ending March 31, 2013. The audit committee has received the written disclosures and the letter from the independent accountant required by applicable requirements of the Public Company Accounting Oversight Board regarding the independent accountant’s communications with the audit committee concerning independence, and has discussed with the independent accountant the independent accountant’s independence.
Audit Fees: Audit fees consist of fees billed for professional services rendered for the quarterly reviews and audit of our financial statements and services that are normally provided by PricewaterhouseCoopers LLP in connection with statutory and regulatory filings. Audit fees billed during the fiscal years ending March 31, 2013 and March 31, 2012 were $1,207,506 and $701,140, respectively.
Audit-Related Fees: Audit-related services consist of fees billed for assurance and related services that are reasonably related to the performance of the audit or review of our financial statements and are not reported under “Audit Fees.” These services include attest services that are not required by statute or regulation and consultations concerning financial accounting and reporting standards. Audit-related fees billed during the fiscal years ending March 31, 2013 and March 31, 2012 were $111,861 and $375,820, respectively.
Tax Services Fees: Tax services fees consist of fees billed for professional tax services. These services also include assistance regarding federal, state, and local tax compliance. Tax services and fees billed during the fiscal years ending March 31, 2013 and March 31, 2012 were $36,500 and $35,000, respectively, which represented work related to preparation of tax returns, our RIC qualification, excise tax distribution requirements, form extensions, etc.
107
Table of Contents
All Other Fees: Other fees would include fees for products and services other than the services reported above, of which there were none in the fiscal years ended March 31, 2013 and March 31, 2012.
The Audit Committee of the board of directors of Apollo Investment Corporation operates under a written charter adopted by the board of directors. Management is responsible for the Company’s internal controls and the financial reporting process. The auditors are responsible for performing an independent audit of the Company’s financial statements in accordance with auditing standards generally accepted in the United States and expressing an opinion on the conformity of those audited financial statements in accordance with accounting principles generally accepted in the United States. The Audit Committee’s responsibility is to monitor and oversee these processes. The Audit Committee is also directly responsible for the appointment, compensation and oversight of the Company’s auditors.
The Audit Committee has established a pre-approval policy that describes the permitted audit, audit-related, tax and other services to be provided by PricewaterhouseCoopers LLP, the Company’s auditors. The policy requires that the Audit Committee pre-approve the audit and non-audit services performed by the auditors in order to assure that the provision of such service does not impair the auditor’s independence.
Any requests for audit, audit-related, tax and other services that have not received general pre-approval must be submitted to the Audit Committee for specific pre-approval, and cannot commence until such approval has been granted. Normally, pre-approval is provided at regularly scheduled meetings of the Audit Committee. However, the Audit Committee may delegate pre-approval authority to one or more of its members. The member or members to whom such authority is delegated shall report any pre-approval decisions to the Audit Committee at its next scheduled meeting. The Audit Committee does not delegate its responsibilities to pre-approve services performed by the auditors to management.
The Audit Committee has reviewed the audited financial statements and met and held discussions with management regarding the audited financial statements. Management has represented to the Audit Committee that the Company’s financial statements were prepared in accordance with accounting principles generally accepted in the United States.
The Audit Committee has discussed with PricewaterhouseCoopers LLP, the Company’s auditors, matters required to be discussed by the statement on Auditing Standards No. 114, as amended.
Based on the Audit Committee’s discussion with management and the auditors, the Audit Committee’s review of the audited financial statements, the representations of management and the report of the auditors to the Audit Committee, the Audit Committee has recommended that the board of directors include the audited financial statements in the Company’s Annual Report on Form 10-K for the fiscal year ended March 31, 2013 for filing with the Securities and Exchange Commission. The Audit Committee has also appointed PricewaterhouseCoopers LLP to serve as auditors for the fiscal year ended March 31, 2014 pending ratification by the Company’s shareholders.
108
Table of Contents
Item 15. Exhibits, Financial Statement Schedules
| (a)(1) |
Financial Statements. | |||
| Refer to Item 8 above. | ||||
| (a)(2) |
Financial Statement Schedules | |||
| None. | ||||
| (a)(3) |
Exhibits | |||
| 3.1(a) | Articles of Amendment(1) | |||
| 3.1(b) | Articles of Amendment and Restatement(2) | |||
| 3.2 | Third Amended and Restated Bylaws(3) | |||
| 4.1 | Form of Stock Certificate(4) | |||
| 4.2 | In accordance with Item 601(b)(4)(iii)(A) of Regulation S-K, certain instruments respecting long-term debt of the registrant have been omitted but will be furnished to the Commission upon request. | |||
| 4.3 | Form of Indenture for Debt Securities(5) | |||
| 4.4 | Form T-1 Statement of Eligibility of The Bank of New York Mellon, as Trustee, with respect to the Form of Indenture for debt securities(5) | |||
| 4.5 | Indenture, dated as of October 9, 2012, between the Company and U.S. Bank National Association, as trustee(11) | |||
| 4.6 | First Supplemental Indenture, dated as of October 9, 2012, relating to the 6.625% Senior Notes due 2042, between the Company and U.S. Bank National Association, as trustee(11) | |||
| 4.7 | Form of 6.625% Senior Notes due 2042 (contained in the First Supplemental Indenture filed as Exhibit (4.6) hereto)(11) | |||
| 10.1 | Amended and Restated Investment Advisory Management Agreement between Registrant and Apollo Investment Management, L.P.(6) | |||
| 10.2 | Amended and Restated Administration Agreement between Registrant and Apollo Investment Administration, LLC(6) | |||
| 10.3 | Dividend Reinvestment Plan(7) | |||
| 10.4 | Custodian Agreement(2) | |||
| 10.5 | Amended and Restated License Agreement between the Registrant and Apollo Management Holdings, L.P. dated as of May 14, 2012(10) | |||
| 10.6 | Form of Transfer Agency and Service Agreement(2) | |||
| 10.7 | Amendment No. 1 to Amended and Restated Senior Secured Revolving Credit Agreement(8) | |||
| 10.8 | Amended & Restated Senior Secured Revolving Credit Agreement, dated as of May 23, 2012.(10) | |||
| 11.1 | Statement regarding computation of per share earnings* | |||
| 14.1 | Code of Conduct(9) | |||
| 31.1 | Certification of Chief Executive Officer Pursuant to Rule 13a-14(a) under the Securities Exchange Act of 1934.* | |||
| 31.2 | Certification of Chief Financial Officer Pursuant to Rule 13a-14(a) under the Securities Exchange Act of 1934.* | |||
| 32.1 | Certification of Chief Executive Officer Pursuant to Section 906 of the Sarbanes-Oxley Act of 2002 (18 U. S. C. 1350).* | |||
| 32.2 | Certification of Chief Financial Officer Pursuant to Section 906 of the Sarbanes-Oxley Act of 2002 (18 U. S. C. 1350).* | |||
| * | Filed herewith. |
109
Table of Contents
| (1) | Incorporated by reference from the Registrant’s pre-effective Amendment No. 1 to the Registration Statement under the Securities Act of 1933, as amended, on Form N-2, filed on June 20, 2005. |
| (2) | Incorporated by reference from the Registrant’s pre-effective Amendment No. 3 to the Registration Statement under the Securities Act of 1933, as amended, on Form N-2, filed on April 1, 2004. |
| (3) | Incorporated by reference from the Registrant’s Form 8-K, filed on November 6, 2009. |
| (4) | Incorporated by reference from the Registrant’s pre-effective Amendment No. 1 to the Registration Statement under the Securities Act of 1933, as amended, on Form N-2, filed on March 12, 2004. |
| (5) | Incorporated by reference from the Registrant’s pre-effective Amendment No. 1 to the Registration Statement under the Securities Act of 1933, as amended, on Form N-2, filed on April 8, 2011. |
| (6) | Incorporated by reference from the Registrant’s Form 10-K, filed on May 26, 2010. |
| (7) | Incorporated by reference from the Registrant’s Form 10-K, filed on June 12, 2006. |
| (8) | Incorporated by reference from the Registrant’s Form 8-K filed on December 23, 2009. |
| (9) | Incorporated by reference from the Registrant’s Form 10-K, filed on May 29, 2008. |
| (10) | Incorporated by reference from the Registrant’s Form 10-K, filed on May 22, 2012. |
| (11) | Incorporated by reference to Exhibits 4.1, 4.2, 4.3, 5.1 and 5.2, as applicable, to the Registrant’s Form 8-K (File No. 814-00646), filed on October 9, 2012. |
110
Table of Contents
Pursuant to the requirements of Section 13 or 15(d) of the Securities Exchange Act of 1934, the registrant has duly caused this report to be signed on its behalf by the undersigned, thereunto duly authorized.
| APOLLO INVESTMENT CORPORATION | ||
| By: | /s/ James C. Zelter | |
| James C. Zelter Chief Executive Officer May 23, 2013 | ||
Pursuant to the requirements of the Securities Exchange Act of 1934, this report has been signed below by the following persons on behalf of the registrant and in the capacities and on the dates indicated.
| SIGNATURE |
TITLE |
DATE | ||
| /s/ James C. Zelter James C. Zelter |
Chief Executive Officer and President (principal executive officer) | May 23, 2013 | ||
| /s/ Gregory W. Hunt Gregory W. Hunt |
Chief Financial Officer and Treasurer (principal financial and accounting officer) | May 23, 2013 | ||
| /s/ John J. Hannan John J. Hannan |
Chairman of the Board, Director |
May 23, 2013 | ||
| /s/ Ashok Bakhru Ashok Bakhru |
Director | May 23, 2013 | ||
| /s/ Bradley J. Wechsler Bradley J. Wechsler |
Director | May 23, 2013 | ||
| /s/ Carl Spielvogel Carl Spielvogel |
Director | May 23, 2013 | ||
| /s/ Elliot Stein, Jr. Elliot Stein, Jr. |
Director | May 23, 2013 | ||
| /s/ Frank C. Puleo Frank C. Puleo |
Director | May 23, 2013 | ||
| /s/ Jeanette Loeb Jeanette Loeb |
Director | May 23, 2013 | ||
111