Attached files
| file | filename |
|---|---|
| 8-K - 8-K - II-VI INC | d729549d8k.htm |
 A Global Leader in Engineered Materials
& Opto-electronic Components
NASDAQ Global Select: IIVI
B. Riley 15
th
Annual Investor Conference
Francis J. Kramer, President and Chief Executive Officer
May 20, 2014
Exhibit 99.1 |
 2
•
Matters discussed in this presentation may contain forward-looking
statements that are subject to risks and uncertainties. These risks and
uncertainties could cause the forward-looking statements and II-VI
Incorporated’s (the Company’s) actual results to differ materially.
In evaluating these forward-looking statements, you should specifically
consider the “Risk Factors”
in the Company’s most recent Form 10-K and
Form 10-Q. Forward-looking statements are only estimates and actual
events or results may differ materially.
•
II-VI Incorporated disclaims any obligation to update information contained
in any forward-looking statement.
•
This presentation contains certain non-GAAP financial measures.
Reconciliations of non-GAAP financial measures to their most comparable
GAAP financial measures are presented at the end of this presentation.
Safe Harbor Statement |
 Financial
information for all periods presented reflects Pacific Rare Specialty Metals &
Chemicals Inc.’s tellurium product line as a discontinued operation. Non U.S.
56%
Infrared
Optics
37%
Near –
Infrared
28%
Military &
Materials
Advanced
Products Group
Geography
Segments
FY13 Revenues of $551M by
Markets, Geography and Segments
Founded:
1971
Headquarters:
Saxonburg
Pennsylvania, USA
Profitability:
41 consecutive years since
1973, and counting
Listing:
October 1987
on NASDAQ: IIVI
Locations:
Worldwide presence in over
14 countries
Businesses:
14
businesses
organized
into
5
reportable
segments
Focus:
Growth; AACGR of 17% in
revenues and 18% in
earnings since 1987
EBITDA Margin:
21% to 26%, FY10-FY13
History and Overview
18%
17%
U.S.
44%
At a Glance
3
Industrial
46%
Military
Optical
Communication
Life Sciences:
4%
Markets
20%
22%
Semi. Cap. Equip.: 4%
All Other: 4% |
 FY15
Planned
Business
Reorganization
Forecasted FY14 Revenues
Under
Current
Structure
$M
Forecasted FY14 Revenues
Under
New
Structure
$M
Reasons for Reorganization
1.
2.
3.
Performance
Products
Photonics
Laser
Solutions
4
APG
M&M
NIR
IR
AOP
205
145
100
120
110
250
215
215
Better
focus
on
end
markets
and
customers
Better
align
business
and
technical
processes
Improve
line
of
sight
on
profitability
and
cash
usage |
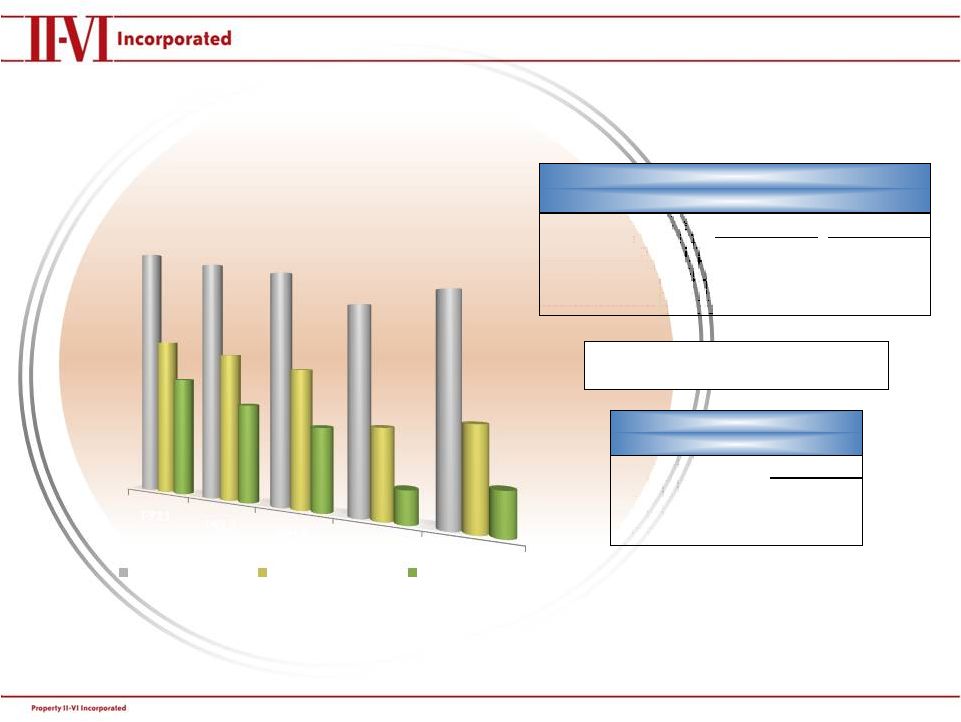
 Financial
information for all periods presented reflects Pacific Rare Specialty Metals &
Chemicals Inc.’s tellurium product line as a discontinued operation.
Growth History
Organic Growth + Timely Acquisitions = Strong Financial Results
5
Fiscal Year Revenues ($M)
Fiscal Year Cash Flow from
Operations ($M)
Forecast
Forecast |
   Financial
information for all periods presented reflects Pacific Rare Specialty Metals &
Chemicals Inc.’s tellurium product line as a discontinued operation. EBITDA is
defined as earnings before interest, taxes, depreciation and amortization.
Margin History and Expectations
FY15
FY16
Gross Margin %
35% to 38%
37% to 40%
EBITDA Margin %
15% to 18%
19% to 21%
Operating Margin %
7% to 10%
9% to 12%
Expectation Ranges:
Current Margin
FY15-16
Gross Margin %
36% to 40%
EBITDA Margin %
18% to 21%
Operating Margin %
11% to 13%
Previous Margin
Expectation Ranges
•
Acquisitions have delayed our margin
improvement by one year
FY11
FY12
FY13
FY14 Q3
FY14 YTD
41.6%
39.0%
36.9%
31.5%
33.2%
26.0%
23.9%
21.7%
13.6%
14.9%
19.6%
15.8%
13.0%
5.0%
6.4%
Gross Margin %
EBITDA Margin %
Operating Margin %
6 |
 Financial
information for all periods presented reflects Pacific Rare Specialty Metals &
Chemicals Inc.’s tellurium product line as a discontinued operation.
Quarterly Revenue & Earnings Per Share
($M except per share data)
7
$0.00
$0.05
$0.10
$0.15
$0.20
$0.25
$0.30
$0
$20
$40
$60
$80
$100
$120
$140
$160
$180
$200
Quarterly Revenues
Diluted Earnings Per Share
$0.12
$0.13
$0.15
$0.22
$0.20
$0.25
$0.23 |
 FY14
Integration of Acquisitions FY14 Integration of Acquisitions
Ongoing Integration Tasks to Help Achieve Positive Earnings of These Acquisitions:
•
Eliminate reliance on Oclaro for certain transition and manufacturing services,
•
Negotiating our own supply agreements with our contract manufacturers,
•
Reduce Laser Enterprise workforce by 20%; close Tucson, AZ operations,
•
Execute cost reduction plans to ensure product cost competitiveness,
•
Increase Fab utilization focusing on large addressable markets, and
•
Evaluate product portfolio from a standpoint of profitability.
8 |
 ($ in
thousands) As of June 30, 2013
As of March 31, 2014
Cash and cash equivalents
185,433
$
185,691
$
Total assets
863,802
1,090,064
Long-term debt, including current portion
114,036
263,907
Shareholders' equity
636,108
665,241
Strong Cash and Liquidity
Position Strong Cash and Liquidity Position
•
Growing cash flow position,
•
Investments in product and manufacturing technology development and capacity
expansion, and
•
$20 million open share repurchase program. As of March 31, 2014, purchased
750,000 shares for $12 million.
9 |
  ZnS
& ZnSe Material Growth Laser Tools
Current Business
FY13 Revenues:
$203M
End Markets:
Industrial
95%
Military
5%
Est. Market Size:
$560M
Infrared Optics
Infrared Optics
10
•
Fiber-coupled beam delivery systems and processing
tools for industrial lasers at 1 micron wavelength,
including fiber lasers
•
CVD Diamond Optics for EUV Lithography systems
Technology Innovations
•
85%
-
90%
of
revenues
come
from
replacement
optics
needed for the worldwide installed base of over 70,000
high
power
(>1kW)
CO
2
lasers
•
Leading
supplier
of
optics,
components
and
materials
to
manufacturers
and
users
of
infrared/CO
2
lasers |
  Near-Infrared Optics
FY13 Revenues:
$155M
End Markets:
Optical Comm.
70%
Industrial
20%
Other
10%
Est. Market Size:
$1.6B
11
Current Business
Technology Innovations
Tunable Optical Devices
Micro-Optics and Components
Manufacturer of crystal material, optics, microchip
lasers, opto-electronic modules, tunable optical
channel monitors, fiber couplers, fiber combiners
and thin film filters for optical communications
Products include passive optical components such
as WDM modules, dispersion compensation
modules, switches, isolators and wavelength
lockers for wired (10G/40G/100G) and wireless
applications
Development of 40G and 100G transmission modules |
 Military & Materials
12
Financial information for all periods presented reflects
Pacific Rare Specialty Metals & Chemicals Inc.’s tellurium product line as a
discontinued operation. FY13 Revenues:
$97M
Current Businesses
Technology Innovations
Sapphire and IR Window Assemblies / Dome
Assemblies / Optical Assemblies
Infrared Search &Track (IRST)
Precision optical systems and components for
targeting pods, thermal imaging systems,
space telescopes, medical systems and laser-
based systems
Leader in sapphire based products, including
panels for Joint Strike Fighter’s Optical
Targeting System
Produces frequency selective micro grids
enabling EMI protection and stealth for
military aircraft, land vehicles and missiles
“Snap Together”
precision optical alignment
Conformal windows and domes |
  Advanced Products Group
SiC Wafer Growth & Fabrication
Ceramic & Metal Matrix Composite Components
Thermoelectric Devices
Current Businesses
Technology Innovations
13
FY13 Revenues:
$96M
End Markets:
Semiconductor
25%
Industrial
15%
Military
20%
Consumer
10%
Optical Comm.
20%
Life Sciences
10%
Est. Market Size:
$1B
•
Leader in thermoelectric cooling and power generation
solutions
•
Manufacturer of advanced materials and Metal Matrix
Composites and Reaction Bonded Silicon Carbide
•
Manufactures single crystal silicon carbide substrates
for wireless infrastructure, RF electronics and power
switching industries
•
Diameter expansion for single crystal silicon carbide
•
Product development for 300mm and 450mm
diameter lithography systems |
  Active
Optical Products Active Optical Products
II-VI Network Solutions
II-VI Laser Enterprise
End Markets:
Optical Communication
70%
Industrial
30%
Est. Market Size:
$6B
14
Current
Businesses
•
Purchased from Oclaro, Inc. in September and November
2013
•
Manufacturer of GaAs semiconductor lasers with industry
leading reliability and power performance and fiber
amplifiers and
micro-optics
•
Products include: fiber coupled multi-emitter pumps for
fiber lasers, high power direct diode bars and stacks, high-
speed VCSELs, 980 nm terrestrial and submarine pumps
and Erbium Doped and Raman Fiber Amplifiers serving
both industrial and optical communications markets Technology
Innovations •
High-power, high-speed vertical cavity surface emitting
lasers (VCSELs)
•
Low dollar per watt fiber laser pump modules •
Amplifier Arrays
|
 •
Diverse End Markets
•
Leading Market Positions
•
Global Manufacturing Footprint
•
Proven Financial Success
•
Growth via Organic and Acquisitions
II-VI Advantages
15 |
 ($000’s,
except %’s; all periods fiscal year) Non-GAAP Reconciliations
Non-GAAP Reconciliations
16
Reconciliation of EBITDA to Net Earnings
2004
2005
2006
2007
2008
2009
2010
2011
2012
2013
EBITDA
33,974
46,389
55,156
67,539
79,699
61,531
72,304
126,609
123,213
119,438
Interest expense
412
945
1,790
1,007
242
178
87
103
212
1,160
Depreciation and amortization
9,632
12,705
15,784
15,849
15,474
15,292
20,954
28,313
34,523
40,792
Income taxes
7,080
8,525
10,541
12,241
24,867
7,378
12,515
18,517
17,760
18,766
Goodwill impairment
-
-
17,630
-
-
-
-
-
-
-
Gain on sale of equity investment
-
-
-
-
(26,455)
-
-
-
-
-
Loss (earnings) on discontinued operations, net of taxes
(487)
959
(1,383)
476
(122)
(228)
13
(3,342)
9,443
6,789
Net earnings
17,337
23,255
10,794
37,966
65,693
38,911
38,735
83,018
61,275
51,931
Revenues
142,679
187,242
223,626
254,684
309,747
280,040
333,046
486,638
516,403
551,075
Reconciliation of EBITDA Margin to Return on Sales
2009
2010
2011
2012
2013
EBITDA margin
22.0%
21.7%
26.0%
23.9%
21.7%
As a % of revenues:
Interest expense
0.0%
0.0%
0.0%
0.1%
0.2%
Depreciation and amortization
5.5%
6.3%
5.8%
6.7%
7.4%
Income taxes
2.6%
3.8%
3.8%
3.4%
3.4%
Goodwill impairment
-
-
-
-
-
Gain on sale of equity investment
0.0%
-
-
-
-
Loss on discontinued operations, net of taxes
0.0%
-
-0.7%
1.8%
1.3%
Return on sales
13.9%
11.6%
17.1%
11.9%
9.4%
Reconciliation of Free Cash Flow to Cash Flow from Operations
2009
2010
2011
2012
2013
Free cash flow
35,705
58,487
38,157
47,781
85,267
Capital expenditures
15,439
13,665
40,186
42,797
25,205
Cash flow from operations
51,144
72,152
78,343
90,578
110,472
|