Attached files
| file | filename |
|---|---|
| 8-K - KAMAN CORPORATION FORM 8-K - KAMAN Corp | form8-k.htm |

1
Investor Presentation
May 19, 2014

2
Forward Looking Statements
FORWARD-LOOKING STATEMENTS
This presentation contains "forward-looking statements" within the meaning of the safe harbor provisions of the U.S. Private Securities Litigation Reform Act of 1995.
Forward-looking statements also may be included in other publicly available documents issued by the company and in oral statements made by our officers and
representatives from time to time. These forward-looking statements are intended to provide management's current expectations or plans for our future operating and
financial performance, based on assumptions currently believed to be valid. They can be identified by the use of words such as "anticipate," "intend," "plan," "goal,"
"seek," "believe," "project," "estimate," "expect," "strategy," "future," "likely," "may," "should," "would," "could," "will" and other words of similar meaning in connection with
a discussion of future operating or financial performance. Examples of forward looking statements include, among others, statements relating to future sales, earnings,
cash flows, results of operations, uses of cash and other measures of financial performance.
Because forward-looking statements relate to the future, they are subject to inherent risks, uncertainties and other factors that may cause the company's actual results
and financial condition to differ materially from those expressed or implied in the forward-looking statements. Such risks, uncertainties and other factors include, among
others: (i) changes in domestic and foreign economic and competitive conditions in markets served by the company, particularly the defense, commercial aviation and
industrial production markets; (ii) changes in government and customer priorities and requirements (including cost-cutting initiatives, government and customer shut-
downs, the potential deferral of awards, terminations or reductions of expenditures to respond to the priorities of Congress and the Administration, or budgetary cuts
resulting from Congressional actions or automatic sequestration); (iii) changes in geopolitical conditions in countries where the company does or intends to do business;
(iv) the successful conclusion of competitions for government programs and thereafter contract negotiations with government authorities, both foreign and domestic; (v)
the existence of standard government contract provisions permitting renegotiation of terms and termination for the convenience of the government; (vi) the conclusion to
government inquiries or investigations regarding government programs, including the resolution of the Wichita subpoena matter; (vii) risks and uncertainties associated
with the successful implementation and ramp up of significant new programs; (viii) potential difficulties associated with variable acceptance test results, given sensitive
production materials and extreme test parameters; (ix) the receipt and successful execution of production orders for the JPF U.S. government contract, including the
exercise of all contract options and receipt of orders from allied militaries, as all have been assumed in connection with goodwill impairment evaluations; (x) the
continued support of the existing K-MAX® helicopter fleet, including sale of existing K-MAX® spare parts inventory; (xi) the accuracy of current cost estimates associated
with environmental remediation activities at the Bloomfield, Moosup and New Hartford, CT facilities and our U.K. facilities; (xii) the profitable integration of acquired
businesses into the company's operations; (xiii) the ability to implement our ERP systems in a cost-effective and efficient manner, limiting disruption to our business, and
to capture their planned benefits while maintaining an adequate internal control environment; (xiv) changes in supplier sales or vendor incentive policies; (xv) the effects
of price increases or decreases; (xvi) the effects of pension regulations, pension plan assumptions, pension plan asset performance and future contributions; (xvii) future
levels of indebtedness and capital expenditures; (xviii) the continued availability of raw materials and other commodities in adequate supplies and the effect of increased
costs for such items; (xix) the effects of currency exchange rates and foreign competition on future operations; (xx) changes in laws and regulations, taxes, interest rates,
inflation rates and general business conditions; (xxi) future repurchases and/or issuances of common stock; and (xxii) other risks and uncertainties set forth herein and in
our 2013 Form 10-K.
Any forward-looking information provided in this presentation should be considered with these factors in mind. We assume no obligation to update any forward-looking
statements contained in this presentation.
statements contained in this presentation.
Contact: Eric Remington
V.P., Investor Relations
(860) 243-6334
Eric.Remington@kaman.com

3
Non-GAAP Figures
Certain measures presented in this presentation are “Non-GAAP”
items. These figures are denoted with an asterisk (*).
items. These figures are denoted with an asterisk (*).
Reconciliations from GAAP measures to the Non-GAAP measures are
presented in Appendix I to this presentation and our recent earnings
releases filed with the U.S. Securities and Exchange Commission.
presented in Appendix I to this presentation and our recent earnings
releases filed with the U.S. Securities and Exchange Commission.

4
Aerospace
37%
21%
42%
Kaman Corporation - 2013 Sales Overview
63%
37%
Distribution
Aerospace
$1.7B Revenues
12%

5
Kaman Corporation Overview
|
AEROSPACE
|
DISTRIBUTION
|
||
|
Aerosystems
|
Specialty Bearings &
Engineered Products |
Fuzing & Precision
Products |
|
|
|
|
|
|
|
• Engineering design and
testing • Tooling design & manufacture
• Advanced machining and
composite aerostructure manufacturing • Complex assembly
• Helicopter MRO and support
|
• Self-lube airframe
bearings • Traditional airframe
bearings • Flexible drive systems
|
• Bomb safe and arm
fuzing devices • Missile safe and arm
fuzing devices • High precision measuring
systems • Memory products
|
• Bearing and power
transmission products • Fluid power products
• Automation, control and
energy products • Systems and services
across all product groups |
|
• Global commercial and defense OEM’s
• Super Tier I’s to subcontract manufacturers
• Aircraft operators and MRO
• Specialized aerospace distributors
|
• U.S. and allied militaries
• Weapon system OEMs
|
• Virtually every industry in
North America |
|
|
• “One Kaman” approach combining design and build
capabilities provide customers with a global integrated solution • Bearing product lines have a mostly commercial
customer base, which is expected to provide growth from new program wins and increasing build rates |
• Exclusivity and
significant backlog are expected to provide a stable revenue base |
• Offers customers single-
source responsibility and accountability for a comprehensive portfolio of complimentary product lines |
|
Product
Business
Dynamic
Customer

6
Business Strengths
• Secular trends helping to drive significant long-term growth opportunities
in both Aerospace and Distribution segments
in both Aerospace and Distribution segments
• Improved balance across the Aerospace segment between commercial
and defense programs
and defense programs
– Increasing content of bearing products on new platforms
– Higher commercial build rates driving bearing and aerostructure sales
– New program ramp ups and wins provide offset to lower defense
spending
spending
• Distribution business gaining scale and capabilities via acquisitions and
enhancing complementary product platforms
enhancing complementary product platforms
• Investing in new product development and applications, acquisitions and
technology for long-term growth
technology for long-term growth
• Strong balance sheet to drive growth and strategic initiatives
• Experienced management team

7
2013 Sales: $614 million
Aerospace
37%

8
Aerospace Business Drivers
• Kaman is well positioned to further penetrate Commercial OEM’s and
Super Tier 1’s
Super Tier 1’s
– Proactive “One Kaman” business development efforts have increased
bid activity
bid activity
– Proven capability to provide flexible low cost solutions
– Broadening geographic footprint to better serve customers and to
provide lower cost option manufacturing alternatives
provide lower cost option manufacturing alternatives
• Achieve cost synergies through deeper shared services across the
organization with a common ERP system as a critical enabler
organization with a common ERP system as a critical enabler
• Increasing production levels at Boeing and Airbus and A350 launch will
support near term specialty bearing & aerostructures growth
support near term specialty bearing & aerostructures growth
• Defense platforms provide exposure to key vertical lift and reset programs
• Sole source long-term contractual position and solid backlog on key
fuzing program provides stable revenue base
fuzing program provides stable revenue base

9
Aerospace Strategy
• DEPTH - Size/financial strength to address larger, integrated work
packages from primes/OEMs and Tier 1s
packages from primes/OEMs and Tier 1s
• DIVERSITY - Balance portfolio through increased commercial
content
content
• DIFFERENTIATION - Continue to move from build-to-print to design-
and-build for higher margins and more defensible positions
and-build for higher margins and more defensible positions
• DEVELOPMENT - Increased, focused investments in our people and
infrastructure to increase capabilities and drive improved
performance
infrastructure to increase capabilities and drive improved
performance

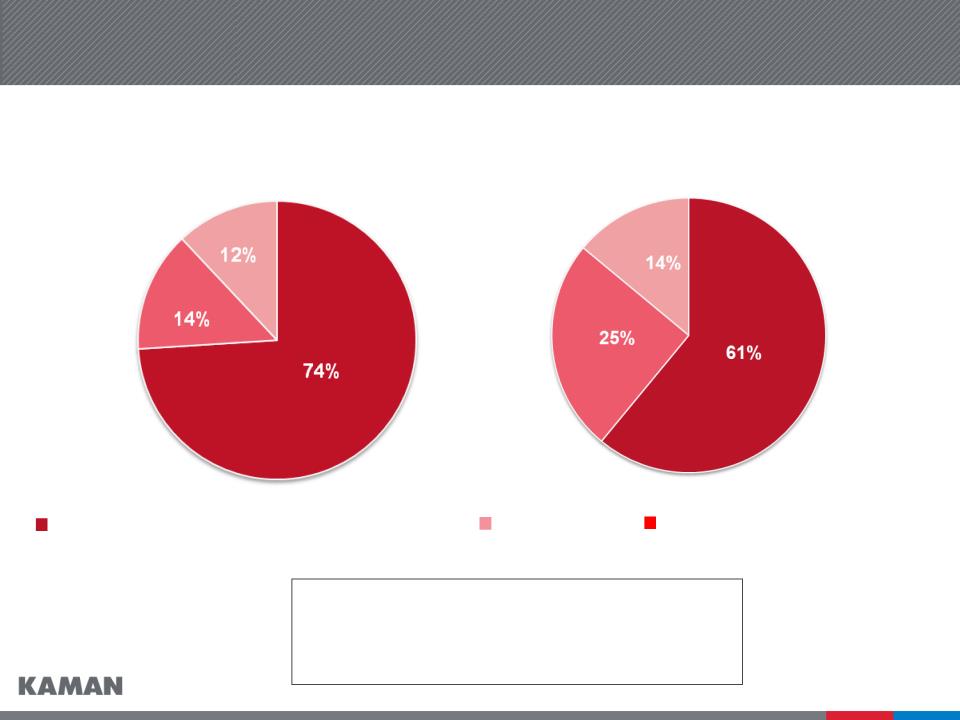
10
Aerospace Sales Mix 2009 vs. 2013
2009
Sales = $501 million
2013
Sales = $614 million
Defense Aerospace
31%
48%
21%
37%
42%
21%
Fuzing
Commercial Aerospace
Significantly higher relative growth rates in our commercial aerospace portfolio have
resulted in improved balance. Commercial sales increased by 46% from 2009 to
2013.
resulted in improved balance. Commercial sales increased by 46% from 2009 to
2013.
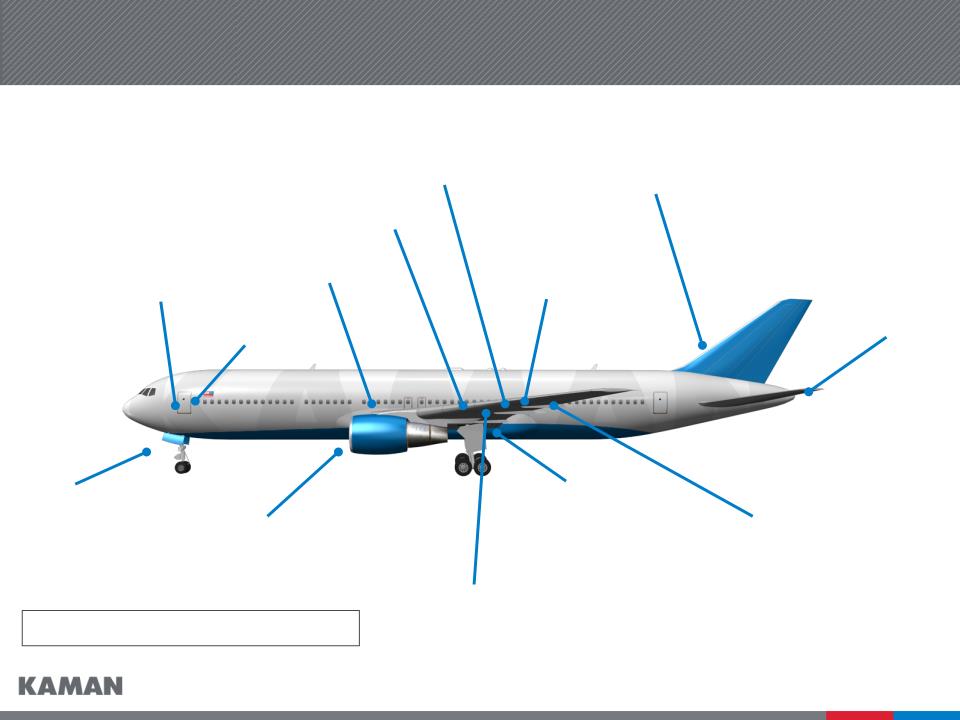
11
Fixed trailing edge
Access doors
Top covers
Red denotes bearing products
Nose landing gear
Horizontal
stabilizer
stabilizer
Main landing gear
Flaps
Rudder
Door assemblies
Engine/thrust reverser
Aircraft Programs/Capabilities
Flight controls
Doors
Fixed leading edge

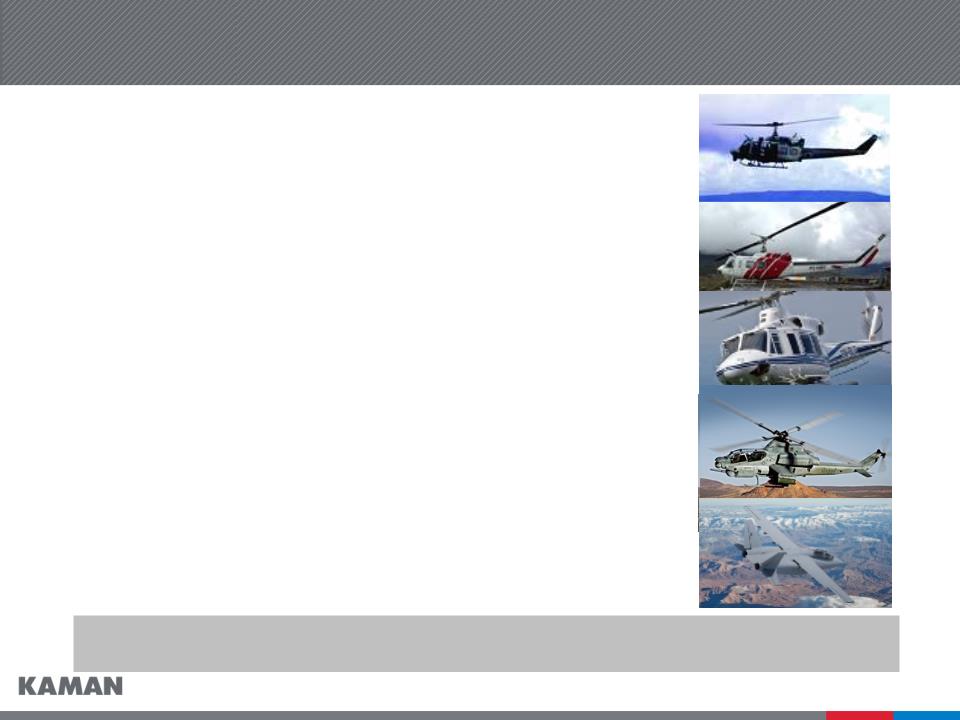
12
Manufacture of cockpit
Manufacture and assembly
of tail rotor pylon
of tail rotor pylon
Manufacture
subassembly
subassembly
Blade manufacture,
repair and overhaul
repair and overhaul
Driveline couplings
Bushings
Flight control bearings
Aircraft Programs/Capabilities
Red denotes bearing products

13
Market leading self lube airframe bearing product lines
• Content on virtually every aircraft manufactured today with a growing
installed base
installed base
• Approximately 75% of sales are for commercial applications
• Proprietary technology:
– KAron® bearing liner system
– KAflex® and Tufflex® flexible couplings
• Approximately 95% of sales are for custom engineered applications
• Operational excellence through lean manufacturing

14
Fuzing Products
HARPOON
MAVERICK
FMU-139
TOMAHAWK
JPF
STANDARD
MISSILE
MISSILE
SLAM-ER
SLAM-ER
AMRAAM
TOMAHAWK
STANDARD
MISSILE
MISSILE
AGM-65M
KPP Fuzes are on a majority of major U.S.
weapons systems
weapons systems
AMRAAM

15
• USAF bomb fuze of choice
• USAF inventory levels are less than half
desired quantity
desired quantity
• Recently awarded USAF contract
extends sole source position into 2017
extends sole source position into 2017
• Backlog of $131 million as of 3/28/2014
• 27 foreign customers
• System reliability exceeds 98% and
operational reliability is greater than 99%
operational reliability is greater than 99%
Bomb Compatibility
- JDAM
- Paveway II and III
- GBU-10, 12, 16, 24, 27, 28, 31,
32, 38, 54
32, 38, 54
- BLU-109, 110, 111, 113, 117,
121, 122, 126
121, 122, 126
- MK82/BSU-49, MK83/BSU-85,
MK84/BSU-50
MK84/BSU-50
JPF Program

16
• 747-8 wing-to-body fairing
• A350 airframe bearings
• G280 winglet
• G7000/G8000 fixed leading
edge
edge
• AH-1Z cabin
• Learjet 85 composite door
• Trent 700 nacelle panels
• P-8 composite operator
stations
stations
New Programs
Provides growth, improves customer balance, and increases program diversity.
Leverages core competencies and broadening areas of expertise.
17
Leveraging Customer Relationships - Bell/Textron Case Study
|
Early
1980’s
|
Developed a driveshaft for the U.S. Army’s UH-1 helicopter
|
|
Mid
1980’s
|
Developed technology to replace driveshaft's across the Bell
fleet of commercial and military aircraft |
|
2009
|
Awarded a five year $53M contract to build composite helo.
blade skins and skin core assemblies for eight Bell models |
|
2011
|
Awarded a contract with a potential value of more than $200
million to manufacture and assemble cabins for the AH-1Z - the largest structure ever outsourced by Bell
|
|
2013
|
Delivered significant structural components for the recently
introduced Textron AirLand Scorpion prototype aircraft |
Continually providing quality value added solutions has led to a growing relationship
that is projected to exceed $40 million in sales annually
18
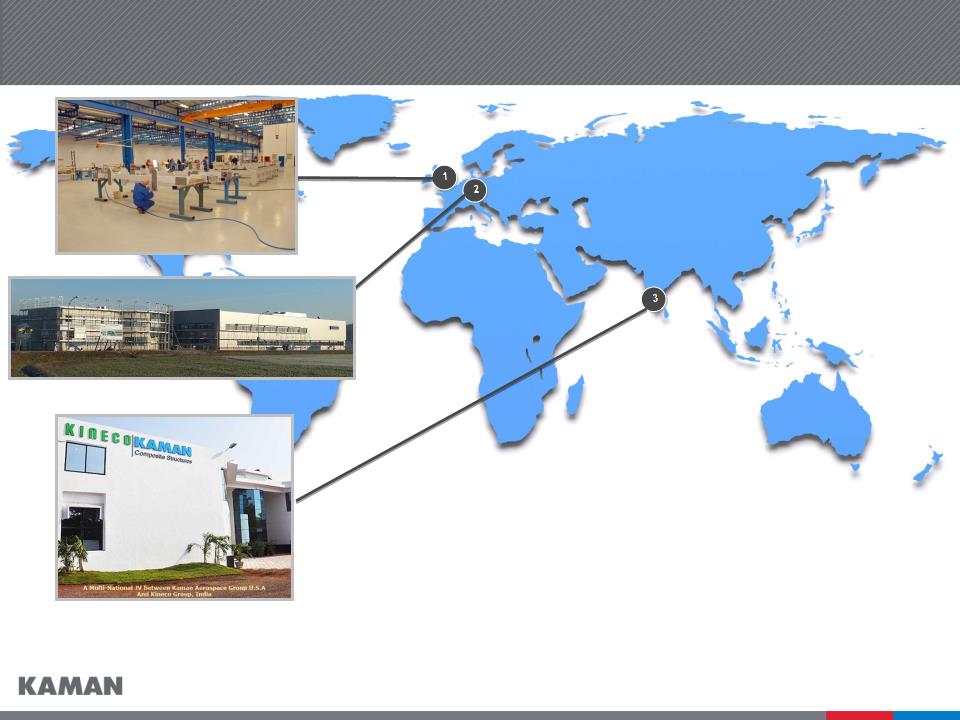
New Global Aerospace Growth Investments
1. Lancashire, UK - new tooling facility
2. Höchstadt, Germany - new bearing manufacturing facility
3. Goa, India - composites manufacturing joint venture

19
Aerospace - Impact of Defense Spending
• We believe the diversity of our defense programs positions us well
to weather potential budget cuts
to weather potential budget cuts
– Joint Programmable Fuze - under contract through 2015, foreign
demand, continued sole source
demand, continued sole source
– A-10 re-wing program for Boeing - under contract through
shipset 173, 72% of the total program
shipset 173, 72% of the total program
– AH-1Z integrated fuselage for Bell/USMC - new business
• Improved commercial balance provides more stable Aerospace
revenue base
revenue base

20
New Zealand SH-2G(I)
• Have entered into a $120 million
contract with the New Zealand
Ministry of Defence for the sale of
ten Kaman SH-2G(I) aircraft
contract with the New Zealand
Ministry of Defence for the sale of
ten Kaman SH-2G(I) aircraft
• Three year delivery schedule
• Work under this program has begun
and more than $20 million in
revenue was recognized in 2013
and more than $20 million in
revenue was recognized in 2013
• Program is expected to generate
$60-65 million in cash over three
years
$60-65 million in cash over three
years

21
Unmanned K-MAX®
• Kaman/Lockheed teamed to provide
an unmanned military version of the
K-MAX helicopter
an unmanned military version of the
K-MAX helicopter
• K-MAX aircraft began performing
unmanned cargo resupply missions
in Afghanistan during December
2011 and have completed more than
1,700 missions and delivered more
than 4 million pounds of cargo
unmanned cargo resupply missions
in Afghanistan during December
2011 and have completed more than
1,700 missions and delivered more
than 4 million pounds of cargo
• “It’s kind of the rock star of the
Marine Corps unmanned aviation in
the past year,” - Major Dave
Funkhouser, Unmanned Aviation
Capabilities Integration Officer, US
Marine Corps
Marine Corps unmanned aviation in
the past year,” - Major Dave
Funkhouser, Unmanned Aviation
Capabilities Integration Officer, US
Marine Corps
Photograph by Corporal Lisa Tourtelot, United States Marine Corps.

22
Aerospace - Key 2014 Operational Objectives
• Begin production in new German bearing and UK tooling facilities
• Transition start up programs to full rate production to improve cash
flow generation
flow generation
• Build on the growth and profitability of bearing and fuzing product
lines
lines
• Continue successful execution of the New Zealand SH-2(G)I contract
• Transition production of the 747-8 wing-to-body fairing program to
Kaman’s facilities from Boeing Winnipeg
Kaman’s facilities from Boeing Winnipeg
• Build upon our “One Kaman” strategy that offers customers a one stop
solution for their aerosystems needs
solution for their aerosystems needs
• Continue deployment of common ERP system across Aerosystem
business units
business units

23
Distribution
2013 Sales: $1.07 Billion
63%

24
Distribution Overview
• Industrial distribution firm with $35 billion served market via three product
platforms
platforms
– Bearings and mechanical power transmission
– Fluid power
– Automation, control and energy
• Major product categories
– Bearings
– Mechanical and electrical power transmission
– Fluid Power
– Motion control
– Automation
– Material handling
– Electrical control and power distribution
• 256 locations and 5 distribution centers
• Executing growth strategy to achieve long-term sales and profit objectives

25
Distribution Business Drivers
• The addition of hydraulic, automation and motion control products
adds content to MRO customers and meets the continued trend of
customers transitioning to higher-technology applications, sensing
equipment, energy efficiency and productivity solutions
adds content to MRO customers and meets the continued trend of
customers transitioning to higher-technology applications, sensing
equipment, energy efficiency and productivity solutions
• Manufacturers are increasing their use of national contracts to
consolidate supply of MRO goods to production facilities and are
driving compliance to its contracted suppliers
consolidate supply of MRO goods to production facilities and are
driving compliance to its contracted suppliers
• Increased municipal investment in water, wastewater, and
supporting control system infrastructure will benefit Kaman, which
has unique products to service this sector
supporting control system infrastructure will benefit Kaman, which
has unique products to service this sector
• Improved residential construction fundamentals are anticipated to
drive increased demand across numerous industries served by
Kaman
drive increased demand across numerous industries served by
Kaman

26
Distribution Strategy
• SCALE THROUGH GROWTH - Broaden and diversify product
offering organically and through acquisitions. Expand geographic
footprint to enhance position in the national accounts market
offering organically and through acquisitions. Expand geographic
footprint to enhance position in the national accounts market
• PRODUCTIVITY - Recognize benefits from organizational
realignment and implement multi-faceted technology investments
realignment and implement multi-faceted technology investments
• PROFITABILITY - Recognize sales and cost synergies from the
thirteen acquisitions completed from 2010 to 2013. Enhance margins
through new higher margin product lines, a focus on pricing
management and leverage increased purchasing scale
thirteen acquisitions completed from 2010 to 2013. Enhance margins
through new higher margin product lines, a focus on pricing
management and leverage increased purchasing scale
27
Product Platform Transformation
Bearings and Mechanical Power Transmission
Fluid Power
Automation, Control and Energy
2009
Sales = $630 million
2013
Sales = $1,068 million
Sales increase since 2009
Automation, Control and Energy ~ 200%
Fluid Power ~ 100%
Bearings and Power Transmission ~ 40%

28
Distribution Major Product Platforms
|
Product Platform
|
Bearings & Mechanical
Power Transmission (BPT)
|
Fluid Power
|
Automation, Control and
Energy (ACE) |
|
% of 2013 Sales
(approximate)
|
61%
|
14%
|
25%
|
|
Market Size
|
$12.5 Billion
|
$7.2 Billion
|
$15.0 Billion
|
|
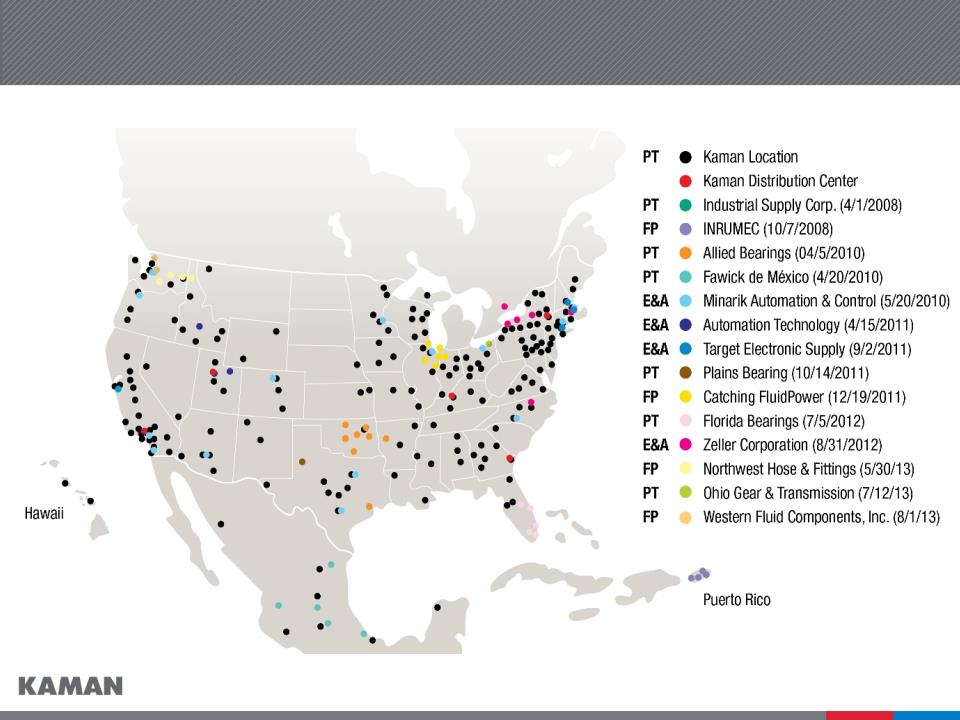
Acquisitions since 2008
|
• Industrial Supply Corp.
• Allied Bearings Supply
• Plains Bearing
• Fawick de Mexico
• Florida Bearings
• Ohio Gear and Transmission
|
• Catching Fluidpower
• INRUMEC
• Northwest Hose
• Western Fluid Comp.
• B.W. Rogers
|
• Zeller
• Minarik
• Automation Technology
• Target Electronic Supply
• B.W. Rogers
|
|
Major Suppliers
|
29
Executing Strategy and Building Network

30
Distribution ERP Technology Investments
• Technology investments will consolidate twelve disparate Distribution
systems and numerous sub-systems to one state of the art enterprise
-wide business system
systems and numerous sub-systems to one state of the art enterprise
-wide business system
• Infor Distribution SX.e is the leading distribution ERP solution
Benefits
• CRM tool will provide critical info to sales teams driving higher sales
volume
volume
• Reduced transaction and response times will drive productivity gains
– Quotes and orders
– Support expediting requirements
– Electronic document exchange with customers and suppliers
• Ability to consolidate and analyze purchasing requirements will lower
procurement costs and increase profitability
procurement costs and increase profitability

31
• Our largest acquisition in Distribution, closed April 25, 2014
• Broad line distributor of fluid power and automation products
• Sales of approximately $100 million
• Adds exposure in steel, life sciences, food & beverage, power
generation and automotive industries
generation and automotive industries
• Strong product knowledge and experience in all Parker fluid power
products
products
• The addition of sales from B.W. Rogers makes Kaman the sixth largest
fluid power distributor in the U.S. (currently ninth largest)
fluid power distributor in the U.S. (currently ninth largest)
• Added twelve ParkerStores to Kaman’s network bringing the total to
thirty
thirty
• Geographically located in areas where KIT was under-represented
B.W. Rogers Acquisition - Overview
32
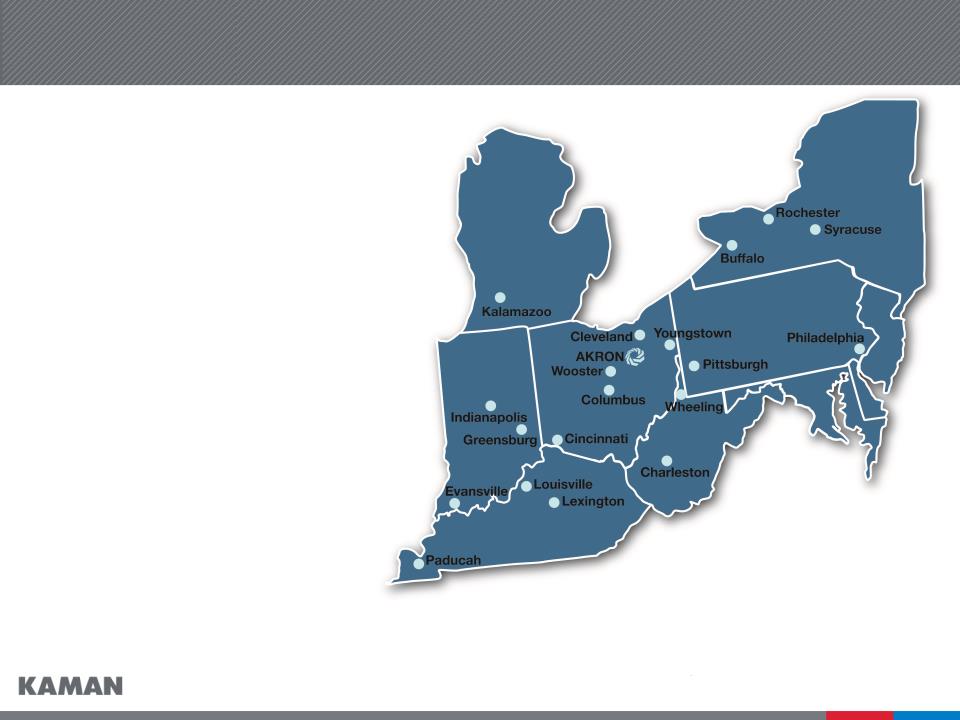
B.W. Rogers - Store Locations
• Twenty-one locations across
seven states
seven states
• Headquartered in Akron, OH

33
B.W. Rogers and Parker
• Tri-motion Parker
Distributor
• Twelve ParkerStores
• The acquisition creates a contiguous Parker territory for Kaman from
Pennsylvania to Chicago
Pennsylvania to Chicago
• A Parker distributor since 1947, one of their longest standing distributors

34
Distribution - Key 2014 Operational Objectives
• Increase organic growth, capitalizing on expense leverage, through
increased customer engagement and broader product offering across
our three business platforms
increased customer engagement and broader product offering across
our three business platforms
• Integrate the B.W. Rogers acquisition
• Begin deployment of new ERP system that will consolidate disparate
systems and drive significant productivity enhancements
systems and drive significant productivity enhancements
• Leverage strong supplier relationships to increase sales of higher
margin product lines
margin product lines
• Continue to pursue accretive acquisitions and gain additional sales
and cost synergies from the twelve acquisitions completed since 2010
and cost synergies from the twelve acquisitions completed since 2010

35
Kaman Investment Merits
• A Leading Market Position in Both Business Segments
• Continued Focus on Earnings Growth, Cash Flow Generation and
Strengthening Competitive Position
Strengthening Competitive Position
• Strong Liquidity and Conservative Financial Profile
• Disciplined and Focused Acquisition Strategy
• Experienced Management Team

36
Financial Information
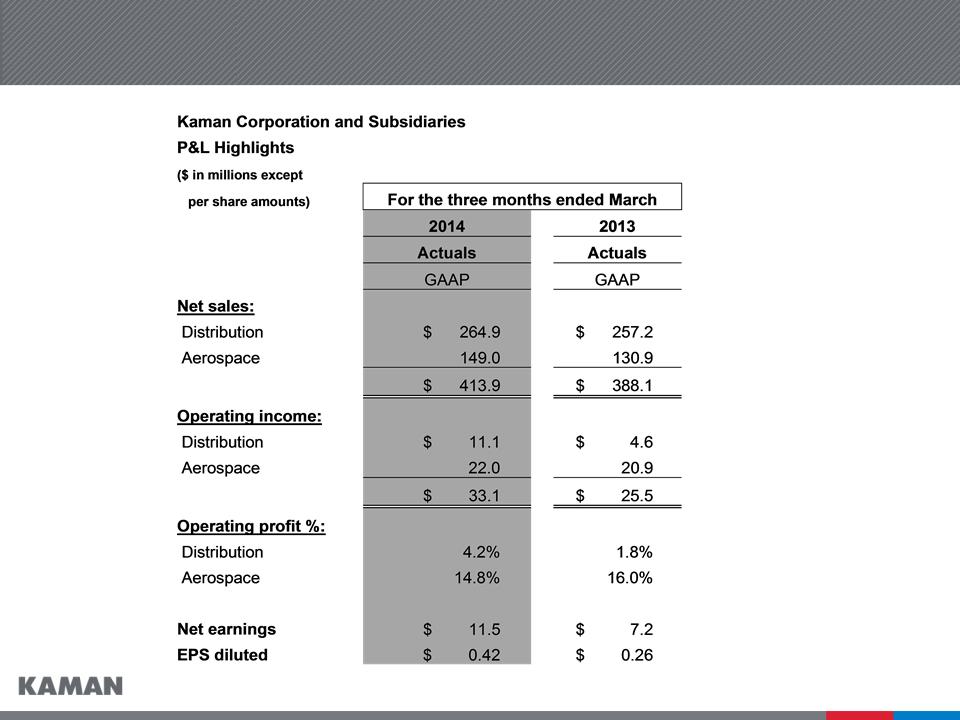
37
Financial Highlights - Q1 2014
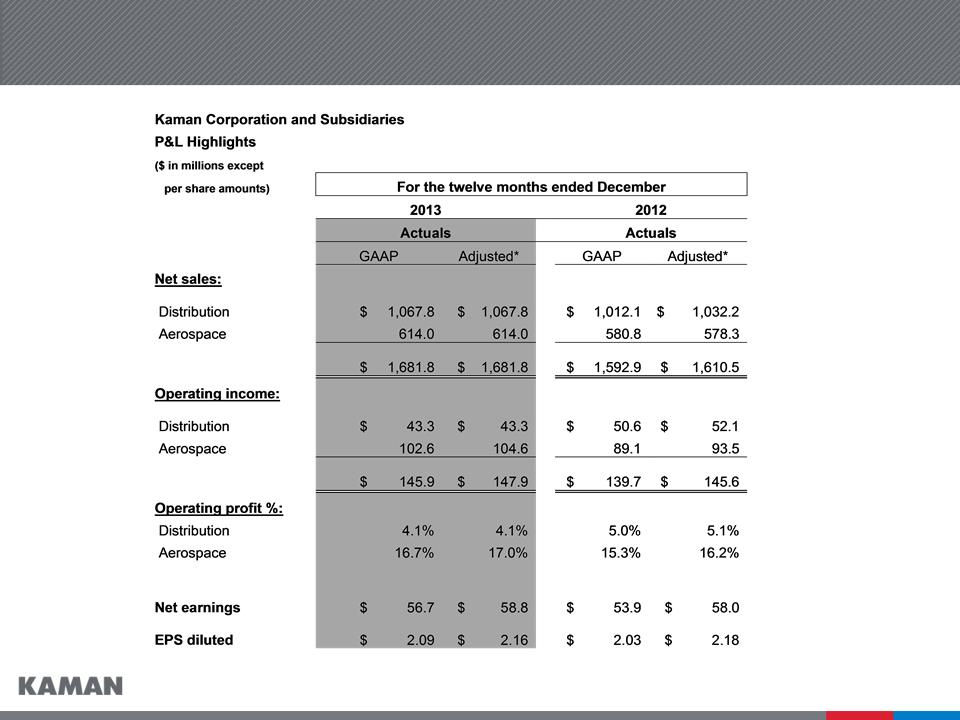
38
Financial Highlights - Full Year 2013

39
Balance Sheet, Capital Factors, and Cash Flow Items
|
(In Millions)
|
As of 3/28/14
|
As of 12/31/13
|
As of 12/31/12
|
|
Cash and Cash Equivalents
|
$ 8.0
|
$ 10.4
|
$ 16.6
|
|
Notes Payable and Long-term Debt
|
$ 291.6
|
$ 275.2
|
$ 259.6
|
|
Shareholders’ Equity
|
$ 521.6
|
$ 511.3
|
$ 420.2
|
|
Debt as % of Total Capitalization
|
35.9%
|
35.0%
|
38.2%
|
|
Capital Expendituresa
|
$ 11.7
|
$ 40.9
|
$ 32.6
|
|
Depreciation & Amortizationa
|
$ 8.2
|
$ 31.9
|
$ 28.4
|
|
Free Cash Flow*a
|
$ 23.6
|
$ 21.6
|
$ 52.0
|
)
(
aYTD 3/28/2014

40
Appendix I
Non-GAAP Reconciliations
Non-GAAP Reconciliations
41
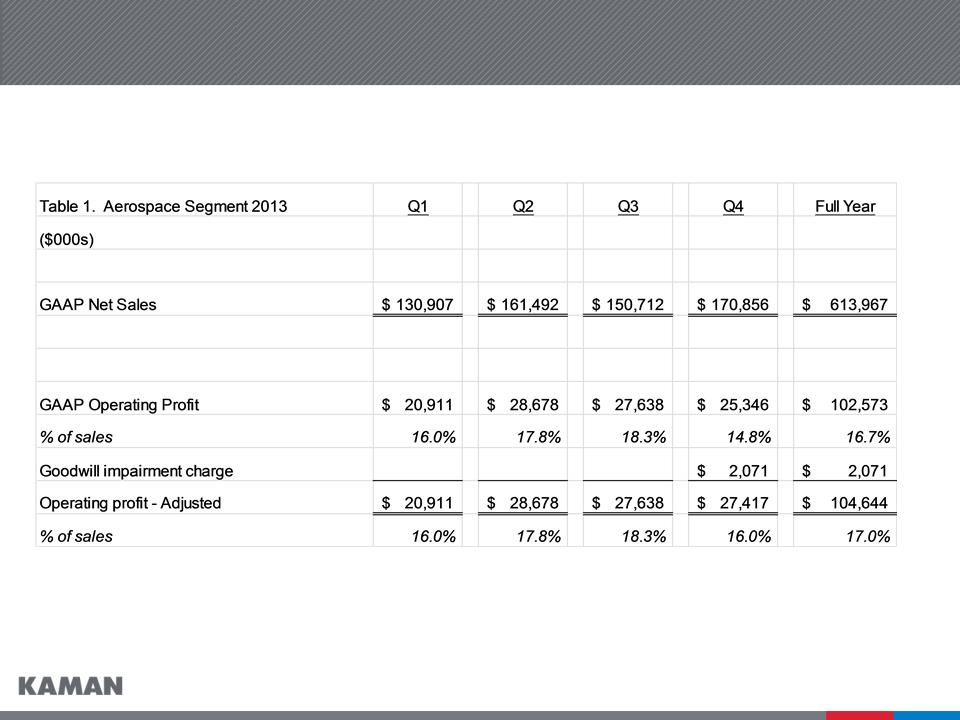
Reconciliation of Non-GAAP Financial Information

42
Reconciliation of Non-GAAP Financial Information

43
Reconciliation of Non-GAAP Financial Information

44
Reconciliation of Non-GAAP Financial Information

45
Reconciliation of Non-GAAP Financial Information

46
Reconciliation of Non-GAAP Financial Information

47
Reconciliation of Non-GAAP Financial Information