Attached files
| file | filename |
|---|---|
| 8-K - 8-K - GAIN Capital Holdings, Inc. | q12014earningsrelease8-k.htm |
| EX-99.1 - PRESS RELEASE - GAIN Capital Holdings, Inc. | earningsreleaseq12014.htm |

Q1 2014 Financial and Operating Results May 8, 2014
Special Note Regarding Forward-Looking Information In addition to historical information, this presentation contains "forward-looking" statements that reflect management's expectations for the future. The forward-looking statements contained in this presentation include, without limitation, statements relating to GAIN Capital's expectations regarding the opportunities and strengths of the combined company created by the combination of GAIN and GFT, anticipated cost and revenue synergies as well as expected growth in financial and operating metrics, the strategic rationale for the business combination, including expectations regarding product offerings, growth opportunities, value creation, and financial strength. A variety of important factors could cause results to differ materially from such statements. These factors include, but are not limited to, the actions of both current and potential new competitors, fluctuations in market trading volumes, financial market volatility, evolving industry regulations, including changes in regulation of futures companies, errors or malfunctions in our systems or technology, rapid changes in technology, effects of inflation, customer trading patterns, the success of our products and service offerings, our ability to continue to innovate and meet the demands of our customers for new or enhanced products, our ability to successfully integrate assets and companies we have acquired, including the successful integration of GFT, our ability to effectively compete in the OTC products and futures industries, changes in tax policy or accounting rules, fluctuations in foreign exchange rates and commodity prices, adverse changes or volatility in interest rates, as well as general economic, business, credit and financial market conditions, internationally or nationally, and our ability to continue paying a quarterly dividend in light of future financial performance and financing needs. The forward-looking statements included herein represent GAIN Capital's views as of the date of this presentation. GAIN Capital undertakes no obligation to revise or update publicly any forward-looking statement for any reason unless required by law. 2
First Quarter 2014 Overview • Continued growth in operating metrics amid challenging trading conditions • Strong growth in commission-based business • Successful execution of M&A strategy with three acquisitions year-to-date • Significant progress on GFT expense synergies and focus on overall expense management 3

1st Quarter 2014 Financial and Operating Results • Financial Results • Net revenue: $75.8 million • Adjusted EBITDA(1): $9.5 million • Net income: $1.6 million • EPS (Diluted): $0.04 • Adjusted EPS (Diluted)(2): $0.08 • Operating Metrics(3) • Retail volume: $566.3 billion (ADV: $9.0 billion) • Institutional volume: $1,348.4 billion (ADV: $21.4 billion) • GTX volume: $1,212.4 billion (ADV: $19.2 billion) • Futures contracts: 1.6mm • Funded accounts: 134,685 (1) Adjusted EBITDA is a non-GAAP financial measure that represents our earnings before interest, taxes, depreciation, amortization, restructuring, acquisition and integration expenses and other costs. A reconciliation of net income to adjusted EBITDA is available in the appendix to this presentation. (2) Adjusted EPS is a non-GAAP financial measure that represents net income per share excluding the impact of restructuring acquisition and integration expenses and other costs. A reconciliation of GAAP EPS to adjusted EPS is available in the appendix to this presentation. (3) Definitions for all our operating metrics are available in the appendix to this presentation. 4

Market Conditions • Currency volatility levels at 5-year lows with downward trend continuing through April 2014 Source: JP Morgan G7 Volatility Index 5 2009 2010 2011 2012 2013 2014 - 5 10 15 20 25

Retail OTC • Growth in funded accounts continues with 35% year- over-year growth and 4% growth YTD • Strong client engagement • Q1 2014 average daily volume: $9.0 billion • Up 15% compared to Q4 2013 • Up 34% compared to Q1 2013 • Sales channel mix continues trend toward even volume split between direct and indirect Note: Definitions for all our operating metrics are available in the appendix to this presentation. 6
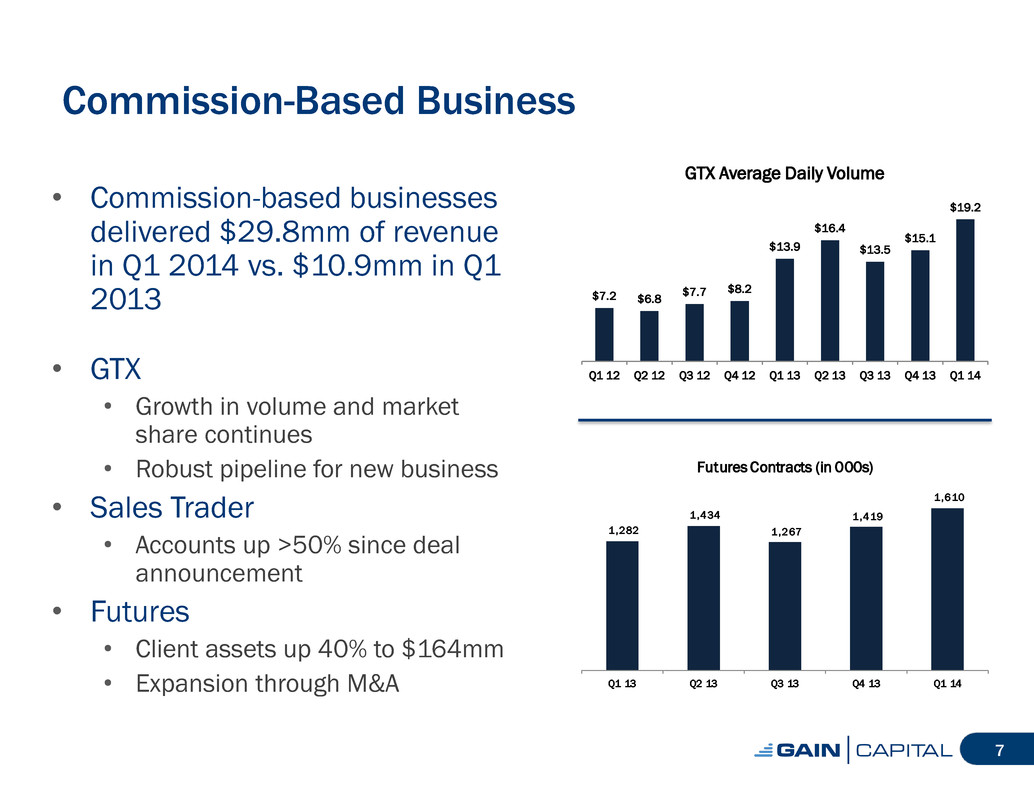
Commission-Based Business • Commission-based businesses delivered $29.8mm of revenue in Q1 2014 vs. $10.9mm in Q1 2013 • GTX • Growth in volume and market share continues • Robust pipeline for new business • Sales Trader • Accounts up >50% since deal announcement • Futures • Client assets up 40% to $164mm • Expansion through M&A 7 $7.2 $6.8 $7.7 $8.2 $13.9 $16.4 $13.5 $15.1 $19.2 Q1 12 Q2 12 Q3 12 Q4 12 Q1 13 Q2 13 Q3 13 Q4 13 Q1 14 GTX Average Daily Volume 1,282 1,434 1,267 1,419 1,610 Q1 13 Q2 13 Q3 13 Q4 13 Q1 14 Futures Contracts (in 000s)

Strength of Core Operating Metrics • Despite challenging trading conditions, retail metrics continue upward trend • Continuing to grow funded account base and client assets • Both organically and through M&A • Increase in both assets and accounts resulting in more trading activity from clients • Average daily volume increased 34% year-over-year • 8% quarterly growth since Q1 2013 Note: Definitions for all our operating metrics are available in the appendix to this presentation. 8 73.5 74.6 82.4 85.1 100.0 97.0 127.3 129.4 134.7 Q1 12 Q2 12 Q3 12 Q4 12 Q1 13 Q2 13 Q3 13 Q4 13 Q1 14 Funded Accounts (in 000s) $326 $320 $427 $446 $457 $477 $684 $739 $806 Q1 12 Q2 12 Q3 12 Q4 12 Q1 13 Q2 13 Q3 13 Q4 13 Q1 14 Client Assets (in millions) $5.9 $5.2 $4.3 $4.5 $6.7 $7.1 $6.0 $7.8 $9.0 Q1 12 Q2 12 Q3 12 Q4 12 Q1 13 Q2 13 Q3 13 Q4 13 Q1 14 Average Daily Retail Volume (in billions)
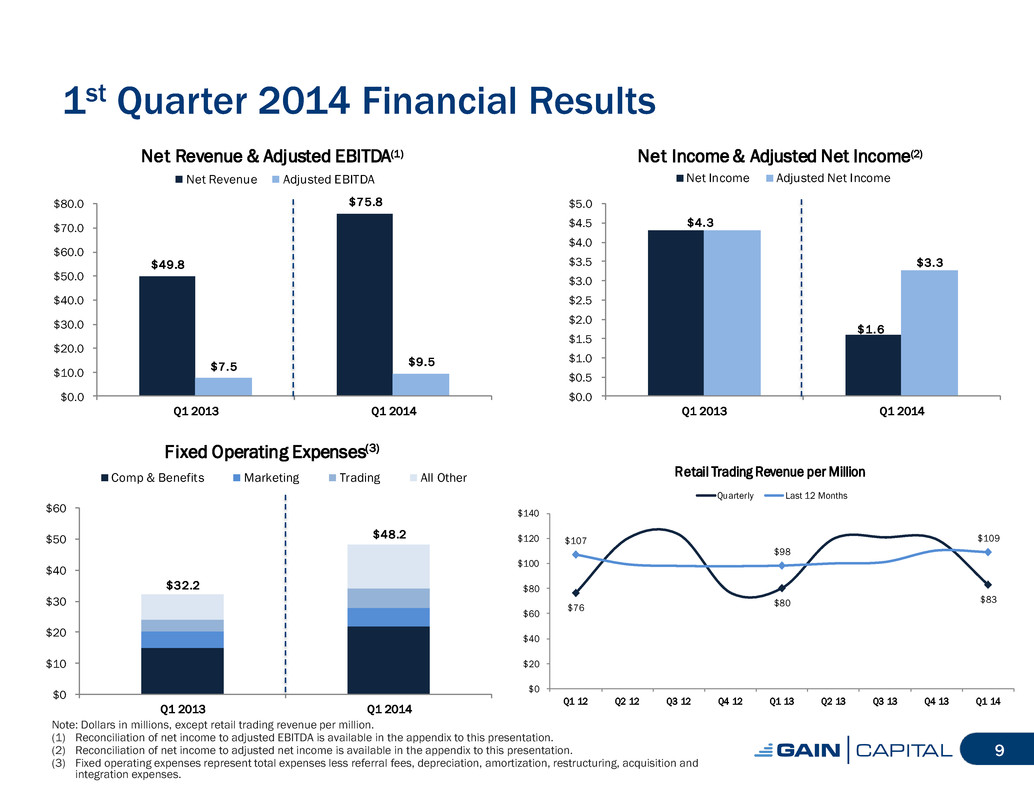
$4.3 $1.6 $3.3 $0.0 $0.5 $1.0 $1.5 $2.0 $2.5 $3.0 $3.5 $4.0 $4.5 $5.0 Q1 2013 Q1 2014 Net Income & Adjusted Net Income(2) Net Income Adjusted Net Income $32.2 $48.2 $0 $10 $20 $30 $40 $50 $60 Q1 2013 Q1 2014 Fixed Operating Expenses(3) Comp & Benefits Marketing Trading All Other $49.8 $75.8 $7.5 $9.5 $0.0 $10.0 $20.0 $30.0 $40.0 $50.0 $60.0 $70.0 $80.0 Q1 2013 Q1 2014 Net Revenue & Adjust d EBITDA(1) Net Revenue Adjusted EBITDA 1st Quarter 2014 Financial Results Note: Dollars in millions, except retail trading revenue per million. (1) Reconciliation of net income to adjusted EBITDA is available in the appendix to this presentation. (2) Reconciliation of net income to adjusted net income is available in the appendix to this presentation. (3) Fixed operating expenses represent total expenses less referral fees, depreciation, amortization, restructuring, acquisition and integration expenses. 9 $76 $80 $83 $107 $98 $109 $0 $20 $40 $60 $80 $100 $120 $140 Q1 12 Q2 12 Q3 12 Q4 12 Q1 13 Q2 13 Q3 13 Q4 13 Q1 14 Retail Trading Revenue per Million Quarterly Last 12 Months
Progress on GFT Synergies • Successfully reduced cost base by more than $4 million (on a run- rate basis) during the quarter • Headcount reductions completed • Consolidated marketing spend • Streamlined market data and IT infrastructure • Office space consolidation • Reduced administrative expenses • Expect to achieve an incremental $4 million reduction in the expense base in Q2 2014 • On track to achieve annual run-rate expense savings of $35-45 million by Q4 2014 10

Return of Capital • Return of capital to shareholders • $0.05 per share quarterly dividend approved • Record date: June 12, 2014 • Payment date: June 20, 2014 • Share repurchase • Program remains in place and will continue to be opportunistic 11

YTD 2014 Acquisitions • Futures • Announced acquisition of 55% of both Global Asset Advisors and Top Third Ag Marketing in early March • Global Asset Advisors (“GAA”) • Strengthens direct futures offering • President of GAA appointed head of GAIN’s futures division • Top Third Ag Marketing • Provides new client base – agricultural hedgers • Expect to grow futures topline by more than 50% and increase EBITDA margins • Galvan Research • Announced acquisition in early April • Provides CFD advisory and trade recommendations • Continues GAIN’s strategy of diversification into more commission-based revenue streams • Future M&A pipeline remains robust with several transactions in various stages of negotiations 12

Closing Remarks • Strong operating metrics amid challenging trading conditions • Growth in operating metrics to drive financial performance when trading conditions improve • Diversification of revenue streams continues with larger percentage of top-line generated from commission-based businesses • M&A remains a key strategy for growth and we continue to explore a number of opportunities across various industries and products 13
14 Appendix
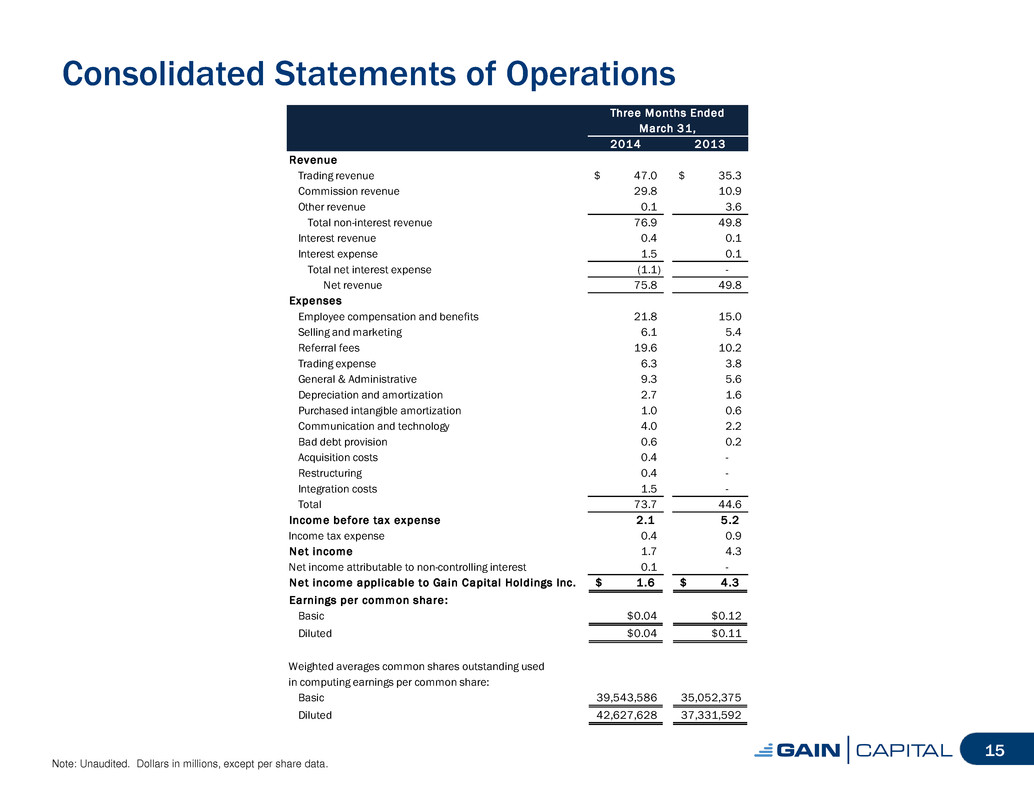
Consolidated Statements of Operations Note: Unaudited. Dollars in millions, except per share data. 15 Three Months Ended Twelve Months Ended March 31, March 31, 2014 2013 Revenue Trading revenue 47.0$ 35.3$ Commission revenue 29.8 10.9 Other revenue 0.1 3.6 Total non-interest revenue 76.9 49.8 Interest revenue 0.4 0.1 Interest expense 1.5 0.1 Total net interest expense (1.1) - Net revenue 75.8 49.8 Expenses Employee compensation and benefits 21.8 15.0 Selling and marketing 6.1 5.4 Referral fees 19.6 10.2 Trading expense 6.3 3.8 General & Administrative 9.3 5.6 Depreciation and amortization 2.7 1.6 Purchased intangible amortization 1.0 0.6 Communication and technology 4.0 2.2 Bad debt provision 0.6 0.2 Acquisition costs 0.4 - Restructuring 0.4 - Integration costs 1.5 - Total 73.7 44.6 Income before tax expense 2.1 5 .2 Income tax expense 0.4 0.9 Net income 1.7 4.3 Net income attributable to non-controlling interest 0.1 - Net income applicable to Gain Capital Holdings Inc. 1.6$ 4 .3$ Earnings per common share : Basic $0.04 $0.12 Diluted $0.04 $0.11 Weighted averages common shares outstanding used in computing earnings per common share: Basic 39,543,586 35,052,375 Diluted 42,627,628 37,331,592
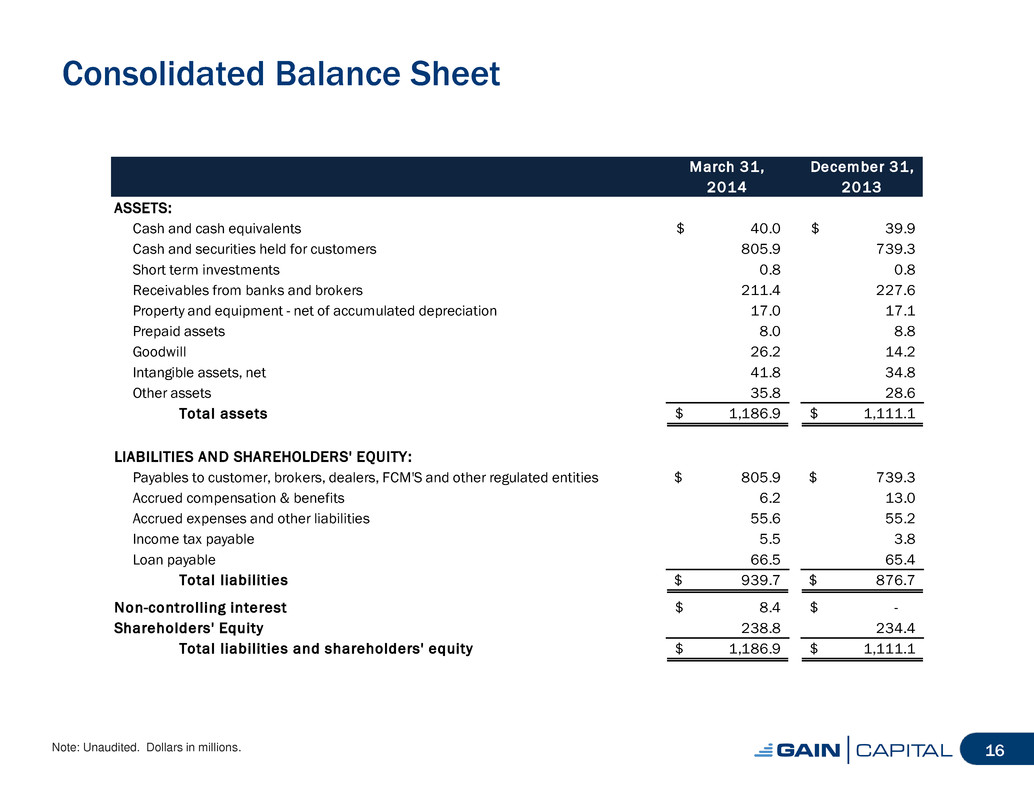
Consolidated Balance Sheet Note: Unaudited. Dollars in millions. 16 March 31, December 31, 2014 2013 ASSETS: Cash and cash equivalents 40.0$ 39.9$ Cash and securities held for customers 805.9 739.3 Short term investments 0.8 0.8 Receivables from banks and brokers 211.4 227.6 Property and equipment - net of accumulated depreciation 17.0 17.1 Prepaid assets 8.0 8.8 Goodwill 26.2 14.2 Intangible assets, net 41.8 34.8 Other assets 35.8 28.6 Total assets 1,186.9$ 1,111.1$ LIABILITIES AND SHAREHOLDERS' EQUITY: Payables to customer, brokers, dealers, FCM'S and other regulated entities 805.9$ 739.3$ Accrued compensation & benefits 6.2 13.0 Accrued expenses and other liabilities 55.6 55.2 Income tax payable 5.5 3.8 Loan payable 66.5 65.4 Total l iabilities 939.7$ 876.7$ Non-controlling interest 8.4$ -$ Shareholders' Equity 238.8 234.4 Total l iabilities and shareholders' equity 1,186.9$ 1,111.1$

Current Liquidity Note: Dollars in millions. (1) Reflects cash that would be received upon the liquidation of short term investments. (2) Reflects cash that would be received from brokers following the close-out of all open positions. (3) The convertible senior note incorporates the unamortized discount 17 As of 3/31/14 12/31/13 Cash and cash equivalents $40.0 $39.9 Cash and securities held for customers 805.9 739.3 Short term investments(1) 0.8 0.8 Receivables from banks and brokers(2) 211.4 227.6 Total Operating Cash $1,058.1 $1,007.6 Less: Cash and securities held for customers (805.9) (739.3) Free Operating Cash $252.2 $268.3 Less: Minimum regulatory capital requirements (71.6) (85.7) Less: Convertible Senior Notes(3) (80.0) (80.0) Free Cash Available $100.6 $102.6
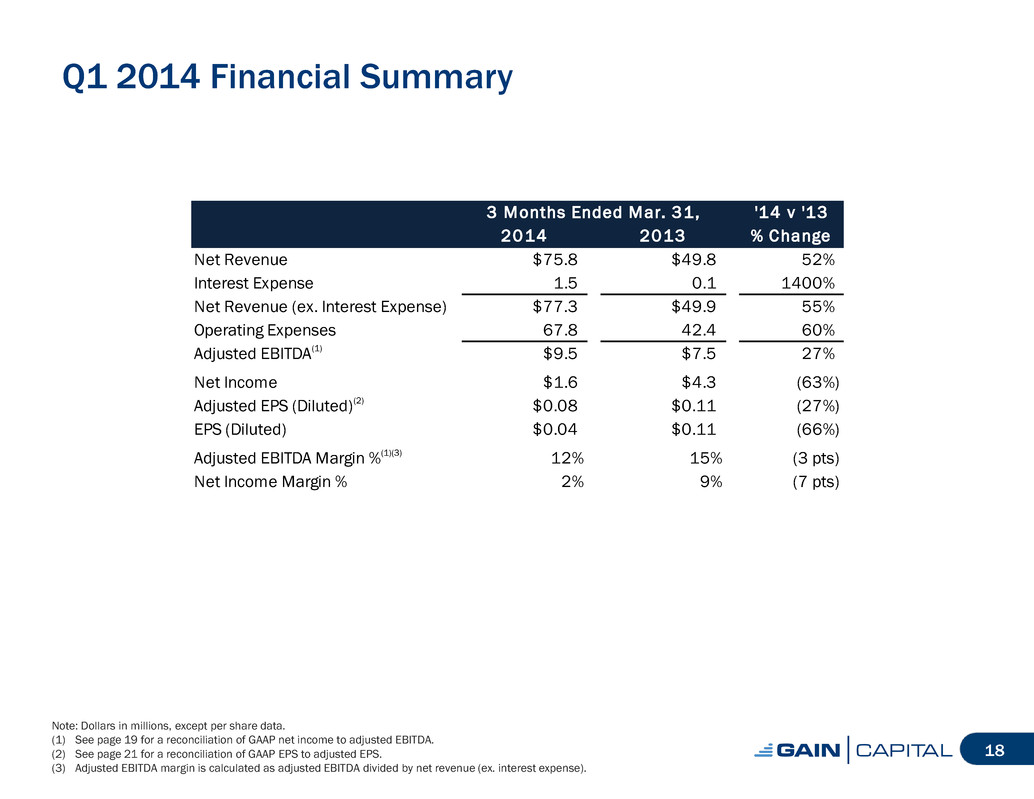
Q1 2014 Financial Summary Note: Dollars in millions, except per share data. (1) See page 19 for a reconciliation of GAAP net income to adjusted EBITDA. (2) See page 21 for a reconciliation of GAAP EPS to adjusted EPS. (3) Adjusted EBITDA margin is calculated as adjusted EBITDA divided by net revenue (ex. interest expense). 18 3 Months Ended Mar. 31, '14 v '13 2014 2013 % Change Net Revenue $75.8 $49.8 52% Interest Expense 1.5 0.1 1400% Net Revenue (ex. Interest Expense) $77.3 $49.9 55% Operating Expenses 67.8 42.4 60% Adjusted EBITDA(1) $9.5 $7.5 27% Net Income $1.6 $4.3 (63%) Adjusted EPS (Diluted)(2) $0.08 $0.11 (27%) EPS (Diluted) $0.04 $0.11 (66%) Adjusted EBITDA Margin %(1)(3) 12% 15% (3 pts) Net Income Margin % 2% 9% (7 pts)
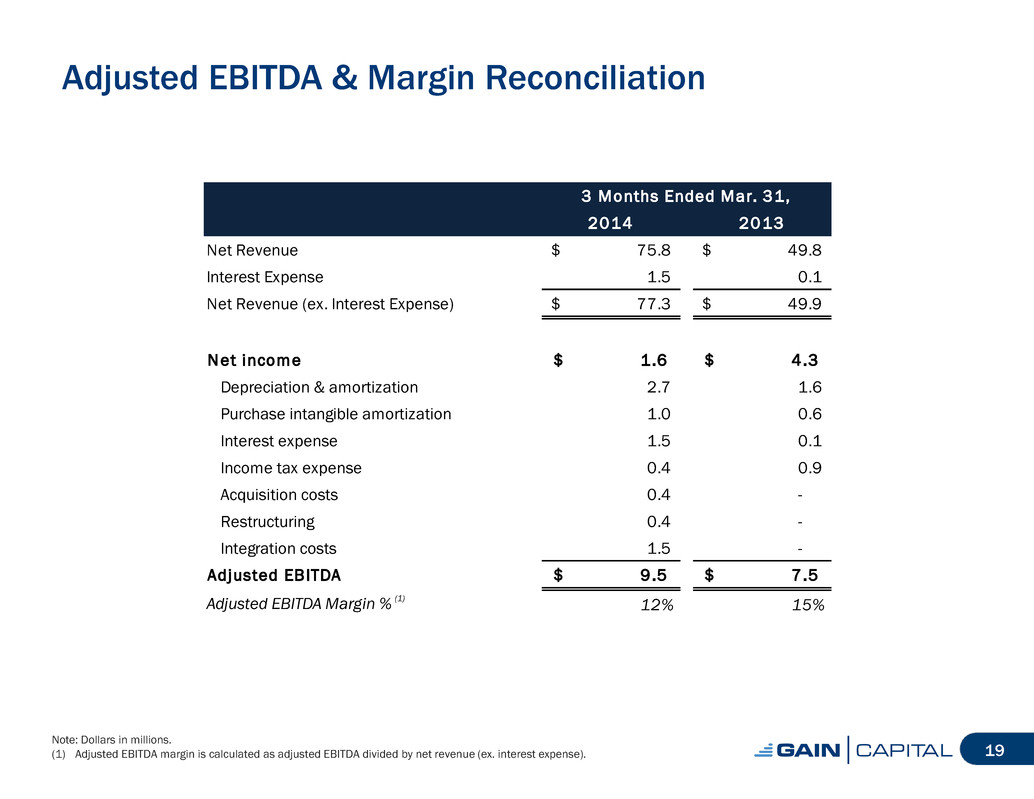
Adjusted EBITDA & Margin Reconciliation Note: Dollars in millions. (1) Adjusted EBITDA margin is calculated as adjusted EBITDA divided by net revenue (ex. interest expense). 19 3 Months Ended Mar. 31, 12 Months Ended Dec. 31, 2014 2013 Net Revenue 75.8$ 49.8$ Interest Expense 1.5 0.1 Net Revenue (ex. Interest Expense) 77.3$ 49.9$ Net income 1.6$ 4 .3$ Depreciation & amortization 2.7 1.6 Purchase intangible amortization 1.0 0.6 Interest expense 1.5 0.1 Income tax expense 0.4 0.9 Acquisition costs 0.4 - Restructuring 0.4 - Integration costs 1.5 - Adjusted EBITDA 9.5$ 7 .5$ Adjusted EBITDA Margin % (1) 12% 15%
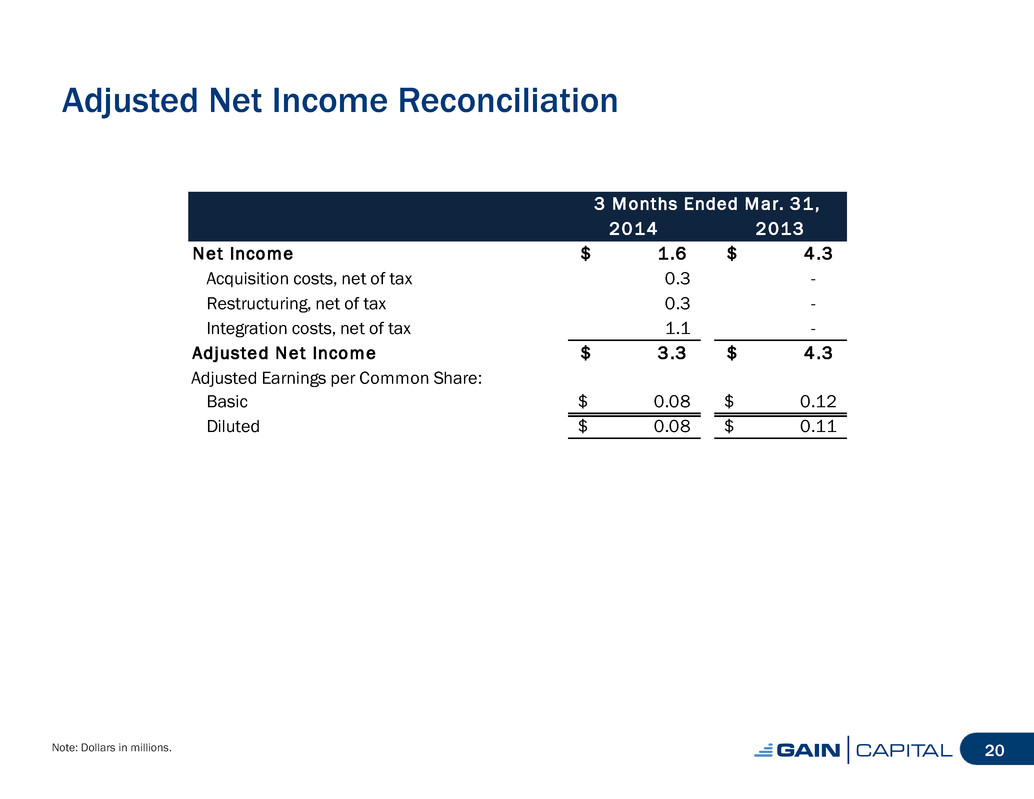
Adjusted Net Income Reconciliation Note: Dollars in millions. 20 3 Months Ended Mar. 31, 12 Months Ended Dec. 31, 2014 2013 et Income 1.6$ 4 .3$ Acquisition costs, net of tax 0.3 - Restructuring, net of tax 0.3 - Integration costs, net of tax 1.1 - Adjusted Net Income 3.3$ 4 .3$ Adjusted Earnings per Common Share: Basic 0.08$ 0.12$ Diluted 0.08$ 0.11$

Adjusted EPS Reconciliation 21 3 Months Ended Mar. 31, 12 Months Ended Dec. 31, 2014 2013 GAAP Earnings per Share (Diluted) 0.04$ 0.11$ Restructuring & Other items 0.04 - Adjusted Earnings per Share (Diluted) 0.08$ 0 .11$
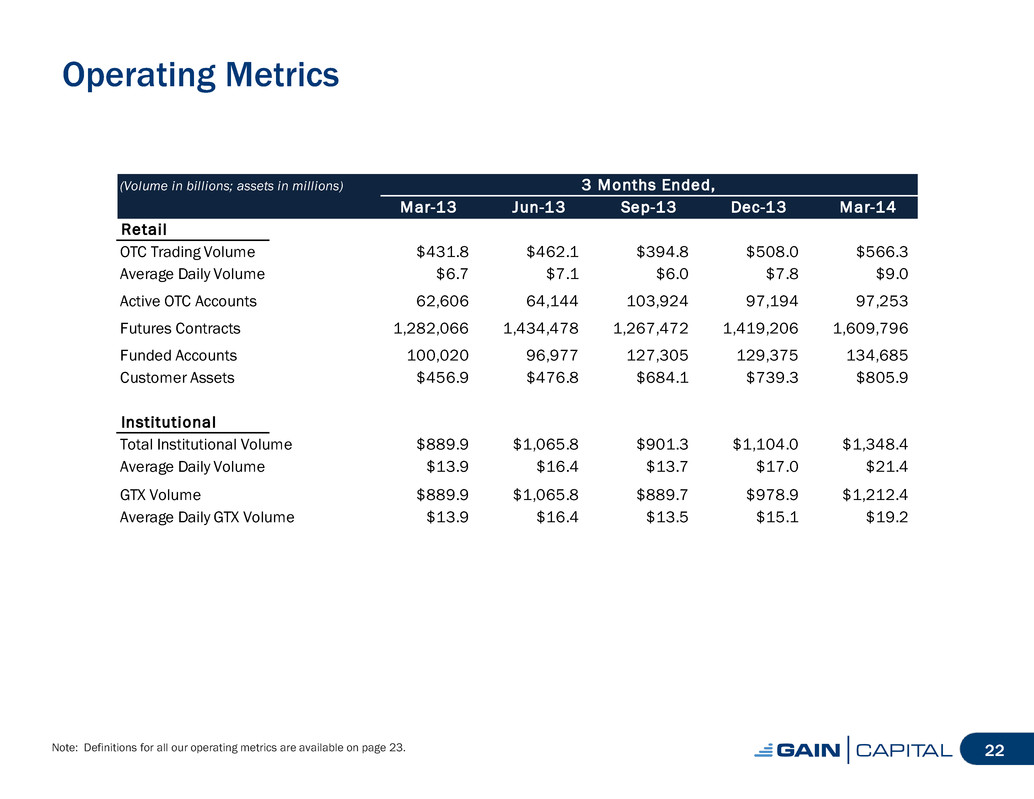
Operating Metrics Note: Definitions for all our operating metrics are available on page 23. 22 (Volume in billions; assets in millions) 3 Months Ended, Mar-13 Jun-13 Sep-13 Dec-13 Mar-14 Retail OTC Trading Volume $431.8 $462.1 $394.8 $508.0 $566.3 Average Daily Volume $6.7 $7.1 $6.0 $7.8 $9.0 Active OTC Accounts 62,606 64,144 103,924 97,194 97,253 Futures Contracts 1,282,066 1,434,478 1,267,472 1,419,206 1,609,796 Funded Accounts 100,020 96,977 127,305 129,375 134,685 Customer Assets $456.9 $476.8 $684.1 $739.3 $805.9 Institutional Total Institutional Volume $889.9 $1,065.8 $901.3 $1,104.0 $1,348.4 Average Daily Volume $13.9 $16.4 $13.7 $17.0 $21.4 GTX Volume $889.9 $1,065.8 $889.7 $978.9 $1,212.4 Average Daily GTX Volume $13.9 $16.4 $13.5 $15.1 $19.2

Definition of Metrics • Funded Accounts • Retail accounts who maintain a cash balance • Active OTC Accounts • Retail accounts who executed a transaction during a given period • Trading Volume • Represents the U.S. dollar equivalent of notional amounts traded • Futures Contracts • Represents the total contracts transacted by customers of GAIN’s futures division • Customer Assets • Represents amounts due to clients, including customer deposits and unrealized gains or losses arising from open positions 23

Q1 2014 Financial and Operating Results May 8, 2014
