Attached files
| file | filename |
|---|---|
| 8-K - FORM 8-K - CAESARS HOLDINGS, INC. | d722392d8k.htm |
Exhibit 99.1

|
Sources & Uses and Pro Forma Capitalization |
| Sources & Uses |
| |||||||
| ($ in millions) | ||||||||
| % of | ||||||||
| Sources | Amount | total | ||||||
| Term Loan B7 |
$ | 1,750 | 91 | % | ||||
| Cash |
176 | 9 | % | |||||
|
|
|
|
|
|||||
| Total sources |
$ | 1,926 | 100 | % | ||||
|
|
|
|
|
|||||
| % of | ||||||||
| Uses | Amount | total | ||||||
| Repay 2015 Senior Notes |
$ | 792 | (1) | 41 | % | |||
| Repay 2015 Second Lien Notes |
215 | 11 | % | |||||
| Repay Term Loan B1-B3 |
29 | 2 | % | |||||
| Repay Term Loan B4 |
400 | 21 | % | |||||
| Fees to Consenting Lenders |
50 | 3 | % | |||||
| Paydown to Consenting Lenders and/or B4 Lenders |
400 | 21 | % | |||||
| Estimated Fees, Expenses and OID |
40 | 2 | % | |||||
|
|
|
|
|
|||||
| Total uses |
$ | 1,926 | 100 | % | ||||
|
|
|
|
|
|||||
| CEOC Pro Forma Capitalization |
| |||||||||||
| ($ in millions) | ||||||||||||
| As of December 31, 2013 | ||||||||||||
| Pro Forma (2) | Adjustments | Adjusted | ||||||||||
| Capitalization |
||||||||||||
| Cash and Cash Equivalents |
$ | 3,200 | (3) | (176 | ) | $ | 3,024 | |||||
| Revolver |
— | — | ||||||||||
| Term Loans B1-B3 |
29 | (29 | ) | — | ||||||||
| Term Loan B4 |
960 | (400 | ) | 560 | ||||||||
| Term Loan B5 |
992 | (116 | )(4) | 876 | ||||||||
| Term Loan B6 |
2,432 | (284 | )(4) | 2,148 | ||||||||
| New Term Loan B7 |
— | 1,750 | 1,750 | |||||||||
|
|
|
|
|
|
|
|||||||
| Total Bank Debt |
$ | 4,413 | $ | 5,334 | ||||||||
| Other First Lien Debt |
6,362 | — | 6,362 | |||||||||
|
|
|
|
|
|
|
|||||||
| Total First Lien Debt |
$ | 10,774 | $ | 11,695 | ||||||||
| Senior Lien Notes due 2015 |
215 | (215 | ) | — | ||||||||
| Other Second Lien Notes |
5,608 | — | 5,608 | |||||||||
|
|
|
|
|
|
|
|||||||
| Total Secured Debt |
$ | 16,597 | $ | 17,303 | ||||||||
| Senior Notes due 2015 |
792 | (792 | )(1) | — | ||||||||
| Other Debt |
2,015 | 2,015 | ||||||||||
|
|
|
|
|
|
|
|||||||
| Total Debt |
$ | 19,404 | $ | 19,318 | ||||||||
| LTM Adj. EBITDA - PF (5) |
$ | 1,084 | $ | 1,084 | ||||||||
| Credit Statistics |
||||||||||||
| Net First Lien Leverage |
7.0x | 8.0x | ||||||||||
| Net Secured Leverage |
12.4x | 13.2x | ||||||||||
| Total Net Leverage |
14.9x | 15.0x | ||||||||||
| (1) | Includes $428 million of the 5.625% Senior Notes due 2015 currently held by CGP. |
| (2) | Pro forma for sale of four casino properties to CGP. |
| (3) | Pro forma cash does not include certain working capital adjustments related to the sale of properties to CGP. |
| (4) | Assumes 100% consent for Term Loan B5 and B6 lenders, and 0% consent for Term Loan B4 lenders. Paydown will be allocated on a pro rata basis based on principal amounts of Term Loan B5 and B6. |
| (5) | LTM Adjusted EBITDA – Pro Forma – CEOC Restricted, as reported, less the midpoint of adjusted EBITDA guidance of $145 to $175 million for the four casino properties sold to CGP. |
|
|
Reconciliation of Net (Loss)/Income attributable to CEOC to Adjusted EBITDA |
| ($ in millions) | ||||
| 2013 | ||||
| Net loss attributable to CEOC |
($ | 2,875.5 | ) | |
| Interest expense, net of interest income |
2,129.8 | |||
| Benefit for income taxes (1) |
(680.3 | ) | ||
| Depreciation and amortization (2) |
538.6 | |||
|
|
|
|||
| EBITDA |
($ | 887.4 | ) | |
| Project opening costs, abandoned projects and development costs (3) |
$ | 67.1 | ||
| Acquisition and integration costs (4) |
13.4 | |||
| Loss on early extinguishment of debt (5) |
32.1 | |||
| Net loss attributable to noncontrolling interests, net of (distributions) (6) |
(6.7 | ) | ||
| Impairments of intangible and tangible assets (7) |
1,954.4 | |||
| Non-cash expense for stock compensation benefits (8) |
34.4 | |||
| Adjustments for recoveries from insurance claims for flood losses (9) |
— | |||
| Loss/(gain) on sale of discontinued operations (10) |
0.7 | |||
| Gain on sale on partial sale of subsidiary (11) |
(44.1 | ) | ||
| Adjustments to include 100% of Baluma S.A.’s adjusted EBITDA (12) |
9.0 | |||
| Other items (13) |
96.3 | |||
| Other adjustments for failed sale impact |
(5.6 | ) | ||
|
|
|
|||
| Adjusted EBITDA |
$ | 1,263.6 | ||
| Pro Forma adjustments related to properties (14) |
$ | 5.6 | ||
| Pro Forma adjustment for estimated cost savings yet-to-be-realized (15) |
74.8 | |||
|
|
|
|||
| LTM Adjusted EBITDA-Pro Forma |
$ | 1,344.0 | ||
| LTM Adjusted EBITDA-Pro Forma of CEOC’s unrestricted subsidiaries |
($ | 99.6 | ) | |
|
|
|
|||
| LTM Adjusted EBITDA-Pro Forma - CEOC Restricted |
$ | 1,244.4 | ||
| (1) | Amounts include the provision for income taxes related to discontinued operations of $45.5 million for the three months ended December 31, 2012, and the provision for income taxes related to discontinued operations of $0.2 million and $50.1 million for the year ended December 31, 2013 and 2012, respectively. There was no provision for income taxes related to discontinued operations for the three months ended December 31, 2013. |
| (2) | Amounts include depreciation and amortization related to discontinued operations of $9.9 million for the three months ended December 31, 2012, and depreciation and amortization related to discontinued operations of $0.2 million and $29.0 million for the year ended December 31, 2013 and 2012, respectively. There was $0.0 million depreciation and amortization related to discontinued operations for the three months ended December 31, 2013. |
| (3) | Amounts represent pre-opening costs incurred in connection with new property openings and expansion projects at existing properties, as well as any non-cash write-offs of abandoned development projects. Amounts include reserves related to the closure of Alea Leeds in March 2013, which are included in loss from discontinued operations of $15.8 million for the year ended December 31, 2013. There were no reserves related to discontinued operations for the three months ended December 31, 2013 and 2012 or for the year ended December 31, 2012. |
| (4) | Amounts include certain costs associated with acquisition and development activities and reorganization activities which are infrequently occurring costs. |
| (5) | Amounts represent the difference between the fair value of consideration paid and the book value, net of deferred financing costs, of debt retired through debt extinguishment transactions, which are capital structure-related, rather than operational-type costs. |
| (6) | Amounts represent minority owners’ share of income/(loss) from the Company’s majority-owned consolidated subsidiaries, net of cash distributions to minority owners, which is a non-cash item as it excludes any cash distributions. |
| (7) | Amounts represent non-cash charges to impair intangible and tangible assets primarily resulting from changes in the business outlook in light of economic conditions, includes the follow amounts related to discontinued operations: an impairment charge of $0.3 million for the three months ended December 31, 2013, an impairment recovery of $9.2 million for the year ended December 31, 2013, and an impairment charge of $121.8 million for the year ended December 31, 2012. There were no impairment charges related to discontinued operations for the three months ended December 31, 2012. |
| (8) | Amounts represent non-cash stock-based compensation expense related to stock options and restricted stock granted to the Company’s employees. |
| (9) | Amounts represent adjustments for insurance claims related to lost profits during the floods that occurred in 2011. |
| (10) | Amounts represent adjustments to include 100% of Baluma S.A. (Punta del Este) adjusted EBITDA as permitted under the indentures governing CEOC’s existing notes and the credit agreement governing CEOC’s senior secured credit facilities. |
| (11) | Amount represents the gain recognized on the sale of the Harrah’s St. Louis casino. |
| (12) | Amounts represent the gain recognized on the sale of 45% of Baluma S.A. (Punta del Este) to Enjoy S.A. |
| (13) | Amounts represent add-backs and deductions from EBITDA, whether permitted and/or required under the indentures governing CEOC’s existing notes and the credit agreement governing CEOC’s senior secured credit facilities, included in arriving at LTM Adjusted EBITDA-Pro Forma but not separately identified. Such add-backs and deductions include litigation awards and settlements, severance and relocation costs, sign-on and retention bonuses, permit remediation costs, gains and losses from disposals of assets, costs incurred in connection with implementing the Company’s efficiency and cost-saving programs, business optimization expenses, the Company’s insurance policy deductibles incurred as a result of catastrophic events such as floods and hurricanes, one time sales tax assessments and accruals, project start-up costs, and non-cash equity in earnings of non-consolidated affiliates (net of distributions), |
| (14) | Amounts represent the estimated annualized impact of operating results related to newly completed construction projects, combined with the estimated annualized EBITDA impact associated with properties acquired during the period. |
| (15) | Amount represents adjustments to reflect the impact of annualized run-rate cost savings and anticipated future cost savings to be realized from profitability improvement and cost-savings programs. |
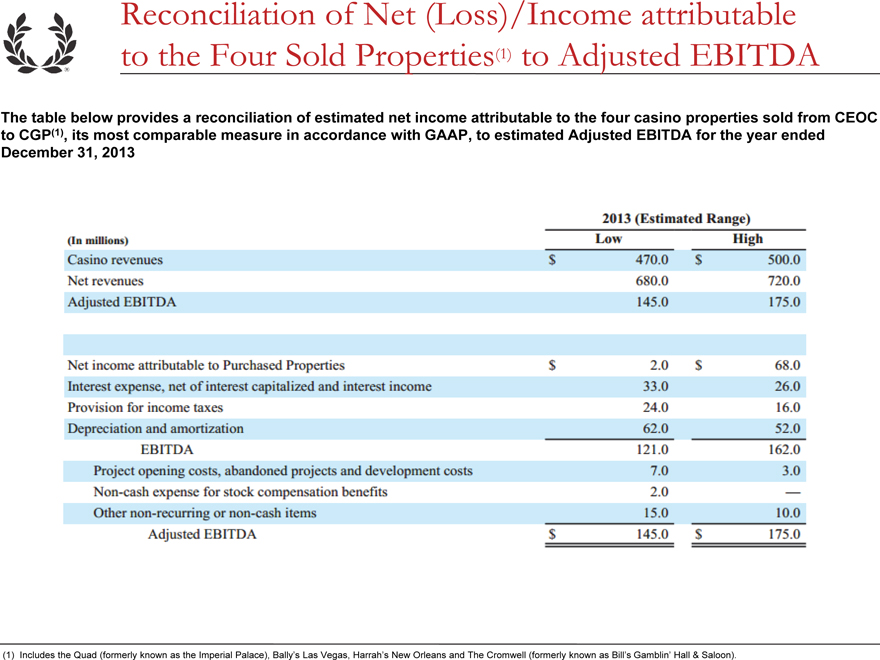
Reconciliation of Net (Loss)/Income attributable to the Four Sold Properties(1) to Adjusted EBITDA
The table below provides a reconciliation of estimated net income attributable to the four casino properties sold from CEOC to CGP(1), its most comparable measure in accordance
with GAAP, to estimated Adjusted EBITDA for the year ended December 31, 2013
(1) Includes the Quad (formerly known as the Imperial Palace), Bally’s Las Vegas,
Harrah’s New Orleans and The Cromwell (formerly known as Bill’s Gamblin’ Hall & Saloon).
(In millions)
Casino revenues
Net revenues
Adjusted EBITDA
Net income attributable to Purchased Properties
Interest expense, net of interest capitalized and interest income
Provision for income taxes
Depreciation and amortization
EBITDA
Project opening costs, abandoned projects and development costs
Non-cash expense for stock
compensation benefits
Other non-recurring or non-cash items
Adjusted EBITDA
2013 (Estimated Range)
Low
High
$ 470.0
680.0
145.0
$ 2.0
33.0
24.0
62.0
121.0
7.0
2.0
15.0
$ 145.0
$ 500.0
720.0
175.0
$ 68.0
26.0
16.0
52.0
162.0
3.0
-
10.0
$
175.0