Attached files
| file | filename |
|---|---|
| 8-K - FORM 8-K - REDWOOD TRUST INC | d715938d8k.htm |
| EX-99.1 - EX-99.1 - REDWOOD TRUST INC | d715938dex991.htm |
Exhibit 99.2

|
|
||
|
TABLE OF CONTENTS
|
| Introduction |
4 | |||
| Shareholder Letter |
5 | |||
| Quarterly Overview |
7 | |||
| Financial Insights |
16 | |||
| Balance Sheet |
16 | |||
| u GAAP Income |
25 | |||
| u Taxable Income and Dividends |
28 | |||
| u Business Segments |
30 | |||
| u Residential Mortgage Banking |
31 | |||
| u Residential Investments |
32 | |||
| u Commercial Mortgage Banking and Investments |
34 | |||
| Appendix |
37 | |||
| Redwood’s Business Strategy |
38 | |||
| Glossary |
39 | |||
| Financial Tables |
47 | |||
| THE REDWOOD REVIEW | 1ST QUARTER 2014 | 1 |
|
| ||
|
CAUTIONARY STATEMENT
|
This Redwood Review contains forward-looking statements within the meaning of the safe harbor provisions of the Private Securities Litigation Reform Act of 1995. Forward-looking statements involve numerous risks and uncertainties. Our actual results may differ from our expectations, estimates, and projections and, consequently, you should not rely on these forward-looking statements as predictions of future events. Forward-looking statements are not historical in nature and can be identified by words such as “anticipate,” “estimate,” “will,” “should,” “expect,” “believe,” “intend,” “seek,” “plan,” and similar expressions or their negative forms, or by references to strategy, plans, goals, or intentions. These forward-looking statements are subject to risks and uncertainties, including, among other things, those described in our most recent Annual Report on Form 10-K under the caption “Risk Factors.” Other risks, uncertainties, and factors that could cause actual results to differ materially from those projected are described below and may be described from time to time in reports we file with the Securities and Exchange Commission, including reports on Forms 10-K, 10-Q, and 8-K. We undertake no obligation to update or revise forward-looking statements, whether as a result of new information, future events, or otherwise.
Statements regarding the following subjects, among others, are forward-looking by their nature: (i) statements we make regarding Redwood’s business strategy and strategic focus, including statements relating to our confidence in our overall market position, strategy and long-term prospects, and our belief in the long-term efficiency of private label securitization as a form of mortgage financing; (ii) our expectation that the mortgage market and interest rates will stabilize such that our earnings will more consistently reflect our operational progress each quarter and serve as a primary valuation metric for the Company; (iii) statements we make regarding the outlook for the mortgage market, including our expectations relating to contraction in total U.S. residential loan originations in 2014 from 2013, continuing pressure on loan sale margins until industry-wide excess capacity is reduced, and the timing of future adjustments in industry capacity; (iv) statements we make regarding the near-term strategy for our residential business, including our intent to increase our market share and grow loan purchase volumes by adding sellers, ramping up our GSE product line, eventually adding other mortgage products such as non-QM loans, remaining opportunistic during the market correction, including with respect our expectations of increased volume in mortgage servicing rights for sale as originators are impacted by lower loan sale margins, and our expectations regarding our loan sale profit margins relative to our long-term target of 25-to-50 basis points (net of hedges); (v) statements we make regarding the outlook for our commercial business, including our expectations related to the volume of commercial mortgage loans maturing in 2014 and annually over the following three years, the related market opportunity this presents to us and our goal of originating $1 billion of commercial loans in 2014; (vi) statements regarding the role of private capital in reducing the government’s current outsized role in residential mortgage markets, including through an expansion of private label securitization, risk-sharing arrangements with the GSEs and eventual mortgage reform legislation; (vii) statements regarding our efforts to hedge our exposure to interest rate changes in our residential and commercial loan pipelines and the effectiveness of those hedges; (viii) statements relating to our estimate of our investment capacity (including that we estimate our investment capacity at March 31, 2014 to be approximately $110 million), our statement that we believe this level of investment capacity and liquidity should be sufficient to fund our business and investment objectives for most or all of 2014, and our expectations relating to our ability to source capital internally, by selling or financing existing investments, and externally, via the issuance of debt or equity securities or other types of securities in public or private offerings; and (ix) statements regarding our expectations and estimates relating to the characterization for income tax purposes of our dividend distributions, our expectations and estimates relating to tax accounting, tax liabilities and tax savings, and GAAP tax provisions, our estimates of REIT taxable income and TRS taxable income, and our anticipation of additional credit losses for tax
| 2 | THE REDWOOD REVIEW | 1ST QUARTER 2014 |
|
|
||
|
CAUTIONARY STATEMENT
|
purposes in future periods (and, in particular, our statement that, for tax purposes, we expect an additional $46 million of tax credit losses on residential securities we currently own to be realized over an estimated three- to five-year period).
Important factors, among others, that may affect our actual results include: general economic trends, the performance of the housing, commercial real estate, mortgage, credit, and broader financial markets, and their effects on the prices of earning assets and the credit status of borrowers; federal and state legislative and regulatory developments, and the actions of governmental authorities, including those affecting the mortgage industry or our business; developments related to the fixed income and mortgage finance markets and the Federal Reserve’s statements regarding its future open market activity and monetary policy; our exposure to credit risk and the timing of credit losses within our portfolio; the concentration of the credit risks we are exposed to, including due to the structure of assets we hold and the geographical concentration of real estate underlying assets we own; our exposure to adjustable-rate mortgage loans; the efficacy and expense of our efforts to manage or hedge credit risk, interest rate risk, and other financial and operational risks; changes in credit ratings on assets we own and changes in the rating agencies’ credit rating methodologies; changes in interest rates; changes in mortgage prepayment rates; the availability of assets for purchase at attractive prices and our ability to reinvest cash we hold; changes in the values of assets we own; changes in liquidity in the market for real estate securities and loans; our ability to finance the acquisition of real estate-related assets with short-term debt; the ability of counterparties to satisfy their obligations to us; our involvement in securitization transactions, the profitability of those transactions, and the risks we are exposed to in engaging in securitization transactions; exposure to claims and litigation, including litigation arising from our involvement in securitization transactions; whether we have sufficient liquid assets to meet short-term needs; our ability to successfully compete and retain or attract key personnel; our ability to adapt our business model and strategies to changing circumstances; changes in our investment, financing, and hedging strategies and new risks we may be exposed to if we expand our business activities; exposure to environmental liabilities; our failure to comply with applicable laws and regulations; our failure to maintain appropriate internal controls over financial reporting and disclosure controls and procedures; the impact on our reputation that could result from our actions or omissions or from those of others; changes in accounting principles and tax rules; our ability to maintain our status as a REIT for tax purposes; limitations imposed on our business due to our REIT status and our status as exempt from registration under the Investment Company Act of 1940; decisions about raising, managing, and distributing capital; and other factors not presently identified.
This Redwood Review may contain statistics and other data that in some cases have been obtained from or compiled from information made available by servicers and other third-party service providers.
| THE REDWOOD REVIEW | 1ST QUARTER 2014 | 3 |
|
| ||
|
INTRODUCTION
|
Note to Readers:
We file annual reports (on Form 10-K) and quarterly reports (on Form 10-Q) with the Securities and Exchange Commission. These filings and our earnings press releases provide information about Redwood and our financial results in accordance with generally accepted accounting principles (GAAP). We urge you to review these documents, which are available through our website, www.redwoodtrust.com.
This document, called The Redwood Review, is an additional format for providing information about Redwood through a discussion of our GAAP financial results, as well as other metrics, such as taxable income. Supplemental information is also provided in the Financial Tables in this Review to facilitate more detailed understanding and analysis of Redwood. We may also provide non-GAAP financial measures in this Review. When we use non-GAAP financial measures it is because we believe that these figures provide additional insight into Redwood’s business. In each case in which we discuss a non-GAAP financial measure you will find an explanation of how it has been calculated, why we think the figure is important, and a reconciliation between the GAAP and non-GAAP figures.
References herein to “Redwood,” the “company,” “we,” “us,” and “our” include Redwood Trust, Inc. and its consolidated subsidiaries. References to “at Redwood” exclude all consolidated securitization entities (with the exception of the residential resecuritization we completed in the third quarter of 2011 and the commercial securitization we completed in the fourth quarter of 2012) in order to present our operations in the way management analyzes them. Note that because we round numbers in the tables to millions, except per share amounts, some numbers may not foot due to rounding. References to the “first quarter” refer to the quarter ending March 31, 2014, and references to the “fourth quarter” refer to the quarter ending December 31, 2013, unless otherwise specified.
We hope you find this Review helpful to your understanding of our business. We thank you for your input and suggestions, which have resulted in our changing the form and content of The Redwood Review over time.
|
Selected Financial Highlights
| ||||||||||
| Quarter: Year | GAAP Income per Share |
REIT Taxable Income |
Annualized GAAP Return on Equity |
GAAP Book Value per Share |
Dividends per Share | |||||
| Q114 | $0.14 | $0.19 | 4% | $15.14 | $0.28 | |||||
| Q413 | $0.29 | $0.24 | 8% | $15.10 | $0.28 | |||||
| Q313 | $0.25 | $0.24 | 7% | $14.65 | $0.28 | |||||
| Q213 | $0.71 | $0.25 | 22% | $14.69 | $0.28 | |||||
| Q113 | $0.69 | $0.20 | 21% | $14.54 | $0.28 | |||||
| Q412 | $0.50 | $0.21 | 15% | $13.95 | $0.25 | |||||
| Q312 | $0.48 | $0.19 | 16% | $12.88 | $0.25 | |||||
| Q212 | $0.24 | $0.22 | 8% | $12.00 | $0.25 | |||||
| Q112 | $0.37 | $0.13 | 13% | $12.22 | $0.25 | |||||
| (1) REIT taxable income per share for 2013 and 2014 are estimates until we file tax returns. | ||||||||||||
| 4 | THE REDWOOD REVIEW | 1ST QUARTER 2014 |
|
|
||
|
SHAREHOLDER LETTER
|
Dear Fellow Shareholders:
As we handicap the developing market opportunities that lie ahead for Redwood, we remain bullish on the competitive position, strategy, and long-term prospects for our residential and commercial mortgage banking and investment businesses. We have noted repeatedly in the past that our business strategies are focused on the opportunities we see over the next several years, not just over the next several quarters. However, we understand that the near-term matters too, especially as we steer through industry-wide headwinds that will likely put pressure on our earnings for much of 2014. We therefore think it makes sense to include an update on our current outlook in this Shareholder Letter as well.
Our quarterly financial and operating results were once again impacted by volatility in interest rates. We note that there has been continued noise in our recent quarterly income statements due to timing differences between quarters, valuation adjustments (some of which are reflected in earnings, while others are only reflected in the balance sheet), and the general sensitivity of our net income to sharp movements in interest rates. Over time, we expect that the mortgage market and interest rates will stabilize such that our earnings will more consistently reflect our operational progress each quarter and serve as a primary valuation metric for the company. But we are not there yet. So how do we measure our overall performance for the first quarter of 2014?
| u | From a financial standpoint, we see an overall positive in our quarter-over-quarter $0.04 per share increase in GAAP book value after paying a $0.28 dividend per share. While not a perfect measure of economic value creation, we believe this increase in book value cuts through some of the noise in our results by encompassing the impact of all quarterly valuation adjustments, regardless of whether they were reflected in our income statement or our balance sheet. |
| u | From an operating standpoint, we look to our key operational metrics to indicate whether we are enhancing the Redwood franchise. During the first quarter of 2014, we grew our residential loan purchase volume by 66% in an environment in which industry volumes were down sharply, we increased the number of active loan sellers to 124 at March 31, 2014, and we made progress on some of the big-picture initiatives we wrote about in our last Shareholder Letter. Those include ramping up our conforming loan purchases and exploring risk-sharing opportunities with Fannie Mae and Freddie Mac. |
Getting back to our analysis and current outlook for the mortgage market, the latest industry projections call for a contraction in total U.S. residential loan originations from about $1.8 trillion in 2013 to about $1.2 trillion in 2014. While home purchase activity remains a source of new originations, refinancing activity has largely dried up in the face of rising interest rates. If history repeats itself, loan sale margins will remain under pressure until industry-wide excess capacity is eliminated. It’s always a disorderly process, but it seems to be happening more rationally than in the past. We still believe, however, that it will take another six to nine months of adjustment before industry capacity is back in line with demand.
Our plan for the next few quarters is to seize market share at a time when many of our competitors are shrinking. While we remain conscious of near-term margins and costs, we intend to continue increasing our market share and growing loan purchase volumes by adding sellers, ramping up our new GSE product line, and adding other mortgage products – such as non-QM loans – down the road. We also plan to remain opportunistic during the market correction. For example, we expect to see an increase in the amount of mortgage servicing rights (MSRs) for sale, particularly from smaller originators. As these originators are impacted by lower loan sale margins, they may seek to boost their liquidity by selling MSRs.
| THE REDWOOD REVIEW | 1ST QUARTER 2014 | 5 |
|
| ||
|
SHAREHOLDER LETTER
|
Now let’s move on to the commercial mortgage market. Our commercial business had its challenges during the first quarter of 2014, but we maintain a positive near-term outlook. Although we observed a number of new competitors emerge in the first quarter, about $250 billion of commercial mortgage loans are set to mature in 2014 and annually over the following three years, presenting a huge market opportunity for us. And while margins have compressed from heightened 2013 levels, they still remain attractive. Based on our expectation of rising demand for commercial loans over the coming quarters, we are maintaining our goal of originating $1 billion of commercial loans in 2014.
Before you turn the page to our detailed quarterly results, here are a few final thoughts on the big picture. Once again we will beat a familiar drum. In a deleveraging world, awash with liquidity and dominated by government intervention, Redwood’s strategy for success is based on building operating businesses capable of creating their own investments and fee-generating opportunities. That means building flexible and scalable loan platforms that allow us to pivot in response to the evolving residential and commercial mortgage markets.
It is clear to us that the residential mortgage market is coming our way as “private capital” is called upon to help reduce the government’s current outsized role. We believe this will ultimately happen through an expansion of private label securitization, through risk-sharing arrangements with the GSEs while they are in conservatorship, and eventually after mortgage reform legislation has been enacted. The commercial market has already largely recovered, and should continue to present significant opportunities for us to generate fees and investments as refinancing needs rise over the next few years.
As always, we appreciate your continued support of this effort.

|

| |
| Martin S. Hughes | Brett D. Nicholas | |
| CEO | President |
| 6 | THE REDWOOD REVIEW | 1ST QUARTER 2014 |
|
|
||
|
QUARTERLY OVERVIEW
|
First Quarter 2014 Results
Overview
In the face of challenging mortgage market conditions in the first quarter of 2014 and continued interest rate volatility that carried through to our financial results, we made progress in a number of key aspects of our business. We continued to expand our residential operations by adding sellers and increasing our loan acquisitions (counter to the industry trend) compared to the fourth quarter of 2013. We also completed our first full quarter of conforming loan acquisitions, priced a jumbo residential securitization, and made progress on a few longer-term initiatives to expand our residential loan production.
Before we get into the details, here is a summary of Redwood’s first quarter 2014 results, followed by an overview of the market conditions that impacted our results during the quarter.
| • | Our GAAP book value per share was $15.14 at March 31, 2014, an increase from $15.10 per share at December 31, 2013. The first quarter increase in book value per share reflected net positive valuation adjustments on our investment portfolio, net of our hedges, that when combined with our first quarter earnings exceeded our first quarter dividend of $0.28 per share paid to shareholders. |
| • | Earnings per share was $0.14 for the first quarter of 2014, down from $0.29 per share in the fourth quarter of 2013. The decline in earnings per share is primarily attributable to negative market valuation adjustments on hedges and interest-rate sensitive investments, combined with lower loan sale profit margins generated through our residential and commercial mortgage banking activities. |
| • | Jumbo residential loan purchases increased to $794 million in the first quarter of 2014, as compared to $642 million in the fourth quarter of 2013, and conforming residential loan purchases increased to $299 million in the first quarter of 2014, as compared to $17 million in the fourth quarter of 2013. Our combined jumbo and conforming residential loan purchases were $1.1 billion in the first quarter of 2014, up 66% from $659 million in the fourth quarter of 2013, and in contrast to a 23% industry decline in loan origination activity during this period, projected by the Mortgage Bankers Association. |
| • | At March 31, 2014, we had identified an additional $823 million of residential loans for purchase: $668 million of jumbo loans and $155 million of conforming loans. |
| • | We distributed $347 million of jumbo loans into SEMT 2014-1, our first residential loan securitization of 2014. This securitization settled in early April and priced at spreads to benchmarks that were significantly tighter than our prior securitization in November 2013. |
| • | We completed $722 million of whole loan sales in the first quarter of 2014, consisting of 12 jumbo loan transactions totaling $562 million and $160 million of conforming loan sales to the GSEs. |
| • | At March 31, 2014, we had 124 active loan sellers, up from 118 at December 31, 2013, and up from 80 at March 31, 2013. We expect the pace of new seller relationships to increase as we build our pipeline of potential conforming loan sellers. |
| • | We originated $119 million of senior commercial mortgage loans and $2 million of mezzanine loans in the first quarter of 2014. In addition, we retained $5 million of B-Note mortgages from three senior commercial loans we originated. We also sold $65 million of senior commercial loans in the first quarter. |
| • | Our residential securities increased by 4%, or $60 million, to $1.74 billion at March 31, 2014, up from $1.68 billion at December 31, 2013. |
| THE REDWOOD REVIEW | 1ST QUARTER 2014 | 7 |
|
| ||
|
QUARTERLY OVERVIEW
|
Residential Mortgage Banking Market Conditions
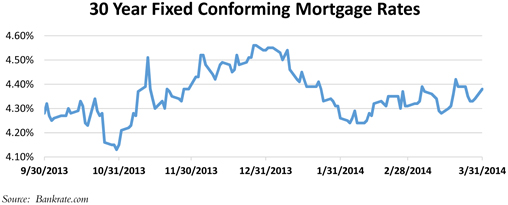
It was a challenging environment to source newly originated residential loans during the first quarter of 2014. The Mortgage Bankers Association projected that first quarter 2014 overall industry originations would be $226 billion, down 23% from the fourth quarter of 2013 and down 57% from the first quarter of 2013. Industry projections for 2014 origination volumes continue to range about 35% below the $1.8 trillion of mortgage originations in 2013. Although 30-year fixed mortgage rates hovered around 4.40% during the first quarter, rates remained nearly 100 basis points higher than the average for the first quarter of 2013.
Higher rates sharply reduced refinance-related mortgage origination volume to an estimated 49% of total originations in the first quarter of 2014, down from 74% of originations in the first quarter of 2013. With lenders competing for fewer loans and incurring higher regulatory and compliance costs, margins continued to grind lower. The Mortgage Bankers Association reported in March 2014 that the average profit per loan originated in the fourth quarter of 2013 was $150, down from $743 per loan in the third quarter of 2013. We believe that industry loan profit margins for the first quarter of 2014 continued to trend lower.
The private label securitization market demonstrated modest improvement in terms of investor acceptance and liquidity during the first quarter of 2014, with $1.3 billion of new issuance, as compared with $0.8 billion in the fourth quarter of 2013. Strong demand by banks for whole loans continues to make whole loan sale profit margins higher, in general, than comparable margins achievable through the securitization of similar collateral. Nevertheless, we continually evaluate the trade-off between whole loan sale profit margins and the long-term benefits of creating assets for our investment portfolio and building our brand through securitization.
In addition to the overall increase in rates over the past year, which has negatively impacted refinance origination volumes, rising and then falling interest rates over the past few quarters (shown in the graph below) have significantly impacted our quarterly earnings comparisons. In particular, our interest rate sensitive assets (e.g., IOs and MSRs), loan pipeline hedging derivatives, and investment portfolio hedging derivatives – which are marked to market through the income statement – generally increase in value as rates rise and decline in value when rates fall. As a consequence, there were some earnings impacts between the fourth quarter of 2013 and the first quarter of 2014 as a result of interest rate volatility and timing differences. This impact is discussed in the Financial Results section below.
| 8 | THE REDWOOD REVIEW | 1ST QUARTER 2014 |
|
|
||
|
QUARTERLY OVERVIEW
|
Commercial Mortgage Banking Market Conditions
Competition among originators for commercial mortgage loans has increased over the past few months, as they position to provide refinancing for the estimated $250 billion of commercial loans that are expected to mature annually over the next five years. By our count, there are currently more than 35 commercial originators vying for loans, more than at the market peak in 2007. As a result, certain originators have loosened their underwriting standards in an attempt to gain origination volume. Pricing also became more competitive in the first quarter of 2014, with most originators pricing to earn less than 150 basis points of profit margin on loans originated, down from over 200 basis points, on average, in 2013. Despite the increased competition, we continued to see opportunities to originate and distribute senior commercial loans at attractive margins – albeit lower than recent prior quarters – while creating additional commercial investments for our portfolio.
| THE REDWOOD REVIEW | 1ST QUARTER 2014 | 9 |
|
| ||
|
QUARTERLY OVERVIEW
|
Financial Results
In the first quarter of 2014, we earned $12 million, or $0.14 per share, a decrease from $25 million, or $0.29 per share, in the fourth quarter of 2013. The following table sets forth the components of Redwood’s GAAP income for the first quarter of 2014 and fourth quarter of 2013.
|
GAAP Income |
| |||||||
| ($ in millions, except per share data)
|
| |||||||
| Three Months Ended | ||||||||
| 3/31/14 | 12/31/13 | |||||||
| Interest income | $ | 55 | $ | 57 | ||||
| Interest expense | (19 | ) | (20 | ) | ||||
| Net interest income | 36 | 38 | ||||||
| Provision for loan losses | (1 | ) | (4 | ) | ||||
| Net interest income after provision | 35 | 34 | ||||||
| Noninterest income | ||||||||
| Mortgage banking activities, net |
(1 | ) | 17 | |||||
| MSR income, net |
1 | 6 | ||||||
| Other market valuation adjustments, net |
(6 | ) | - | |||||
| Realized gains, net |
1 | 2 | ||||||
| Total noninterest income (loss), net |
(5 | ) | 25 | |||||
| Operating expenses | (20 | ) | (19 | ) | ||||
| Other expense | - | (12 | ) | |||||
| Benefit from (provision for) income taxes | 2 | (2 | ) | |||||
| GAAP income | $ | 12 | $ | 25 | ||||
| GAAP income per share | $ | 0.14 | $ | 0.29 | ||||
Net Interest Income
Net interest income was $36 million for the first quarter of 2014, down from $38 million in the fourth quarter of 2013. After taking into account a $2 million commercial loan prepayment penalty received during the fourth quarter of 2013, our net interest income remained a steady source of earnings as has been the case over the past few quarters. Included in net interest income for the first quarter of 2014 was $24.7 million from our residential investment portfolio, a $1.4 million increase from the prior quarter. This increase was offset by lower net interest income from mortgage banking activities as we held lower balances of residential and commercial loans in inventory awaiting sale or securitization in comparison to the fourth quarter of 2013.
| 10 | THE REDWOOD REVIEW | 1ST QUARTER 2014 |
|
|
|
QUARTERLY OVERVIEW
|
Financial Results (continued)
Non Interest Income
Mortgage Banking Activities, net
The following table presents the details of mortgage banking activities, net, for the first quarter of 2014 and fourth quarter of 2013:
|
Mortgage Banking Activities |
| |||||||
| ($ in millions)
|
| |||||||
| Three Months Ended | ||||||||
| 3/31/14 | 12/31/13 | |||||||
| Residential mortgage banking activities | ||||||||
| Residential loans |
$ | 7 | $ | 5 | ||||
| Risk management derivatives |
(4 | ) | (1 | ) | ||||
| Sequoia IO securities |
(4 | ) | 6 | |||||
| Total residential mortgage banking activities, net |
(2 | ) | 10 | |||||
| Commercial mortgage banking activities | ||||||||
| Commercial loans |
4 | 6 | ||||||
| Risk management derivatives |
(3 | ) | 1 | |||||
| Total commercial mortgage banking activities, net
|
|
1
|
|
|
7
|
| ||
| Total mortgage banking activities, net |
$ | (1 | ) | $ | 17 | |||
Residential Mortgage Banking Activities, net
Income from residential mortgage banking activities, net, was a loss of $2 million for the first quarter of 2014, as compared to income of $10 million for the fourth quarter of 2013. Similar to recent prior quarters, we continue to experience timing differences related to our jumbo mortgage pipeline (defined as those loans we have identified for purchase) and the hedging for those loans that make it difficult to fully ascertain our quarterly operating performance from our high-level GAAP results.
To illustrate, valuation increases for residential loans of $7 million (net) for the first quarter of 2014 reflected both higher loan purchase volumes than the prior quarter and declining interest rates that contributed to an increase in the value of our residential loan inventory. However, valuation adjustments for jumbo residential loans in our pipeline at March 31, 2014 were not included in the $7 million, whereas the hedges for those unpurchased loans were included in our first quarter of 2014 mortgage banking results, creating a timing difference. As those loans are purchased in the following period(s), valuation adjustments will be incurred at that time and reflected in that quarter’s results, creating another timing difference. Our first quarter of 2014 also had negative valuation adjustments for loans in our pipeline at the end of the fourth quarter of 2013, for which the hedging gains were reflected in that quarter, creating yet another timing difference.
The impact of interest rate volatility can be more easily ascertained from the valuation changes of risk management derivatives and Sequoia IO securities over the past two quarters. The marks on these instruments generally offset valuation changes in our residential pipeline and are not subject to the
| THE REDWOOD REVIEW | 1ST QUARTER 2014 | 11 |
|
| ||
|
QUARTERLY OVERVIEW
|
Financial Results (continued)
timing differences described above. As shown in the preceding table, risk management derivatives associated with our residential loan pipeline declined in value by $4 million during the first quarter of 2014, a $3 million adverse fluctuation from the fourth quarter of 2013, while Sequoia IO securities declined in value by $4 million during the first quarter of 2014, a $10 million adverse fluctuation from the fourth quarter of 2013. The combined $14 million fluctuation is attributable to the volatility in interest rates, as previously discussed.
After taking into account the effect of volatile interest rates and timing differences that affect our high-level GAAP results, we believe the loan sale profit margins generated by our operations during the first quarter of 2014 were only modestly down from the prior quarter and within our long-term target of 25-to-50 basis points (net of hedges) that we have disclosed in the past.
Commercial Mortgage Banking Activities, net
Our commercial platform generated income from mortgage banking activities of $1 million in the first quarter of 2014, as compared to $7 million in the fourth quarter of 2013. As is often typical in the commercial mortgage business, our first quarter origination volume was down from a strong fourth quarter. In the first quarter of 2014, we funded six senior commercial loans totaling $119 million, as compared to 23 loans totaling $242 million in the fourth quarter of 2013. For comparison, industry-wide CMBS issuance was down 20% to $20.4 billion in the first quarter of 2014, as compared to the fourth quarter of 2013. Although we did experience declines in the value of hedging derivatives related to our commercial loan pipeline, these amounts relate to loans originated and/or sold during the first quarter and did not include timing differences similar to those discussed above for residential loans.
MSR Income, net
Income from our investment in mortgage servicing rights totaled $1 million in the first quarter of 2014, down from $6 million in the fourth quarter of 2013. Fee income generated from MSRs was $3 million for the first quarter of 2014, consistent with the fourth quarter of 2013. While our fourth quarter of 2013 results benefited from $2 million in positive market valuation adjustments to our MSRs primarily related to increases in interest rates over the course of the quarter, our first quarter of 2014 results were adversely effected by declining interest rates that resulted in slightly less than $3 million of negative market valuation adjustments.
Other Market Valuation Adjustments, net
Other market valuation adjustments, net, was negative $6 million for the first quarter of 2014, as compared to zero for the fourth quarter of 2013, a $6 million decline. This decline is attributable to declines in the value of derivatives used to hedge certain residential investments on our balance sheet, as a result of declining interest rates during the first quarter of 2014. While we believe we effectively hedged our exposure to the decline in interest rates during the first quarter (as reflected in our GAAP book value), the derivatives used to hedge our interest rate exposure are marked to market through earnings each quarter while some of the corresponding price changes to hedged assets are not. This contributed to additional volatility in our first quarter 2014 earnings, as discussed throughout this Quarterly Overview.
| 12 | THE REDWOOD REVIEW | 1ST QUARTER 2014 |
|
|
|
QUARTERLY OVERVIEW
|
Financial Results (continued)
Realized Gains, net
In the first quarter of 2014, we recognized $1 million of net gains from securities called during the quarter, as compared to $2 million of net gains from the sale of $3 million of available-for-sale (AFS) securities in the fourth quarter of 2013.
Operating Expenses / Other
Operating expenses were $20 million for the first quarter of 2014, as compared to $19 million for the fourth quarter of 2013. The increase primarily resulted from an increase in fixed compensation expense associated with our residential and commercial mortgage banking operations. The increased operating expense was offset by a benefit from taxes of $2 million for the first quarter of 2014 that relates to a quarterly net loss at a taxable REIT subsidiary. This loss was due to declines in the value of derivatives used to manage interest rate volatility during the first quarter of 2014.
GAAP Book Value
The following table presents a summary of GAAP book value for the first quarter of 2014 and fourth quarter of 2013.
|
Changes in GAAP Book Value Per Share |
| |||||||||||
| ($ in per share)
|
| |||||||||||
| Q1 2014 | Q4 2013 | Variance | ||||||||||
| Beginning book value |
$ | 15.10 | $ | 14.65 | $ | 0.45 | ||||||
| Net income |
0.14 | 0.29 | (0.15 | ) | ||||||||
| Changes in unrealized gains, net |
0.25 | 0.33 | (0.08 | ) | ||||||||
| Unrealized (losses) gains on hedges, net |
(0.11 | ) | 0.09 | (0.20 | ) | |||||||
| Other, net |
0.04 | 0.02 | 0.02 | |||||||||
| Dividends |
(0.28 | ) | (0.28 | ) | - | |||||||
|
Ending book value |
$ | 15.14 | $ | 15.10 | $ | 0.04 | ||||||
| THE REDWOOD REVIEW | 1ST QUARTER 2014 | 13 |
|
| ||
|
QUARTERLY OVERVIEW
|
Financial Results (continued)
Quarterly Investment Activity
Our capital deployment declined in the first quarter of 2014 from prior quarter levels, reflecting the low issuance of new residential securities and a limited supply of attractively priced seasoned residential securities. The following table details our capital invested for the first quarter of 2014 and fourth quarter of 2013.
|
Quarterly Investment Activity |
| |||||||
| ($ in millions)
|
| |||||||
| Q1 2014 | Q4 2013 | |||||||
| Sequoia RMBS |
$ | - | $ | 22 | ||||
| Third-party RMBS (1) |
74 | 346 | ||||||
| Less: Short-term debt/Other Liabilities |
(67 | ) | (296 | ) | ||||
| MSR investments |
3 | 2 | ||||||
| Total residential |
10 | 74 | ||||||
| Commercial mezzanine loans |
2 | 3 | ||||||
| Commercial B-Notes |
5 | - | ||||||
| Less: Borrowings |
(2 | ) | (1 | ) | ||||
| Total commercial
|
|
5
|
|
|
2
|
| ||
|
Capital invested |
$ | 15 | $ | 76 | ||||
(1) Included in our third-party RMBS acquisitions was one $24 million acquisition late in the first quarter of 2014 that did not settle until early in the second quarter of 2014. In order to reflect the fact that capital had not yet been used to acquire this asset at March 31, 2014, the short-term debt / other liabilities line item in the table above includes a $24 million payable associated with this transaction. In early April 2014, we completed the purchase of this security using $22 million of short-term debt, resulting in net capital invested of $2 million that is not reflected in the table above.
At March 31, 2014, our residential securities portfolio had a market value of $1.74 billion, up from $1.68 billion at December 31, 2013. This increase included $74 million of acquisitions, $24 million in positive valuation adjustments, and $38 million in net principal paydowns. Included in these numbers are $106 million of Sequoia IO securities at March 31, 2014, which are included in our Residential Mortgage Banking segment for reporting purposes.
Our residential securities acquisitions of $74 million in the first quarter of 2014 included $64 million of senior securities, and $10 million of re-REMIC securities. These acquisitions in the first quarter were funded with $67 million of short-term debt and $7 million of capital. We also added $3 million of MSRs in the first quarter associated with $273 million of loans. At March 31, 2014, our investment in MSRs was $65 million, associated with $6.0 billion (principal balance) of residential loans.
Following the end of the first quarter of 2014 and through April 30, 2014, we acquired $36 million of third-party securities, $24 million of Sequoia securities from SEMT 2014-1, and $5 million of MSRs, deploying $18 million of capital, net of financing.
During the first quarter of 2014 we funded $2 million of commercial mezzanine loans associated with senior mortgage loans we originated during the quarter, as compared to $3 million of mezzanine loans funded in the fourth quarter of 2013. In addition, we retained $5 million of B-Notes from 3 senior loans we had originated.
| 14 | THE REDWOOD REVIEW | 1ST QUARTER 2014 |
|
|
|
QUARTERLY OVERVIEW
|
Financial Results (continued)
Capital and Liquidity
At March 31, 2014, we held $150 million in cash, and our investment capacity (defined as the approximate amount of capital we had readily available for long-term investments) was estimated to be approximatey $110 million. Total capital of $1.7 billion at March 31, 2014, included $1.3 billion of equity capital, $140 million of long-term debt, and $288 million of long-term convertible debt.
We ended the first quarter of 2014 with total short-term debt of $1.3 billion, which included $512 million of warehouse debt used to finance residential loans, $68 million of warehouse debt used to finance commercial loans, and $708 million of repurchase facilities used to finance residential securities. Our additional uncommitted borrowing capacity was $0.9 billion under existing residential and commercial loan warehouse facilities at March 31, 2014.
During the first quarter of 2014, our reported long-term debt increased by $37 million primarily as a result of our requirement under GAAP to classify certain senior commercial loans we originated and sold to third-parties as secured borrowings and not sales. For these particular loans, we recorded $38 million of commercial loans and $35 million of long-term debt liabilities, which on a net basis reflects our $3 million B-Note investments in these loans. See the Financial Insights section of this Redwood Review for additional details on our long-term debt at March 31, 2014. In addition, we financed a portion of our B-Note investments with $2 million of long-term warehouse debt.
We currently expect that our available capital and liquidity is sufficient to fund our business and investment objectives for most or all of 2014, in part because we believe we can source capital internally by selling or financing existing investments as higher yielding investment opportunities arise. To the extent our expectation changes and we need external capital to fund our investment and business activities, we would most likely consider the issuance of debt or equity securities under the shelf registration statement we currently have on file with the SEC, or the issuance of similar or other types of securities in public or private offerings.
| THE REDWOOD REVIEW | 1ST QUARTER 2014 | 15 |
|
| ||
|
FINANCIAL INSIGHTS
|
Balance Sheet
The following table shows the components of our balance sheet at March 31, 2014.
|
Consolidating Balance Sheet (1) |
| |||||||||||
| March 31, 2014 ($ in millions)
|
| |||||||||||
| At Redwood (2) |
Consolidated Sequoia Entities (3) |
Redwood Consolidated |
||||||||||
| Residential loans |
$ | 775 | $ | 1,690 | $ | 2,465 | ||||||
| Commercial loans |
491 | - | 491 | |||||||||
| Real estate securities - Third party |
1,220 | - | 1,220 | |||||||||
| Real estate securities - Sequoia (4) |
523 | - | 523 | |||||||||
| Mortgage servicing rights |
65 | - | 65 | |||||||||
| Cash and cash equivalents |
150 | - | 150 | |||||||||
| Total earning assets |
3,224 | 1,690 | 4,914 | |||||||||
| Other assets
|
|
87
|
|
|
6
|
|
|
93
|
| |||
| Total assets |
$ | 3,311 | $ | 1,696 | $ | 5,007 | ||||||
| Short-term debt |
||||||||||||
| Mortgage loan warehouse debt |
$ | 580 | $ | - | $ | 580 | ||||||
| Security repurchase facilities |
708 | - | 708 | |||||||||
| Other liabilities |
99 | 1 | 100 | |||||||||
| Asset-backed securities issued |
230 | 1,625 | 1,854 | |||||||||
| Long-term debt |
513 | - | 513 | |||||||||
| Total liabilities |
2,130 | 1,626 | 3,756 | |||||||||
| Stockholders’ equity
|
|
1,180
|
|
|
71
|
|
|
1,251
|
| |||
| Total liabilities and equity |
$ | 3,311 | $ | 1,696 | $ | 5,007 | ||||||
(1) We are required under GAAP to consolidate the assets and liabilities of certain securitization entities we have sponsored for financial reporting purposes. However, the securitized assets of these entities are not legally ours and we own only the securities and interests that we acquired from these securitization entities. Similarly, the liabilities of these entities are obligations payable only from the cash flow generated by their securitized assets and are not obligations of Redwood.
(2) Included in the “At Redwood” column are the assets and liabilities of the Residential Resecuritization and Commercial Securitization transactions we completed in 2011 and 2012, respectively. These transactions are treated as secured borrowings under GAAP. At March 31, 2014, the Residential Resecuritization accounted for $257 million of assets ($256 million of available-for-sale securities at fair value and $1 million of other assets) and $82 million of asset-backed securities issued (at amortized cost). Our $175 million investment in this resecuritization, as estimated for GAAP, equals the difference between these assets and liabilities. At March 31, 2014, the Commercial Securitization accounted for $262 million of assets ($257 million of commercial real estate loans at historical cost and $5 million of other assets) and $148 million of asset-backed securities issued (at amortized cost). Our $114 million investment in this securitization, as estimated for GAAP, equals the difference between these assets and liabilities.
(3) Consolidated Sequoia Entities includes certain Sequoia securitizations completed prior to 2012 that we are required to consolidate under GAAP. Our estimated GAAP investment in these entities was $71 million at March 31, 2014, representing the difference between the aggregate assets and liabilities of these entities.
(4) Sequoia securitizations completed between January 2012 and December 2013 are treated as sales for GAAP, and the $523 million of securities we have retained from these transactions are reflected in the “At Redwood” column above as part of “Real Estate Securities — Sequoia.”
| 16 | THE REDWOOD REVIEW | 1ST QUARTER 2014 |
|
|
|
FINANCIAL INSIGHTS
|
Balance Sheet (continued)
Residential Loans
The table below details residential loan activity at Redwood during the first quarter of 2014 and the fourth quarter of 2013.
|
Residential Loans at Redwood |
| |||||||
| ($ in millions)
|
| |||||||
| Three Months Ended | ||||||||
| 3/31/14 | 12/31/13 | |||||||
| Beginning fair value |
$ | 404 | $ | 728 | ||||
| Acquisitions |
1,093 | 659 | ||||||
| Sales |
(722 | ) | (980 | ) | ||||
| Principal payments |
(7 | ) | (10 | ) | ||||
| Change in fair value, net |
7 | 7 | ||||||
| Ending fair value |
$ | 775 | $ | 404 | ||||
At March 31, 2014, we owned $775 million of prime residential loans, including $625 million of jumbo loans and $150 million of conforming loans. These prime residential loans included $510 million of 30-year fixed-rate loans, $138 million of 15-year or 20-year fixed-rate loans, $126 million of hybrid loans, and $1 million of ARM loans. At March 31, 2014, our pipeline of loans identified for purchase included $668 million of jumbo loans and $155 million of conforming loans. See the Residential Mortgage Banking section on page 31 for additional information.
| THE REDWOOD REVIEW | 1ST QUARTER 2014 | 17 |
|
| ||
|
FINANCIAL INSIGHTS
|
Balance Sheet (continued)
Commercial Loans
The following table details commercial loan activity during the first quarter of 2014 and the fourth quarter of 2013.
|
Commercial Loans |
| |||||||||||||||||||
| Three Months Ended March 31, 2014 | ||||||||||||||||||||
| ($ in millions)
|
| |||||||||||||||||||
| Senior | A/B Notes |
Unsecuritized Mezzanine |
Securitized Mezzanine |
Total | ||||||||||||||||
| Beginning carrying value |
$ | 89 | $ | - | $ | 86 | $ | 258 | $ | 432 | ||||||||||
| Originations |
88 | 31 | 2 | - | 121 | |||||||||||||||
| Sales |
(65 | ) | - | - | - | (65 | ) | |||||||||||||
| Transfers to other categories |
(38 | ) | 38 | - | - | - | ||||||||||||||
| Principal payments/amortization |
(0 | ) | - | - | - | (0 | ) | |||||||||||||
| Change in fair value, net |
3 | - | - | - | 3 | |||||||||||||||
| Change in allowance for loan losses |
- | - | - | (1 | ) | (1 | ) | |||||||||||||
|
Ending carrying value |
$ | 77 | $ | 69 | $ | 87 | $ | 257 | $ | 491 | ||||||||||
|
Commercial Loans |
| |||||||||||||||||||
| Three Months Ended December 31, 2013 | ||||||||||||||||||||
| ($ in millions)
|
| |||||||||||||||||||
| Senior | A/B Notes |
Unsecuritized Mezzanine |
Securitized Mezzanine |
Total | ||||||||||||||||
| Beginning carrying value |
$ | 27 | $ | - | $ | 83 | $ | 269 | $ | 380 | ||||||||||
| Originations |
242 | - | 3 | - | 245 | |||||||||||||||
| Sales |
(186 | ) | - | - | - | (186 | ) | |||||||||||||
| Principal payments/amortization |
- | - | - | (11 | ) | (11 | ) | |||||||||||||
| Change in fair value, net |
6 | - | - | - | 6 | |||||||||||||||
| Change in allowance for loan losses |
- | - | - | (1 | ) | (1 | ) | |||||||||||||
|
Ending carrying value |
$ | 89 | $ | - | $ | 86 | $ | 258 | $ | 432 | ||||||||||
At March 31, 2014, we owned $491 million of commercial loans, as compared to $432 million of commercial loans at December 31, 2013. During the first quarter of 2014, we originated and funded six senior loans and sold six senior loans. Additionally, we originated one mezzanine loan. We also sold two senior A-Note commercial mortgages to third-parties that did not qualify as sales under GAAP, and remain on our balance sheet. These loans and the associated B-Note mortgage loans we retained are held at fair value and are shown separately in the table above. See the Commercial Mortgage Banking Activities section on page 34 for additional information.
| 18 | THE REDWOOD REVIEW | 1ST QUARTER 2014 |
|
|
|
FINANCIAL INSIGHTS
|
Balance Sheet (continued)
Residential Real Estate Securities
The following table presents the fair value of residential real estate securities held at March 31, 2014. We categorize our Sequoia and third-party securities by portfolio vintage (the year(s) the securities were issued), priority of cash flow (senior, re-REMIC, and subordinate) and underwriting characteristics of the underlying loans (prime and non-prime).
|
Real Estate Securities (1) March 31, 2014 ($ in millions) |
| |||||||||||||||||||||||
| Sequoia Securities 2012-2013 |
Third-party Securities |
Total Securities |
% of Total Securities |
|||||||||||||||||||||
| <=2005 | 2006-2008 | 2012-2013 | ||||||||||||||||||||||
| Seniors |
||||||||||||||||||||||||
| Prime |
$ | 109 | $ | 481 | $ | 216 | $ | - | $ | 806 | 46 | % | ||||||||||||
| Non-prime (2) |
- | 197 | 5 | - | 202 | 12 | % | |||||||||||||||||
| Total seniors |
109 | 678 | 221 | - | 1,008 | 58 | % | |||||||||||||||||
| Prime re-REMIC |
- | 76 | 116 | - | 192 | 11 | % | |||||||||||||||||
| Prime Subordinates |
||||||||||||||||||||||||
| Mezzanine (3) |
344 | - | - | 51 | 395 | 23 | % | |||||||||||||||||
| Subordinate |
70 | 58 | 2 | 18 | 148 | 8 | % | |||||||||||||||||
| Prime subordinates
|
|
414
|
|
|
58
|
|
|
2
|
|
|
69
|
|
|
543
|
|
|
31
|
%
| ||||||
| Total real estate securities |
$ | 523 | $ | 812 | $ | 339 | $ | 69 | $ | 1,743 | 100 | % | ||||||||||||
(1) Included in the real estate securities table above are $256 million of senior securities that are included in the Residential Resecuritization that we completed in July 2011. Under GAAP accounting, we account for the resecuritization as a financing even though these securities are owned by the resecuritization entity and are legally not ours. We own only the securities and interests that we acquired from the resecuritization entity, which amounted to $163 million at March 31, 2014. As a result, to adjust at March 31, 2014 for the legal and economic interests that resulted from the resecuritization, Total Senior Securities would be decreased by $256 million to $752 million, Prime Re-REMIC Securities would be increased by $163 million to $355 million, and Total Real Estate Securities would be reduced by $93 million to $1.65 billion.
(2) Non-prime residential securities consist of Alt-A senior securities.
(3) Prime mezzanine includes securities initially rated AA, A, and BBB- and issued in 2012 or later.
| THE REDWOOD REVIEW | 1ST QUARTER 2014 | 19 |
|
| ||
|
FINANCIAL INSIGHTS
|
Balance Sheet (continued)
The table below details the change in fair value of real estate securities during the first quarter of 2014 and the fourth quarter of 2013.
|
Real Estate Securities |
| |||||||
| ($ in millions)
|
| |||||||
| Three Months Ended | ||||||||
| 3/31/14 | 12/31/13 | |||||||
| Beginning fair value |
$ | 1,683 | $ | 1,325 | ||||
| Acquisitions |
||||||||
| Sequoia securities |
- | 22 | ||||||
| Third-party securities |
74 | 346 | ||||||
| Sales |
||||||||
| Sequoia securities |
- | (13 | ) | |||||
| Third-party securities |
- | (3 | ) | |||||
| Gain on sale |
- | 2 | ||||||
| Gain on calls, net |
1 | - | ||||||
| Effect of principal payments |
(39 | ) | (37 | ) | ||||
| Change in fair value, net |
24 | 40 | ||||||
| Ending fair value |
$ | 1,743 | $ | 1,683 | ||||
During the first quarter of 2014, we acquired $64 million of prime senior securities and $10 million of residential senior re-REMIC securities. There were no security sales during the first quarter of 2014.
At March 31, 2014, residential securities we own (as a percentage of current market value) consisted of fixed-rate assets (43%), adjustable-rate assets (16%), hybrid assets that reset within the next year (35%), and hybrid assets that reset between 12 and 36 months (6%).
| 20 | THE REDWOOD REVIEW | 1ST QUARTER 2014 |
|
|
|
FINANCIAL INSIGHTS
|
Balance Sheet (continued)
Mortgage Servicing Rights
The table below details the change in fair value of Redwood’s MSRs during the first quarter of 2014 and the fourth quarter of 2013.
|
MSRs |
| |||||||
| ($ in millions)
|
| |||||||
| Three Months Ended | ||||||||
| 3/31/14 | 12/31/13 | |||||||
| Beginning fair value |
$ | 65 | $ | 60 | ||||
| Additions |
3 | 2 | ||||||
| Change in fair value, net |
(3 | ) | 2 | |||||
| Ending fair value | $ | 65 | $ | 65 | ||||
At March 31, 2014, we owned $59 million jumbo MSR investments and $6 million of conforming MSR investments associated with principal balances of $5.5 billion and $0.5 billion, respectively. We earn fees from these MSRs, but outsource the actual servicing of the associated loans to a third-party servicer.
During the first quarter of 2014, we added $3 million of MSRs associated with $273 million of residential loans. The estimated fair value of our MSRs at March 31, 2014, is equal to 1.08% of the principal balance of the associated residential loans. At March 31, 2014, the loans associated with our MSRs had a 30-day delinquency ratio of 0.31% and none of these loans were greater than 30 days delinquent.
Derivatives
The following table presents the fair value and notional value of derivative financial instruments held at March 31, 2014 and December 31, 2013, which are components of other assets and accrued expenses and other liabilities on our consolidated balance sheets.
|
Derivatives |
| |||||||||||||||
| ($ in millions)
|
| |||||||||||||||
| 3/31/14 | 12/31/13 | |||||||||||||||
| Fair Value | Notional | Fair Value | Notional | |||||||||||||
| Risk management derivatives, net | ||||||||||||||||
| Residential mortgage banking |
$ | 1 | $ | 1,115 | $ | 6 | $ | 1,216 | ||||||||
| Residential investments |
1 | 215 | - | 2 | ||||||||||||
| Commercial mortgage banking and investments |
(0 | ) | 26 | 1 | 70 | |||||||||||
| Cash flow hedges on long-term debt | (25 | ) | 140 | (17 | ) | 140 | ||||||||||
| Total derivative financial instruments, net | $ | (23 | ) | $ | 1,496 | $ | (10 | ) | $ | 1,428 | ||||||
| THE REDWOOD REVIEW | 1ST QUARTER 2014 | 21 |
|
| ||
|
FINANCIAL INSIGHTS
|
Balance Sheet (continued)
We use derivative financial instruments in an effort to manage the interest rate risk associated with some of our residential and commercial mortgage banking activity, in addition to the net interest rate exposure within our investment portfolio. Net changes in the fair value of risk management derivatives are reflected in our income statement in mortgage banking activities, net, for residential and commercial mortgage banking segments, and in other market valuation adjustments, net, for our residential investments segment. The timing of when we enter into and exit these derivatives, and the corresponding levels of benchmark interest rates, has a significant effect on the amount of valuation income or loss recognized. During the first quarter of 2014, the aggregate fair value of risk management derivatives, including those agreements that we exited during the quarter, declined by $13 million.
We also record conforming loan purchase and forward sale commitments as derivatives. In the first quarter of 2014 and the fourth quarter of 2013, these derivatives had negligible market valuation changes.
Falling benchmark interest rates also resulted in a $9 million increase to our derivative liability related to cash flow hedges on our long-term debt. Changes in the fair value of our cash flow hedges were recorded in shareholders’ equity through accumulated other comprehensive income.
Investments in Consolidated Sequoia Entities
Investments in Consolidated Sequoia Entities, as estimated for GAAP, totaled $71 million at March 31, 2014. This amount reflects the book value of retained investments in Consolidated Sequoia Entities and is based on the difference between the consolidated assets and liabilities of the entities in the aggregate according to their GAAP carrying amounts.
Short-Term Debt
At March 31, 2014, we had short-term residential mortgage warehouse debt outstanding of $512 million, which was used to finance a portion of the $775 million inventory of residential mortgage loans held for sale. We also had short-term commercial mortgage warehouse debt outstanding of $68 million, which was used to finance a portion of the $107 million inventory of commercial mortgage loans held at fair value.
At March 31, 2014, we had five uncommitted residential mortgage warehouse facilities with an aggregate borrowing capacity of $1.4 billion, and one uncommitted commercial mortgage warehouse facility for senior loans with a borrowing capacity of $100 million.
At March 31, 2014, we had short-term debt incurred through securities repurchase facilities of $708 million, which was secured by $875 million of residential securities, resulting in a debt-to-equity leverage ratio for these residential securities of 4.2x (excluding the additional risk capital we hold related to these short-term borrowings).
| 22 | THE REDWOOD REVIEW | 1ST QUARTER 2014 |
|
|
|
FINANCIAL INSIGHTS
|
Balance Sheet (continued)
The table below details the activity of short-term debt during the first quarter of 2014 and fourth quarter of 2013.
|
Short-Term Debt by Collateral Type |
| |||||||||||||||||||||||
| ($ in millions)
|
| |||||||||||||||||||||||
| Residential Loans | Residential Securities | Senior Commercial Loans | ||||||||||||||||||||||
| Q1 2014 | Q4 2013 | Q1 2014 | Q4 2013 | Q1 2014 | Q4 2013 | |||||||||||||||||||
| Beginning balance |
$ | 185 | $ | 462 | $ | 678 | $ | 371 | $ | - | $ | 5 | ||||||||||||
| Borrowings |
718 | 423 | 80 | 389 | 123 | 104 | ||||||||||||||||||
| Repayments |
(391 | ) | (700 | ) | (50 | ) | (82 | ) | (55 | ) | (109 | ) | ||||||||||||
| Ending balance |
$ | 512 | $ | 185 | $ | 708 | $ | 678 | $ | 68 | $ | - | ||||||||||||
Long-Term Debt and ABS Issued
At March 31, 2014, we had $288 million of convertible senior notes outstanding at a stated interest rate of 4.625% (excluding deferred issuance costs), that are convertible into 41.1320 shares of common stock per $1,000 principal amount (equivalent to a conversion price of $24.31 per common share and subject to certain adjustments) on or before their maturity in April 2018.
At March 31, 2014, we had $140 million of other long-term debt outstanding due in 2037 with a stated interest rate of three-month LIBOR plus 225 basis points. In 2010, we effectively fixed the interest rate on this long-term debt at approximately 6.75% (excluding deferred issuance costs) through interest rate swaps.
At March 31, 2014, we had $51 million of borrowings outstanding under a $150 million commercial warehouse facility for mezzanine and B-Note loans. Due to the 18-month term of this facility, it is classified as long-term debt on our consolidated balance sheet.
At March 31, 2014, we had commercial secured borrowings of $35 million as a result of our requirement under GAAP to classify certain senior commercial loans we originated and sold to third-parties as secured borrowings and not sales. These secured borrowings are recorded at their estimated fair values, which is equal to the fair value of the associated senior loans that were sold but remain on our balance sheet.
At March 31, 2014, we had $82 million outstanding of non-recourse, asset-backed debt issued at a stated interest rate of one-month LIBOR plus 200 basis points related to our Residential Resecuritization. We also had $148 million outstanding of non-recourse, asset-backed debt issued at a stated interest rate of 5.62% (excluding deferred issuance costs) related to our Commercial Securitization.
| THE REDWOOD REVIEW | 1ST QUARTER 2014 | 23 |
|
| ||
|
FINANCIAL INSIGHTS
|
Balance Sheet (continued)
Capital and Cash
At March 31, 2014, our total capital was $1.7 billion, including $1.3 billion of equity capital, $140 million of long-term debt, and $288 million of long-term convertible debt.
We use capital to invest in earning assets, meet lender capital requirements, and fund our operations and working capital needs. Our cash balance was $150 million at March 31, 2014.
| 24 | THE REDWOOD REVIEW | 1ST QUARTER 2014 |
|
|
|
FINANCIAL INSIGHTS
|
GAAP Income
Our consolidated GAAP net income for the first quarter of 2014 was $12 million, or $0.14 per share, as compared to $25 million, or $0.29 per share, for the fourth quarter of 2013. The following tables present the results at Redwood and Consolidated Sequoia Entities and their estimated effect on GAAP income for the first quarter of 2014 and fourth quarter of 2013.
|
Consolidating Income Statement |
| |||||||||||
| Three Months Ended March 31, 2014 | ||||||||||||
| ($ in millions, except per share data)
|
| |||||||||||
| At Redwood |
Consolidated Sequoia Entities |
Redwood Consolidated |
||||||||||
| Interest income | $ | 38 | $ | 8 | $ | 45 | ||||||
| Net discount (premium) amortization | 11 | (1 | ) | 10 | ||||||||
| Total interest income | 49 | 7 | 55 | |||||||||
| Interest expense | (14 | ) | (5 | ) | (19 | ) | ||||||
| Net interest income | 35 | 1 | 36 | |||||||||
| Provision for for loan losses | (1 | ) | (1 | ) | (1 | ) | ||||||
| Net interest income after provision | 34 | 1 | 35 | |||||||||
| Noninterest income | ||||||||||||
| Mortgage banking activities, net |
(1 | ) | - | (1 | ) | |||||||
| MSR income, net |
1 | - | 1 | |||||||||
| Other market valuation adjustments, net |
(6 | ) | (0 | ) | (6 | ) | ||||||
| Realized gains, net |
1 | 0 | 1 | |||||||||
| Total noninterest income (loss), net |
(5 | ) | (0 | ) | (5 | ) | ||||||
| Operating expenses | (19 | ) | (0 | ) | (20 | ) | ||||||
| Other expense, net | - | - | - | |||||||||
| Benefit from income taxes | 2 | - | 2 | |||||||||
| Net income | $ | 12 | $ | 1 | $ | 12 | ||||||
| Net income per share | $ | 0.14 | ||||||||||
|
Consolidating Income Statement |
| |||||||||||
| Three Months Ended December 31, 2013 | ||||||||||||
| ($ in millions, except per share data)
|
| |||||||||||
| At Redwood |
Consolidated Sequoia Entities |
Redwood Consolidated |
||||||||||
| Interest income | $ | 41 | $ | 8 | $ | 48 | ||||||
| Net discount (premium) amortization | 10 | (1 | ) | 9 | ||||||||
| Total interest income | 51 | 7 | 57 | |||||||||
| Interest expense | (14 | ) | (6 | ) | (20 | ) | ||||||
| Net interest income | 37 | 1 | 38 | |||||||||
| Provision for for loan losses | (1 | ) | (3 | ) | (4 | ) | ||||||
| Net interest income (loss) after provision | 36 | (2 | ) | 34 | ||||||||
| Noninterest income | ||||||||||||
| Mortgage banking activities, net |
17 | - | 17 | |||||||||
| MSR income, net |
6 | - | 6 | |||||||||
| Other market valuation adjustments, net |
1 | (0 | ) | 0 | ||||||||
| Realized gains, net |
2 | - | 2 | |||||||||
| Total noninterest income, net |
25 | (0 | ) | 25 | ||||||||
| Operating expenses | (19 | ) | - | (19 | ) | |||||||
| Other expense, net | (12 | ) | - | (12 | ) | |||||||
| Provision for income taxes | (2 | ) | - | (2 | ) | |||||||
| Net income (loss) | $ | 27 | $ | (2 | ) | $ | 25 | |||||
| Net income per share | $ | 0.29 | ||||||||||
| THE REDWOOD REVIEW | 1ST QUARTER 2014 | 25 |
|
| ||
|
FINANCIAL INSIGHTS
|
Net Interest Income at Redwood
Net interest income at Redwood was $35 million in the first quarter of 2014, a decrease of $2 million from the fourth quarter of 2013.
| u | Interest income from our securities portfolio was $32 million for the first quarter of 2014, an increase of $1 million from the fourth quarter of 2013, as the average balance of our securities portfolio increased 12% to $1.5 billion, primarily from the acquisition of $442 million of Sequoia and third-party securities during the fourth quarter of 2013 and the first quarter of 2014. |
| u | Interest income from residential loans held-for-sale was $6 million during the first quarter of 2014, a decrease of $1 million from the fourth quarter of 2013, as the average balance of residential loans held-for-sale on our balance sheet decreased 7% to $518 million. The amount of interest income earned from loans held for sale is dependent on many factors, including the amount of loans, the length of time they are on our balance sheet and their interest rates. |
| u | Commercial loans generated $10 million of interest income in the first quarter of 2014, a decrease of $2 million from the fourth quarter of 2013, primarily resulting from $2 million of prepayment penalties received upon prepayment of two mezzanine loans in the fourth quarter. |
| u | Interest expense was $14 million in both the first quarter of 2014 and the fourth quarter of 2013, reflecting the net effect of an increase in average short-term debt used to finance our securities portfolio, which was offset by a decline in the average balance of residential warehouse debt. |
Noninterest Income (Loss) at Redwood
We generate noninterest income from mortgage banking activities (primarily valuation adjustments), as well as net MSR income, other net market valuation adjustments, and net realized gains. Noninterest income (loss), net at Redwood was a net loss of $5 million in the first quarter of 2014, a decrease in income of $30 million from the fourth quarter of 2013. This decrease was predominately the result of lower mortgage banking income and lower other market valuation adjustments, net, as discussed below.
| u | Mortgage Banking Activities |
Income from mortgage banking activities, net, was negative $1 million for the first quarter of 2014, as compared to $17 million for the fourth quarter of 2013. Factors impacting income from mortgage banking activities in the first quarter of 2014 are discussed in detail in the preceding Quarterly Overview under Financial Results.
| u | MSR Income, net |
Income from MSRs was $1 million for the first quarter of 2014, as we recognized $3 million of net servicing fee income, partially offset by slightly less than $3 million of negative market valuation adjustments. This compares to $3 million of net servicing fee income and $2 million of positive market valuations during the fourth quarter of 2013.
| 26 | THE REDWOOD REVIEW | 1ST QUARTER 2014 |
|
|
|
FINANCIAL INSIGHTS
|
| u | Other Market Valuation Adjustments at Redwood |
Other market valuation adjustments, net, were negative $6 million for the first quarter of 2014, a $6 million decrease from the fourth quarter of 2013. The majority of the expense recorded during the first quarter of 2014 is related to changes in the valuation of derivatives used in part to manage risks associated with certain of our residential investments, the changes in value of which are not recorded through our income statement on a recurring basis.
| u | Realized Gains, net |
In the first quarter of 2014 we recognized $1 million of gains related to called residential securities. In the fourth quarter of 2013 we recognized $2 million of gains from the sale of $3 million of residential securities.
Operating Expenses
Operating expenses were $20 million for the first quarter of 2014, as compared to $19 million for the fourth quarter of 2013, primarily due to an increase in fixed compensation expense resulting from increased headcount during the fourth quarter of 2013 and the first quarter of 2014.
Provision for Income Taxes
During the first quarter of 2014, we recognized a $2 million benefit from income taxes primarily related to GAAP losses generated at our taxable REIT subsidiaries. See the Taxable Income and Dividends section on page 28 for further information.
Earnings at Consolidated Sequoia Entities
We recognized net income of $1 million for the first quarter of 2014 related to our investments in Consolidated Sequoia Entities, as compared to a net loss of $2 million for the fourth quarter of 2013. This increase in net income is primarily attributable to a $2 million decrease in provision for loan losses in the first quarter of 2014.
The allowance for loan losses at Consolidated Sequoia Entities was $26 million at March 31, 2014. Net charge-offs were less than $1 million during both the first quarter of 2014 and the fourth quarter of 2013. These charge-offs relate to existing delinquent loans that have transitioned to short sales or were foreclosed upon during the first quarter of 2014.
Serious delinquencies on loans held at Consolidated Sequoia Entities (90+ days delinquent) were $82 million (or 4.78% of outstanding loan balances) at March 31, 2014, compared to $79 million (or 4.45% of outstanding loan balances) at December 31, 2013.
| THE REDWOOD REVIEW | 1ST QUARTER 2014 | 27 |
|
| ||
|
FINANCIAL INSIGHTS
|
Taxable Income and Dividends
Summary
As a REIT, Redwood is required to distribute to shareholders at least 90% of its REIT taxable income. REIT taxable income is defined as taxable income earned at Redwood and its qualified REIT subsidiaries. To the extent Redwood retains REIT taxable income, it is taxed at corporate tax rates. Redwood also earns taxable income at its taxable REIT subsidiaries (TRS), which it is not required to distribute.
Dividend Policy Overview
Our Board of Directors has maintained a policy of paying regular quarterly dividends, although we have not been required to distribute dividends in recent years under the provisions of the Internal Revenue Code applicable to REITs. In November 2013, the Board of Directors announced its intention to pay a regular dividend of $0.28 per share per quarter in 2014. On February 24, 2014, the Board of Directors declared a regular dividend of $0.28 per share for the first quarter which was paid on March 31, 2014, to shareholders of record on March 14, 2014.
Dividend Distribution Requirement
Our estimated REIT taxable income was $15 million, or $0.19 per share, for the first quarter of 2014 and $20 million, or $0.24 per share, for the fourth quarter of 2013. Under normal circumstances, our minimum REIT dividend requirement would be 90% of our annual REIT taxable income. However, we currently maintain a federal $70 million REIT net operating loss carryforward (NOL) that affords us the option of retaining REIT taxable income up to the NOL amount, tax free, rather than distributing it as dividends. Federal income tax rules require the dividends paid deduction to be applied to reduce taxable income before the applicability of NOLs is considered. We do not expect our estimated REIT taxable income to exceed our dividend distributions in 2014; therefore, our entire NOL will likely carry forward into 2015.
Income Tax Characterization of Dividend for Shareholders
Irrespective of our minimum distribution requirement, federal income tax rules require that the actual dividends we distribute in 2014 be taxed at the shareholder level based on our full year 2014 taxable income plus net capital gains before application of any loss carryforwards. Based on this requirement, we expect much of the dividends we distribute in 2014 will be taxable as ordinary income to shareholders and a smaller portion to be a return of capital, which is generally non-taxable. None of Redwood’s 2014 dividend distributions are expected to be characterized as long-term capital gains for federal income tax purposes. Factors that significantly affected the taxation of our 2014 dividends to shareholders include but are not limited to: (i) the timing of realized credit losses on legacy investments and (ii) capital gains on sales of securities.
(i) Our estimated REIT taxable income for the three months ended March 31, 2014 included $3 million of realized credit losses on legacy investments that were taken in previous periods for GAAP reporting purposes. We anticipate an additional $46 million of tax credit losses to be realized over an estimated three- to five-year period based on the securities we currently own. This is a decrease from $59 million at December 31, 2013 and $111 million at December 31, 2012. Even though the impact of realized losses on our current period taxable income is declining, our GAAP earnings, which have provisioned for these losses in prior periods, will likely continue to exceed our REIT taxable income.
| 28 | THE REDWOOD REVIEW | 1ST QUARTER 2014 |
|
|
|
FINANCIAL INSIGHTS
|
(ii) For the three months ended March 31, 2014, we realized net capital gains of $1 million at the REIT level for tax purposes. Net capital gains generated by the REIT for the entire year could increase the portion of our 2014 dividends that are characterized as ordinary income to our shareholders. However, if the REIT realizes net capital losses for 2014, those losses would have no effect on the taxability of our 2014 dividends. None of our 2014 dividend distributions are expected to be characterized as long-term capital gains based on applicable federal income tax.
GAAP Provision for Income Tax at Taxable REIT Subsidiaries
To the extent we expect to pay tax at the corporate level (generally as a result of activity at our taxable REIT subsidiaries) we are required to record a tax provision for GAAP reporting purposes. We recorded a $2 million tax benefit for the first quarter of 2014, as compared to a $2 million tax provision for the fourth quarter of 2013. The benefit was primarily due to GAAP losses recorded at our TRS during the first quarter of 2014. Our tax benefit is not intended to reflect an actual amount we expect to receive as an income tax refund as it is expected to be utilized in future periods, as GAAP income is earned at our TRS. A reconciliation of GAAP and taxable income is set forth in Table 2 of the Financial Tables of this Redwood Review. We do not expect to generate excess inclusion income in 2014, but in the event we do, it is our intention to retain it at our TRS and not pass it through to our shareholders.
| THE REDWOOD REVIEW | 1ST QUARTER 2014 | 29 |
|
| ||
|
BUSINESS SEGMENTS
|
Summary
We operate our business in three segments: residential mortgage banking, residential investments, and commercial mortgage banking and investments.
The table below presents our consolidated financial results for the first quarter of 2014 by presenting the direct contribution of each segment separately. The table also includes a reconciling column labeled “Corporate/Other” that includes the impact of our legacy Consolidated Sequoia Entities, certain long-term debt, and corporate operations not directly attributable to our operating segments. Following the table below are descriptions of each segment along with a summary of activity in each segment. Additional detail on our segments and their results is provided in our Quarterly Report on Form 10-Q.
|
Segment Results |
||||||||||||||||||||
| Three Months Ended March 31, 2014 | ||||||||||||||||||||
| ($ in millions)
|
| |||||||||||||||||||
| Residential Mortgage Banking |
Residential Investments |
Commercial Mortgage Banking and Investments |
Corporate/ Other |
Total | ||||||||||||||||
| Interest income | $ | 11 | $ | 28 | $ | 10 | $ | 7 | $ | 55 | ||||||||||
| Interest expense | (1 | ) | (3 | ) | (3 | ) | (12 | ) | (19 | ) | ||||||||||
| Net interest income (loss) | 9 | 25 | 7 | (5 | ) | 36 | ||||||||||||||
| Provision for for loan losses | - | - | (1 | ) | (1 | ) | (1 | ) | ||||||||||||
| Net interest income (loss) after provision | 9 | 25 | 6 | (5 | ) | 35 | ||||||||||||||
| Noninterest income | ||||||||||||||||||||
| Mortgage banking activities, net |
(2 | ) | - | 1 | - | (1 | ) | |||||||||||||
| MSR income, net |
- | 1 | - | - | 1 | |||||||||||||||
| Other market valuation adjustments, net |
(0 | ) | (6 | ) | - | (0 | ) | (6 | ) | |||||||||||
| Realized gains, net |
- | 1 | - | 0 | 1 | |||||||||||||||
| Total noninterest income (loss), net |
(2 | ) | (4 | ) | 1 | (0 | ) | (5 | ) | |||||||||||
| Operating expenses | (7 | ) | (1 | ) | (3 | ) | (9 | ) | (20 | ) | ||||||||||
| Other expense | - | - | - | - | - | |||||||||||||||
| (Provision for) benefit from income taxes
|
|
(0
|
)
|
|
2
|
|
|
0
|
|
|
0
|
|
|
2
|
| |||||
| Segment contribution | $ | 1 | $ | 21 | $ | 5 | $ | (14 | ) | |||||||||||
|
|
|
|
|
|
|
|
|
|
|
|||||||||||
| Net income | $ | 12 | ||||||||||||||||||
| Additional Information: | ||||||||||||||||||||
| Residential loans - unsecuritized | $ | 775 | $ | - | $ | - | $ | - | $ | 775 | ||||||||||
| Residential loans - securitized | - | - | - | 1,690 | 1,690 | |||||||||||||||
| Commercial loans | - | - | 491 | - | 491 | |||||||||||||||
| Real estate securities | 106 | 1,637 | - | - | 1,743 | |||||||||||||||
| Mortgage servicing rights | - | 65 | - | - | 65 | |||||||||||||||
| 30 | THE REDWOOD REVIEW | 1ST QUARTER 2014 |
|
|
|
BUSINESS SEGMENTS
|
Residential Mortgage Banking
Summary
The Residential Mortgage Banking segment primarily consists of a mortgage loan conduit that acquires residential loans from third-party originators for subsequent sale. The jumbo loans we acquire are typically sold through private-label securitization through our Sequoia securitization program or to institutions that acquire pools of whole loans. The conforming loans we acquire are generally sold to Fannie Mae and Freddie Mac. Our residential loan acquisitions are usually made on a flow basis as they are originated by banks or mortgage companies, but we occasionally make bulk acquisitions.
This segment’s main source of revenue is mortgage banking income, which includes valuation increases (or gains) on the sale or securitization of loans. Additionally, this segment may generate interest income on loans held pending sale, and income from IO securities and derivatives used to manage risks associated with mortgage banking activities. Funding expenses, direct operating expenses, and tax expenses associated with these activities are also included.
| u | During the first quarter of 2014, we identified $1.7 billion of loans for purchase and we acquired $1.1 billion of loans, compared to the fourth quarter of 2013, when we identified $1.0 billion of loans for purchase and we acquired $659 billion of loans. |
| u | During the first quarter of 2014, we completed 12 whole loan sale transactions totaling $562 million of jumbo loans and sold $160 million of conforming loans to the GSEs, compared to the fourth quarter of 2013 when we completed one prime jumbo securitization for $330 million and 16 whole loan sale transactions totaling $648 million. |
| u | In the first quarter of 2014, industry-wide private-label jumbo RMBS issuance totaled $1.3 billion, compared to $0.8 billion in the fourth quarter of 2013. |
| u | Redwood has sponsored, through its Sequoia platform, $7.9 billion, or 44%, of the $17.8 billion of total private-label RMBS issuance since the start of 2012, as reported by Inside Nonconforming Markets, an industry trade publication. |
| u | At March 31, 2014, the fair value of our residential loans held for sale was $775 million, an increase from $404 million at December 31, 2013. At March 31, 2014, our pipeline of residential loans identified for purchase was $668 million of jumbo loans and $155 million of conforming loans. |
| u | Active sellers increased to a total of 124 at March 31, 2014, from 118 at December 31, 2013. |
| u | At March 31, 2014, retained IO securities acquired from Sequoia securitizations totaled $106 million. |
| THE REDWOOD REVIEW | 1ST QUARTER 2014 | 31 |
|
| ||
|
BUSINESS SEGMENTS
|
Residential Investments
Summary
The Residential Investments segment includes a portfolio of investments in residential mortgage-backed securities (RMBS) retained from our Sequoia securitizations, as well as RMBS issued by third parties. This segment also includes MSRs associated with residential loans securitized through the Sequoia program, MSRs associated with residential loans sold to third parties (including the GSEs), and MSRs purchased from third parties.
This segment’s main source of revenue is net interest income from portfolio securities and income from MSRs. Additionally, this segment may realize gains upon the sale of securities or MSRs. Funding expenses, direct operating expenses, and tax expenses associated with these activities are also included.
| u | At March 31, 2014, the fair value of the residential securities in the residential investments segment totaled $1.6 billion, consisting of $700 million in prime senior securities, $202 million in non-prime senior securities, $192 million in re-REMIC securities, $395 million in mezzanine securities, and $148 million in subordinate securities. The amortized cost of our available-for-sale securities, which account for all but $14 million of securities held as trading securities, was 78% of face value and the fair value was 88% of face value at March 31, 2014. |
| u | We financed our holdings of residential securities through a combination of short-term debt secured by securities, a Residential Resecuritization, long-term debt and equity capital. During the first quarter of 2014, average short-term debt secured by securities was $976 million and the average asset-backed securities outstanding in the Residential Resecuritization was $85 million. |
| u | During the first quarter of 2014, we did not sponsor any Sequoia securitizations. In the fourth quarter of 2013, we acquired $22 million of subordinate investments from Sequoia securitizations we sponsored. At March 31, 2014, retained investments acquired from Sequoia securitizations totaled $472 million, including $344 million of mezzanine securities, $70 million of subordinate securities, and $58 million of MSRs. |
| u | At March 31, 2014, residential securities we own (as a percentage of current market value) consisted of fixed-rate assets (40%), adjustable-rate assets (17%), hybrid assets that reset within the next year (37%), and hybrid assets that reset between 12 and 36 months (6%). |
| 32 | THE REDWOOD REVIEW | 1ST QUARTER 2014 |
|
|
|
BUSINESS SEGMENTS
|
Residential Investments (continued)
The following table presents information on residential securities in our residential investments segment at March 31, 2014. For GAAP, we account for the large majority of these securities as available-for-sale (AFS) and the others as trading securities, and in both cases the securities are reported at their fair value at the report date.
|
Residential Securities |
||||||||||||||||||||
| March 31, 2014 | ||||||||||||||||||||
| ($ in millions)
|
| |||||||||||||||||||
| Senior | ||||||||||||||||||||
| Prime | Non-prime | Re-REMIC | Subordinate | Total | ||||||||||||||||
| Available-for-sale securities | ||||||||||||||||||||
| Current face |
$ | 704 | $ | 213 | $ | 224 | $ | 697 | $ | 1,837 | ||||||||||
| Credit reserve |
(7 | ) | (12 | ) | (21 | ) | (57 | ) | (96 | ) | ||||||||||
| Net unamortized discount |
(42 | ) | (37 | ) | (88 | ) | (137 | ) | (304 | ) | ||||||||||
| Amortized cost |
655 | 164 | 115 | 503 | 1,438 | |||||||||||||||
| Unrealized gains |
47 | 29 | 77 | 46 | 199 | |||||||||||||||
| Unrealized losses |
(2 | ) | - | - | (12 | ) | (14 | ) | ||||||||||||
| Trading securities
|
|
-
|
|
|
9
|
|
|
-
|
|
|
5
|
|
|
14
|
| |||||
| Fair value of residential securities | $ | 700 | $ | 202 | $ | 192 | $ | 543 | $ | 1,637 | ||||||||||
Additional information on the residential securities we own is set forth in Tables 5 through 7 in the Appendix.
Investments in MSRs
In the first quarter of 2014, Redwood’s investment in MSRs remained at $65 million, as we recognized market valuation adjustments of negative $3 million, and we added $3 million of MSRs associated with $273 million of residential loans, which increased the portfolio of loans associated with Redwood’s investment in MSRs to $6.0 billion. The GAAP carrying value of these MSRs is equal to 1.08% of the principal balance of the associated residential loans.
| THE REDWOOD REVIEW | 1ST QUARTER 2014 | 33 |
|
| ||
|
BUSINESS SEGMENTS
|
Commercial Mortgage Banking and Investments
Summary
The Commercial Mortgage Banking and Investments segment consists primarily of a mortgage loan conduit that originates senior commercial loans for subsequent sale to third-party CMBS sponsors or other investors. This segment also provides other forms of commercial real estate financing directly to borrowers that may include mezzanine loans, subordinate mortgage loans, and other forms of financing, such as preferred equity interests in special purpose entities that own commercial real estate. We typically hold the mezzanine and other subordinate loans we originate in our commercial portfolio.
This segment’s main sources of revenue are mortgage banking income, which includes valuation increases (or gains) on the sale of senior commercial loans, and net interest income from mezzanine or subordinate loans held in our investment portfolio. Funding expenses, direct operating expenses, and tax expenses associated with these activities are also included.
| u | Income from commercial mortgage banking activities was $1 million in the first quarter of 2014, as compared to $7 million in the fourth quarter of 2013. |
| u | During the first quarter of 2014, we originated and funded six senior commercial loans for $119 million, and sold six senior loans totaling $65 million. This compares to the fourth quarter of 2013 when we originated and funded 23 senior loans for $242 million, and sold 20 senior loans totaling $187 million. |
| u | At March 31, 2014, we had four senior commercial loans held for sale with a carrying value of $77 million. |
| u | At March 31, 2014, we had $69 million of senior commercial loans carried at fair value and classified as held-for-investment. Included in this amount are three loans that were bifurcated into senior A-note portions and junior B-note portions. Two of the A-notes, totaling $35 million were sold to third parties during the first quarter of 2014, but did not meet the sale criteria under GAAP, and remain on our balance sheet. As a result, the transfers were recorded as secured borrowings, which are also carried at fair value and totaled $35 million. Our investments in the B-note portions of these three loans totaled $5 million at March 31, 2014. |
| u | During the first quarter of 2014, we originated one commercial mezzanine loan for $2 million, as compared to two mezzanine loans for $3 million in the fourth quarter of 2013. At March 31, 2014, our unsecuritized and securitized portfolio of commercial mezzanine loans held for investment were $87 million and $257 million, respectively. |
| u | At March 31, 3014, commercial mezzanine loans held for investment had an outstanding principal balance of $355 million, unamortized discount of $2 million, an allowance for loan losses of $8 million, and a carrying value of $345 million. |
| u | On average, our commercial held-for-investment mezzanine loans have a maturity of more than five years, an unlevered yield in excess of 10% per annum before credit costs, a loan-to-value ratio of 73% at origination, and a debt service coverage ratio at origination of 1.30x based on underwritten cash flows at origination. |
| u | We did not recognize any interest income from prepayments in the first quarter of 2014. During the fourth quarter of 2013, two of our commercial mezzanine loans prepaid in full. In connection with these loan prepayments, we received $2 million of prepayment penalties, which were recorded as interest income in the fourth quarter of 2013. |
| 34 | THE REDWOOD REVIEW | 1ST QUARTER 2014 |
|
|
|
BUSINESS SEGMENTS
|
Commercial Mortgage Banking and Investments (continued)
| u | At March 31, 2014, we had two loans, with a combined carrying value of $42 million, on our watch list. Both of these loans are current and we currently expect to receive all amounts due in accordance with the contractual terms of the loans. However, in our judgment, certain conditions warrant closer management attention to these loans. Improvements in these conditions would result in these loans being removed from our watch list, whereas deterioration could warrant further downgrades and potential evaluation for impairment. |
The following table and charts provide information on our commercial mezzanine loan portfolio as of March 31, 2014.
|
Commercial Mezzanine Loans at Redwood | ||||||||
| March 31, 2014
| ||||||||
| Property Type | Number of Loans | Original Weighted Average DSCR(1) |
Original Weighted Average LTV (2) |
Average Loan Size ($ millions) | ||||
|
Multifamily
|
24 | 1.26x | 79% | $5 | ||||
|
Hospitality
|
9 | 1.38x | 62% | 9 | ||||
|
Office
|
7 | 1.37x | 72% | 10 | ||||
|
Retail
|
6 | 1.16x | 76% | 9 | ||||
|
Self Storage
|
3 | 1.39x | 75% | 6 | ||||
|
Industrial
|
2 | 1.37x | 70% | 2 | ||||
|
Total portfolio
|
51 | 1.30x | 73% | $7 | ||||
| (1) | The debt service coverage ratio (DSCR) is defined as the property’s annual net operating income divided by the annual principal and interest payments. The weighted average DSCRs in this table are based on the ratios at the time the loans were originated and are not based on subsequent time periods during which there may have been increases or decreases in each property’s operating income. |
| (2) | The loan-to-value (LTV) calculation is defined as the sum of the senior and all subordinate loan amounts divided by the value of the property at the time the loan was originated. |
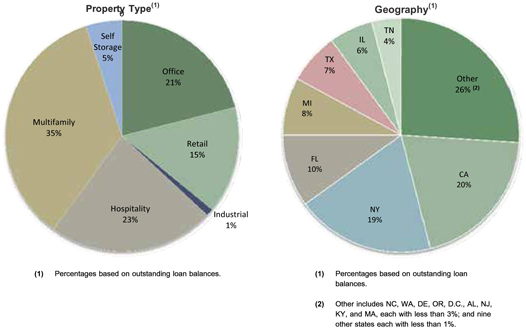
| THE REDWOOD REVIEW | 1ST QUARTER 2014 | 35 |
This Page Intentionally Left Blank
| 36 |

|
| ||
|
REDWOOD’S BUSINESS STRATEGY
|
Redwood’s Business Strategy
We made a strategic decision in late 2009 to invest in and build out our residential and commercial loan platforms. We did this in order to create our own steady sources of attractive investments and fee-generating opportunities, as we assumed that large bank originators with excess liquidity would be more likely to retain their originations for their own investment portfolios than sell them into the secondary market to aggregators such as Redwood.
There is commonality between our residential and commercial business activities. In both cases, we have established ourselves as an intermediary between borrowers and senior investors in the capital markets. We believe that this strategy should work well with the structure of our balance sheet and the talents and extensive relationships of the professionals who make up our residential and commercial teams.
On the residential side, our focus since mid-2010 has been to acquire prime, jumbo mortgages and the related mortgage servicing rights and to sell the loans through private-label securitization and whole-loan bulk-sales. While the initial market opportunity appeared small, our confidence was driven by three primary business assumptions: 1) the government would eventually reduce its outsized role in the mortgage market; 2) new bank regulation, Basel III, and legacy portfolio issues would open up an opportunity for independent mortgage companies; and 3) traditional triple-A institutional investors would return to the market to provide attractive financing for prime residential loans through their investment in private-label securities (“PLS”). In order to leverage the platform, in the fourth quarter of 2013, we entered the conforming segment of the market (defined as loans eligible for sale to Fannie Mae and Freddie Mac) and we began to acquire conforming loans and the related servicing rights from many of our jumbo loan sellers and new conforming-only loan sellers. Conforming loans we acquire are expected to be sold to Fannie Mae or Freddie Mac.
On the commercial side, our focus has been on commercial loan refinancing demand expected to result from the pre-crisis era of high-leverage lending. An immediate need was identified for mezzanine capital that could bridge the gap between commercial borrowers’ funding needs and what traditional senior lenders would provide in refinancing transactions. We also assumed that we would eventually position our platform to become an originator of senior commercial loans, offering value through greater flexibility and certainty of execution for borrowers. We have made progress in both areas, as we have originated more than $350 million of mezzanine loans since late 2010, and have originated more than $950 million of senior commercial loans since mid-2012.
Redwood’s Business Model
Our business model has evolved substantially since the financial crisis began in 2007. This evolution has, in part, been driven by our desire to build a franchise value-producing business model positioned to capitalize on the expected eventual reform of Fannie Mae and Freddie Mac and to be competitive in the post-crisis era of greater regulatory and capital requirements for all mortgage market participants, particularly for the more heavily regulated banks.
Today, Redwood is a specialty finance company focused on investing in mortgage- and other real estate-related assets and engaging in residential and commercial mortgage banking activities. While we remain structured as a REIT for tax purposes, we compliment our tax-advantaged investments with mortgage-banking activities conducted through taxable REIT subsidiaries that pay taxes and, if desired, can generally retain earnings and reinvest the cash flows generated therein.
| 38 | THE REDWOOD REVIEW | 1ST QUARTER 2014 |
|
|
|
GLOSSARY
|
A-NOTES
A-Notes are senior interests in commercial mortgage debt which are promissory notes secured by either a deed of trust or a mortgage. A-Notes are senior to any subordinate financing, such as B-Notes, and mezzanine financing. See B-Notes and Mezzanine Loan definitions.
ADJUSTABLE-RATE MORTGAGES (ARM)
Adjustable-rate mortgages (“ARMs”) are loans that have coupons that adjust at least once per year. We make a distinction between ARMs (loans with a rate adjustment at least annually) and hybrids (loans that have a fixed-rate period of 2-10 years and then become adjustable-rate).
AGENCY
Agency refers to government-sponsored enterprises (“GSEs”), including Federal National Mortgage Association (“Fannie Mae”), Federal Home Loan Mortgage Corporation (“Freddie Mac”), and Government National Mortgage Association (“Ginnie Mae”).
ALT-A SECURITIES and ALT-A LOANS
Alt-A securities are residential mortgage-backed securities backed by loans that have higher credit quality than subprime and lower credit quality than prime. Alt-A originally represented loans with alternative documentation, but the definition has shifted over time to include loans with additional risk characteristics and in some cases investor loans. In an Alt-A loan, the borrower’s income may not be verified, and in some cases, may not be disclosed on the loan application. Alt-A loans may also have expanded criteria that allow for higher debt-to-income ratios with higher accompanying loan-to-value ratios than would otherwise be permissible for prime loans.
AMORTIZED COST
Amortized cost is the initial acquisition cost of an available-for-sale (“AFS”) security, minus principal repayments or principal reductions through credit losses, plus or minus premium or discount amortization. At the point in time an AFS security is deemed other-than-temporarily impaired, the amortized cost is adjusted (by changing the amount of unamortized premium or discount) by the amount of other-than temporary impairment taken through the income statement.
ASSET-BACKED SECURITIES (ABS)
Asset-backed securities (“ABS”) are securities backed by financial assets that generate cash flows. Each ABS issued from a securitization entity has a unique priority with respect to receiving principal and interest cash flows and absorbing any credit losses from the assets owned by the entity.
AVAILABLE-FOR-SALE (AFS)
An accounting method for debt and equity securities in which the securities are reported at their fair value. Positive changes in the fair value are accounted for as increases to stockholders’ equity and do not flow through the income statement. Negative changes in fair value may be recognized through the income statement or balance sheet.
B-NOTES
B-Notes are subordinate interests in commercial mortgage debt which are either (i) evidenced by a subordinated promissory note secured by the same mortgage that also secures the senior debt relating to the same property or (ii) junior participation interests in mortgage debt that are subordinate to senior participation interests in the same mortgage debt. B-Notes typically provide the holder with certain rights to approve modifications to related lending agreements and to trigger foreclosure under the mortgage following an event of default. B-Notes also typically provide the holder certain limited rights to cure a borrower default under senior debt secured by the same mortgage in order to keep the senior debt current and avoid foreclosure.
| THE REDWOOD REVIEW | 1ST QUARTER 2014 | 39 |
|
| ||
|
GLOSSARY
|
BOOK VALUE (GAAP)
Book value is the value of our common equity in accordance with GAAP.
COMMERCIAL MORTGAGE-BACKED SECURITIES (CMBS)
A type of mortgage-backed security that is secured by one or more loans on commercial properties.
CONFORMING LOAN
A conforming loan is a mortgage loan that conforms to the underwriting standards of Fannie Mae and Freddie Mac, including the maximum loan limit, which is currently $417,000 except in defined high-cost areas of the country, where the limit is higher. Changes to this maximum loan limit are announced annually by the Federal Housing Finance Agency, which is the regulator and conservator of both Fannie Mae and Freddie Mac.
CONSTANT (or CONDITIONAL) PREPAYMENT RATE (CPR)
Constant (or conditional) prepayment rate (“CPR”) is an industry-standard measure of the speed at which mortgage loans prepay. It approximates the annual percentage rate at which a pool of loans is paying down due to unscheduled principal prepayments.
CREDIT SUPPORT
Credit support is the face amount of securities subordinate (or junior) to the applicable security that protects the security from credit losses and is generally expressed as a percentage of the securitization’s underlying pool balance.
DEBT
Debt is an obligation of Redwood. See Long-term debt and Short-term debt.
FALLOUT
The percentage of loans that an originator plans or commits to sell to a buyer that ultimately do not close and are not delivered to the buyer.
FASB
Financial Accounting Standards Board.
FHFA
The FHFA refers to the Federal Housing Finance Authority.
FORWARD SALE COMMITMENT
A contract pertaining to the future sale of a loan at a specified price and within a specified time period. Mortgage bankers often use forward sale commitments to hedge interest rate risk between the date they agree to buy and the date in which the loan is sold, which is often between 30 and 60 days. This commitment qualifies as a derivative in accordance with GAAP. Any change in the value of this forward sale commitment is recorded as a market valuation adjustment in mortgage banking activities, net.
GAAP
Generally Accepted Accounting Principles in the United States.
GOVERNMENT SPONSORED ENTERPRISE (GSE)
A government sponsored enterprise is a financial services corporation created by the United States Congress to enhance the flow of credit to targeted sectors of the economy. Among the GSEs chartered by Congress are Fannie Mae, Freddie Mac, and Ginnie Mae.
| 40 | THE REDWOOD REVIEW | 1ST QUARTER 2014 |
|
|
|
GLOSSARY
|
INTEREST-ONLY SECURITIES (IOs)
Interest-only securities (“IOs”) are specialized securities created by securitization entities where the projected cash flows generated by the underlying assets exceed the cash flows projected to be paid to the securities that are issued with principal balances. Typically, IOs do not have a principal balance and they will not receive principal payments. Interest payments to IOs usually equal an interest rate formula multiplied by a “notional” principal balance. The notional principal balances for IOs are typically reduced over time as the actual principal balance of the underlying pool of assets pays down, thus reducing the cash flows to the IOs over time. Cash flows on IOs are typically reduced more quickly when asset prepayments increase.
INVESTMENT CAPACITY
The amount of capacity we estimate that we have to invest in new assets. Our estimate of our investment capacity takes into account, among other things, cash on hand, cash we estimate we could raise by prudently increasing short-term borrowings, and cash needed to cover short-term operations, working capital, and a liquidity cushion.
JUMBO LOAN
A jumbo loan is a mortgage loan that generally conforms to the underwriting standards of Fannie Mae and Freddie Mac except that the dollar amount of the loan exceeds the maximum limit set by the two GSEs for loans salable to the two companies.
LEVERAGE RATIOS
When determining Redwood’s financial leverage, traditional leverage ratios may be misleading in some respects if consolidated ABS issued from securitization entities are included as part of Redwood’s obligations when calculating this or similar ratios. Because of the requirement to consolidate the independent securitization entities for GAAP accounting purposes, it appears that Redwood is highly leveraged, with total consolidated liabilities significantly greater than equity. The obligations of these securitization entities are not obligations of Redwood.
LOAN PURCHASE COMMITMENT
A commitment to purchase a residential mortgage loan from a mortgage loan originator at a specified price and within a specified time period. A “best efforts” loan purchase commitment becomes effective once the originator has closed the loan with the borrower. A “mandatory” loan purchase commitment becomes effective once the commitment is entered into among the buyer and the originator, regardless if the originator has closed the loan. Mortgage buyers such as Redwood often issue 30 to 60 day loan purchase commitments to loan originators so that they can in turn offer a similar commitments to their borrowers. To hedge interest rate risk during the commitment period, buyers will often enter in to a forward sale commitment or hedge the risk using derivatives. (See forward sale commitment definition.) A loan purchase commitment for a conforming loan qualifies as a derivative in accordance with GAAP. Any change in the value of a loan purchase commitment is recorded as a market valuation adjustment in mortgage banking activities, net. Our loan purchase commitment for a non-conforming loan does not qualify as a derivative in accordance with GAAP and is not recorded as an asset or liability.
LONG-TERM DEBT
Long-term debt is debt that is an obligation of Redwood that is not payable within a year and includes convertible debt, junior subordinated notes and trust preferred securities. We generally treat long-term debt as part of our capital base when it is not payable in the near future.
| THE REDWOOD REVIEW | 1ST QUARTER 2014 | 41 |
|
| ||
|
GLOSSARY
|
MARK-TO-MARKET (MTM) ACCOUNTING
Mark-to-market (“MTM”) accounting uses estimated fair values of assets, liabilities, and hedges. Many assets on our consolidated balance sheet are carried at their fair value rather than amortized cost. Taxable income is generally not affected by market valuation adjustments.
MARKET VALUATION ADJUSTMENTS (MVAs)
Market valuation adjustments (“MVAs”) are changes in market values for certain assets and liabilities that are reported through our GAAP income statement. They include all changes in market values for assets and liabilities accounted for at fair value, such as trading securities and derivatives. They also include the credit portion of other-than-temporary impairments on securities available-for-sale, as well as impairments of loans held-for-sale and REO properties.
MEZZANINE LOAN
A mezzanine loan is a loan secured by the membership interests, partnership interests, and/or stock in a single purpose entity formed to own a commercial property, for example. If the mezzanine borrower fails to make its payments or otherwise defaults under the mezzanine loan documents, the mezzanine lender may pursue its remedies, including taking control of the single purpose entity that owns the property.
MEZZANINE SECURITIES
Mezzanine securities are a type of subordinate security and refer to the securities in a residential mortgage-backed securitization that are rated AA, A, and BBB. They rank junior to the AAA securities, and senior to the securities rated below BBB which typically include BB and B rated securities, and any non-rated securities.
MORTGAGE SERVICING RIGHT (MSR)
A mortgage servicing right (“MSR”) gives the holder the contractual right to service a mortgage loan. MSRs typically include the right to collect monthly mortgage principal and interest payments, as well as related tax and insurance payments, from borrowers, disburse funds to the mortgage debt holders and remit related insurance and tax payments, collect late payments, and process modifications and foreclosures. MSRs are created when mortgage loans are sold in a transaction in which the seller retains the right to service the loans. The holder of an MSR receives a monthly servicing fee (which generally ranges from 0.25% to 0.375% per annum of the outstanding principal balance of the related mortgage loan), which is deducted from the borrower’s monthly interest payments. For accounting purposes, MSRs are capitalized at the net present value of the servicing fee less the servicing cost. When Redwood holds MSRs relating to residential mortgage loans, it retains a sub-servicer to carry out actual servicing functions, as Redwood does not directly service residential mortgage loans.
NON-PRIME SECURITIES
Non-prime securities are Alt-A, option ARM, and subprime securities. See definitions of Alt-A, option ARM, and subprime securities.
OPTION ARM LOAN
An option ARM loan is a residential mortgage loan that generally offers a borrower monthly payment options such as: 1) a minimum payment that results in negative amortization; 2) an interest-only payment; 3) a payment that would fully amortize the loan over an original 31-year amortization schedule; and, 4) a payment that would fully amortize the loan over a 15-year amortization schedule. To the extent the borrower has chosen an option that is not fully amortizing the loan (or negatively amortizing the loan), after a period — usually five years or once the negatively amortized loan balance reaches a certain level (generally 15% to 25% higher than the original balance) — the loan payments are recast. This recast provision resets the payment at a level that fully amortizes the loan over its remaining life and the new payment may be materially different than under the borrowers’ previous option.
| 42 | THE REDWOOD REVIEW | 1ST QUARTER 2014 |
|
|
|
GLOSSARY
|
PREFERRED EQUITY
A preferred equity investment is an investment in preferred equity of a special purpose entity that directly or indirectly owns a commercial property. An investor in preferred equity is typically entitled to a preferred return (relative to a holder of common equity of the same entity) and has the right, if the preferred return is not paid, to take control of the entity (and thereby control the underlying commercial property).
PRIME RESIDENTIAL REAL ESTATE LOANS
Prime loans are residential loans with higher quality credit characteristics, such as borrowers with higher FICO credit scores, lower loan-to-value ratios, lower debt-to-income ratios, greater levels of other assets, and more documentation.
PRIME SECURITIES
Prime securities are residential mortgage-backed securities backed by prime loans, generally with balances greater than conforming loan limits. Prime securities are typically backed by loans that have relatively high weighted average FICO scores (e.g., 700 or higher at origination), low weighted average LTVs (e.g., 75% or less at origination), limited concentrations of investor properties, and low percentages of loans with low FICO scores or high loan-to-value ratios.
PRINCIPAL-ONLY SECURITIES (POs)
Principal-only securities (“POs”) are specialized securities created by securitization entities where the holder is only entitled to receive regular cash flows that are derived from incoming principal repayments on an underlying mortgage loan pool. This security is created by splitting a mortgage-backed security into its interest and principal payments. The principal payments create a string of cash flows which are sold at a discount to investors. These investors will receive the principal portions of the monthly mortgage payments from the underlying pool of loans. The yield on a PO strip depends on the prepayment speed of the underlying loan. The faster the principal is repaid, the higher the yield an investor will receive.
PROFITABILITY RATIOS
Many financial institution analysts use asset-based profitability ratios such as interest rate spread and interest rate margin when analyzing financial institutions. These are asset-based measures. Since we consolidate the assets and liabilities of certain securitization entities for GAAP purposes, our total GAAP assets and liabilities may vary over time, and may not be comparable to assets typically used in profitability calculations for other financial institutions. As a result, we believe equity-based profitability ratios may be more appropriate than asset-based measures for analyzing Redwood’s operations and results. We provide various profitability ratios in Table 4 in the Financial Tables in this Review.
REAL ESTATE INVESTMENT TRUST (REIT)
A real estate investment trust (“REIT”) is an entity that makes a tax election to be taxed as a REIT, invests in real estate assets, and meets other REIT qualifications, including the distribution as dividends of at least 90% of its REIT taxable income. A REIT’s profits are not taxed at the corporate level to the extent that these profits are distributed as dividends to stockholders, providing an operating cost savings. On the other hand, the requirement to pay out as dividends most of the REIT’s taxable profits means it can be harder for a REIT to grow using only internally-generated funds (as opposed to raising new capital).
| THE REDWOOD REVIEW | 1ST QUARTER 2014 | 43 |
|
| ||
|
GLOSSARY
|
REAL ESTATE OWNED (REO)
Real estate owned (“REO”) refers to real property owned by the lender or loan owner that has been acquired through foreclosure.
REIT SUBSIDIARY
A REIT subsidiary is a subsidiary of a REIT that is taxed as a REIT.
REIT TAXABLE INCOME
REIT taxable income is not a measure calculated in accordance with GAAP. REIT taxable income is pretax income calculated for tax purposes at Redwood including only its qualifying REIT subsidiaries (i.e., excluding its taxable subsidiaries, with certain adjustments). REIT taxable income is an important measure as it is the basis of our dividend distribution requirements. We must annually distribute at least 90% of REIT taxable income as dividends to shareholders. As a REIT, we are not subject to corporate income taxes on the REIT taxable income we distribute. We pay corporate income tax on the REIT taxable income we retain, if any (and we are permitted to retain up to 10% of total REIT taxable income). A reconciliation of REIT taxable income to GAAP income appears in Table 2 in the Financial Tables in this Review.
REMIC
A real estate mortgage investment conduit (“REMIC”) is a special purpose vehicle used to pool real estate mortgages and issue mortgage-backed securities. REMICs are typically exempt from tax at the entity level. REMICs may invest only in qualified mortgages and permitted investments, including single family or multifamily mortgages, commercial mortgages, second mortgages, mortgage participations, and federal agency pass-through securities.
RE-REMIC SECURITY
A re-REMIC is a re-securitization of asset-backed securities. The cash flows from and any credit losses absorbed by the underlying assets can be redirected to the resulting re-REMIC securities in a variety of ways.
RESECURITIZATION
A resecuritization is a securitization of two or more mortgage-backed securities into a new mortgage-backed security.
RESIDENTIAL MORTGAGE-BACKED SECURITIES (RMBS)
A type of mortgage-backed security that is backed by a pool of mortgages on residential properties.
RETURN ON EQUITY (ROE)
ROE is the amount of profit we generate each year per dollar of equity capital and equals GAAP income divided by GAAP equity.
SENIOR SECURITIES
Generally, senior securities have the least credit risk in a securitization transaction because they are generally the last securities to absorb credit losses. In addition, the senior securities have the highest claim on the principal and interest payments (after the fees to servicers and trustees are paid). To further reduce credit risk, most if not all, principal collected from the underlying asset pool is used to pay down the senior securities until certain performance tests are satisfied. If certain performance tests are satisfied, principal payments are shared between the senior securities and the subordinate securities, generally on a pro rata basis. At issuance, senior securities are generally triple A-rated.
| 44 | THE REDWOOD REVIEW | 1ST QUARTER 2014 |
|
|
|
GLOSSARY
|
SEQUOIA
Sequoia is the brand name for securitizations of residential real estate loans Redwood sponsors. Sequoia entities are independent securitization entities that acquire residential mortgage loans and create and issue asset-backed securities (“ABS”) backed by these loans. Most of the loans that Sequoia entities acquire are prime-quality loans. Most of the senior ABS created by Sequoia are sold to third-party investors. Redwood usually acquires most of the subordinated ABS and occasionally acquires the interest-only securities (“IOs”).
SHORT-TERM DEBT
Short-term debt is debt that is an obligation of Redwood and payable within a year. We may obtain this debt from a variety of Wall Street firms, banks, and other institutions. We may issue these or other forms of short term debt in the future. We may use short-term debt to finance the accumulation of assets prior to sale to a securitization entity and to finance investments in loans and securities.
SUBORDINATE DEBT INVESTMENTS
Subordinate Debt Investments mean Mezzanine Loans, Preferred Equity, and B-Notes.
SUBORDINATE SECURITIES (JUNIOR SECURITIES or NON-SENIOR SECURITIES)
Subordinate securities absorb the initial credit losses from a securitization structure, thus protecting the senior securities. Subordinate securities have a lower priority to receive principal and interest payments than the senior securities. Subordinate securities receive little, if any, principal payments until certain performance tests are satisfied. If certain performance tests are satisfied, principal payments are shared between the senior securities and the subordinate securities, generally on a pro rata basis. Subordinate securities generally receive interest payments even if they do not receive principal payments. At issuance, subordinate securities are generally rated double-A or below.
SUBPRIME SECURITIES
Subprime securities are residential mortgage-backed securities backed by loans to borrowers who typically have lower credit scores and/or other credit deficiencies that prevent them from qualifying for prime or Alt-A mortgages and may have experienced credit problems in the past, such as late payments or bankruptcies. To compensate for the greater risks and higher costs to service the loans, subprime borrowers pay higher interest rates, points, and origination fees.
TAXABLE INCOME
Taxable income is not a measure calculated in accordance with GAAP. Taxable income is pre-tax income for Redwood and all its subsidiaries as calculated for tax purposes. Taxable income calculations differ significantly from GAAP income calculations. A reconciliation of taxable income to GAAP income appears in Table 2 in the Financial Tables in this Review.
TAXABLE SUBSIDIARY
A taxable subsidiary is a subsidiary of a REIT that is not taxed as a REIT and thus pays taxes on its income. A taxable subsidiary is not limited to investing in real estate and it can choose to retain all of its after-tax profits.
TO BE ANNOUNCED (TBA)
A term used to describe a forward Agency mortgage-backed securities trade. Pass-through securities issued by Freddie Mac, Fannie Mae and Ginnie Mae trade in the TBA market. The term TBA is derived from the fact that the actual mortgage-backed security that will be delivered to fulfill a TBA trade is not designated at the time the trade is made. The securities are “to be announced” 48 hours prior to the established trade settlement date.
| THE REDWOOD REVIEW | 1ST QUARTER 2014 | 45 |
This Page Intentionally Left Blank
| 46 |


|
Table 1: GAAP Earnings ($ in thousands, except per share data) | 48
| ||
| 2014 Q1 |
2013 Q4 |
2013 Q3 |
2013 Q2 |
2013 Q1 |
2012 Q4 |
2012 Q3 |
2012 Q2 |
2012 Q1 |
Twelve Months 2013 |
Twelve Months 2012 |
||||||||||||||||||||||||||||||||||
| Interest income |
$ | 45,155 | $ | 48,331 | $ | 50,139 | $ | 51,195 | $ | 47,361 | $ | 48,025 | $ | 54,001 | $ | 52,629 | $ | 51,355 | $ | 197,026 | $ | 206,010 | ||||||||||||||||||||||
| Discount amortization on securities, net |
11,298 | 10,311 | 8,785 | 8,153 | 7,672 | 7,103 | 7,317 | 8,318 | 8,258 | 34,921 | 30,996 | |||||||||||||||||||||||||||||||||
| Premium amortization expense on loans |
(967 | ) | (1,150 | ) | (1,504 | ) | (1,629 | ) | (1,508 | ) | (1,731 | ) | (1,595 | ) | (1,424 | ) | (872 | ) | (5,791 | ) | (5,622 | ) | ||||||||||||||||||||||
| Total interest income |
55,486 | 57,492 | 57,420 | 57,719 | 53,525 | 53,397 | 59,723 | 59,523 | 58,741 | 226,156 | 231,384 | |||||||||||||||||||||||||||||||||
| Interest expense on short-term debt |
(3,827 | ) | (3,715 | ) | (5,227 | ) | (4,686 | ) | (3,808 | ) | (2,526 | ) | (2,737 | ) | (2,299 | ) | (1,828 | ) | (17,436 | ) | (9,390 | ) | ||||||||||||||||||||||
| Interest expense on ABS |
(7,288 | ) | (7,697 | ) | (8,182 | ) | (8,725 | ) | (9,345 | ) | (15,051 | ) | (21,370 | ) | (22,337 | ) | (24,553 | ) | (33,949 | ) | (83,311 | ) | ||||||||||||||||||||||
| ABS issuance expense amortization |
(633 | ) | (737 | ) | (811 | ) | (882 | ) | (985 | ) | (915 | ) | (552 | ) | (602 | ) | (569 | ) | (3,415 | ) | (2,638 | ) | ||||||||||||||||||||||
| ABS interest rate agreement expense |
(61 | ) | (62 | ) | (62 | ) | (68 | ) | (87 | ) | (11,561 | ) | (1,127 | ) | (1,136 | ) | (1,204 | ) | (279 | ) | (15,028 | ) | ||||||||||||||||||||||
| ABS issuance premium amortization expense |
(459 | ) | (407 | ) | (548 | ) | (576 | ) | (542 | ) | (412 | ) | (113 | ) | (115 | ) | (115 | ) | (2,073 | ) | (755 | ) | ||||||||||||||||||||||
| Total ABS expense consolidated from trusts (1) |
(8,441 | ) | (8,903 | ) | (9,603 | ) | (10,251 | ) | (10,959 | ) | (27,939 | ) | (23,162 | ) | (24,190 | ) | (26,441 | ) | (39,716 | ) | (101,732 | ) | ||||||||||||||||||||||
| Interest expense on long-term debt |
(6,792 | ) | (6,910 | ) | (6,894 | ) | (6,480 | ) | (3,535 | ) | (2,451 | ) | (2,377 | ) | (2,379 | ) | (2,376 | ) | (23,819 | ) | (9,583 | ) | ||||||||||||||||||||||
| Total interest expense |
(19,060 | ) | (19,528 | ) | (21,724 | ) | (21,417 | ) | (18,302 | ) | (32,916 | ) | (28,276 | ) | (28,868 | ) | (30,645 | ) | (80,971 | ) | (120,705 | ) | ||||||||||||||||||||||
| Net interest income |
36,426 | 37,964 | 35,696 | 36,302 | 35,223 | 20,481 | 31,447 | 30,655 | 28,096 | 145,185 | 110,679 | |||||||||||||||||||||||||||||||||
| (Provision for) reversal of provision for loan losses |
(1,284 | ) | (4,243 | ) | (1,728 | ) | 3,272 | (2,038 | ) | (3,394 | ) | (1,319 | ) | 1,340 | (275 | ) | (4,737 | ) | (3,648 | ) | ||||||||||||||||||||||||
| Net interest income after provision |
35,142 | 33,721 | 33,968 | 39,574 | 33,185 | 17,087 | 30,128 | 31,995 | 27,821 | 140,448 | 107,031 | |||||||||||||||||||||||||||||||||
| Noninterest income |
||||||||||||||||||||||||||||||||||||||||||||
| Mortgage banking activities, net |
(687 | ) | 16,749 | (9,057 | ) | 47,984 | 45,000 | 21,765 | 12,775 | (3,173 | ) | 4,953 | 100,676 | 36,319 | ||||||||||||||||||||||||||||||
| MSR income (loss), net |
606 | 5,628 | 3,113 | 10,547 | 1,021 | (479 | ) | (472 | ) | (434 | ) | (7 | ) | 20,309 | (1,391 | ) | ||||||||||||||||||||||||||||
| Other market valuation adjustments, net |
(6,138 | ) | 390 | 462 | (6,258 | ) | (303 | ) | 1,941 | 957 | (86 | ) | (1,273 | ) | (5,709 | ) | 1,539 | |||||||||||||||||||||||||||
| Realized gains on sales, net (2) |
105 | 1,935 | 10,469 | 223 | 12,266 | 20,336 | 13,940 | 6,995 | 13,508 | 24,893 | 54,779 | |||||||||||||||||||||||||||||||||
| Realized gains on calls, net |
987 | 33 | - | 333 | - | 29 | - | - | 113 | 366 | 142 | |||||||||||||||||||||||||||||||||
| Realized gains, net |
1,092 | 1,968 | 10,469 | 556 | 12,266 | 20,365 | 13,940 | 6,995 | 13,621 | 25,259 | 54,921 | |||||||||||||||||||||||||||||||||
| Total noninterest income (loss), net |
(5,127 | ) | 24,735 | 4,987 | 52,829 | 57,984 | 43,592 | 27,200 | 3,302 | 17,294 | 140,535 | 91,388 | ||||||||||||||||||||||||||||||||
| Fixed compensation expense |
(6,742 | ) | (5,750 | ) | (5,808 | ) | (6,067 | ) | (5,623 | ) | (4,275 | ) | (4,412 | ) | (4,373 | ) | (4,835 | ) | (23,248 | ) | (17,895 | ) | ||||||||||||||||||||||
| Variable compensation expense |
(2,751 | ) | (3,908 | ) | (5,636 | ) | (3,974 | ) | (4,850 | ) | (5,475 | ) | (5,602 | ) | (3,037 | ) | (2,606 | ) | (18,367 | ) | (16,720 | ) | ||||||||||||||||||||||
| Equity compensation expense |
(2,360 | ) | (2,196 | ) | (1,997 | ) | (3,396 | ) | (2,487 | ) | (2,499 | ) | (2,151 | ) | (2,958 | ) | (2,176 | ) | (10,076 | ) | (9,784 | ) | ||||||||||||||||||||||
| Severance expense |
- | - | (445 | ) | (3,366 | ) | (68 | ) | - | - | - | (200 | ) | (3,879 | ) | (200 | ) | |||||||||||||||||||||||||||
| Other operating expense |
(7,672 | ) | (7,633 | ) | (8,075 | ) | (6,888 | ) | (6,623 | ) | (6,176 | ) | (4,946 | ) | (4,810 | ) | (4,828 | ) | (29,219 | ) | (20,760 | ) | ||||||||||||||||||||||
| Total operating expenses |
(19,525 | ) | (19,487 | ) | (21,961 | ) | (23,690 | ) | (19,651 | ) | (18,425 | ) | (17,111 | ) | (15,178 | ) | (14,645 | ) | (84,789 | ) | (65,359 | ) | ||||||||||||||||||||||
| Other expense |
- | (12,000 | ) | - | - | - | - | - | - | - | (12,000 | ) | - | |||||||||||||||||||||||||||||||
| Benefit from (provision for) income taxes |
1,843 | (1,835 | ) | 4,935 | (3,140 | ) | (10,908 | ) | (176 | ) | (516 | ) | (592 | ) | (7 | ) | (10,948 | ) | (1,291 | ) | ||||||||||||||||||||||||
| Net income |
$ | 12,333 | $ | 25,134 | $ | 21,929 | $ | 65,573 | $ | 60,610 | $ | 42,078 | $ | 39,701 | $ | 19,527 | $ | 30,463 | $ | 173,246 | $ | 131,769 | ||||||||||||||||||||||
| Diluted average shares |
84,941 | 84,395 | 84,422 | 96,172 | 87,345 | 82,498 | 80,764 | 78,815 | 79,892 | 93,695 | 80,674 | |||||||||||||||||||||||||||||||||
| Net income per share |
$ | 0.14 | $ | 0.29 | $ | 0.25 | $ | 0.71 | $ | 0.69 | $ | 0.50 | $ | 0.48 | $ | 0.24 | $ | 0.37 | $ | 1.94 | $ | 1.59 | ||||||||||||||||||||||
(1) Interest expense on ABS issued for the fourth quarter of 2012 includes accelerated recognition of $11 million of deferred hedging costs relating to Acacia entities upon deconsolidation of these entities.
(2) Realized gains on sales, net includes $15 million of gains related to the deconsolidation of certain Sequoia and Acacia entities during the fourth quarter of 2012.
| THE REDWOOD REVIEW 1ST QUARTER 2014
|
Table 1: GAAP Earnings | |||
|
|
Table 2: Taxable and GAAP Income1 Differences and Dividends ($ in thousands, except per share data) | |||
| Estimated Q1 2014 | Estimated Twelve Months 2013 (2) | Actual Twelve Months 2012 (2) | ||||||||||||||||||||||||||||||||||
| Taxable Income |
GAAP Income |
Differences | Taxable Income |
GAAP Income |
Differences | Taxable Income |
GAAP Income |
Differences | ||||||||||||||||||||||||||||
| Taxable and GAAP Income Differences |
||||||||||||||||||||||||||||||||||||
| Interest income |
$ | 46,876 | $ | 55,486 | $ | (8,610 | ) | $ | 208,627 | $ | 226,156 | $ | (17,529 | ) | $ | 160,737 | $ | 231,384 | $ | (70,647 | ) | |||||||||||||||
| Interest expense |
(18,982 | ) | (19,060 | ) | 78 | (55,470 | ) | (80,971 | ) | 25,501 | (26,187 | ) | (120,705 | ) | 94,518 | |||||||||||||||||||||
| Net interest income |
27,894 | 36,426 | (8,532 | ) | 153,157 | 145,185 | 7,972 | 134,550 | 110,679 | 23,871 | ||||||||||||||||||||||||||
| Provision for loan losses |
- | (1,284 | ) | 1,284 | - | (4,737 | ) | 4,737 | - | (3,648 | ) | 3,648 | ||||||||||||||||||||||||
| Realized credit losses |
(3,016 | ) | - | (3,016 | ) | (13,068 | ) | - | (13,068 | ) | (25,609 | ) | - | (25,609 | ) | |||||||||||||||||||||
| Other market valuation adjustments, net |
- | (6,138 | ) | 6,138 | - | (5,709 | ) | 5,709 | - | 1,539 | (1,539 | ) | ||||||||||||||||||||||||
| Mortgage banking activities, net |
2,321 | (687 | ) | 3,008 | 17,708 | 100,676 | (82,968 | ) | (401 | ) | 36,319 | (36,720 | ) | |||||||||||||||||||||||
| MSR income, net |
3,221 | 606 | 2,615 | 8,218 | 20,309 | (12,091 | ) | 623 | (1,391 | ) | 2,014 | |||||||||||||||||||||||||
| Operating expenses |
(19,179 | ) | (19,525 | ) | 346 | (72,406 | ) | (84,789 | ) | 12,383 | (56,156 | ) | (65,359 | ) | 9,203 | |||||||||||||||||||||
| Other expense |
- | - | - | - | (12,000 | ) | 12,000 | - | - | - | ||||||||||||||||||||||||||
| Realized gains, net |
- | 1,092 | (1,092 | ) | - | 25,259 | (25,259 | ) | - | 54,921 | (54,921 | ) | ||||||||||||||||||||||||
| (Provision for) benefit from income taxes
|
(32 | ) | 1,843 | (1,875 | ) | (291 | ) | (10,948 | ) | 10,657 | (93 | ) | (1,291 | ) | 1,198 | |||||||||||||||||||||
| Income |
$ | 11,209 | $ | 12,333 | $ | (1,124 | ) | $ | 93,318 | $ | 173,246 | $ | (79,928 | ) | $ | 52,914 | $ | 131,769 | $ | (78,855 | ) | |||||||||||||||
| REIT taxable income |
$ | 15,462 | $ | 76,169 | $ | 60,542 | ||||||||||||||||||||||||||||||
| Taxable (loss) income at taxable subsidiaries |
(4,253 | ) | 17,149 | (7,627 | ) | |||||||||||||||||||||||||||||||
| Taxable income |
$ | 11,209 | $ | 93,318 | $ | 52,915 | ||||||||||||||||||||||||||||||
| Shares used for taxable EPS calculation |
82,620 | 82,505 | 81,716 | |||||||||||||||||||||||||||||||||
| REIT taxable income per share (3) |
$ | 0.19 | $ | 0.93 | $ | 0.75 | ||||||||||||||||||||||||||||||
| Taxable income (loss) per share at taxable subsidiaries |
$ | (0.05 | ) | $ | 0.21 | $ | (0.09 | ) | ||||||||||||||||||||||||||||
| Taxable income per share (3) |
$ | 0.14 | $ | 1.14 | $ | 0.66 | ||||||||||||||||||||||||||||||
| Dividends |
||||||||||||||||||||||||||||||||||||
| Dividends declared |
$ | 23,110 | $ | 92,005 | $ | 80,134 | ||||||||||||||||||||||||||||||
| Dividends per share (4) |
$ | 0.28 | $ | 1.12 | $ | 1.00 | ||||||||||||||||||||||||||||||
(1) Taxable income for 2014 and 2013 are estimates until we file our tax returns for those years.
(2) Reconciliation of GAAP income to taxable income (loss) for prior quarters is provided in the respective Redwood Reviews for those quarters.
(3) REIT taxable income per share and taxable income (loss) per share are based on the number of shares outstanding at the end of each quarter. The annual REIT taxable income per share and taxable income (loss) per share are the sum of the four quarterly per share estimates.
(4) Dividends in 2013 were characterized as 89% ordinary income, or $82 million, and 11% return of capital, or $10 million. Dividends in 2012 were characterized as 77% ordinary income, or $62 million, and 23% return of capital, or $18 million. The portion of Redwood’s dividends characterized as a return of capital is not taxable to a shareholder and reduces a shareholder’s basis for shares held at each quarterly distribution date, but not to below $0.
| THE REDWOOD REVIEW 1ST QUARTER 2014
|
Table 2: Taxable and GAAP Income Differences and Dividends |
49
| ||
|
|
Table 3: Book Value and Financial Ratios ($ in millions, except per share data) | 50
| ||
| 2014 Q1 |
2013 Q4 |
2013 Q3 |
2013 Q2 |
2013 Q1 |
2012 Q4 |
2012 Q3 |
2012 Q2 |
2012 Q1 |
||||||||||||||||||||||||||||
| Short-term debt |
$ | 1,288 | $ | 863 | $ | 838 | $ | 1,446 | $ | 721 | $ | 552 | $ | 522 | $ | 455 | $ | 441 | ||||||||||||||||||
| Long-term debt |
514 | 476 | 472 | 444 | 444 | 140 | 140 | 140 | 140 | |||||||||||||||||||||||||||
| Total debt at Redwood |
$ | 1,802 | $ | 1,339 | $ | 1,310 | $ | 1,890 | $ | 1,165 | $ | 692 | $ | 662 | $ | 595 | $ | 581 | ||||||||||||||||||
| ABS issued at consolidated entities |
||||||||||||||||||||||||||||||||||||
| Residential Resecuritization ABS issued |
82 | 95 | 112 | 134 | 149 | 165 | 179 | 193 | 207 | |||||||||||||||||||||||||||
| Commercial Securitization ABS issued |
148 | 154 | 159 | 160 | 160 | 172 | - | - | - | |||||||||||||||||||||||||||
| Legacy Sequoia entities ABS issued |
1,624 | 1,694 | 1,791 | 1,921 | 2,056 | 2,193 | 2,995 | 3,126 | 3,260 | |||||||||||||||||||||||||||
| Legacy Acacia entities ABS issued |
- | - | - | - | - | - | 255 | 244 | 237 | |||||||||||||||||||||||||||
| Total ABS issued |
1,854 | 1,943 | 2,062 | 2,214 | 2,365 | 2,530 | 3,429 | 3,564 | 3,704 | |||||||||||||||||||||||||||
| Consolidated GAAP Debt |
$ | 3,656 | $ | 3,282 | $ | 3,372 | $ | 4,104 | $ | 3,529 | $ | 3,222 | $ | 4,091 | $ | 4,159 | $ | 4,285 | ||||||||||||||||||
| Stockholders’ equity |
$ | 1,251 | $ | 1,245 | $ | 1,207 | $ | 1,209 | $ | 1,188 | $ | 1,140 | $ | 1,050 | $ | 951 | $ | 962 | ||||||||||||||||||
| Debt at Redwood to stockholders’ equity |
1.4x | 1.1x | 1.1x | 1.6x | 1.0x | 0.6x | 0.6x | 0.6x | 0.6x | |||||||||||||||||||||||||||
| Consolidated GAAP debt to stockholders’ equity |
2.9x | 2.6x | 2.8x | 3.4x | 3.0x | 2.8x | 3.9x | 4.4x | 4.5x | |||||||||||||||||||||||||||
| Shares outstanding at period end (in thousands) |
82,620 | 82,505 | 82,389 | 82,332 | 81,706 | 81,716 | 81,526 | 79,263 | 78,756 | |||||||||||||||||||||||||||
| Book value per share |
$ | 15.14 | $ | 15.10 | $ | 14.65 | $ | 14.69 | $ | 14.54 | $ | 13.95 | $ | 12.88 | $ | 12.00 | $ | 12.22 | ||||||||||||||||||
| THE REDWOOD REVIEW 1ST QUARTER 2014
|
Table 3: Book Value and Financial Ratios | |||
|
|
Table 4: Yields and Profitability Ratios1 ($ in thousands) | |||
| 2014 Q1 |
2013 Q4 |
2013 Q3 |
2013 Q2 |
2013 Q1 |
2012 Q4 (2) |
2012 Q3 |
2012 Q2 |
2012 Q1 |
Twelve 2013 |
Twelve 2012 |
||||||||||||||||||||||||||||||||||
| Interest income |
$ | 55,486 | $ | 57,492 | $ | 57,420 | $ | 57,719 | $ | 53,525 | $ | 53,397 | $ | 59,723 | $ | 59,523 | $ | 58,741 | $ | 226,156 | $ | 231,384 | ||||||||||||||||||||||
| Average consolidated earning assets |
$ | 4,558,020 | $ | 4,482,980 | $ | 4,808,815 | $ | 4,858,695 | $ | 4,569,121 | $ | 4,856,538 | $ | 5,178,913 | $ | 5,146,111 | $ | 5,351,918 | $ | 4,680,020 | $ | 5,132,946 | ||||||||||||||||||||||
| Asset yield |
4.87% | 5.13% | 4.78% | 4.75% | 4.69% | 4.40% | 4.61% | 4.63% | 4.39% | 4.83% | 4.51% | |||||||||||||||||||||||||||||||||
| Interest expense |
$ | (19,060 | ) | $ | (19,528 | ) | $ | (21,724 | ) | $ | (21,417 | ) | $ | (18,302 | ) | $ | (32,916 | ) | $ | (28,276 | ) | $ | (28,868 | ) | $ | (30,645 | ) | $ | (80,971 | ) | $ | (120,705 | ) | |||||||||||
| Average consolidated interest-bearing liabilities |
$ | 3,361,509 | $ | 3,333,438 | $ | 3,710,613 | $ | 3,747,078 | $ | 3,494,668 | $ | 3,727,576 | $ | 4,166,828 | $ | 4,207,316 | $ | 4,423,167 | $ | 3,571,389 | $ | 4,130,216 | ||||||||||||||||||||||
| Cost of funds |
2.27% | 2.34% | 2.34% | 2.29% | 2.09% | 3.53% | 2.71% | 2.74% | 2.77% | 2.27% | 2.92% | |||||||||||||||||||||||||||||||||
| Asset yield |
4.87% | 5.13% | 4.78% | 4.75% | 4.69% | 4.40% | 4.61% | 4.63% | 4.39% | 4.83% | 4.51% | |||||||||||||||||||||||||||||||||
| Cost of funds |
(2.27% | ) | (2.34% | ) | (2.34% | ) | (2.29% | ) | (2.09% | ) | (3.53% | ) | (2.71% | ) | (2.74% | ) | (2.77% | ) | (2.27% | ) | (2.92% | ) | ||||||||||||||||||||||
| Interest rate spread |
2.60% | 2.79% | 2.43% | 2.47% | 2.59% | 0.87% | 1.90% | 1.88% | 1.62% | 2.57% | 1.59% | |||||||||||||||||||||||||||||||||
| Net interest income |
$ | 36,426 | $ | 37,964 | $ | 35,696 | $ | 36,302 | $ | 35,223 | $ | 20,481 | $ | 31,447 | $ | 30,655 | $ | 28,096 | $ | 145,185 | $ | 110,679 | ||||||||||||||||||||||
| Average consolidated earning assets |
$ | 4,558,020 | $ | 4,482,980 | $ | 4,808,815 | $ | 4,858,695 | $ | 4,569,121 | $ | 4,856,538 | $ | 5,178,913 | $ | 5,146,111 | $ | 5,351,918 | $ | 4,680,020 | $ | 5,132,946 | ||||||||||||||||||||||
| Net interest margin |
3.20% | 3.39% | 2.97% | 2.99% | 3.08% | 1.69% | 2.43% | 2.38% | 2.10% | 3.10% | 2.16% | |||||||||||||||||||||||||||||||||
| Operating expenses |
$ | (19,525 | ) | $ | (19,487 | ) | $ | (21,961 | ) | $ | (23,690 | ) | $ | (19,651 | ) | $ | (18,425 | ) | $ | (17,111 | ) | $ | (15,178 | ) | $ | (14,645 | ) | $ | (84,789 | ) | $ | (65,359 | ) | |||||||||||
| Average total assets |
$ | 4,791,512 | $ | 4,681,988 | $ | 5,010,779 | $ | 5,103,812 | $ | 4,823,321 | $ | 5,090,253 | $ | 5,371,679 | $ | 5,307,961 | $ | 5,505,797 | $ | 4,904,878 | $ | 5,318,442 | ||||||||||||||||||||||
| Average total equity |
$ | 1,243,006 | $ | 1,217,273 | $ | 1,217,418 | $ | 1,204,807 | $ | 1,161,546 | $ | 1,088,565 | $ | 987,692 | $ | 945,805 | $ | 926,138 | $ | 1,200,461 | $ | 987,329 | ||||||||||||||||||||||
| Operating expenses / net interest income |
53.60% | 51.33% | 61.52% | 65.26% | 55.79% | 89.96% | 54.41% | 49.51% | 52.12% | 58.40% | 59.05% | |||||||||||||||||||||||||||||||||
| Operating expenses / average total assets |
1.63% | 1.66% | 1.75% | 1.86% | 1.63% | 1.45% | 1.27% | 1.14% | 1.06% | 1.73% | 1.23% | |||||||||||||||||||||||||||||||||
| Operating expenses / average total equity |
6.28% | 6.40% | 7.22% | 7.87% | 6.77% | 6.77% | 6.93% | 6.42% | 6.33% | 7.06% | 6.62% | |||||||||||||||||||||||||||||||||
| GAAP net income |
$ | 12,333 | $ | 25,134 | $ | 21,929 | $ | 65,573 | $ | 60,610 | $ | 42,078 | $ | 39,701 | $ | 19,527 | $ | 30,463 | $ | 173,246 | $ | 131,769 | ||||||||||||||||||||||
| GAAP net income / average total assets |
1.03% | 2.15% | 1.75% | 5.14% | 5.03% | 3.31% | 2.96% | 1.47% | 2.21% | 3.53% | 2.48% | |||||||||||||||||||||||||||||||||
| GAAP net income / average equity (GAAP ROE) |
3.97% | 8.26% | 7.21% | 21.77% | 20.87% | 15.46% | 16.08% | 8.26% | 13.16% | 14.43% | 13.35% | |||||||||||||||||||||||||||||||||
(1) All percentages in this table are shown on an annualized basis.
| THE REDWOOD REVIEW 1ST QUARTER 2014
|
Table 4: Yields and Profitability Ratios |
51
| ||
|
|
Table 5: Average Balance Sheet ($ in thousands) | 52
| ||
| 2014 Q1 |
2013 Q4 |
2013 Q3 |
2013 Q2 |
2013 Q1 |
2012 Q4 |
2012 Q3 |
2012 Q2 |
2012 Q1 |
Twelve Months 2013 |
Twelve Months 2012 |
||||||||||||||||||||||||||||||||||
| Real estate assets at Redwood |
|
|||||||||||||||||||||||||||||||||||||||||||
| Residential loans at fair value - Held-for-sale |
$ | 518,054 | $ | 554,467 | $ | 860,923 | $ | 1,060,347 | $ | 818,950 | $ | 418,722 | $ | 466,246 | $ | 363,882 | $ | 319,353 | $ | 823,049 | $ | 392,326 | ||||||||||||||||||||||
| Commercial loans - Held-for-sale |
68,169 | 73,204 | 67,999 | 50,366 | 49,061 | 6,886 | - | - | - | 60,245 | 1,731 | |||||||||||||||||||||||||||||||||
| Commercial loans at fair value - Held-for-investment |
20,626 | - | - | - | - | - | - | - | - | - | - | |||||||||||||||||||||||||||||||||
| Commercial loans at amortized cost - Held-for-investment |
343,705 | 346,333 | 347,633 | 332,113 | 319,760 | 296,990 | 267,032 | 199,440 | 169,432 | 336,563 | 233,490 | |||||||||||||||||||||||||||||||||
| Senior residential securities |
||||||||||||||||||||||||||||||||||||||||||||
| Prime |
725,551 | 586,675 | 440,616 | 453,230 | 416,774 | 427,149 | 447,994 | 457,549 | 325,619 | 474,697 | 414,703 | |||||||||||||||||||||||||||||||||
| Non-prime |
174,811 | 178,994 | 187,724 | 227,295 | 235,583 | 243,336 | 236,006 | 262,084 | 280,970 | 207,190 | 255,512 | |||||||||||||||||||||||||||||||||
| Total senior residential securities |
900,362 | 765,669 | 628,340 | 680,525 | 652,357 | 670,485 | 684,000 | 719,633 | 606,589 | 681,887 | 670,215 | |||||||||||||||||||||||||||||||||
| Residential Re-REMIC securities |
109,753 | 102,836 | 101,808 | 100,824 | 99,769 | 99,088 | 99,890 | 105,281 | 87,001 | 101,319 | 97,824 | |||||||||||||||||||||||||||||||||
| Subordinate residential securities |
||||||||||||||||||||||||||||||||||||||||||||
| Prime |
509,906 | 492,708 | 440,235 | 320,490 | 218,477 | 153,223 | 118,549 | 104,078 | 81,253 | 368,927 | 114,394 | |||||||||||||||||||||||||||||||||
| Non-prime |
- | - | 1,286 | 2,051 | 2,064 | 3,783 | 6,669 | 8,325 | 9,721 | 1,344 | 7,114 | |||||||||||||||||||||||||||||||||
| Total subordinate residential securities |
509,906 | 492,708 | 441,521 | 322,541 | 220,541 | 157,006 | 125,218 | 112,403 | 90,974 | 370,271 | 121,508 | |||||||||||||||||||||||||||||||||
| Commercial subordinate securities |
- | - | - | - | 766 | 2,154 | 4,047 | 3,980 | 3,946 | 189 | 3,530 | |||||||||||||||||||||||||||||||||
| CDO |
- | - | - | - | - | 4 | 14 | 14 | 762 | - | 198 | |||||||||||||||||||||||||||||||||
| Mortgage servicing rights |
62,943 | 60,822 | 55,622 | 31,318 | 10,299 | 4,867 | 2,122 | 1,729 | 859 | 39,698 | 2,394 | |||||||||||||||||||||||||||||||||
| Total real estate assets at Redwood |
2,533,518 | 2,396,039 | 2,503,846 | 2,578,034 | 2,171,503 | 1,656,202 | 1,648,569 | 1,506,362 | 1,278,916 | 2,413,221 | 1,523,216 | |||||||||||||||||||||||||||||||||
| Earning assets at Acacia |
- | - | - | - | - | 171,650 | 270,891 | 262,959 | 252,907 | - | 239,502 | |||||||||||||||||||||||||||||||||
| Earning assets at Consolidated Sequoia |
1,711,438 | 1,793,535 | 1,910,814 | 2,043,820 | 2,177,315 | 2,751,130 | 3,128,076 | 3,258,137 | 3,597,081 | 1,980,127 | 3,182,273 | |||||||||||||||||||||||||||||||||
| Total earning assets at Legacy Consolidated Entities |
1,711,438 | 1,793,535 | 1,910,814 | 2,043,820 | 2,177,315 | 2,922,780 | 3,398,967 | 3,521,096 | 3,849,988 | 1,980,127 | 3,421,775 | |||||||||||||||||||||||||||||||||
| Cash and cash equivalents |
159,089 | 167,453 | 274,657 | 96,998 | 77,911 | 177,555 | 86,531 | 94,511 | 211,786 | 154,829 | 142,538 | |||||||||||||||||||||||||||||||||
| Earning assets |
4,404,045 | 4,357,027 | 4,689,317 | 4,718,852 | 4,426,729 | 4,756,537 | 5,134,067 | 5,121,969 | 5,340,690 | 4,548,177 | 5,087,529 | |||||||||||||||||||||||||||||||||
| Balance sheet mark-to-market adjustments |
153,975 | 125,953 | 119,498 | 139,843 | 142,392 | 100,001 | 44,846 | 24,142 | 12,087 | 131,843 | 45,417 | |||||||||||||||||||||||||||||||||
| Earning assets - reported value |
4,558,020 | 4,482,980 | 4,808,815 | 4,858,695 | 4,569,121 | 4,856,538 | 5,178,913 | 5,146,111 | 5,351,918 | 4,680,020 | 5,132,946 | |||||||||||||||||||||||||||||||||
| Other assets |
233,492 | 199,008 | 201,964 | 245,117 | 254,200 | 233,715 | 192,766 | 161,850 | 153,020 | 224,858 | 185,496 | |||||||||||||||||||||||||||||||||
| Total assets |
$ | 4,791,512 | $ | 4,681,988 | $ | 5,010,779 | $ | 5,103,812 | $ | 4,823,321 | $ | 5,090,253 | $ | 5,371,679 | $ | 5,307,961 | $ | 5,505,797 | $ | 4,904,878 | $ | 5,318,442 | ||||||||||||||||||||||
| Short-term debt |
$ | 1,006,349 | $ | 893,481 | $ | 1,150,917 | $ | 1,053,610 | $ | 854,238 | $ | 539,579 | $ | 570,775 | $ | 474,053 | $ | 362,107 | $ | 988,616 | $ | 487,003 | ||||||||||||||||||||||
| Residential Resecuritization ABS issued |
85,236 | 99,940 | 118,338 | 138,817 | 153,487 | 168,634 | 182,702 | 196,837 | 210,360 | 127,473 | 189,557 | |||||||||||||||||||||||||||||||||
| Commercial Securitization ABS issued |
144,936 | 150,716 | 155,661 | 155,812 | 163,409 | 61,830 | - | - | - | 156,362 | 15,542 | |||||||||||||||||||||||||||||||||
| Consolidated Sequoia ABS issued |
1,644,626 | 1,722,583 | 1,835,401 | 1,965,149 | 2,099,041 | 2,661,564 | 3,039,273 | 3,166,476 | 3,504,155 | 1,904,320 | 3,091,542 | |||||||||||||||||||||||||||||||||
| Acacia ABS issued |
- | - | - | - | - | 154,617 | 235,789 | 231,673 | 208,281 | - | 207,522 | |||||||||||||||||||||||||||||||||
| Other liabilities |
186,997 | 131,277 | 82,748 | 151,927 | 167,107 | 274,112 | 217,159 | 154,840 | 156,492 | 133,028 | 200,897 | |||||||||||||||||||||||||||||||||
| Other long-term debt |
480,362 | 466,718 | 450,296 | 433,690 | 224,493 | 141,352 | 138,289 | 138,277 | 138,264 | 394,618 | 139,050 | |||||||||||||||||||||||||||||||||
| Total liabilities
|
3,548,506 | 3,464,715 | 3,793,361 | 3,899,005 | 3,661,775 | 4,001,688 | 4,383,987 | 4,362,156 | 4,579,659 | 3,704,417 | 4,331,113 | |||||||||||||||||||||||||||||||||
| Total equity |
1,243,006 | 1,217,273 | 1,217,418 | 1,204,807 | 1,161,546 | 1,088,565 | 987,692 | 945,805 | 926,138 | 1,200,461 | 987,329 | |||||||||||||||||||||||||||||||||
| Total liabilities and equity |
$ | 4,791,512 | $ | 4,681,988 | $ | 5,010,779 | $ | 5,103,812 | $ | 4,823,321 | $ | 5,090,253 | $ | 5,371,679 | $ | 5,307,961 | $ | 5,505,797 | $ | 4,904,878 | $ | 5,318,442 | ||||||||||||||||||||||
| THE REDWOOD REVIEW 1ST QUARTER 2014
|
Table 5: Average Balance Sheet | |||
|
|
Table 6: Balances & Yields by Securities Portfolio at Redwood1 ($ in thousands) | |||
|
2014 Q1 |
2013 Q4 |
2013 Q3 |
2013 Q2 |
2013 Q1 |
2012 Q4 |
2014 Q1 |
2013 Q4 |
2013 Q3 |
2013 Q2 |
2013 Q1 |
2012 Q4 |
|||||||||||||||||||||||||||||||||||||||||
| Residential Prime Senior |
|
Residential Prime Subordinate |
|
|||||||||||||||||||||||||||||||||||||||||||||||||
| Principal balance |
$ | 703,977 | $ | 670,051 | $ | 379,598 | $ | 435,536 | $ | 460,273 | $ | 485,033 | Principal balance |
$ | 700,081 | $ | 709,629 | $ | 664,597 | $ | 536,235 | $ | 428,588 | $ | 290,276 | |||||||||||||||||||||||||||
| Unamortized discount |
(42,255 | ) | (44,133 | ) | (47,000 | ) | (42,520 | ) | (48,893 | ) | (53,601 | ) | Unamortized discount |
(135,877 | ) | (136,643 | ) | (122,631 | ) | (84,645 | ) | (71,412 | ) | (33,930 | ) | |||||||||||||||||||||||||||
| Credit reserve |
(6,815 | ) | (10,144 | ) | (12,964 | ) | (32,068 | ) | (28,326 | ) | (26,100 | ) | Credit reserve |
(55,874 | ) | (61,643 | ) | (76,080 | ) | (90,799 | ) | (83,148 | ) | (93,160 | ) | |||||||||||||||||||||||||||
| Unrealized gains, net |
44,879 | 46,532 | 44,188 | 49,211 | 64,260 | 61,191 | Unrealized gains, net |
34,377 | 19,526 | 16,778 | 20,936 | 25,676 | 21,447 | |||||||||||||||||||||||||||||||||||||||
| Interest-only securities |
106,228 | 110,505 | 117,443 | 123,591 | 55,289 | 10,409 | Interest-only securities |
194 | 206 | 252 | 258 | 337 | 363 | |||||||||||||||||||||||||||||||||||||||
| Fair value |
$ | 806,014 | $ | 772,811 | $ | 481,265 | $ | 533,750 | $ | 502,603 | $ | 476,932 | Fair value |
$ | 542,901 | $ | 531,075 | $ | 482,916 | $ | 381,985 | $ | 300,041 | $ | 184,996 | |||||||||||||||||||||||||||
| Average amortized cost |
$ | 725,551 | $ | 586,675 | $ | 440,616 | $ | 453,230 | $ | 416,775 | $ | 427,149 | Mezzanine |
|||||||||||||||||||||||||||||||||||||||
| Interest income |
$ | 14,640 | $ | 13,230 | $ | 12,639 | $ | 12,341 | $ | 9,723 | $ | 9,113 | Average amortized cost |
$ | 399,134 | $ | 382,348 | $ | 336,781 | $ | 239,118 | $ | 145,732 | $ | 84,429 | |||||||||||||||||||||||||||
| Annualized yield |
8.07% | 9.02% | 11.47% | 10.89% | 9.33% | 8.53% | Interest income |
$ | 5,127 | $ | 4,810 | $ | 4,153 | $ | 3,010 | $ | 1,868 | $ | 1,043 | |||||||||||||||||||||||||||||||||
| Annualized yield |
5.14% | 5.03% | 4.93% | 5.04% | 5.13% | 4.94% | ||||||||||||||||||||||||||||||||||||||||||||||
| Residential Non-Prime Senior |
|
|||||||||||||||||||||||||||||||||||||||||||||||||||
| Principal balance |
$ | 212,629 | $ | 218,603 | $ | 225,649 | $ | 259,524 | $ | 268,926 | $ | 278,229 | Subordinate |
|||||||||||||||||||||||||||||||||||||||
| Unamortized discount |
(36,867 | ) | (36,882 | ) | (40,243 | ) | (39,030 | ) | (40,541 | ) | (42,842 | ) | Average amortized cost |
$ | 110,772 | $ | 110,360 | $ | 103,454 | $ | 81,372 | $ | 72,745 | $ | 68,795 | |||||||||||||||||||||||||||
| Credit reserve |
(11,625 | ) | (13,840 | ) | (12,813 | ) | (18,078 | ) | (18,079 | ) | (18,104 | ) | Interest income |
$ | 4,140 | $ | 4,535 | $ | 4,370 | $ | 3,938 | $ | 3,578 | $ | 3,519 | |||||||||||||||||||||||||||
| Unrealized gains, net |
28,860 | 25,505 | 22,561 | 22,271 | 30,118 | 27,983 | Annualized yield |
14.95% | 16.44% | 16.90% | 19.36% | 19.67% | 20.46% | |||||||||||||||||||||||||||||||||||||||
| Interest-only securities |
8,729 | 9,070 | 8,864 | 17,525 | 21,582 | 22,134 | ||||||||||||||||||||||||||||||||||||||||||||||
| Fair value |
$ | 201,726 | $ | 202,456 | $ | 204,018 | $ | 242,212 | $ | 262,006 | $ | 267,400 | Residential Non-Prime Subordinate |
|
||||||||||||||||||||||||||||||||||||||
| Principal balance |
$ | 11,991 | $ | 12,021 | $ | 12,054 | $ | 19,294 | $ | 19,869 | $ | 20,194 | ||||||||||||||||||||||||||||||||||||||||
| Average amortized cost |
$ | 174,811 | $ | 178,994 | $ | 187,724 | $ | 227,296 | $ | 235,583 | $ | 243,336 | Unamortized discount |
(11,207 | ) | (11,207 | ) | (11,240 | ) | (11,982 | ) | (11,993 | ) | (15,666 | ) | |||||||||||||||||||||||||||
| Interest income |
$ | 4,388 | $ | 4,589 | $ | 4,789 | $ | 5,825 | $ | 6,011 | $ | 6,248 | Credit reserve |
(784 | ) | (814 | ) | (814 | ) | (5,270 | ) | (5,829 | ) | (2,433 | ) | |||||||||||||||||||||||||||
| Annualized yield |
10.04% | 10.26% | 10.20% | 10.25% | 10.21% | 10.27% | Unrealized gains, net |
159 | 143 | 133 | 149 | 394 | 226 | |||||||||||||||||||||||||||||||||||||||
| Fair value |
$ | 159 | $ | 143 | $ | 133 | $ | 2,191 | $ | 2,441 | $ | 2,321 | ||||||||||||||||||||||||||||||||||||||||
| Residential Re-REMIC |
|
|||||||||||||||||||||||||||||||||||||||||||||||||||
| Principal balance |
$ | 223,709 | $ | 214,046 | $ | 214,660 | $ | 215,169 | $ | 215,235 | $ | 215,863 | Average amortized cost |
$ | - | $ | - | $ | 1,286 | $ | 2,051 | $ | 2,064 | $ | 3,783 | |||||||||||||||||||||||||||
| Unamortized discount |
(87,910 | ) | (80,188 | ) | (78,789 | ) | (69,590 | ) | (64,547 | ) | (69,310 | ) | Interest income |
$ | 39 | $ | 40 | $ | 124 | $ | 165 | $ | 155 | $ | 266 | |||||||||||||||||||||||||||
| Credit reserve |
(20,590 | ) | (30,429 | ) | (33,621 | ) | (44,195 | ) | (50,406 | ) | (47,235 | ) | Annualized yield |
N/A | N/A | 38.57% | 32.18% | 30.04% | 28.13% | |||||||||||||||||||||||||||||||||
| Unrealized gains, net |
76,999 | 72,947 | 54,096 | 52,783 | 63,155 | 63,717 | ||||||||||||||||||||||||||||||||||||||||||||||
| Fair value |
$ | 192,208 | $ | 176,376 | $ | 156,346 | $ | 154,167 | $ | 163,437 | $ | 163,035 | Commercial Subordinate |
|
||||||||||||||||||||||||||||||||||||||
| Principal balance |
$ | - | $ | - | $ | - | $ | - | $ | - | $ | 29,331 | ||||||||||||||||||||||||||||||||||||||||
| Average amortized cost |
$ | 109,753 | $ | 102,836 | $ | 101,808 | $ | 100,824 | $ | 99,769 | $ | 99,088 | Unamortized discount |
- | - | - | - | - | (3,362 | ) | ||||||||||||||||||||||||||||||||
| Interest income |
$ | 4,096 | $ | 3,883 | $ | 3,574 | $ | 3,835 | $ | 3,758 | $ | 3,385 | Credit reserve |
- | - | - | - | - | (23,916 | ) | ||||||||||||||||||||||||||||||||
| Annualized yield |
14.93% | 15.10% | 14.04% | 15.21% | 15.07% | 13.66% | Unrealized gains, net |
- | - | - | - | - | 12,016 | |||||||||||||||||||||||||||||||||||||||
| Fair value |
$ | - | $ | - | $ | - | $ | - | $ | - | $ | 14,069 | ||||||||||||||||||||||||||||||||||||||||
| Average amortized cost |
$ | - | $ | - | $ | - | $ | - | $ | 766 | $ | 2,154 | ||||||||||||||||||||||||||||||||||||||||
| Interest income |
$ | - | $ | - | $ | - | $ | - | $ | 625 | $ | 230 | ||||||||||||||||||||||||||||||||||||||||
| Annualized yield |
N/A | N/A | N/A | N/A | 326.37% | 42.71% | ||||||||||||||||||||||||||||||||||||||||||||||
(1) Annualized yields for AFS portfolios are based on average amortized cost. Cash flows from many of our subordinate securities can be volatile and in certain cases (e.g., when the fair value of certain securities are close to zero) any interest income earned can result in unusually high reported that are not sustainable and not necessarily meaningful.
| THE REDWOOD REVIEW 1ST QUARTER 2014
|
Table 6: Balances & Yields by Securities Portfolio at Redwood |
53
| ||
|
|
Table 7: Securities and Loans Portfolio Activity at Redwood ($ in thousands) | 54
| ||
| 2014 Q1 |
2013 Q4 |
2013 Q3 |
2013 Q2 |
2013 Q1 |
2012 Q4 |
2014 Q1 |
2013 Q4 |
2013 Q3 |
2013 Q2 |
2013 Q1 |
2012 Q4 |
|||||||||||||||||||||||||||||||||||||||||
| Residential Prime Senior |
|
Residential Non-Prime Subordinate |
|
|||||||||||||||||||||||||||||||||||||||||||||||||
| Beginning fair value |
$ | 772,811 | $ | 481,265 | $ | 533,750 | $ | 502,603 | $ | 476,932 | $ | 496,710 | Beginning fair value |
$ | 143 | $ | 133 | $ | 2,191 | $ | 2,441 | $ | 2,321 | $ | 6,555 | |||||||||||||||||||||||||||
| Acquisitions |
63,889 | 318,983 | 112,644 | 40,642 | 51,208 | 6,708 | Acquisitions |
- | - | - | - | - | - | |||||||||||||||||||||||||||||||||||||||
| Sales |
- | (13,036 | ) | (137,807 | ) | (8,677 | ) | (8,257 | ) | (9,285 | ) | Sales |
- | - | (2,185 | ) | - | - | (4,193 | ) | ||||||||||||||||||||||||||||||||
| Effect of principal payments |
(29,307 | ) | (26,055 | ) | (24,159 | ) | (24,019 | ) | (23,840 | ) | (22,102 | ) | Effect of principal payments |
(5 | ) | (5 | ) | (16 | ) | (14 | ) | (66 | ) | (75 | ) | |||||||||||||||||||||||||||
| Change in fair value, net |
(1,379 | ) | 11,654 | (3,163 | ) | 23,201 | 6,560 | 4,901 | Change in fair value, net |
21 | 15 | 143 | (236 | ) | 186 | 34 | ||||||||||||||||||||||||||||||||||||
| Ending fair value |
$ | 806,014 | $ | 772,811 | $ | 481,265 | $ | 533,750 | $ | 502,603 | $ | 476,932 | Ending fair value |
$ | 159 | $ | 143 | $ | 133 | $ | 2,191 | $ | 2,441 | $ | 2,321 | |||||||||||||||||||||||||||
| Residential Non-Prime Senior |
|
Commercial Subordinate |
|
|||||||||||||||||||||||||||||||||||||||||||||||||
| Beginning fair value |
$ | 202,456 | $ | 204,018 | $ | 242,212 | $ | 262,006 | $ | 267,400 | $ | 262,812 | Beginning fair value |
$ | - | $ | - | $ | - | $ | - | $ | 14,069 | $ | 7,619 | |||||||||||||||||||||||||||
| Acquisitions |
- | - | - | - | - | (188 | ) | Acquisitions |
- | - | - | - | - | - | ||||||||||||||||||||||||||||||||||||||
| Sales |
- | - | (31,725 | ) | - | - | - | Sales |
- | - | - | - | (2,031 | ) | (1,484 | ) | ||||||||||||||||||||||||||||||||||||
| Effect of principal payments |
(5,294 | ) | (6,145 | ) | (7,969 | ) | (8,397 | ) | (8,110 | ) | (7,797 | ) | Effect of principal payments |
- | - | - | - | - | - | |||||||||||||||||||||||||||||||||
| Change in fair value, net |
4,564 | 4,583 | 1,500 | (11,397 | ) | 2,716 | 12,573 | Change in fair value, net (1) |
- | - | - | - | (12,038 | ) | 7,934 | |||||||||||||||||||||||||||||||||||||
| Ending fair value |
$ | 201,726 | $ | 202,456 | $ | 204,018 | $ | 242,212 | $ | 262,006 | $ | 267,400 | Ending fair value |
$ | - | $ | - | $ | - | $ | - | $ | - | $ | 14,069 | |||||||||||||||||||||||||||
| Residential Re-REMIC |
|
Residential Loans |
|
|||||||||||||||||||||||||||||||||||||||||||||||||
| Beginning fair value |
$ | 176,376 | $ | 156,346 | $ | 154,167 | $ | 163,437 | $ | 163,035 | $ | 149,973 | Beginning carrying value |
$ | 404,267 | $ | 727,879 | $ | 1,221,098 | $ | 831,953 | $ | 562,658 | $ | 417,982 | |||||||||||||||||||||||||||
| Acquisitions |
10,200 | - | - | - | - | - | Acquisitions |
1,092,971 | 658,806 | 1,294,372 | 2,567,426 | 2,586,899 | 789,416 | |||||||||||||||||||||||||||||||||||||||
| Sales |
- | - | - | - | - | - | Sales |
(722,403 | ) | (979,661 | ) | (1,771,726 | ) | (2,135,166 | ) | (2,349,089 | ) | (665,078 | ) | |||||||||||||||||||||||||||||||||
| Effect of principal payments |
- | - | - | - | - | - | Principal repayments |
(7,025 | ) | (9,511 | ) | (4,190 | ) | (1,768 | ) | (3,286 | ) | (2,483 | ) | |||||||||||||||||||||||||||||||||
| Change in fair value, net |
5,632 | 20,030 | 2,179 | (9,270 | ) | 402 | 13,062 | Changes in fair value, net |
7,126 | 6,754 | (11,675 | ) | (41,347 | ) | 34,771 | 22,821 | ||||||||||||||||||||||||||||||||||||
| Ending fair value |
$ | 192,208 | $ | 176,376 | $ | 156,346 | $ | 154,167 | $ | 163,437 | $ | 163,035 | Ending carrying value |
$ | 774,936 | $ | 404,267 | $ | 727,879 | $ | 1,221,098 | $ | 831,953 | $ | 562,658 | |||||||||||||||||||||||||||
| Residential Prime Subordinate |
|
Commercial Loans |
|
|||||||||||||||||||||||||||||||||||||||||||||||||
| Beginning fair value |
$ | 531,075 | $ | 482,916 | $ | 381,985 | $ | 300,041 | $ | 184,996 | $ | 145,542 | Beginning carrying value |
$ | 432,455 | $ | 379,853 | $ | 494,823 | $ | 401,438 | $ | 313,010 | $ | 286,070 | |||||||||||||||||||||||||||
| Acquisitions |
- | 49,437 | 110,213 | 92,368 | 114,728 | 35,097 | Originations |
121,412 | 245,045 | 121,523 | 168,365 | 189,407 | 44,182 | |||||||||||||||||||||||||||||||||||||||
| Sales |
- | (1,095 | ) | - | - | - | - | Sales |
(65,336 | ) | (186,443 | ) | (238,102 | ) | (73,780 | ) | (88,212 | ) | (15,000 | ) | ||||||||||||||||||||||||||||||||
| Effect of principal payments |
(3,351 | ) | (4,409 | ) | (5,481 | ) | (4,549 | ) | (4,002 | ) | (3,394 | ) | Principal repayments |
(370 | ) | (11,200 | ) | (848 | ) | (100 | ) | (12,272 | ) | (95 | ) | |||||||||||||||||||||||||||
| Change in fair value, net |
15,177 | 4,226 | (3,801 | ) | (5,875 | ) | 4,319 | 7,751 | Provision for loan losses |
(655 | ) | (869 | ) | (844 | ) | (891 | ) | (685 | ) | (2,320 | ) | |||||||||||||||||||||||||||||||
| Ending fair value |
$ | 542,901 | $ | 531,075 | $ | 482,916 | $ | 381,985 | $ | 300,041 | $ | 184,996 | Discount/fee amortization |
145 | 201 | 138 | 136 | 190 | 173 | |||||||||||||||||||||||||||||||||
| Changes in fair value, net |
3,624 | 5,868 | 3,163 | (345 | ) | - | - | |||||||||||||||||||||||||||||||||||||||||||||
| Ending carrying value |
$ | 491,275 | $ | 432,455 | $ | 379,853 | $ | 494,823 | $ | 401,438 | $ | 313,010 | ||||||||||||||||||||||||||||||||||||||||
(1) During the first quarter of 2013, the change in fair value, net reflects the liquidation of our remaining commercial securities, resulting in an ending fair value of zero for this portfolio.
| THE REDWOOD REVIEW 1ST QUARTER 2014
|
Table 7: Securities and Loans Portfolio Activity at Redwood | |||
This Page Intentionally Left Blank
| 55 |
This Page Intentionally Left Blank
| 56 |
REDWOOD TRUST CORPORATE INFORMATION
For more information about Redwood Trust, please visit our website at: www.redwoodtrust.com
57