Attached files
| file | filename |
|---|---|
| 8-K - 8-K - SHORE BANCSHARES INC | v377153_8k.htm |

GOOD THINGS HAPPEN WHEN YOU’RE IN IT TOGETHER. SHORE BANCSHARES, INC . ANNUAL MEETING April 30, 2014 1

Welcome & Introductions Christopher F. Spurry Chairman of the Board
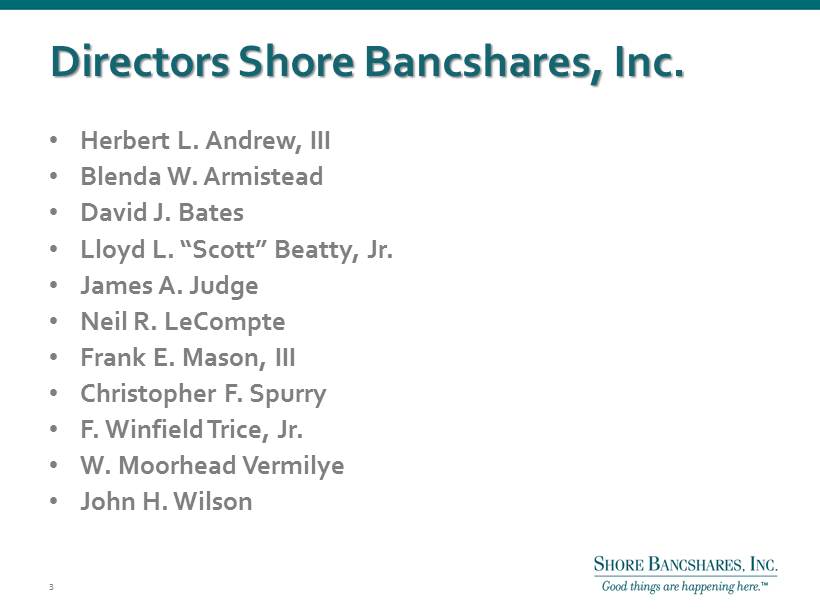
Directors Shore Bancshares, Inc. • Herbert L. Andrew, III • Blenda W. Armistead • David J. Bates • Lloyd L. “Scott” Beatty, Jr. • James A. Judge • Neil R. LeCompte • Frank E. Mason, III • Christopher F. Spurry • F. Winfield Trice, Jr. • W. Moorhead Vermilye • John H. Wilson 3

Chairman’s Remarks & Procedural Matters Christopher F. Spurry Pamela J. Dill

President & CEO Remarks Lloyd L. “Scott” Beatty, Jr.

Forward - Looking Statement This presentation includes forward - looking statements, including statements about future results. These statements are subject to uncertainties and risks, including but not limited to our ability to integrate acquisitions; the strength of the U.S. economy and the local economies where we conduct operations; harsh weather conditions; fluctuations in inflation, interest rates, or monetary policies; changes in the stock market and other capital and real estate markets; legislative or regulatory changes; customer acceptance of third - party products and services; increased competition and its effect on pricing; technological changes; security breaches and computer viruses that may affect our computer systems; changes in consumer spending and savings habits; our growth and profitability; changes in accounting; and our ability to manage the risks involved in the foregoing. These factors, as well as additional factors, can be found in our Annual Report on Form 10 - K for the fiscal year ended December 31, 2013 along with our other filings with the SEC, which are available at the SEC’s internet site ( www.sec.gov ). Actual results may differ materially from projections and could be affected by a variety of factors, including factors beyond our control. Forward - looking statements in this presentation speak only as of the date of these materials, and we assume no obligation to update forward - looking statements or the reasons why actual results could differ. In addition, this presentation includes certain non - GAAP financial measures. 6

SHBI - Stock Price Change % 7

Largest independent Maryland - based bank headquartered and operating on the Delmarva Peninsula. Presence in 8 Counties in MD and DE, 5 th largest in MD. Operates one of the largest independent insurance agencies in Maryland. Recently executed sale of $45 million of NPAs and TDRs which reduced problem assets by approximately 50%. Trading at 93% of Tangible Book Value per share following the asset sale. Company Overview Highlights 8
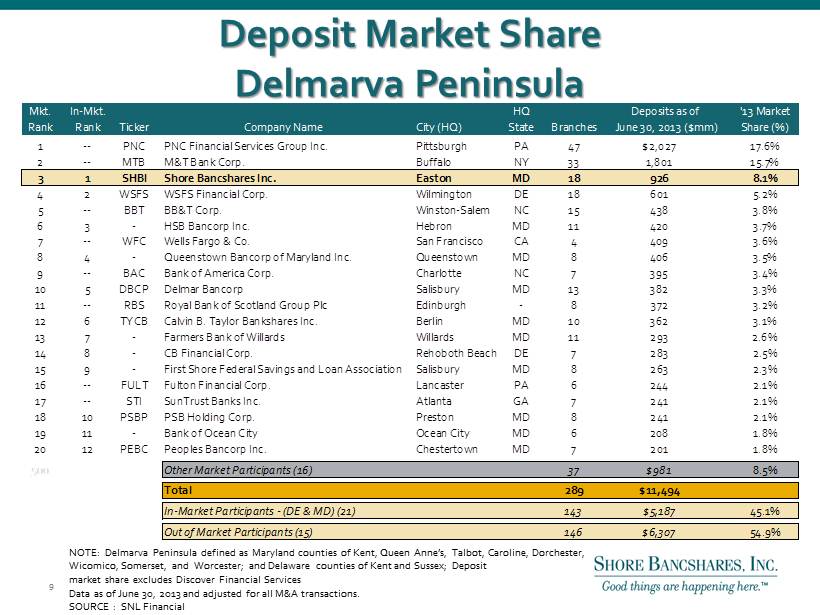
Deposit Market Share Delmarva Peninsula NOTE: Delmarva Peninsula defined as Maryland counties of Kent, Queen Anne’s, Talbot, Caroline, Dorchester, Wicomico, Somerset, and Worcester; and Delaware counties of Kent and Sussex; Deposit m arket share excludes Discover Financial Services Data as of June 30, 2013 and adjusted for all M&A transactions. SOURCE : SNL Financial Mkt. In-Mkt. HQ Deposits as of '13 Market Rank Rank Ticker Company Name City (HQ) State Branches June 30, 2013 ($mm) Share (%) 1 -- PNC PNC Financial Services Group Inc. Pittsburgh PA 47 $2,027 17.6% 2 -- MTB M&T Bank Corp. Buffalo NY 33 1,801 15.7% 3 1 SHBI Shore Bancshares Inc. Easton MD 18 926 8.1% 4 2 WSFS WSFS Financial Corp. Wilmington DE 18 601 5.2% 5 -- BBT BB&T Corp. Winston-Salem NC 15 438 3.8% 6 3 - HSB Bancorp Inc. Hebron MD 11 420 3.7% 7 -- WFC Wells Fargo & Co. San Francisco CA 4 409 3.6% 8 4 - Queenstown Bancorp of Maryland Inc. Queenstown MD 8 406 3.5% 9 -- BAC Bank of America Corp. Charlotte NC 7 395 3.4% 10 5 DBCP Delmar Bancorp Salisbury MD 13 382 3.3% 11 -- RBS Royal Bank of Scotland Group Plc Edinburgh - 8 372 3.2% 12 6 TYCB Calvin B. Taylor Bankshares Inc. Berlin MD 10 362 3.1% 13 7 - Farmers Bank of Willards Willards MD 11 293 2.6% 14 8 - CB Financial Corp. Rehoboth Beach DE 7 283 2.5% 15 9 - First Shore Federal Savings and Loan Association Salisbury MD 8 263 2.3% 16 -- FULT Fulton Financial Corp. Lancaster PA 6 244 2.1% 17 -- STI SunTrust Banks Inc. Atlanta GA 7 241 2.1% 18 10 PSBP PSB Holding Corp. Preston MD 8 241 2.1% 19 11 - Bank of Ocean City Ocean City MD 6 208 1.8% 20 12 PEBC Peoples Bancorp Inc. Chestertown MD 7 201 1.8% 500 Other Market Participants (16) 37 $981 8.5% Total 289 $11,494 In-Market Participants - (DE & MD) (21) 143 $5,187 45.1% Out of Market Participants (15) 146 $6,307 54.9% 9

Shore Bancshares, Inc. Bank Branch Competitors Report Within 1 Mile Within 5 Miles Company Name Competing Branches Deposits in Competing Branches Competing Branches Deposits in Competing Branches Shore Bancshares, Inc . 18 925,966 Money Centers/Regionals 7 1,168,403 7 1,930,539 Community Banks 45 893,329 81 2,170,674 TOTALS 52 2,061,732 88 4,101,213 10

Current Initiatives ● Focus on organic growth - Re - engage sales efforts across all business lines - Grow customer base by taking share from local/national competitors ($4.1 billion available) - Focus on relationships to increase deposit penetration & multi - product usage ● Leverage infrastructure and dominant market position ● Restore consistent profitability - Credit discipline with emphasis on credit quality - Continued emphasis on fee revenue growth - Diligent expense control redeploying savings to revenue generating businesses 11
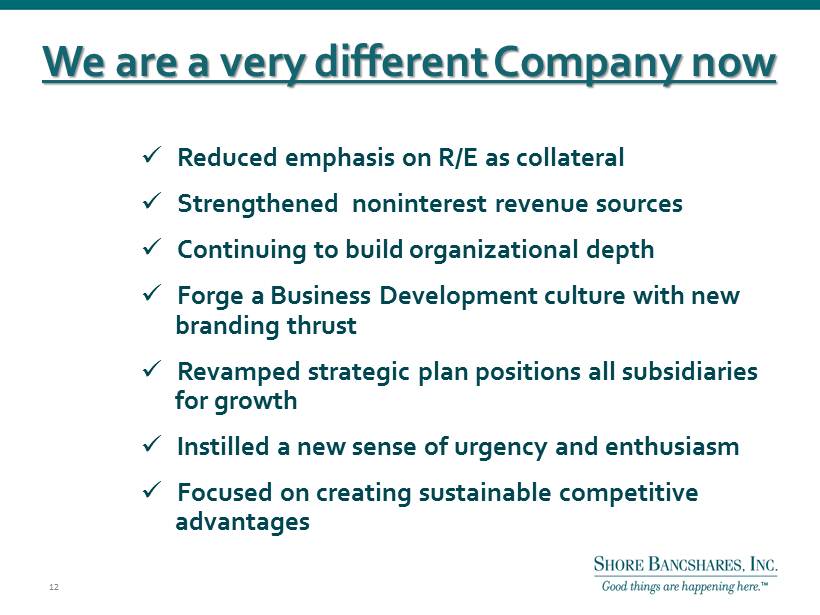
We are a very different Company now x Reduced emphasis on R/E as collateral x Strengthened noninterest revenue sources x Continuing to build organizational depth x Forge a Business Development culture with new branding thrust x Revamped strategic plan positions all subsidiaries for growth x Instilled a new sense of urgency and enthusiasm x Focused on creating sustainable competitive advantages 12

Shore Bancshares, Inc. Year End Highlights George S. Rapp Chief Financial Officer

Financial Summary (As of 3/31/2014) Assets: $1.0 Billion Gross Loans: $704 Million Total Deposits: $929 Million Total Equity: $105 Million Tangible Common Equity: $88.7 Million Tangible Book Value per Share $10.47 Shares Outstanding: 8,471,000 Closing Stock Price (April 28, 2014): $ 9.55 Market Capitalization (April 28, 2014): $ 80.9 Million Price/Tangible Book Value per Share: 91.2% 14

Quarterly Results RESULTS OF OPERATION: $(000) 1Q14 4Q13 1Q13 Net interest income $ 8,323 $ 8,570 $ 8,477 Provision for credit losses 975 474 2,150 Noninterest income 4,788 4,215 4,490 Noninterest expense 10,115 10,468 10,491 Net Income before tax 2,021 1,843 326 Tax expense 763 668 104 Net income 1,258 1,175 222 EPS $ 0.15 $ 0.14 $ 0.03 15
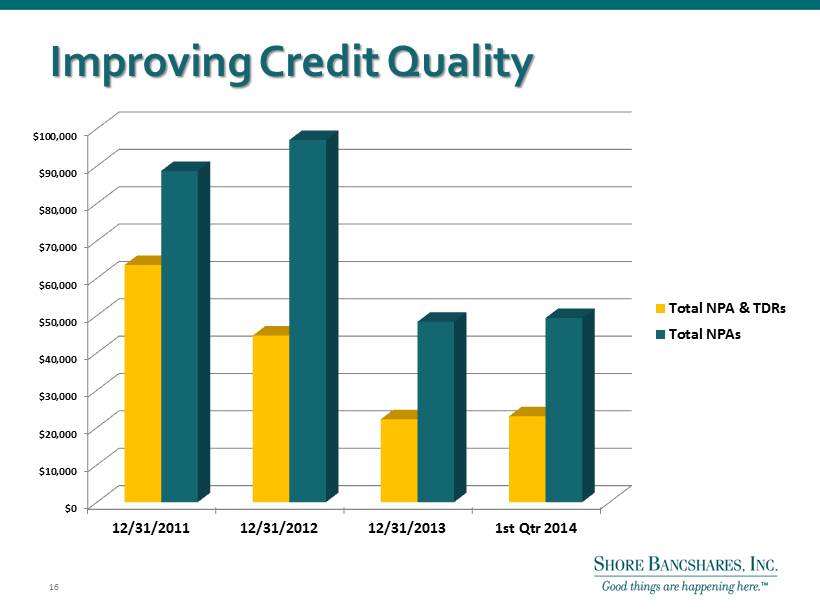
Improving Credit Quality $0 $10,000 $20,000 $30,000 $40,000 $50,000 $60,000 $70,000 $80,000 $90,000 $100,000 12/31/2011 12/31/2012 12/31/2013 1st Qtr 2014 Total NPA & TDRs Total NPAs 16

Key Ratios Versus Peers – 1Q14 Peer* SHBI Return on Average Assets 0.24% 0.49% Return on Average Equity 4.16% 4.88% Total Equity/Total Assets 10.19% 9.97% Tangible Equity/Tangible Assets 8.90% 8.58% Risk - Based Capital Ratio 15.90% 11.68% Net Interest Margin 3.89% 3.50% Non - interest Income/Operating Revenue 24.18% 36.52% Efficiency Ratio (Non - GAAP) (1) 79.25% 76.44% Nonperforming Assets/Assets (Including TDRs) (2) 2.98% 4.70% (1) Noninterest expense (excluding amortization of intangible assets and write - downs of other real estate owned) as a percentage of fully taxable net interest income and noninterest income. (2) Nonperforming assets (NPAs) include nonaccrual loans, accruing troubled debt restructurings and net other real estate and other assets owned. * Peer Group Definition: Publicly traded banking companies in MD and VA with Total Assets between $750 M - $2B as of 12/31/13. 17

Questions and Answers 18
Report on Voting 19

Adjournment 20