Attached files
| file | filename |
|---|---|
| 8-K - CURRENT REPORT OF MATERIAL EVENTS OR CORPORATE CHANGES - EP Energy Corp | a14-11432_28k.htm |
Exhibit 99.1
|
|
Portfolio Upgrade Wolfcamp Acquisition & Non-core Asset Divestiture May 1, 2014 |
|
|
Cautionary Statement Regarding Forward-Looking Statements This presentation includes certain forward-looking statements and projections of EP Energy. EP Energy has made every reasonable effort to ensure that the information and assumptions on which these statements and projections are based are current, reasonable, and complete. However, a variety of factors could cause actual results to differ materially from the projections, anticipated results or other expectations expressed, including, without limitation, the supply and demand for oil, natural gas and NGLs; EP Energy’s ability to meet production volume targets; the uncertainty of estimating proved reserves and unproved resources; the future level of service and capital costs; the availability and cost of financing to fund future exploration and production operations; the success of drilling programs with regard to proved undeveloped reserves and unproved resources; EP Energy’s ability to comply with the covenants in various financing documents; EP Energy’s ability to obtain necessary governmental approvals for proposed E&P projects and to successfully construct and operate such projects; actions by the credit rating agencies; credit and performance risk of EP Energy’s lenders, trading counterparties, customers, vendors and suppliers; changes in commodity prices and basis differentials for oil and natural gas; general economic and weather conditions in geographic regions or markets served by EP Energy, or where operations of EP Energy are located, including the risk of a global recession and negative impact on oil and natural gas demand; the uncertainties associated with governmental regulation, including any potential changes in federal and state tax laws and regulation; political and currency risks associated with international operations of EP Energy; competition; and other factors described in EP Energy’s Securities and Exchange Commission filings. While EP Energy makes these statements and projections in good faith, neither EP Energy nor its management can guarantee that anticipated future results will be achieved. Reference must be made to those filings for additional important factors that may affect actual results. EP Energy assumes no obligation to publicly update or revise any forward-looking statements made herein or any other forward-looking statements made by EP Energy, whether as a result of new information, future events, or otherwise. This presentation presents certain production and reserves-related information on an "equivalency" basis. Equivalent volumes are computed with natural gas converted to barrels at a ratio of six Mcf to one Bbl. These conversions are based on energy equivalency conversion methods primarily applicable at the burner tip and do not represent value equivalencies at the wellhead. Although these conversion factors are industry accepted norms, they are not reflective of price or market value differentials between product types. |
|
|
Strategy in Action Immediate upgrade to asset portfolio Divesting non-core South Louisiana Wilcox and non-Haynesville Arklatex tight-gas assets for $150 million Acquiring ~37,000 acres in Southern Midland Basin immediately offsetting current acreage for $153 million (~$2,700 per undeveloped acre) Transactions build on EPE strategy Monetizes non-core assets at more than seven times estimated 2014 EBITDA Significant addition of high-quality Wolfcamp acreage at a compelling value Adds scale and operational efficiencies in a core area Drives shareholder value Significantly enhances NAV with 475 locations and 143 MMBoe of resources Accretive to oil production and cash flow per share Balance sheet neutral |
|
|
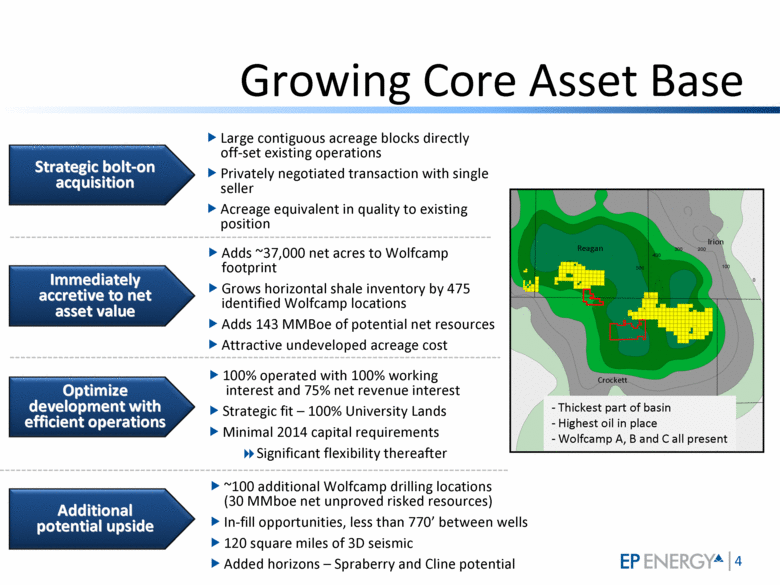
Large contiguous acreage blocks directly off-set existing operations Privately negotiated transaction with single seller Acreage equivalent in quality to existing position Strategic bolt-on acquisition Growing Core Asset Base Immediately accretive to net asset value Optimize development with efficient operations Additional potential upside Reagan Crockett Irion Adds ~37,000 net acres to Wolfcamp footprint Grows horizontal shale inventory by 475 identified Wolfcamp locations Adds 143 MMBoe of potential net resources Attractive undeveloped acreage cost 100% operated with 100% working interest and 75% net revenue interest Strategic fit – 100% University Lands Minimal 2014 capital requirements Significant flexibility thereafter ~100 additional Wolfcamp drilling locations (30 MMboe net unproved risked resources) In-fill opportunities, less than 770’ between wells 120 square miles of 3D seismic Added horizons – Spraberry and Cline potential - Thickest part of basin - Highest oil in place - Wolfcamp A, B and C all present |
|
|
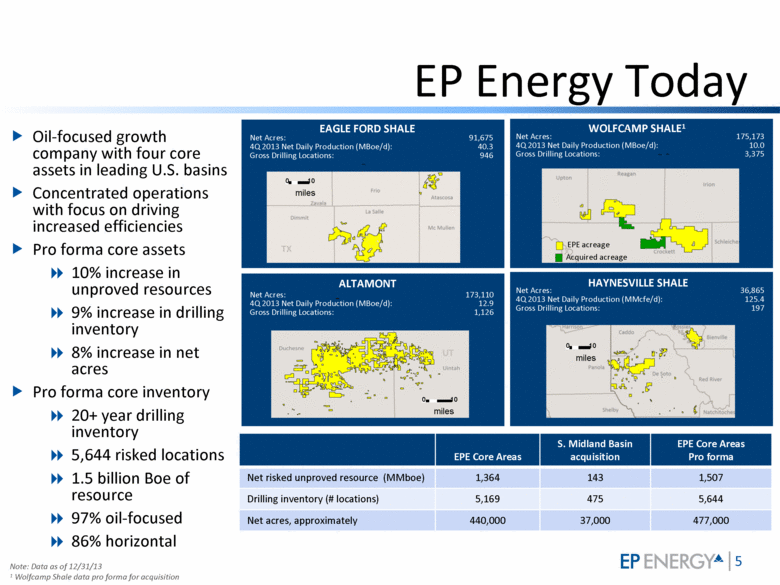
EP Energy Today Oil-focused growth company with four core assets in leading U.S. basins Concentrated operations with focus on driving increased efficiencies Pro forma core assets 10% increase in unproved resources 9% increase in drilling inventory 8% increase in net acres Pro forma core inventory 20+ year drilling inventory 5,644 risked locations 1.5 billion Boe of resource 97% oil-focused 86% horizontal EAGLE FORD SHALE EP Energy Acreage HAYNESVILLE SHALE ALTAMONT WOLFCAMP SHALE EPE Core Areas S. Midland Basin acquisition EPE Core Areas Pro forma Net risked unproved resource (MMboe) 1,364 143 1,507 Drilling inventory (# locations) 5,169 475 5,644 Net acres, approximately 440,000 37,000 477,000 Note: Data as of 12/31/13 1 Wolfcamp Shale data pro forma for acquisition Net Acres: 91,675 4Q 2013 Net Daily Production (MBoe/d): 40.3 Gross Drilling Locations: 946 EAGLE FORD SHALE Net Acres: 175,173 4Q 2013 Net Daily Production (MBoe/d): 10.0 Gross Drilling Locations: 3,375 HAYNESVILLE SHALE Net Acres: 36,865 4Q 2013 Net Daily Production (MMcfe/d): 125.4 Gross Drilling Locations: 197 ALTAMONT Net Acres: 173,110 4Q 2013 Net Daily Production (MBoe/d): 12.9 Gross Drilling Locations: 1,126 WOLFCAMP SHALE1 TX 0 10 miles TX UT 0 10 miles 0 10 miles Acquired acreage EPE acreage |
|
|
Successful Wolfcamp Offset Activity Sources: Texas RRC, HIS, and EP Energy Sources: Texas RRC, IHS, EP Energy |
|
|
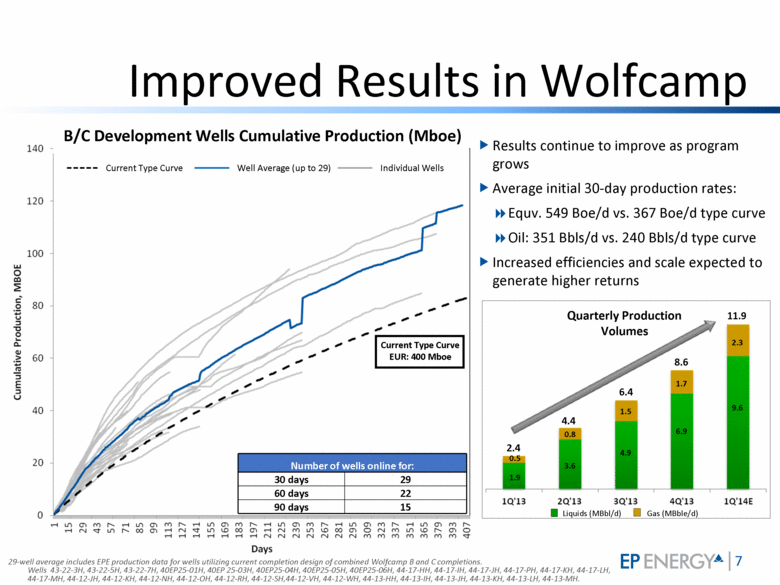
Results continue to improve as program grows Average initial 30-day production rates: Equv. 549 Boe/d vs. 367 Boe/d type curve Oil: 351 Bbls/d vs. 240 Bbls/d type curve Increased efficiencies and scale expected to generate higher returns Individual Wells Well Average (up to 29) Current Type Curve Number of wells online for: 30 days 29 60 days 22 90 days 15 Quarterly Production Volumes B/C Development Wells Cumulative Production (Mboe) Current Type Curve EUR: 400 Mboe Improved Results in Wolfcamp 8.6 6.4 4.4 2.4 11.9 6.9 4.9 3.6 1.9 9.6 1.7 1.5 0.8 0.5 2.3 Liquids (MBbl/d) Gas (MBble/d) 29-well average includes EPE production data for wells utilizing current completion design of combined Wolfcamp B and C completions. Wells 43-22-3H, 43-22-5H, 43-22-7H, 40EP25-01H, 40EP 25-03H, 40EP25-04H, 40EP25-05H, 40EP25-06H, 44-17-HH, 44-17-IH, 44-17-JH, 44-17-PH, 44-17-KH, 44-17-LH, 44-17-MH, 44-12-JH, 44-12-KH, 44-12-NH, 44-12-OH, 44-12-RH, 44-12-SH,44-12-VH, 44-12-WH, 44-13-HH, 44-13-IH, 44-13-JH, 44-13-KH, 44-13-LH, 44-13-MH. |
|
|
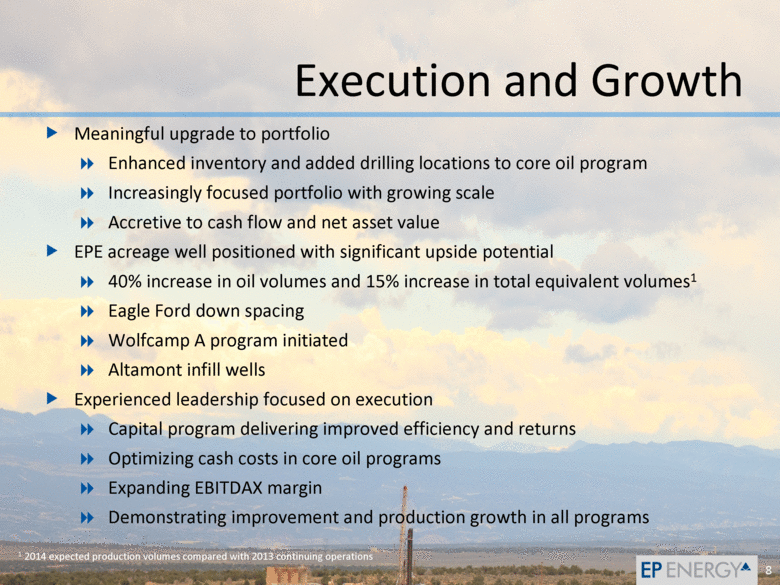
Execution and Growth Meaningful upgrade to portfolio Enhanced inventory and added drilling locations to core oil program Increasingly focused portfolio with growing scale Accretive to cash flow and net asset value EPE acreage well positioned with significant upside potential 40% increase in oil volumes and 15% increase in total equivalent volumes1 Eagle Ford down spacing Wolfcamp A program initiated Altamont infill wells Experienced leadership focused on execution Capital program delivering improved efficiency and returns Optimizing cash costs in core oil programs Expanding EBITDAX margin Demonstrating improvement and production growth in all programs 1 2014 expected production volumes compared with 2013 continuing operations 8 |
|
|
Portfolio Upgrade Wolfcamp Acquisition & Non-core Asset Divestiture May 1, 2014 |


