Attached files
| file | filename |
|---|---|
| 8-K - 8-K - KAPSTONE PAPER & PACKAGING CORP | a14-11269_18k.htm |
| EX-99.1 - EX-99.1 - KAPSTONE PAPER & PACKAGING CORP | a14-11269_1ex99d1.htm |
Exhibit 99.2
|
|
2014 First Quarter Review KapStone Roger W. Stone Chairman and Chief Executive Officer Andrea K. Tarbox Vice President and Chief Financial Officer April 30, 2014 DSC_0002compressed.JPGboxgroup.jpg |
|
|
Forward Looking Statements The information in this presentation and statements made during this presentation may contain certain forward-looking statements within the meaning of federal securities laws. These statements reflect management’s expectations regarding future events and operating performance. These forward-looking statements involve a number of risks and uncertainties. A list of the factors that could cause actual results to differ materially from those expressed in, or underlying, any forward-looking statements can be found in the Company’s filings with the Securities and Exchange Commission, such as its annual and quarterly reports. The Company disclaims any obligation to revise or update such statements to reflect the occurrence of events after the date of this presentation. This presentation refers to non-U.S. GAAP financial information. A reconciliation of non-U.S. GAAP to U.S. GAAP financial measures is available on the company’s website at KapStonepaper.com under Investors. Forward-Looking Statements Risk Factors Non-GAPP Financial Measures |
|
|
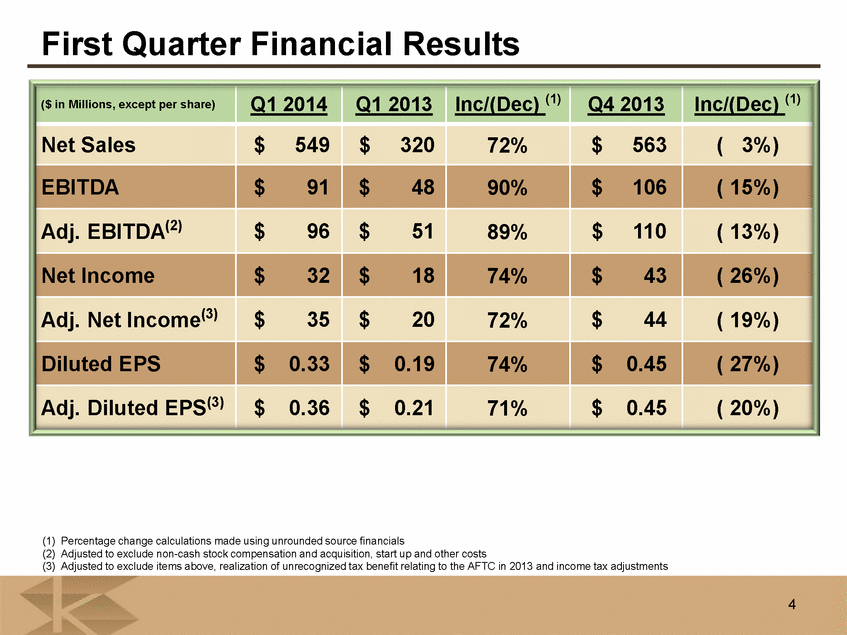
($ in Millions, except per share) Q1 2014 Q1 2013 Inc/(Dec) (1) Q4 2013 Inc/(Dec) (1) Net Sales $ 549 $ 320 72% $ 563 ( 3%) EBITDA $ 91 $ 48 90% $ 106 ( 15%) Adj. EBITDA(2) $ 96 $ 51 89% $ 110 ( 13%) Net Income $ 32 $ 18 74% $ 43 ( 26%) Adj. Net Income(3) $ 35 $ 20 72% $ 44 ( 19%) Diluted EPS $ 0.33 $ 0.19 74% $ 0.45 ( 27%) Adj. Diluted EPS(3) $ 0.36 $ 0.21 71% $ 0.45 ( 20%) First Quarter Financial Results (1) Percentage change calculations made using unrounded source financials (2) Adjusted to exclude non-cash stock compensation and acquisition, start up and other costs (3) Adjusted to exclude items above, realization of unrecognized tax benefit relating to the AFTC in 2013 and income tax adjustments |
|
|
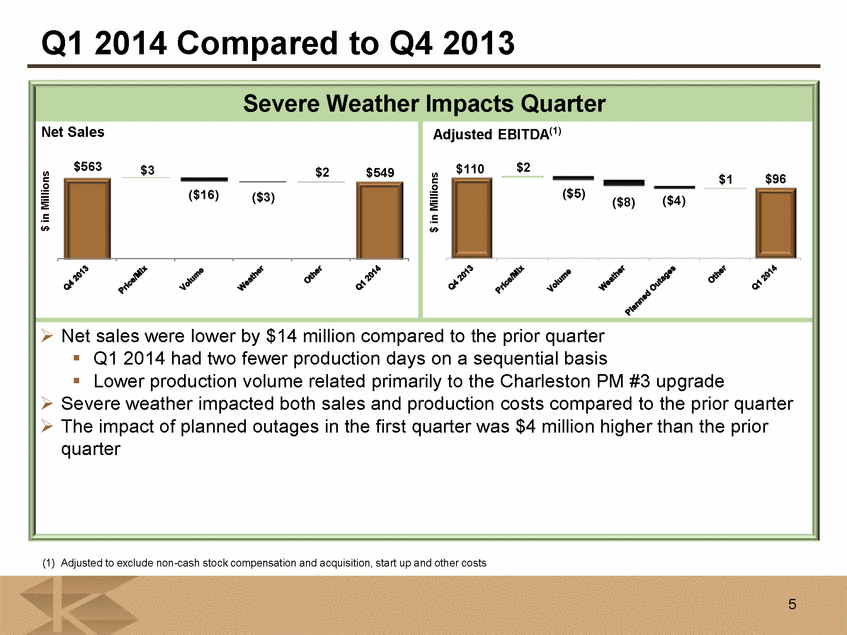
$110 $2 ($5) ($8) ($4) $1 $96 $ in Millions $563 $3 ($16) ($3) $2 $549 $ in Millions Q1 2014 Compared to Q4 2013 . Net sales were lower by $14 million compared to the prior quarter . Q1 2014 had two fewer production days on a sequential basis . Lower production volume related primarily to the Charleston PM #3 upgrade . Severe weather impacted both sales and production costs compared to the prior quarter . The impact of planned outages in the first quarter was $4 million higher than the prior quarter Net Sales (1) Adjusted to exclude non-cash stock compensation and acquisition, start up and other costs Adjusted EBITDA(1) Severe Weather Impacts Quarter |
|
|
. Despite challenges in the quarter, legacy Longview generated record adjusted EBITDA . Annualized synergies of $13 million transacted on by March 31, 2014 . Synergy target now $20 million of annualized benefits to be transacted by late 2015 . Q1 2014 as compared to Q4 2013 was negatively impacted by: . $5 million - planned maintenance activities . $3 million - isolated operational issues which reduced total production . $2 million - weather . $2 million - two less operating days compared to the prior quarter . Seasonal inventory build in Q1 2014 of 6,000 tons to accommodate agricultural cycle $42 $62 $50 Q1 2013 Q4 2013 Q1 2014 $’s in Millions Adjusted EBITDA (2) Longview Acquisition $217 $241 $227 Q1 2013 Q4 2013 Q1 2014 $’s in Millions Net Sales $0.14 $0.28 $0.19 Q1 2013 Q4 2013 Q1 2014 Adjusted Diluted EPS (3) 7 (1) Longview results for Q1 2013 are shown for reference as this period was prior to the July 2013 acquisition (2) Adjusted to exclude one time acquisition costs (3) Adjusted to exclude one time acquisition costs and includes all related interest expense and amortization of financing fees Record First Quarter (1) |
|
|
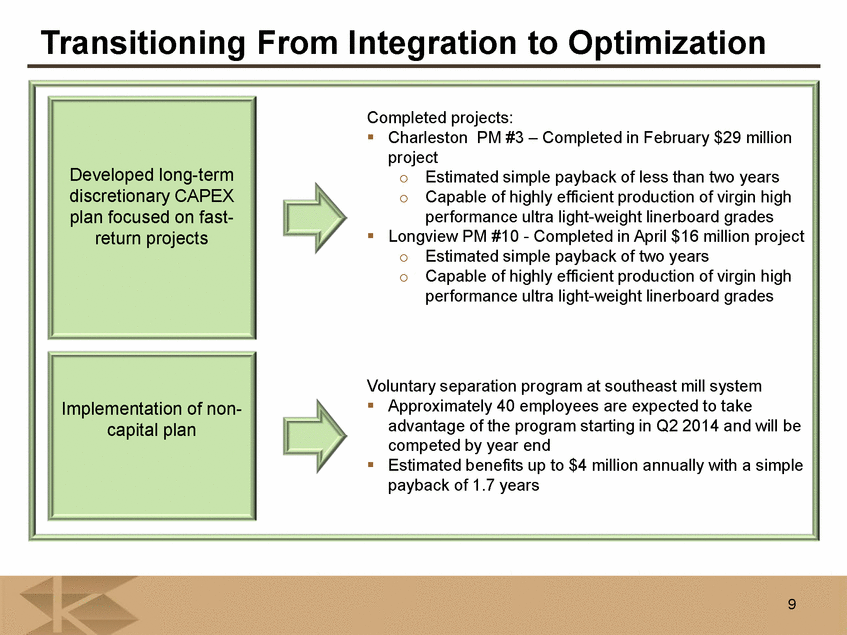
Transitioning From Integration to Optimization Developed long-term discretionary CAPEX plan focused on fast- return projects Completed projects: . Charleston PM #3 – Completed in February $29 million project o Estimated simple payback of less than two years o Capable of highly efficient production of virgin high performance ultra light-weight linerboard grades . Longview PM #10 - Completed in April $16 million project o Estimated simple payback of two years o Capable of highly efficient production of virgin high performance ultra light-weight linerboard grades Voluntary separation program at southeast mill system . Approximately 40 employees are expected to take advantage of the program starting in Q2 2014 and will be competed by year end . Estimated benefits up to $4 million annually with a simple payback of 1.7 years Implementation of non- capital plan |
|
|
Summary of Key Assumptions for Q2 2014 . Kraft paper price increase of $50 per ton . Full benefit expected by Q3 2014 . Approximately $2 million benefit in Q2 2014 . Up to $30 million annualized benefit expected . Continued seasonal improvement of product mix from Q1 2014 . Production and shipping . One more mill production calendar day partially offset by one less corrugated shipping day . Production in Q2 2014 should benefit from 6,900 more tons due to less planned production downtime than Q1 2014 . Reduction of Longview’s Q1 2014 seasonal inventory build . Additional benefits from two major machine upgrades expected to be realized as the quarter progresses . Planned outage maintenance expense approximately $10 million lower . Relatively stable fiber costs from Q1 2014 . Voluntary separation initiatives should result in up to $5 million of expense in Q2 and additional expense (up to $2 million more) over the remainder of 2014 as employees retire . CAPEX is expected to be $ 35 million for Q2 2014, and $110-$120 million for the full year |
|
|
Appendix |
|
|
385 671 658 420 703 673 Q1 2013 Q4 2013 Q1 2014 Tons (000) Tons Produced and Sold (2) Produced Sold Components of Quarterly Net Sales $653 $670 $685 Q1 2013 Q4 2013 Q1 2014 Avg Revenue per Mill Ton (1) (1) Average price per external ton sold from mills – excludes corrugated sales (2) Tons Produced represents saleable tons produced from four paper mills; Tons Sold is external sales from paper mills and corrugated container plants (3) Mix is based on a percentage of total external tons sold from paper mills and corrugated container plants 33% 26% 24% 9% 10% 9% 16% 10% 9% Q1 2013 Q4 2013 Q1 2014 Q1 2013 Q4 2013 Q1 2014 Q1 2013 Q4 2013 Q1 2014 Domestic Containerboard Export Containerboard DuraSorb Product Mix (3) 13% 21% 24% 6% 4% 4% 23% 30% 30% Q1 2013 Q4 2013 Q1 2014 Q1 2013 Q4 2013 Q1 2014 Q1 2013 Q4 2013 Q1 2014 Kraft Paper KraftPak Corrugated |
|
|
385 378 382 420 403 398 Q1 2013 Q4 2013 Q1 2014 Tons (000) Tons Produced and Sold (2) Produced Sold Components of Quarterly Net Sales (Legacy KapStone) $653 $677 $681 Q1 2013 Q4 2013 Q1 2014 Avg Revenue per Mill Ton (1) (1) Average price per external ton sold from mills – excludes corrugated sales (2) Tons Produced represents saleable tons produced from three legacy KapStone paper mills; Tons Sold is external sales from legacy KapStone paper mills and corrugated container plants (3) Mix is based on a percentage of total external tons sold from paper mills and corrugated container plants 33% 32% 29% 9% 10% 10% 16% 16% 16% Q1 2013 Q4 2013 Q1 2014 Q1 2013 Q4 2013 Q1 2014 Q1 2013 Q4 2013 Q1 2014 Domestic Containerboard Export Containerboard DuraSorb Product Mix (3) 13% 11% 14% 6% 6% 7% 23% 25% 26% Q1 2013 Q4 2013 Q1 2014 Q1 2013 Q4 2013 Q1 2014 Q1 2013 Q4 2013 Q1 2014 Kraft Paper KraftPak Corrugated |
|
|
2013 Actual Q1 Q2 Q3 (1) Q4 Financial Impact $ 4.7 $ 8.5 $ 1.1 $ 10.5 Production Impact - 9,432 - 12,500 Maintenance Outage Expense & Production Impact 2014 Actual/Expected Q1A Q2E Q3E Q4E Financial Impact $ 14.8 $ 4.5 $ 4.1 $ 17.1 Production Impact 14,300 7,400 - 12,500 |


