Attached files
| file | filename |
|---|---|
| 8-K - 8-K - LyondellBasell Industries N.V. | d716306d8k.htm |
| EX-99.1 - EX-99.1 - LyondellBasell Industries N.V. | d716306dex991.htm |
 Jim
Gallogly, Chief Executive Officer Karyn Ovelmen, Chief Financial
Officer Sergey Vasnetsov, SVP –
Strategic Planning and Transactions
Doug Pike, VP –
Investor Relations
First-Quarter 2014 Earnings
Exhibit 99.2 |
 lyondellbasell.com
Cautionary Statement
2
The
statements
in
this
presentation
relating
to
matters
that
are
not
historical
facts
are
forward-looking
statements.
These
forward-looking statements are based upon assumptions of management which are
believed to be reasonable at the time made and are subject to significant
risks and uncertainties. Actual results could differ materially based on factors including, but not
limited to, the business cyclicality of the chemical, polymers and refining
industries; the availability, cost and price volatility of raw materials and
utilities, particularly the cost of oil, natural gas, and associated natural gas liquids; competitive product and
pricing pressures; labor conditions; our ability to attract and retain key
personnel; operating interruptions (including leaks, explosions, fires,
weather-related incidents, mechanical failure, unscheduled downtime, supplier disruptions, labor shortages,
strikes, work stoppages or other labor difficulties, transportation interruptions,
spills and releases and other environmental risks);
the
supply/demand
balances
for
our
and
our
joint
ventures’
products,
and
the
related
effects
of
industry
production
capacities and operating rates; our ability to achieve expected cost savings and
other synergies; our ability to successfully execute projects and growth
strategies; legal and environmental proceedings; tax rulings, consequences or proceedings;
technological developments, and our ability to develop new products and process
technologies; potential governmental regulatory actions; political unrest
and terrorist acts; risks and uncertainties posed by international operations, including foreign
currency fluctuations; and our ability to comply with debt covenants and service
our debt. Additional factors that could cause results
to
differ
materially
from
those
described
in
the
forward-looking
statements
can
be
found
in
the
“Risk
Factors”
section
of
our Form 10-K for the year ended December 31, 2013, which can be found at
www.lyondellbasell.com on the Investor Relations page and on the Securities
and Exchange Commission’s website at www.sec.gov.
The illustrative results or returns of growth projects are not in any way intended
to be, nor should they be taken as, indicators or guarantees of performance.
The assumptions on which they are based are not projections and do not necessarily represent the
Company’s expectations and future performance. You should not rely on
illustrated results or returns or these assumptions as being indicative of
our future results or returns. This presentation contains time sensitive
information that is accurate only as of the date hereof. Information contained in this
presentation is unaudited and is subject to change. We undertake no
obligation to update the information presented herein except as required by
law. |
 lyondellbasell.com
Information Related to Financial Measures
3
We have included EBITDA in this presentation, which is a non-GAAP measure, as
we believe that EBITDA
is
a
measure
commonly
used
by
investors.
However,
EBITDA,
as
presented
herein,
may
not
be
comparable to a similarly titled measure reported by other companies due to
differences in the way the measure is calculated.
We calculate EBITDA as income from continuing operations plus interest
expense (net), provision for (benefit from) income taxes, and depreciation &
amortization. EBITDA should not be considered an alternative to profit or
operating profit for any period as an indicator of our performance, or as an
alternative to operating cash flows as a measure of our liquidity. See Table 8 of
our accompanying earnings release for reconciliations of EBITDA to net
income. While
we
also
believe
that
free
cash
flow
(FCF)
and
book
capital
are
measures
commonly
used
by
investors,
free
cash
flow
and
book
capital,
as
presented
herein,
may
not
be
comparable
to
similarly
titled
measures reported by other companies due to differences in the way the measures are
calculated. For purposes of this presentation, free cash flow means net cash
provided by operating activities minus capital
expenditures
and
book
capital
means
total
debt
plus
stockholders’
equity
plus
minority
interests. |
 lyondellbasell.com
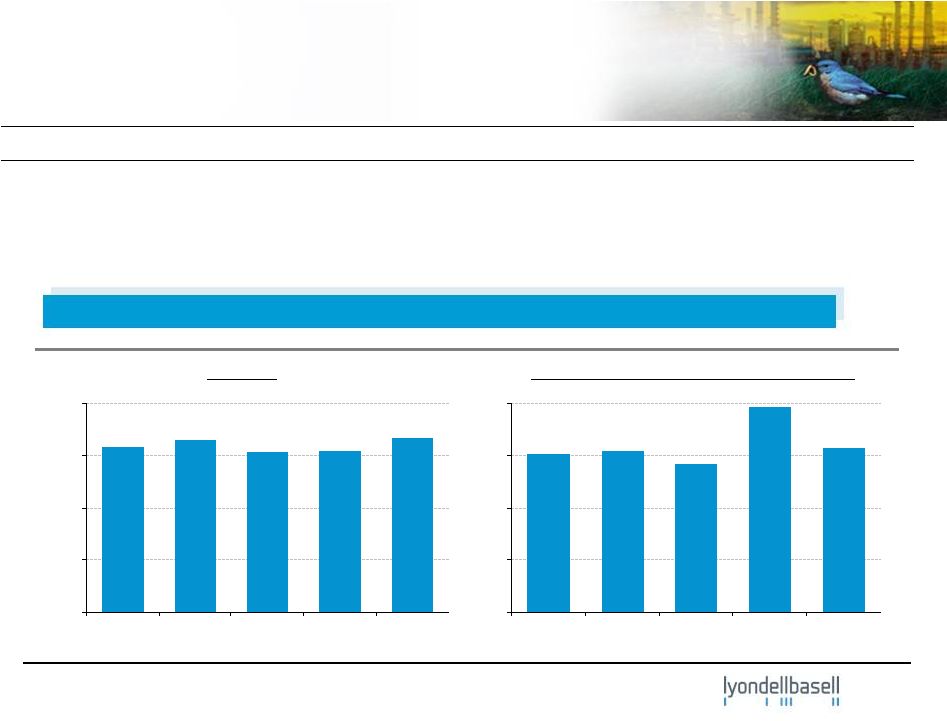
Highlights
4
EBITDA
LTM EBITDA -
$6,394 million LTM
EPS
–
$6.93
per
share
($ in millions)
Income
from
Continuing
Operations
($ in millions, except per share data)
1Q'14
4Q'13
1Q'13
EBITDA
$1,668
$1,543
$1,585
Income from Continuing Operations
$943
$1,177
$906
Diluted Earnings ($ / share) from Continuing Operations
$1.72
$2.11
$1.56
500
1,000
1,500
$2,000
1Q'13
2Q'13
3Q'13
4Q'13
1Q'14
300
600
900
1,200
1Q'13
2Q'13
3Q'13
4Q'13
1Q'14 |
 lyondellbasell.com
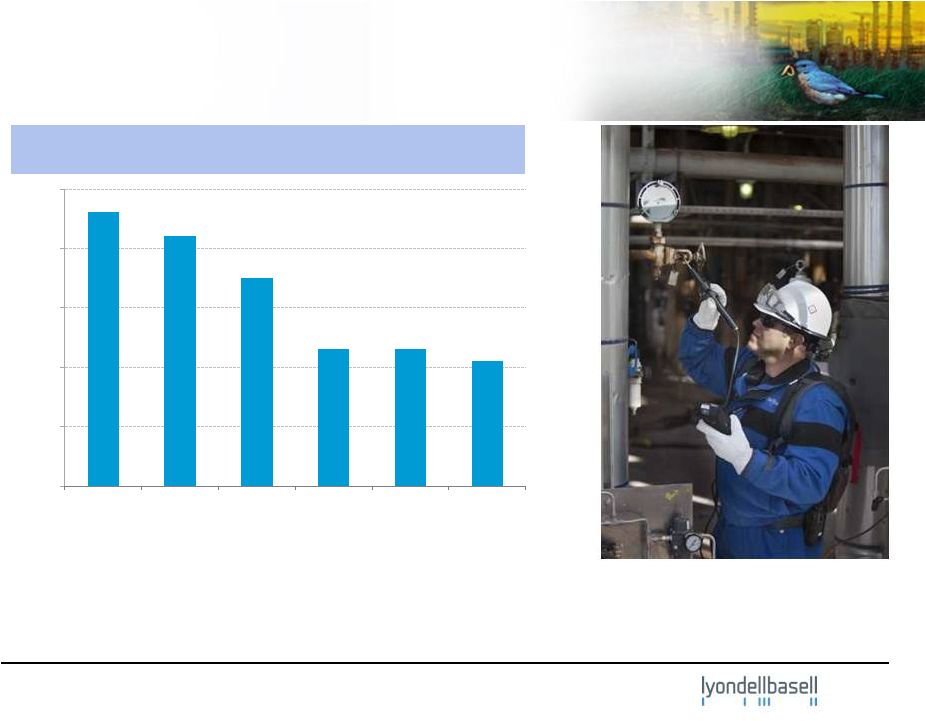
LyondellBasell Safety Performance
5
1) Includes employees and contractors.
Safety -
Injuries per 200,000 Hours Worked
(1)
0.0
0.1
0.2
0.3
0.4
0.5
2009
2010
2011
2012
2013
Q1' 2014 |
 lyondellbasell.com
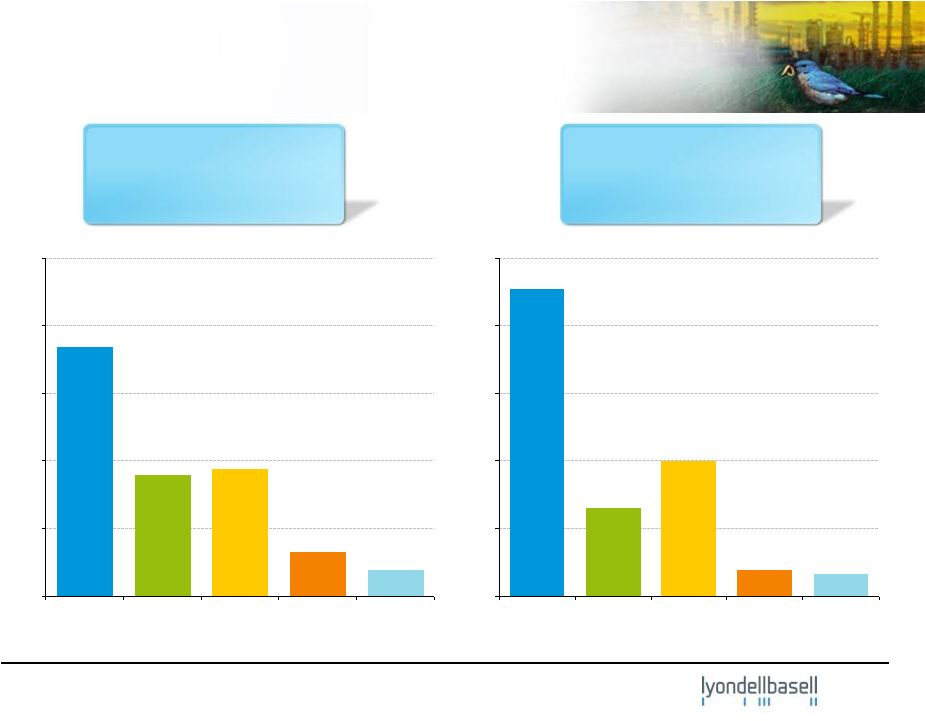
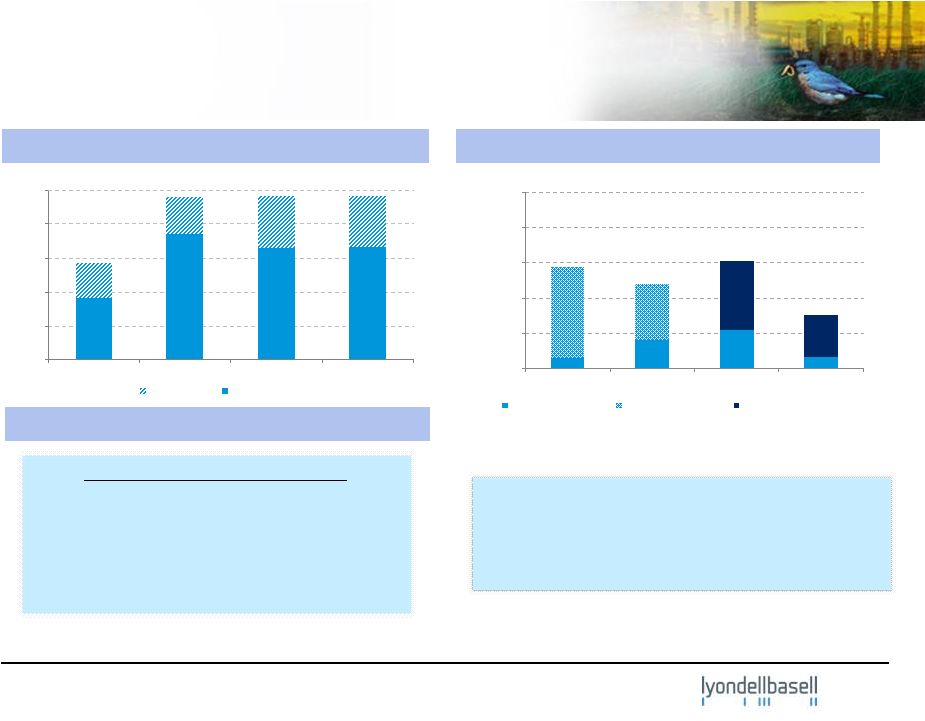
First Quarter 2014 and Last Twelve Months (LTM)
Segment EBITDA
6
($ in millions)
($ in millions)
200
400
600
800
$1000
Olefins &
Polyolefins -
Americas
Olefins &
Polyolefins -
EAI
Intermediates
& Derivatives
Refining
Technology
750
1,500
2,250
3,000
$3,750
Olefins &
Polyolefins -
Americas
Olefins &
Polyolefins -
EAI
Intermediates
& Derivatives
Refining
Technology
LTM March 2014 EBITDA
First Quarter 2014 EBITDA
Q1’14 EBITDA
$1,668 million
Q1’14 Operating Income
$1,340 million
LTM March 2014 EBITDA
$6,394 million
LTM March 2014 Operating Income
$5,175 million |
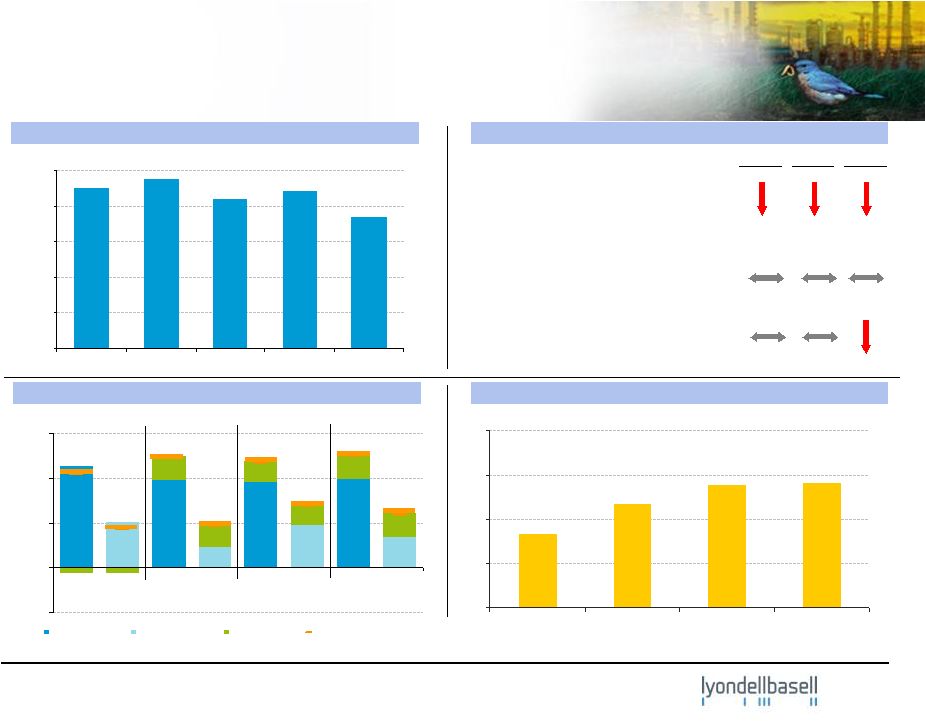
 lyondellbasell.com
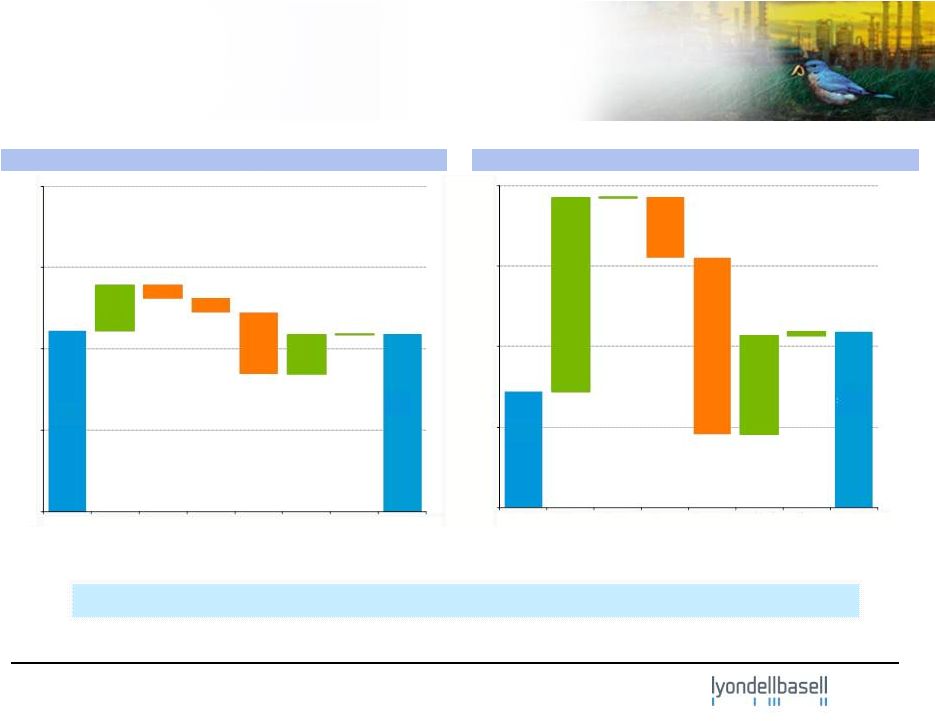
Cash Flow
7
1) Beginning and ending cash balances include cash and short-term securities; 2)
Includes accounts receivable, inventories and accounts payable; 3) Includes capital and maintenance turnaround spending.
($ in millions)
Q1 2014
LTM March 2014
(3)
(2)
(1)
(2)
(1)
(3)
(1)
(1)
~ $4.4 billion in dividends and share repurchases in the LTM March 2014
$4,450
$4,379
0
4,000
6,000
$8,000
Jan 2014
Balance
CF from
Operations
excl.
Working
Capital
Working
Capital
Changes
Dividends &
Share
Repurchases
Net Debt
Borrowings
Other
Mar 2014
Ending
Balance
2,000
Beginning
Capex
$2,879
$4,379
0
2,000
6,000
$8,000
Apr 2013
Beginning
Balance
CF from
Operations
excl.
Working
Capital
Working
Capital
Changes
Capex
Dividends &
Share
Repurchases
Net Debt
Borrowings
Other
Ending
Balance
4,000
Mar 2014 |
 lyondellbasell.com
Sustained Cash Generation:
Share Repurchases & Dividends
8
1,000
2,000
3,000
4,000
$5,000
2011
2012
2013
Q1' 2014
Interim Dividends
Special Dividends
Share Repurchases
Cash From Operations
Dividends & Share Repurchases
($ in millions)
($ in millions)
~ 15 million shares repurchased during
Q1’2014 and ~ 42 million shares
repurchased as of March 31, 2014
1,000
2,000
3,000
4,000
$5,000
2011
2012
2013
LTM March
2014
Capex
Free Cash Flow
Key Statistics
1) Cash balances include cash and short-term securities.
Snapshot at March 31, 2014
LTM FCF: $3.3 billion
LTM Capex: $1.5 billion
Cash
(1)
: $4.4 billion
Total Debt/LTM EBITDA: 1.1x
Total Debt/Book Capital: 37% |
 lyondellbasell.com
0
5
10
15
20
25
Oct'13
Nov'13
Dec'13
Jan'14
Feb'14
Mar'14
Apr'14
Ethane
Industry Wt. Avg
(cents/lb)
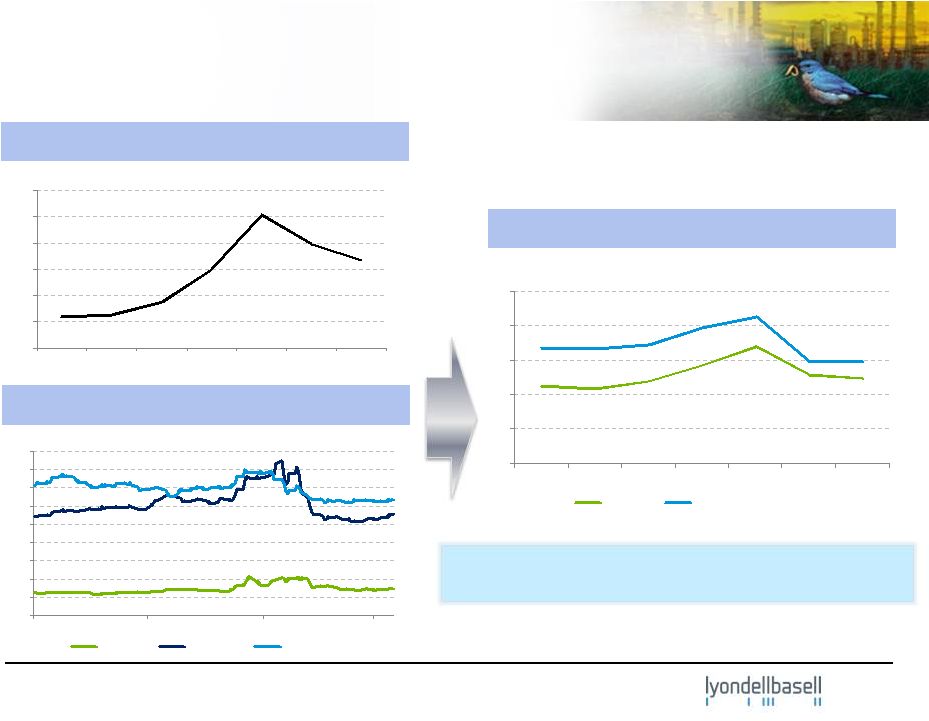
9
Cold U.S. Weather Created First-Quarter
Pressure
Henry Hub Natural Gas Prices
U.S. Cost of Ethylene Production
U.S. NGL Prices
3.0
3.5
4.0
4.5
5.0
5.5
6.0
Oct'13
Nov'13
Dec'13
Jan'14
Feb'14
Mar'14
Apr'14
($/MMBTU)
0
20
40
60
80
100
120
140
160
180
10/1/2013
12/1/2013
2/1/2014
4/1/2014
Ethane
Propane
Butane
(cents/gal)
Source: Third party consultants’
data.
The beginning of spring has provided relief |
 lyondellbasell.com
(20)
0
20
40
60
Ethane Margin
Naphtha Margin
HDPE Margin
Ethylene/HDPE Chain
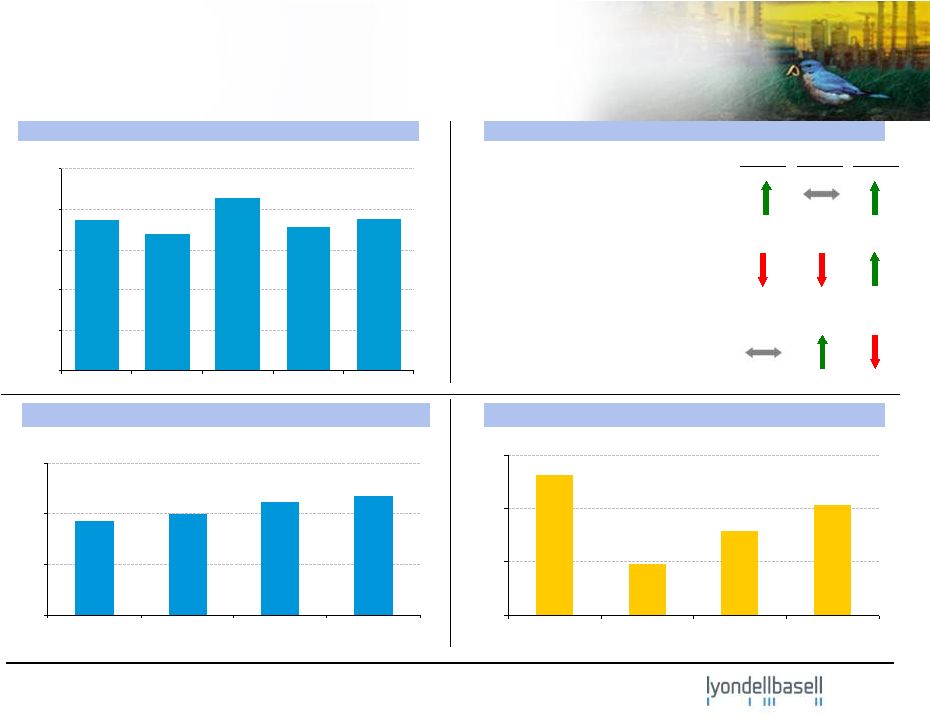
Olefins & Polyolefins –
Americas
Highlights and Business Drivers –
1Q’14
10
U.S. Olefins
•
Impacts from maintenance and NGL
price volatility
•
Inventory build ahead of La Porte
turnaround
•
Metathesis unit adding to margin
Polyethylene
•
Price up ~ 3¢/lb
•
Volumes flat
Polypropylene (includes Catalloy)
•
Spread flat
•
Volumes down ~ 4%
Ethylene Chain Margins
(1)
EBITDA
Performance vs. 4Q’13
Polypropylene Margins
(1)
EBITDA
Margin
Volume
($ in millions)
1) Source: Quarterly average industry data from third party consultants; 2) The
direction of the arrows reflects our underlying business metrics. 200
400
600
800
$1000
1Q'13
2Q'13
3Q'13
4Q'13
1Q'14
0.0
1.5
3.0
4.5
6.0
1Q'13
4Q'13
1Q'14
Apr'14
(2)
1Q’13
4Q’13
1Q’14
Apr’14
(cents / lb)
(cents / lb) |
 lyondellbasell.com
Olefins & Polyolefins –
Europe, Asia, International
Highlights and Business Drivers –
1Q’14
11
100
200
300
$400
1Q'13
2Q'13
3Q'13
4Q'13
1Q'14
(10)
5
20
35
50
1Q'13
4Q'13
1Q'14
Apr'14
HDPE Margin
Naphtha Margin
Ethylene/HDPE Chain
EU Olefins
•
Margin expansion –
increased
cracking of advantaged feedstocks
•
Operating rate ~ 93%
Polyethylene
•
Volumes up ~ 8%
Polypropylene (includes Catalloy)
•
Volumes flat
•
Margins modestly up
JV equity income
European Ethylene Chain Margins
(1)
EBITDA
Performance vs. 4Q’13
European Polypropylene Margins
(1)
EBITDA
Margin
Volume
(cents / lb)
(cents / lb)
1) Source: Quarterly average data from third party
consultants; 2) The direction of the arrows reflects our underlying business metrics.
(6)
(4)
(2)
0
2
1Q'13
4Q'13
1Q'14
Apr'14
($ in millions)
(2) |
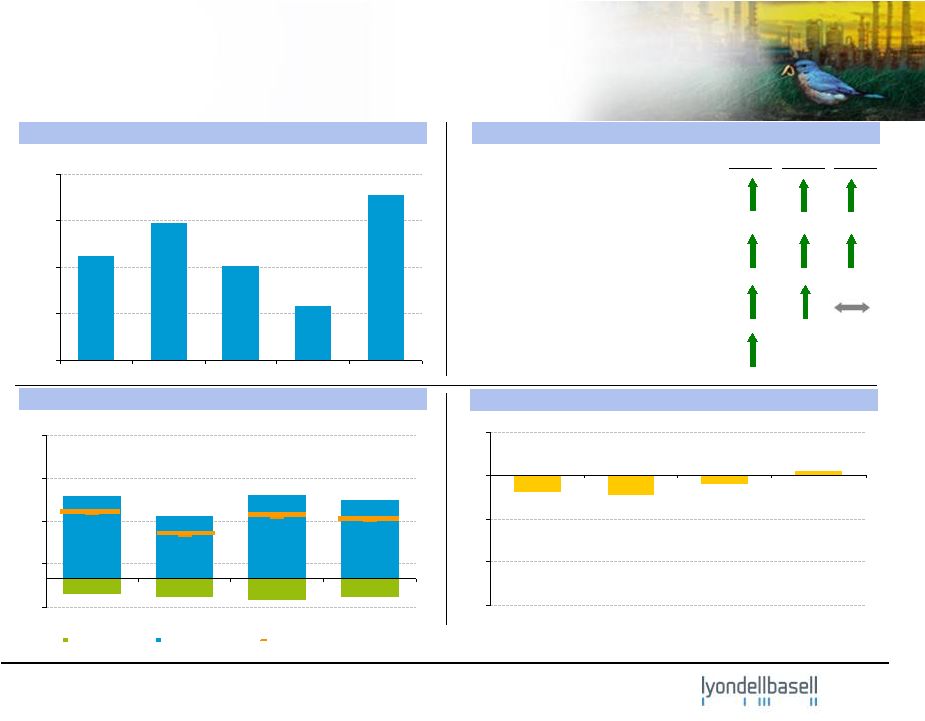
 lyondellbasell.com
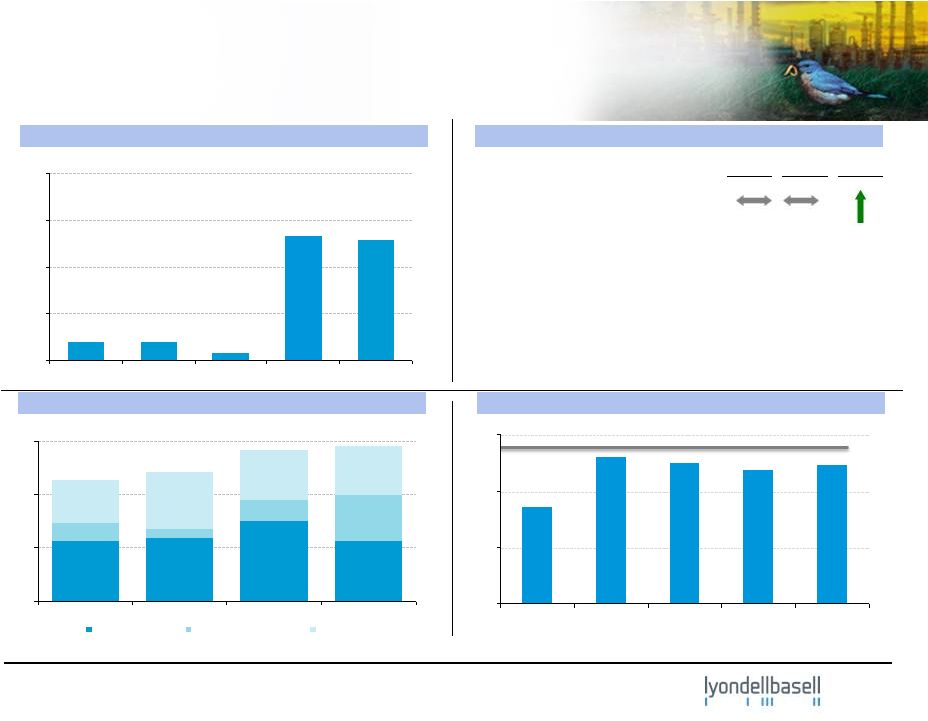
Intermediates & Derivatives
Highlights and Business Drivers –
1Q’14
12
EBITDA
Propylene Oxide and Derivatives
•
Higher deicer sales
Intermediates
•
Higher methanol volumes and
margins
•
Lower styrene and EG margins
Oxyfuels
EBITDA
Margin
Volume
Performance vs. 4Q’13
($ in millions)
EU MTBE Raw Material Margins (per Platts)
(1)
(cents / gallon)
P-Glycol Raw Material Margins (per Chemdata)
(1)
1) Data represents quarterly average; 2) The direction of the
arrows reflects our underlying business metrics. 100
200
300
400
$500
1Q'13
2Q'13
3Q'13
4Q'13
1Q'14
0
40
80
120
1Q'13
4Q'13
1Q'14
Apr'14
0
20
40
60
1Q13
4Q13
1Q14
2Q14 E
(2)
(cents / lb)
•
Increased raw material margins
•
Shipping delays impacted volumes |
 lyondellbasell.com
Refining Highlights and Business Drivers –
1Q’14
13
0
100
200
300
1Q'13
2Q'13
3Q'13
4Q'13
1Q'14
Houston Refinery
•
Crude throughput: 247 MBPD
•
Maya 2-1-1: $28.26 per bbl
•
Coker outage
•
Increased costs of natural gas and
RINs
EBITDA
Performance vs. 4Q’13
EBITDA
Margin
Volume
($ in millions)
1) Light Louisiana Sweet (LLS) is the referenced light crude. Data represents
quarterly average; 2) The direction of the arrows reflects our underlying business metrics.
50
100
150
$200
1Q'13
2Q'13
3Q'13
4Q'13
1Q'14
Refining Spreads (per Platts)
(1)
Refining Throughput
(2)
($ / bbl)
(MBPD)
0
10
20
30
1Q'13
4Q'13
1Q'14
Apr'14
Lt-Hvy
Lt-Gasoline
Lt-ULSD
Capacity = 268 MBPD |
 lyondellbasell.com
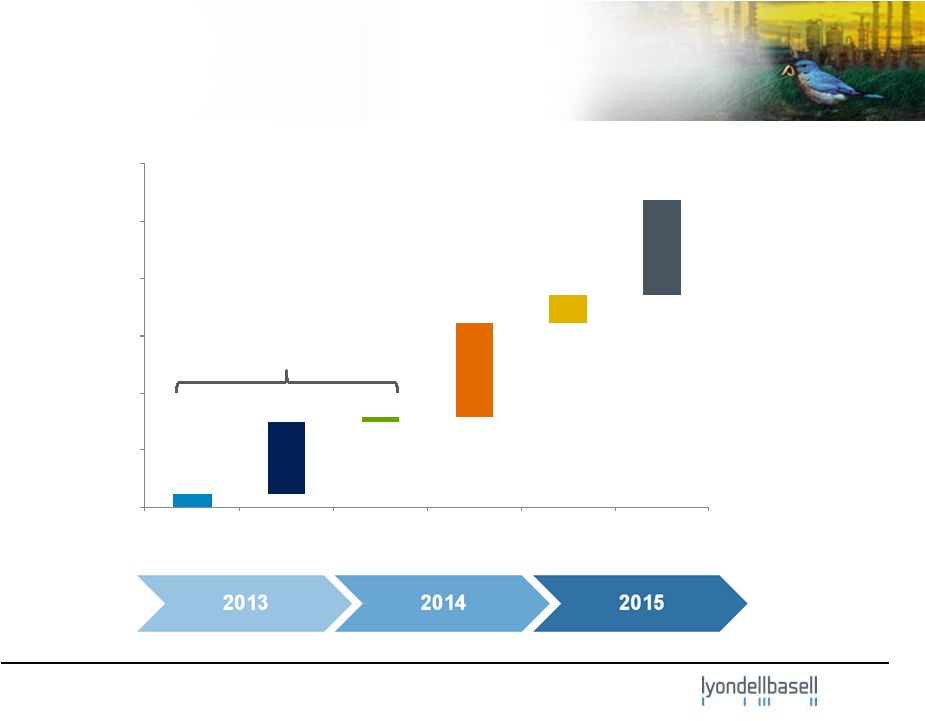
Projects Annual Potential Values &
Completion Timelines
14
200
400
600
800
1,000
$1,200
BD
Expansion
Methanol
Restart
PE
Debottleneck
La Porte
Expansion
Channelview
Expansion
Corpus
Christi
Expansion
Q2
Q4
Q1
Q1
Q3
Q4
Annual Potential Value
(1)
($ Million/ yr)
1) Annual potential values are based on FY 2013 industry benchmark margins.
Completed |
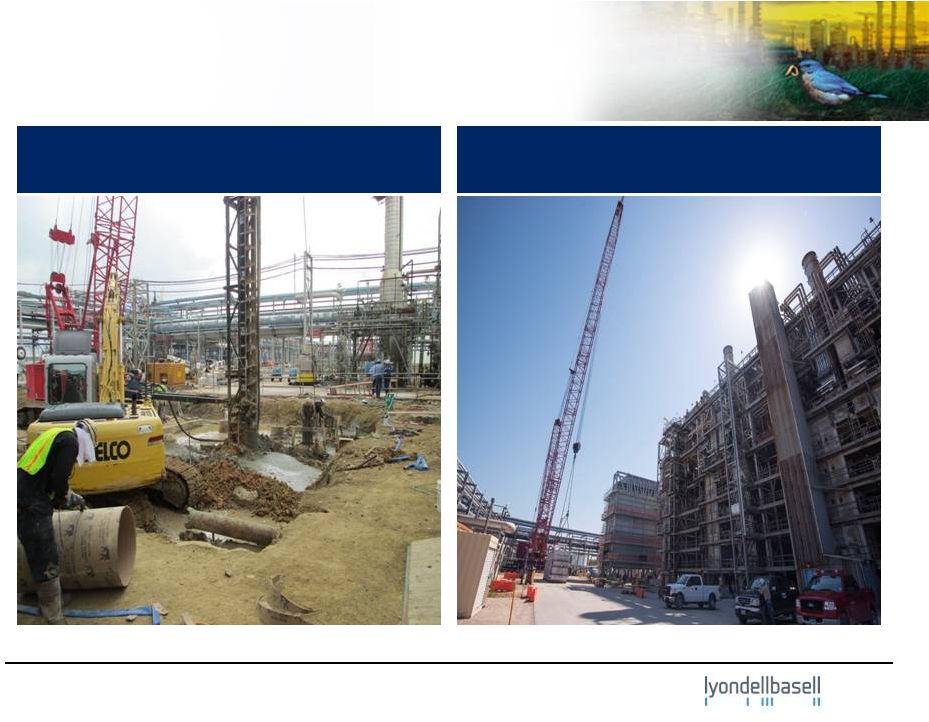
 Methanol Restart
15
Last Review
Now
lyondellbasell.com |
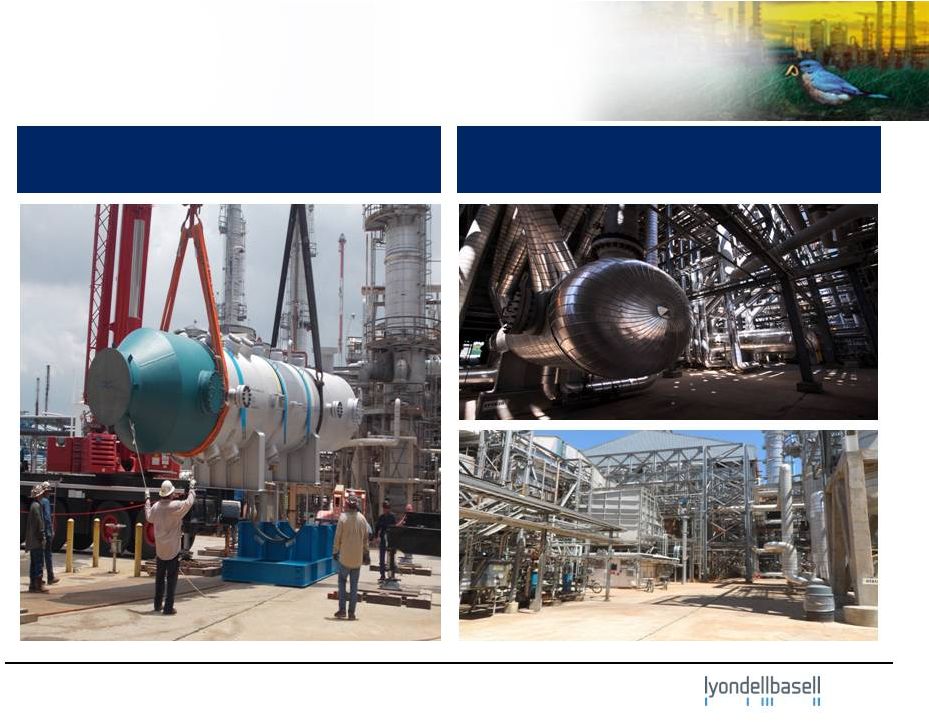
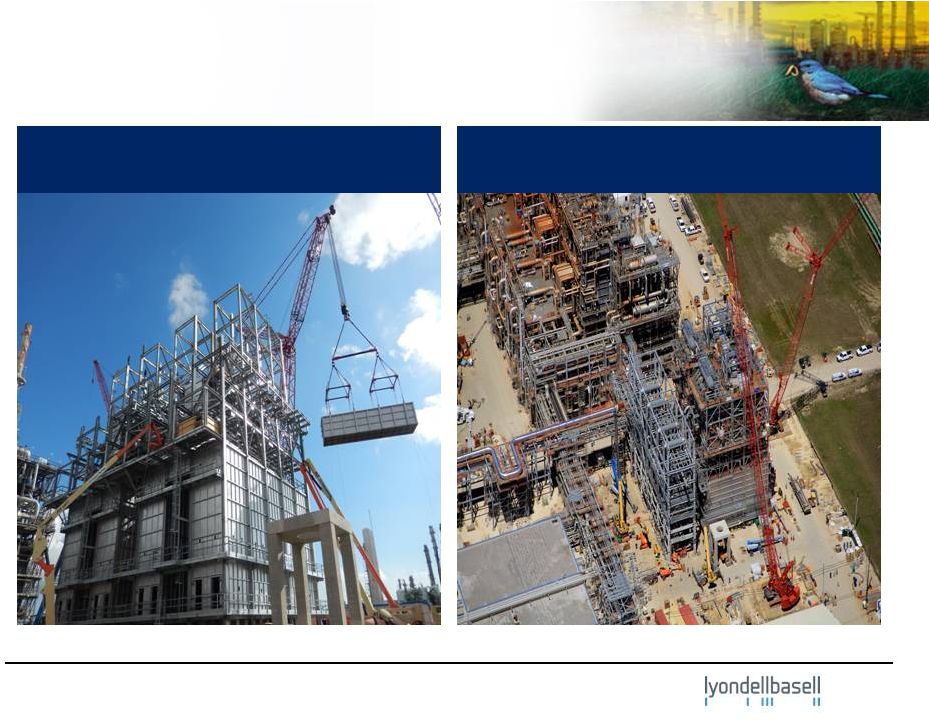
 Channelview Ethylene Expansion
16
Last Review
Now
lyondellbasell.com |
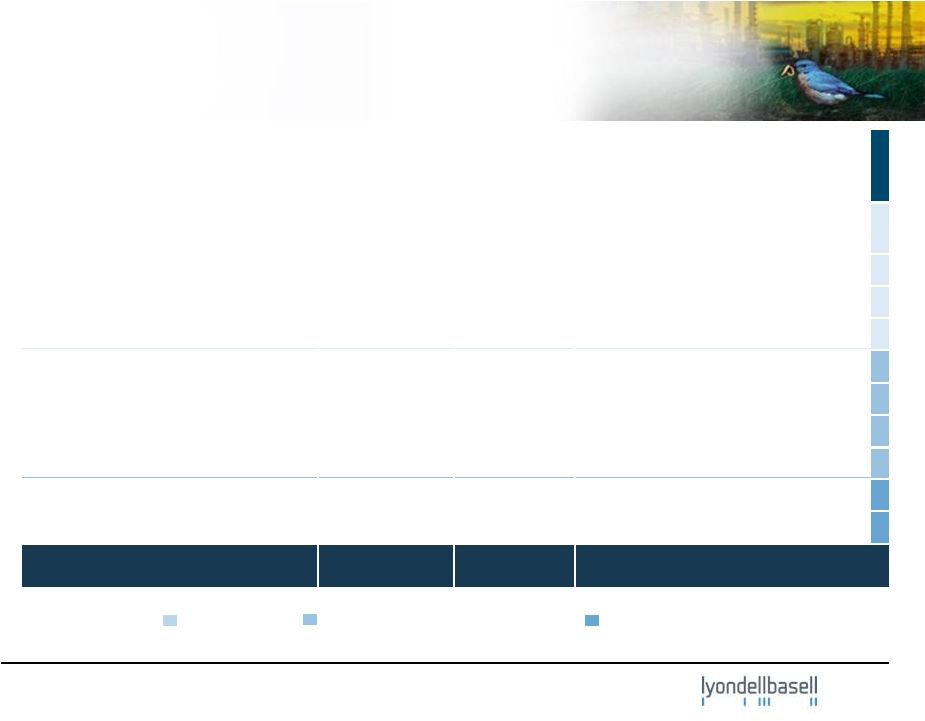
 La
Porte Ethylene Expansion 17
Last Review
Now
lyondellbasell.com |
     lyondellbasell.com
Projects Completed and Active
18
(1)
Costs are based on recent company estimates and potential pre-tax values are
based on FY 2013 industry benchmark margins. Project
Cost
($Million)
Start-up
Potential Pre-Tax Earnings
($ Million/year)
Increase Ethane Capability and
Midwest Debottlenecks
~$50
2012
$150 - $180
EU Butadiene Expansion
~$100
Mid 2013
$40 - $50
Methanol Restart
~$180
Late 2013
$250 - $260
PE Debottleneck
~$20
Early 2014
$10 - $20
La Porte Expansion
~$510
Mid 2014
$300 - $350
Channelview Expansion
~$200
Early 2015
$90 - $110
Corpus Christi Expansion
~$600
Late 2015
$300 - $350
PP Compounding Growth
~ $40
2013 - 2016
$70 - $90
New PE line
~ $400
Mid 2017
$50 - $100
PO/TBA Joint Venture
MOU
2018
$70 - $90
Total
~ $2,100
~ $1,300 - $1,600
Complete
In Construction/Permit Obtained
In Development |
 lyondellbasell.com
First Quarter Summary and Outlook
19
–
La Porte turnaround started in late
Q1’2014, estimate ~ 80 days
–
O&P –
EAI is expected to benefit from
advantaged feedstocks cracking in
the summer months
–
Intermediates and Derivatives is
expected to benefit from increased
oxyfuels margins
–
April 2014 Maya 2-1-1 crack spread
relatively unchanged from Q1
average
–
Growth projects progressing rapidly
First-Quarter Summary
Near-Term Outlook
–
Impact on O&P –
Americas from
maintenance, NGL volatility, and
weather related delays
–
Europe olefins and polyolefins
improvement from seasonal
recovery of volumes and margins;
continued profitability in
differentiated products
–
Steady Intermediates and
Derivatives results
–
Houston refinery impacted by coker
maintenance
–
Received permit for Corpus Christi
ethylene expansion |