Attached files
| file | filename |
|---|---|
| 8-K - FORM 8-K - VERIZON COMMUNICATIONS INC | d715494d8k.htm |
| EX-99.1 - EX-99.1 - VERIZON COMMUNICATIONS INC | d715494dex991.htm |
 VlpHU09DSUQyMDEzUTQ=
VlpHU09DSUQyMDE0UTE
1
st
QUARTER 2014
EARNINGS RESULTS
Fran Shammo
Chief Financial Officer
April 24, 2014
Exhibit 99.2 |
 2
NOTE: In this presentation we have made forward-looking statements. These
statements are based on our estimates and assumptions and are subject to
risks and uncertainties. Forward-looking statements include the
information
concerning
our
possible
or
assumed
future
results
of
operations.
Forward-looking
statements
also
include
those
preceded
or
followed
by
the
words
“anticipates,”
“believes,”
“estimates,”
“hopes”
or
similar
expressions.
For
those
statements,
we
claim
the
protection
of
the
safe
harbor
for
forward-looking
statements
contained in the Private Securities Litigation Reform Act of 1995. The following
important factors, along with those discussed in our filings with the
Securities and Exchange Commission (the “SEC”), could affect future results and
could cause those results to differ materially from those expressed in the
forward-looking statements: the ability to realize the expected benefits
of our transaction with Vodafone in the timeframe expected or at all; an adverse
change
in
the
ratings
afforded
our
debt
securities
by
nationally
accredited
ratings
organizations
or
adverse
conditions in the credit markets affecting the cost, including interest rates,
and/or availability of further financing; significantly increased levels of
indebtedness as a result of the Vodafone transaction; changes in tax laws or
treaties, or in their interpretation; adverse conditions in the U.S. and
international economies; material adverse changes in labor matters,
including labor negotiations, and any resulting financial and/or operational impact;
material
changes
in
technology
or
technology
substitution;
disruption
of
our
key
suppliers’
provisioning
of
products
or services; changes in the regulatory environment in which we operate, including
any increase in restrictions on our ability to operate our networks;
breaches of network or information technology security, natural disasters, terrorist
attacks or acts of war or significant litigation and any resulting financial impact
not covered by insurance; the effects of competition in the markets in which
we operate; changes in accounting assumptions that regulatory agencies,
including the SEC, may require or that result from changes in the accounting rules
or their application, which could result in an impact on earnings;
significant increases in benefit plan costs or lower investment returns on plan
assets; and the inability to implement our business strategies.
“Safe Harbor”
Statement
As required by SEC rules, we have provided a reconciliation of the non-GAAP
financial measures included in this presentation to the most directly
comparable GAAP measures in materials on our website at www.verizon.com/investor. |
 3
1Q ’14
EPS
Reported
$1.15
Less:
Omnitel Gain on Sale
$0.55
Add:
Debt redemption
Purchase transaction costs
$0.17
$0.08
Adjusted
$0.84
Note: Results above are adjusted for non-operational items. Amounts may not add due to
rounding. Strong earnings per share
CONSOLIDATED
Earnings Summary |
 4
1Q ’14 *
Net Income ($B)
EPS
Adjusted Earnings
$2.9
$0.84
Add:
45% VZW Income (1/1/14 –
2/21/14)
Tax effect
$1.9
($0.8)
$1.2
Less:
Transaction related costs (1/1/14 –
2/21/14)
Tax effect
($0.4)
$0.2
($0.3)
Adjusted to show full 1Q ’14 VZW ownership
$3.8
$0.91**
*
Results above are adjusted for non-operational items. Amounts may not add due to rounding.
**
Assumes 4.149 billion diluted shares outstanding from 1/1/14 to 3/31/14.
Full ownership illustrative impact in 1Q ’14 of $0.07 per share
ILLUSTRATIVE NON-GAAP CONSOLIDATED EARNINGS
Full Ownership of VZW –
1Q ’14
Note: Verizon acquired full ownership of Verizon Wireless on 2/21/14. The illustration
above assumes 100% ownership of Verizon Wireless from 1/1/14
to 3/31/14. |
 5
CONSOLIDATED
1Q ’14 Overview
•
Double-digit growth in operating income and earnings per
share for past five quarters
•
Strongest consolidated revenue growth in past five quarters
•
Industry-leading wireless service revenue growth and
profitability
•
Growth in consumer revenue driven by FiOS
•
Solid cash flow with a focus on disciplined investment
Delivered strong results |
 6
•
Consolidated revenue of
$30.8B, up 4.8% Y/Y
–
Revenue growth across all
strategic areas
•
1Q ’14 EBITDA margin of
36.7%, up 160 bps Y/Y
•
1Q ’14 adjusted EPS of $0.84,
up 23.5% Y/Y; reported EPS
of $1.15
4.8%
Y/Y Growth
$29.4
$31.1
Wireline
Wireless
Total Revenue ($B)
$30.8
Adjusted EPS
$0.68
$0.66
$0.84
23.5%
Y/Y Growth
Revenue growth and margin expansion drive earnings
CONSOLIDATED
1Q ’14 Financial Summary
Note: Results above for EPS are adjusted for non-operational items.
1Q '13
4Q '13
1Q '14
1Q '13
4Q '13
1Q '14 |
 •
1Q ’14 cash flow of $7.1B
•
1Q ’14 Capex/Revenue of
13.5%
•
1Q ’14 free cash flow of $3.0B
1Q ’13
1Q ’14
Cash flow from operations
$7.5
$7.1
Capital expenditures
$3.6
$4.2
Free cash flow
$3.9
$3.0
Total Debt
$52.9
$109.8
Net Debt to Adjusted EBITDA
1.2x
2.5x
Cash Flow Summary ($B)
Solid cash flow and capital profile
CONSOLIDATED
Cash Flow
Note: Amounts may not add due to rounding.
7 |
 •
Sustained strong service
revenue growth in 1Q ’14
•
Total revenue growth of 6.9%
Y/Y
•
EBITDA growth of 11.3% Y/Y
•
EBITDA service margin
expands to 52.1%, up 170 bps
Y/Y
Service Revenue ($B)
EBITDA Service Margin %
Segment EBITDA ($B)
WIRELESS
Revenue & Profitability
Disciplined execution drives growth in revenue and profitability
8 |
 •
Retail postpaid ARPA of
$159.67, up 6.3% Y/Y
–
50% of postpaid accounts on
More Everything Plans
–
Smartphone penetration of 72%,
up from 61% a year ago
•
35.1M retail postpaid accounts
–
2.77 connections per account
Retail Postpaid ARPA
More Everything Accounts
More Everything % of postpaid accounts
Connections and usage growth driving high-tier data plans
WIRELESS
ARPA
9 |
 •
539K retail postpaid net
adds in 1Q ’14 including
866K 4G smartphones*
•
Retail postpaid tablet net
adds of 634K in 1Q ’14,
tablet base now at 4.3M
•
6.5% of retail postpaid base
upgraded in 1Q ’14
•
Retail postpaid churn of
1.07% in 1Q ’14
* Excludes acquisitions and adjustments
Retail Net Adds* (000)
Retail Connections (M)
4G smartphones and tablets drive retail postpaid net adds
WIRELESS
Connections / Net Adds / Churn
10
Retail Postpaid
Retail Prepaid |
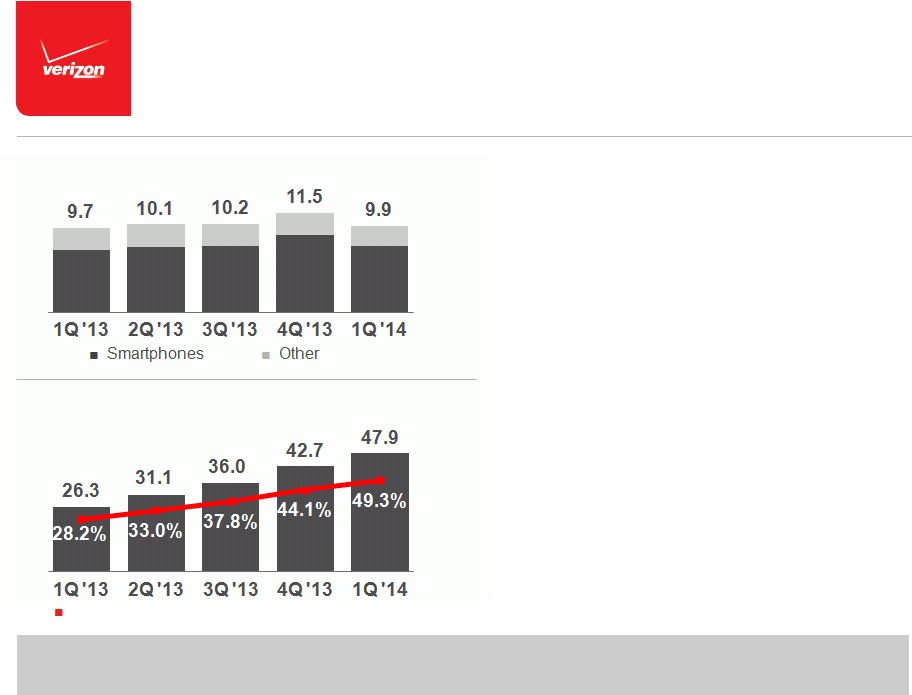 •
85% of device activations in
1Q ’14 were phones
–
7.6M smartphones activated in
1Q ’14
•
8.1M 4G LTE device activations
in 1Q ’14
•
Wireless 4G LTE network:
–
About 73% of total data traffic
currently on 4G LTE network
–
Industry leading in 4G LTE
connections
Retail Postpaid Device Activations (M)
4G LTE Devices (M)
% of Retail Postpaid Connections
Independent testing confirms 4G LTE leadership
WIRELESS
Devices / 4G LTE
11 |
 •
6.2% consumer revenue growth
Y/Y;
7
th
consecutive
quarter
of
over 4% growth Y/Y
•
FiOS now 74% of consumer
revenue
–
8.7% Y/Y growth in triple play
customers
•
FiOS Internet subscribers
–
6.2M subscribers, 98K net adds
–
39.7% penetration
•
FiOS Video subscribers
–
5.3M subscribers, 57K net adds
–
35.0% penetration
Consumer Revenue ($B)
Copper Migrations (K)
FiOS driving consumer growth
WIRELINE
Mass Markets
12 |
 •
FiOS revenue grew 15.5%
Y/Y
•
Global Enterprise revenue
down 4.4% Y/Y
–
Strategic services revenue
growth of 1.8% Y/Y
•
Total revenue of $9.8B in
1Q ’14, down 0.4% Y/Y
•
EBITDA margin of 22.3% in
1Q ’14
Total Revenue ($B)
EBITDA Margin %
Segment EBITDA ($B)
Focus on improving long-term profitability
WIRELINE
Revenue & Profitability
13 |
 •
Continue to invest in network and platforms
•
Focus on margin expansion and profitable growth
•
Solid earnings momentum and cash flow generation
•
Disciplined capital program across entire business
•
Capitalize on strategic investments
CONSOLIDATED
Summary
Build on 1Q ’14 momentum
14 |
 VlpHU09DSUQyMDEzUTQ=
1
st
QUARTER 2014
EARNINGS RESULTS
Fran Shammo
Chief Financial Officer
April 24, 2014 |