Attached files
| file | filename |
|---|---|
| 8-K - FORM 8-K - PROVIDENT FINANCIAL SERVICES INC | d713791d8k.htm |
 Annual Meeting
of Stockholders
April 24, 2014
Exhibit 99.1 |
 Forward Looking
Statements 2
Certain statements contained herein are "forward-looking statements" within the
meaning of Section 27A of the Securities Act of 1933 and Section 21E of the Securities
Exchange Act of 1934. Such forward-looking statements may be identified by reference
to a future period or periods, or by the use of forward-looking terminology, such as "may,"
"will," "believe," "expect," "estimate," "anticipate,"
"continue," or similar terms or variations on those terms, or the negative of
those terms. Forward-looking statements are subject to numerous risks and uncertainties, including, but
not limited to, those related to the economic environment, particularly in the market areas in
which Provident Financial Services, Inc. (the “Company”) operates, competitive
products and pricing, fiscal and monetary policies of the U.S. Government, changes in
government regulations affecting financial institutions, including regulatory fees and capital
requirements, changes in prevailing interest rates, acquisitions and the integration of acquired
businesses, credit risk management, asset-liability management, the financial and
securities markets and the availability of and costs associated with sources of
liquidity.
The Company cautions readers not to place undue reliance on any such forward-looking
statements, which speak only as of the date made. The Company also advises readers that
the factors listed above could affect the Company's financial performance and could cause
the Company's actual results for future periods to differ materially from any opinions or
statements expressed with respect to future periods in any current statements. The Company does not
undertake and specifically declines any obligation to publicly release the result of any
revisions which may be made to any forward-looking statements to reflect events or
circumstances after the date of such statements or to reflect the occurrence of
anticipated or unanticipated events.
A detailed discussion of factors that could affect our results is included in our SEC filings,
including the “Risk Factors” section of our Annual Report on Form 10-K for
the year ended December 31, 2013. |
 3
Superior
Markets
Consistent
Performance
Valuable
Deposit
Franchise
Proven
Asset
Generator
Capable
Risk
Manager
Shareholder
Focused |
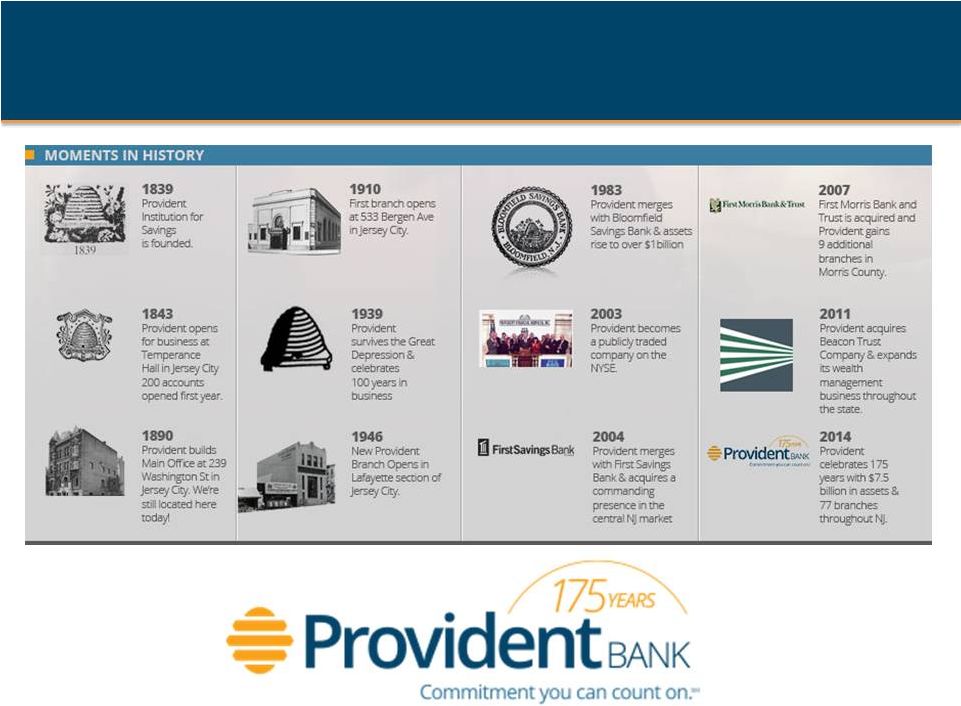 A look back: 175 years of commitment you can count on
|
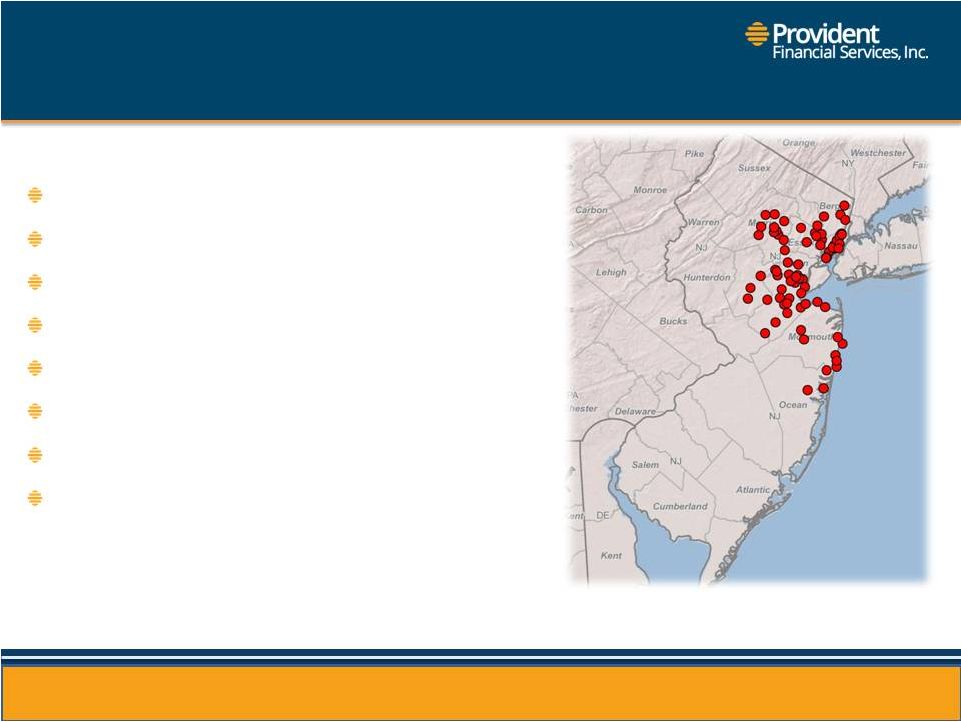 Company
Highlights New Jersey’s oldest state chartered bank
Over 75 branch offices
Wealth Management and Trust Administration Services
Well capitalized under current regulatory standards
Eleven year history of quarterly cash dividends to stockholders
No TARP
No dilutive stock offerings
No bulk NPA sales or debt restructurings
5 |
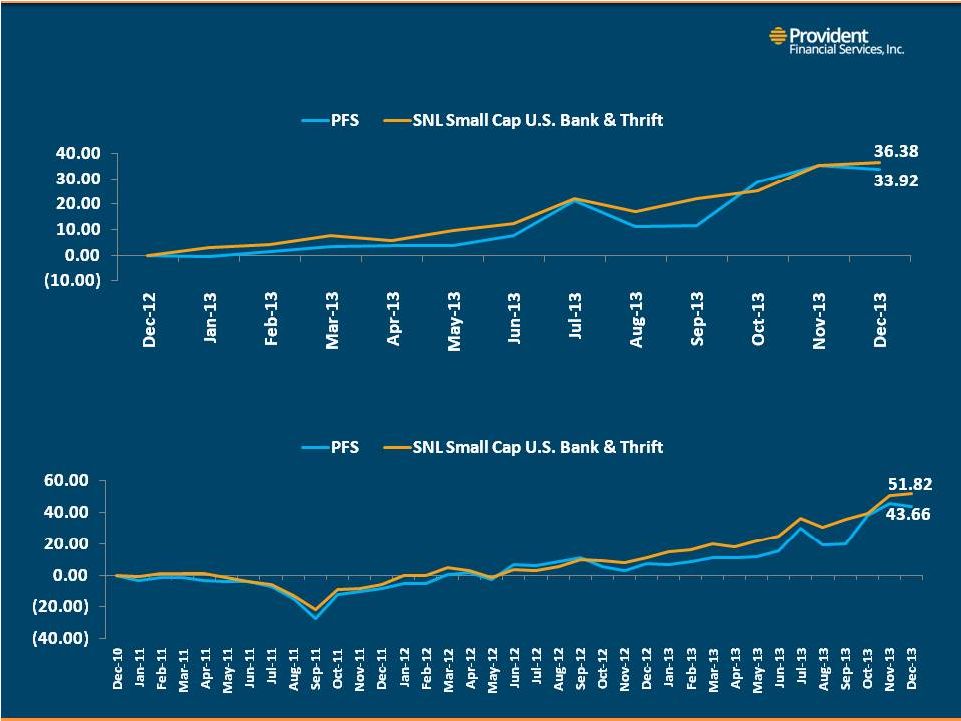 Total
Stockholders’ Return
One-year Total Return
Three-year Total Return |
 12/13/10
12/31/11
12/31/12
12/31/13
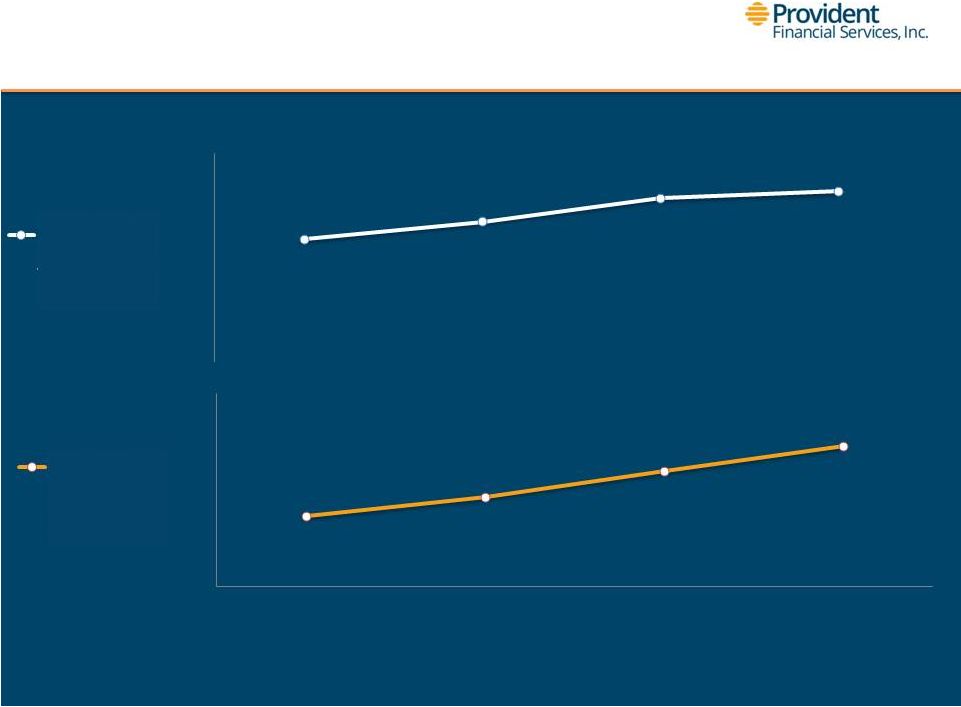
Enhancing Shareholder Value
$0.88
$1.01
$1.18
$1.23
Earnings per
Share 12%
CAGR
$9.47
$9.87
$10.40
$10.92
TBV per
Share 5%
CAGR |
 $30.9M
$50.1M
$50.1M
$38.2M
$38.2M
10% CAGR
$13.19 Average
$13.19 Average
Cost per Share
Cost per Share
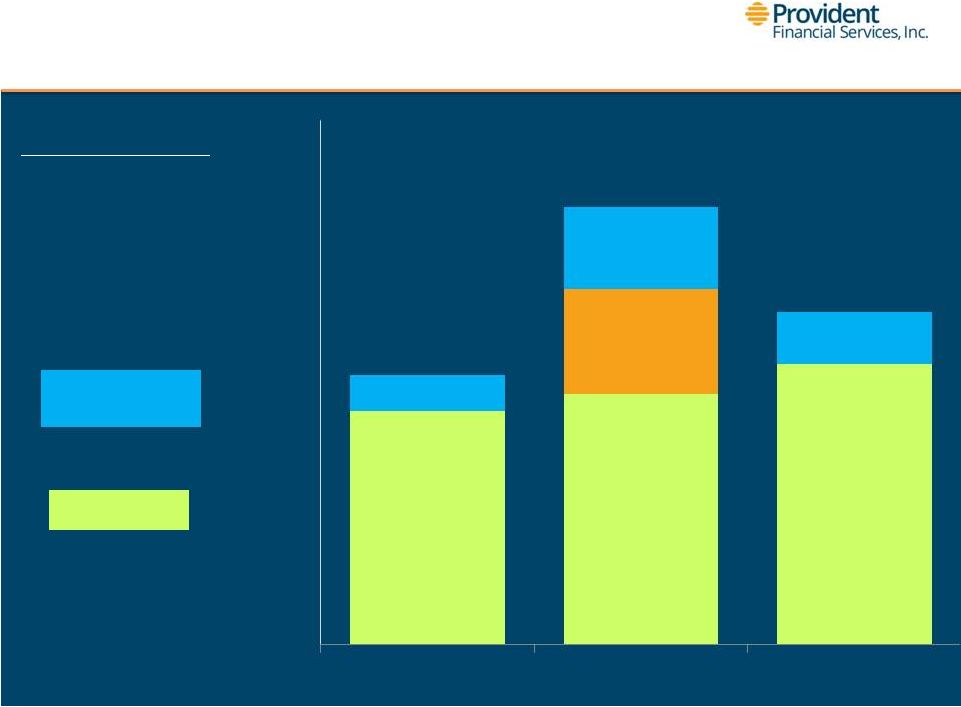
Enhancing Shareholder Value
Regular Dividends
$26.8
Regular Dividends
$28.7
Regular Dividends
$32.2
Special Dividend
$12.0
Stock Repurchases
$4.1
Stock Repurchases
Stock Repurchases
$5.9
$-
$10.0
$20.0
$30.0
$40.0
$50.0
$60.0
2011
2012
2013
$9.4
Return of Capital |
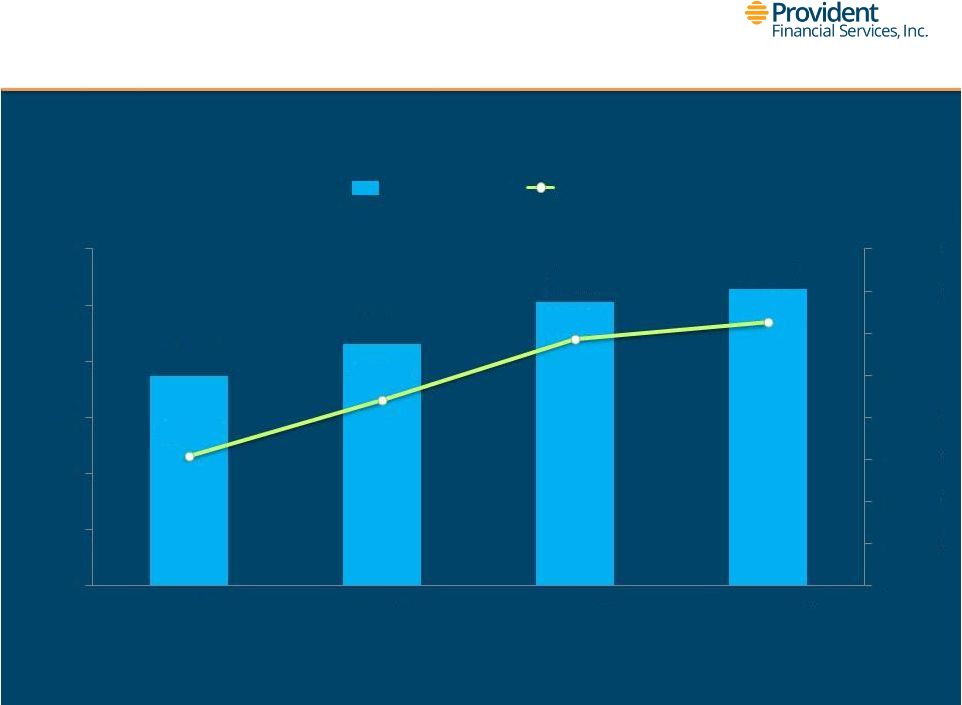 Increasing
Profitability (*in millions)
$49.7
$57.3
$67.3
$70.5
0.73%
0.83%
0.94%
0.97%
$-
$10.0
$20.0
$30.0
$40.0
$50.0
$60.0
$70.0
$80.0
0.50%
0.60%
0.70%
0.80%
0.90%
1.00%
1.10%
12/31/10
12/31/11
12/31/12
12/31/13
Net Income*
ROAA |
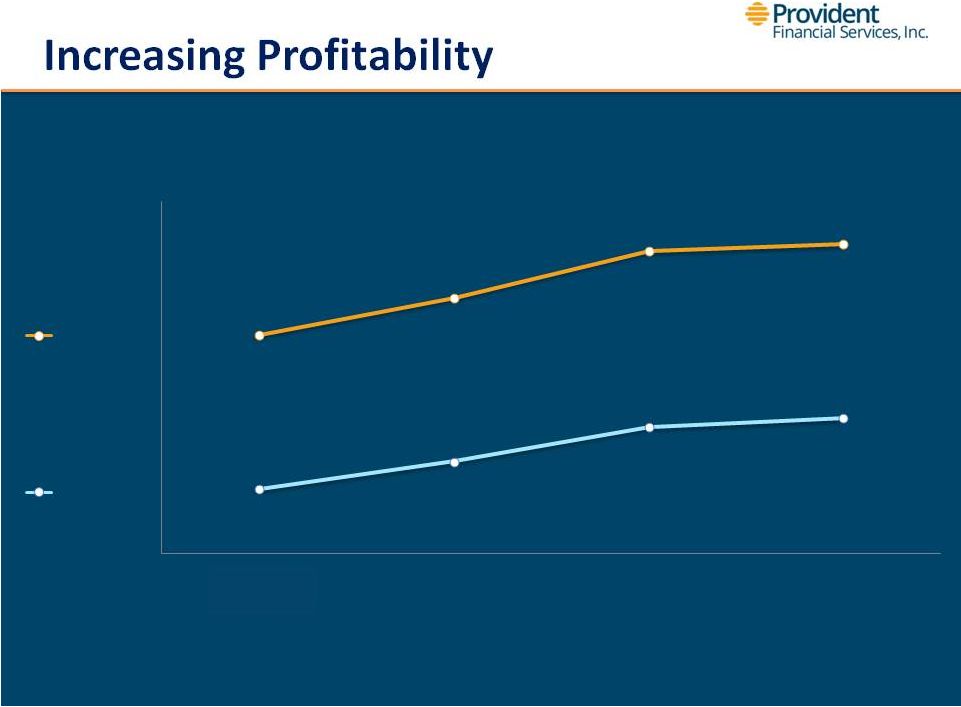 Increasing
Profitability 8.97%
9.81%
10.88%
11.04%
5.46%
6.09%
6.88%
7.08%
12/31/10
12/31/11
12/31/12
12/31/13
ROATE
ROAE |
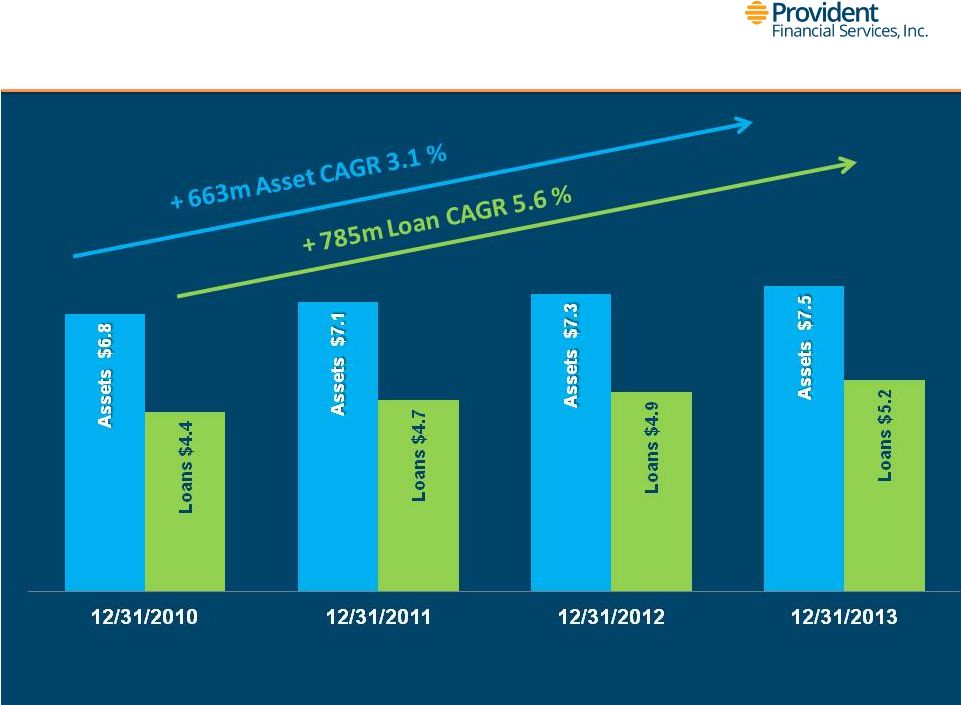 Consistent
Growth |
 Changing Loan
Mix Commercial Types: 56%
Commercial Types: 66%
Retail Types: 44%
Retail Types: 34%
Residential
31%
CRE
27%
Multifamily
9%
Construction
3%
C&I
17%
Consumer
13%
2010
Residential
23%
CRE
27%
Multifamily
18%
Construction
4%
C&I
18%
Consumer
11%
2013 |
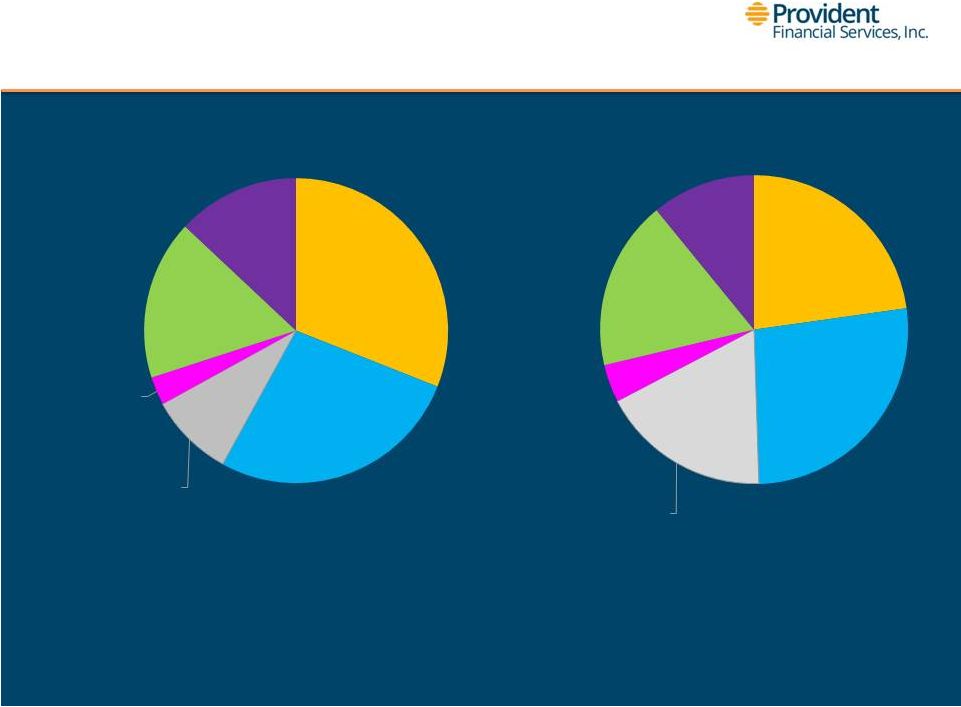
 Average Earning
Asset Funding Interest
Bearing Core
55%
Non-Int
Bearing
13%
Time
14%
Borrowings
14%
Equity
4%
2013
Interest
Bearing Core
49%
Non-Int
Bearing
9%
Time
23%
Borrowings
16%
Equity
3%
2010 |
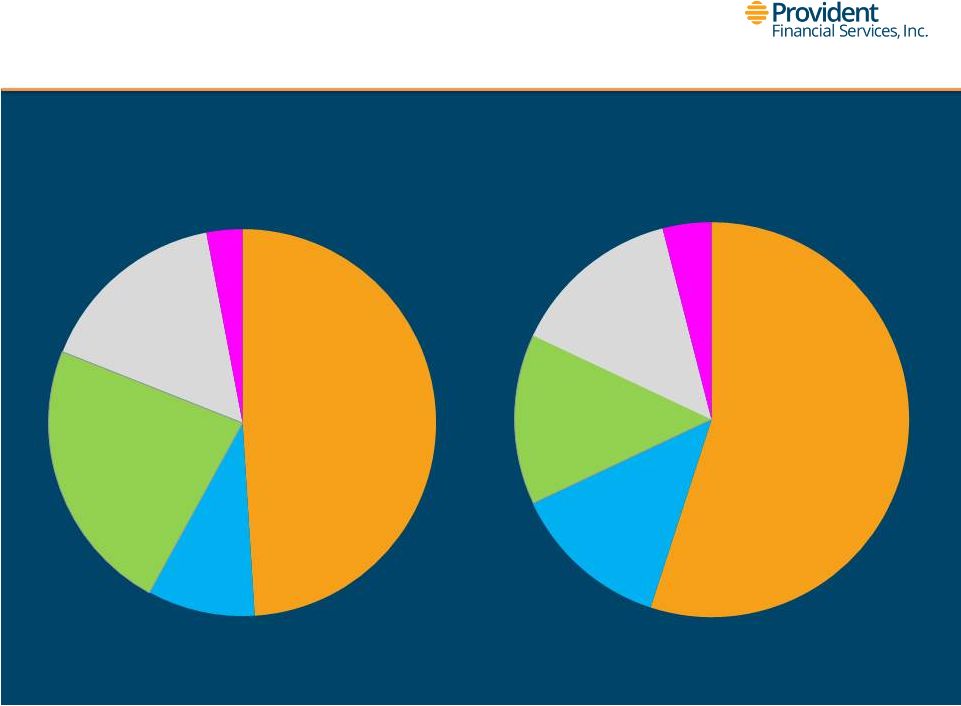
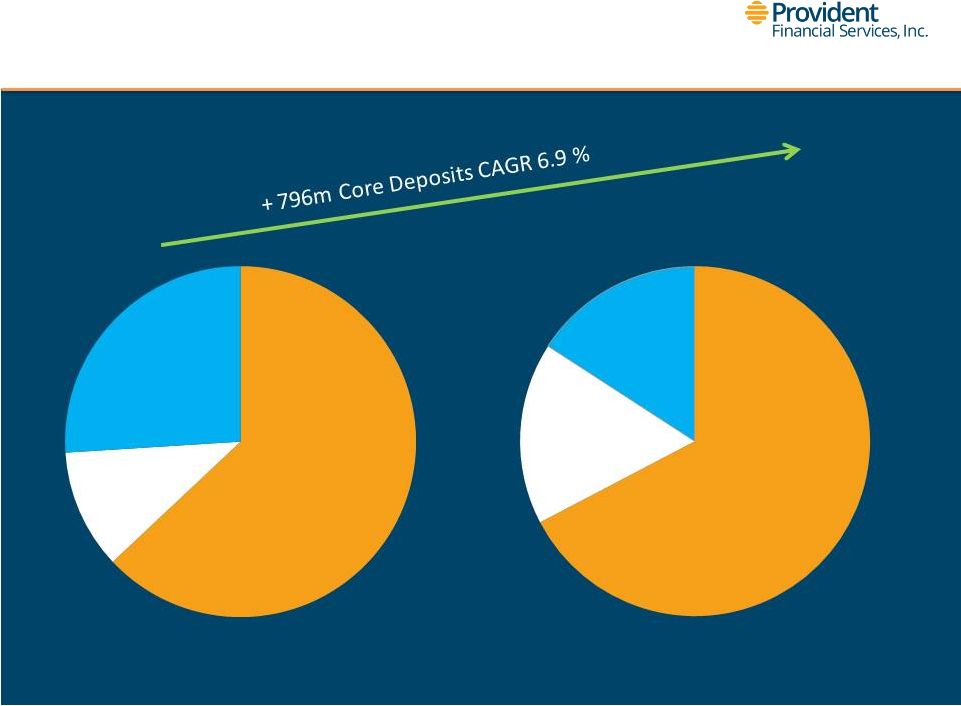 Deposit
Mix Interest
Bearing Core
68%
$3.5B
Non-Int
Bearing 17%
$865M
Time 16%
$806M
2013
Interest
Bearing Core
63%
$3.1B
Non-Int
Bearing
11%
$548M
Time
26%
$1.3B
2010 |
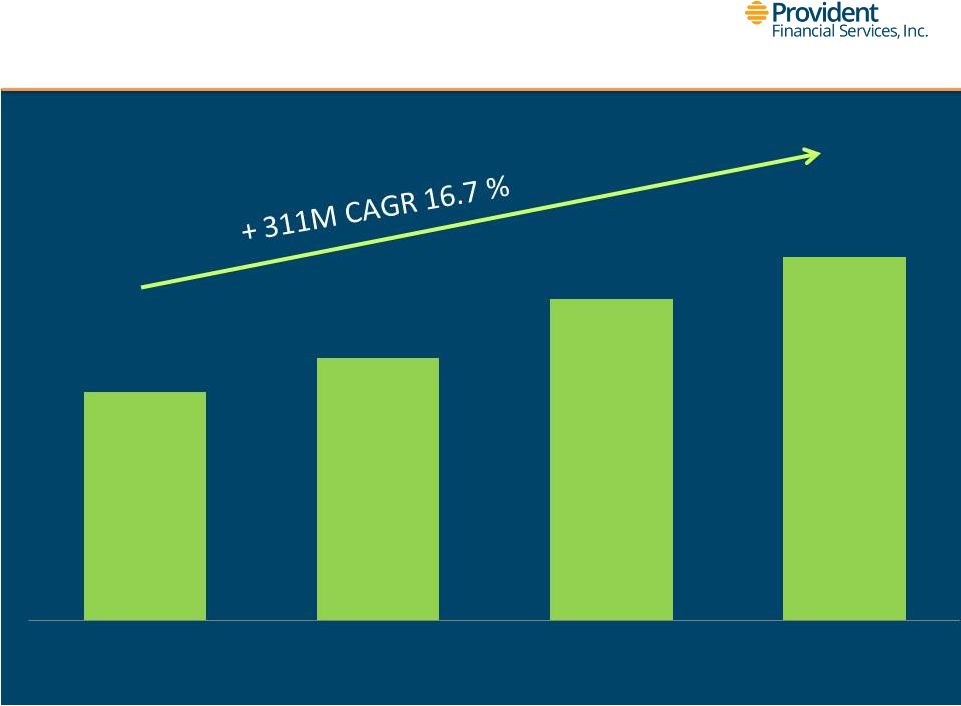 Average
Non-interest Demand Deposit Growth $528.1
$605.8
$743.1
$839.3
12/31/2010
12/31/2011
12/31/2012
12/31/2013 |
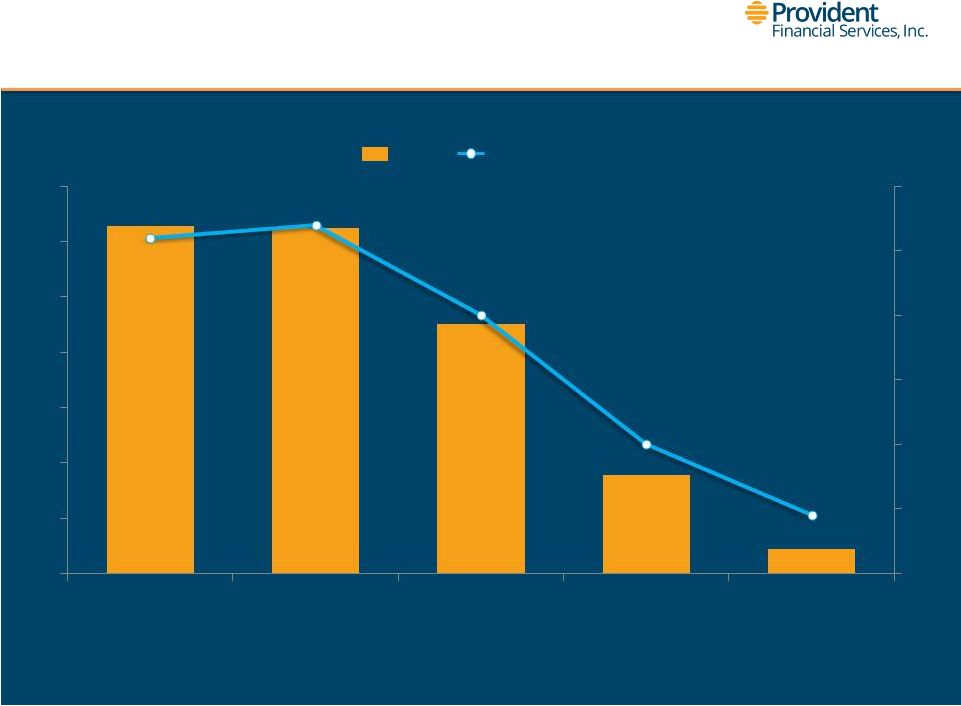 Asset Quality 5
Quarter Trend $111,463
$111,250
$102,575
$88,865
$82,166
1.53%
1.55%
1.41%
1.21%
1.10%
4 Q 2012
1 Q 2013
2Q 2013
3Q 2013
4Q 2013
NPAs
NPAs/Assets |
 Provident
Consolidated
Bank
PFS
Tangible Common Equity
*
9.18%
Tier 1 Leverage
8.34%
9.42%
Tier 1 Risk-Based Capital
11.42%
12.89%
Total Risk-Based Capital
12.67%
14.14%
Capital Ratios –
12/31/13
17
* Not meaningful |
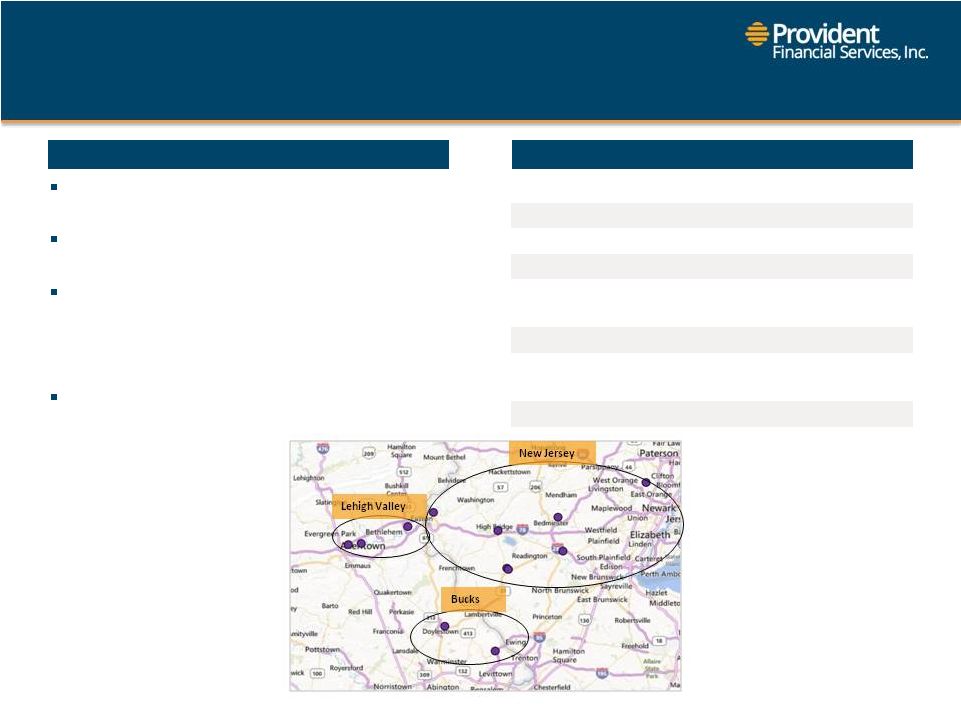 18
Company Description
Financial Summary ($ in millions) F/Y/E 2013
Team Capital Bank is a Pennsylvania state-chartered
savings bank
Organized by regional segments / lending teams, which
include: Lehigh Valley, Bucks County and New Jersey
12 branches: Lehigh Valley (3), Bucks (2) and New Jersey
(7)
-
Experienced commercial lending teams with
approximately 15 loan officers
Focus on small business and middle market accounts
that are underserved by larger banks
Overview of Team Capital
Assets
$944
Net Loans
$603
Deposits
$727
Tangible Common Equity
$70
ROAA
0.68%
ROACE
9.1%
NPAs / Assets
0.38%
NPAs / Loans + OREO
0.60% |
 19
|