Attached files
| file | filename |
|---|---|
| 8-K/A - FORM 8-K - ManpowerGroup Inc. | form8k.htm |
| EX-99.1 - PRESS RELEASE FINANCIALS - ManpowerGroup Inc. | exhibit_99-1.htm |
Exhibit 99.2

ManpowerGroup First Quarter Results April 23, 2014

ManpowerGroup | April 2014 * Forward-Looking Statements This presentation contains statements, including financial projections, that are forward-looking in nature. These statements are based on managements’ current expectations or beliefs, and are subject to known and unknown risks and uncertainties regarding expected future results. Actual results might differ materially from those projected in the forward-looking statements. Additional information concerning factors that could cause actual results to materially differ from those in the forward-looking statements is contained in the ManpowerGroup Inc. Annual Report on Form 10-K dated December 31, 2013, which information is incorporated herein by reference, and such other factors as may be described from time to time in the Company’s SEC filings. Any forward-looking statements in this presentation speak only as of the date hereof. The Company assumes no obligation to update or revise any forward-looking statements. *
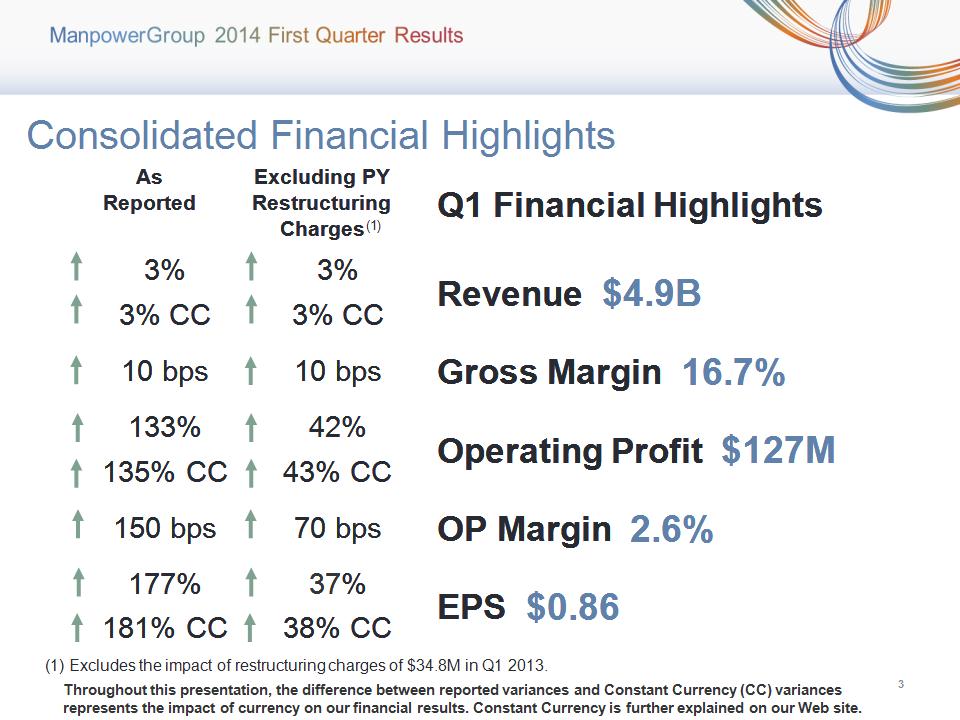
ManpowerGroup | April 2014 * Excludes the impact of restructuring charges of $34.8M in Q1 2013. As Reported Excluding PY Restructuring Charges Q1 Financial Highlights 3% 3% Revenue $4.9B 3% CC 3% CC Revenue $4.9B 10 bps 10 bps Gross Margin 16.7% 133% 42% Operating Profit $127M 135% CC 43% CC Operating Profit $127M 150 bps 70 bps OP Margin 2.6% 177% 37% EPS $0.86 181% CC 38% CC EPS $0.86 Throughout this presentation, the difference between reported variances and Constant Currency (CC) variances represents the impact of currency on our financial results. Constant Currency is further explained on our Web site. Consolidated Financial Highlights (1)
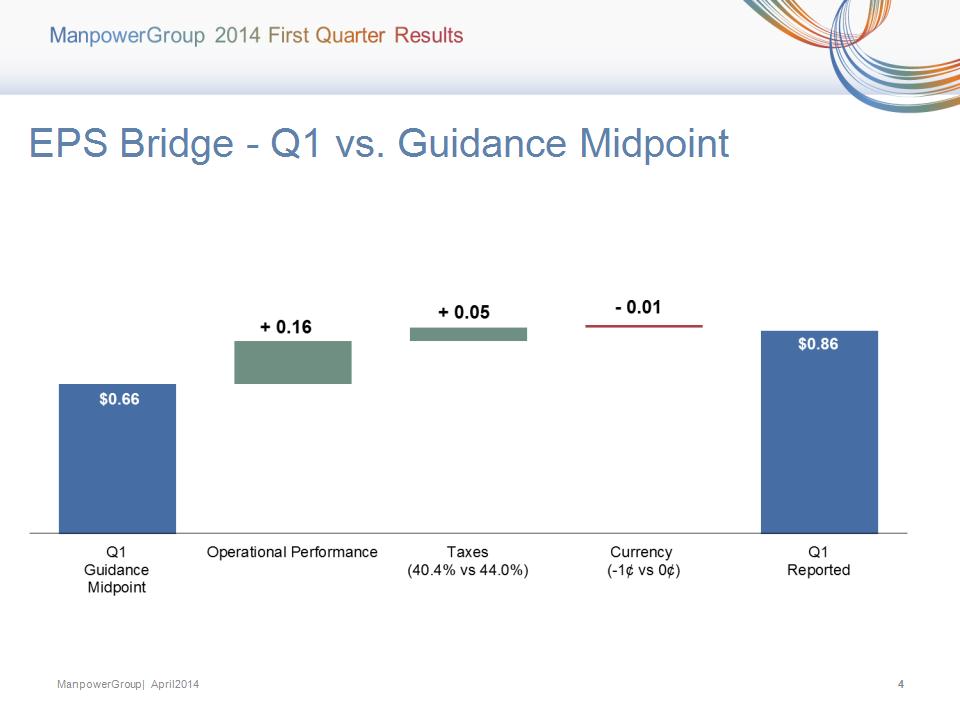
ManpowerGroup | April 2014 * EPS Bridge – Q1 vs. Guidance Midpoint + 0.01 + 0.10 + 0.05 - 0.01 + 0.02

ManpowerGroup | April 2014 * Consolidated Gross Margin Change

ManpowerGroup | April 2014 * $817M Growth in CC % Business Line Gross Profit – Q1 2014 █ Manpower █ Experis █ ManpowerGroup - Total █ ManpowerGroup Solutions █ Right Management

ManpowerGroup | April 2014 * SG&A Expense Bridge – Q1 YoY (in millions of USD) Productivity Gain 14.1% % of Revenue 14.7% % of Revenue

ManpowerGroup | April 2014 * Operating Unit Profit (OUP) is the measure that we use to evaluate segment performance. OUP is equal to segment revenues less direct costs and branch and national headquarters operating costs. As Reported Excluding PY Restructuring Charges Q1 Financial Highlights 2% 2% Revenue $1.1B 3% CC 3% CC Revenue $1.1B 61% 18% OUP $26M 72% CC 26% CC OUP $26M 90 bps 40 bps OUP Margin 2.4% (1) Americas Segment (22% of Revenue) Included in these amounts is the US, which had revenue of $721M (+2%) and OUP of $13.4M (+81%, or +34% excluding the impact of restructuring charges in Q1 2013). Excludes the impact of restructuring charges of $5.9M in Q1 2013. (2)

ManpowerGroup | April 2014 * Americas – Q1 Revenue Growth YoY Revenue Growth - CC Revenue Growth % of Segment Revenue 67% 12% 5% 16%

ManpowerGroup | April 2014 * As Reported Excluding PY Restructuring Charges Q1 Financial Highlights 8% 8% Revenue $1.7B 4% CC 4% CC Revenue $1.7B 56% 52% OUP $68M 50% CC 46% CC OUP $68M 130 bps 110 bps OUP Margin 4.0% (1) Southern Europe Segment (35% of Revenue) Included in these amounts is France, which had revenue of $1.2B (+2% CC) and OUP of $51.2M (+65% CC). Excludes the impact of restructuring charges of $1.2M in Q1 2013. (2)

ManpowerGroup | April 2014 * Southern Europe – Q1 Revenue Growth YoY Revenue Growth - CC Revenue Growth % of Segment Revenue 71% 16% 6% 7% (1) On an organic basis, Spain revenue increased 28% (23% in CC).

ManpowerGroup | April 2014 * As Reported Excluding PY Restructuring Charges Q1 Financial Highlights 7% 7% Revenue $1.5B 5% CC 5% CC Revenue $1.5B 261% 39% OUP $38M 257% CC 37% CC OUP $38M 180 bps 60 bps OUP Margin 2.6% Northern Europe Segment (30% of Revenue) (1) Excludes the impact of restructuring charges of $17.1M in Q1 2013.

ManpowerGroup | April 2014 * Northern Europe – Q1 Revenue Growth YoY Revenue Growth - CC Revenue Growth % of Segment Revenue

ManpowerGroup | April 2014 * As Reported Excluding PY Restructuring Charges Q1 Financial Highlights 9% 9% Revenue $574M 1% CC 1% CC Revenue $574M 38% 18% OUP $20M 52% CC 31% CC OUP $20M 120 bps 80 bps OUP Margin 3.5% APME Segment (12% of Revenue) (1) Excludes the impact of restructuring charges of $2.4M in Q1 2013.

ManpowerGroup | April 2014 * APME – Q1 Revenue Growth YoY Revenue Growth - CC Revenue Growth % of Segment Revenue 37% 25% 38%

ManpowerGroup | April 2014 * Right Management Segment (1% of Revenue) As Reported Excluding PY Restructuring Charges Q1 Financial Highlights 4% 4% Revenue $73M 4% CC 4% CC Revenue $73M 306% 42% OUP $8M 304% CC 41% CC OUP $8M 860 bps 370 bps OUP Margin 11.3% (1) Excludes the impact of restructuring charges of $3.8M in Q1 2013.

ManpowerGroup | April 2014 * Cash Flow Summary – Q1

ManpowerGroup | April 2014 * Balance Sheet Highlights Total Debt (in millions of USD) Total Debt to Total Capitalization Total Debt Net Debt (Cash)

ManpowerGroup | April 2014 * (1) (2) The $600M agreement requires that we comply with a Leverage Ratio (Debt-to-EBITDA) of not greater than 3.5 to 1 and a Fixed Charge Coverage Ratio of not less than 1.5 to 1, in addition to other customary restrictive covenants. As defined in the agreement, we had a Debt-to-EBITDA ratio of 0.34 and a fixed charge coverage ratio of 3.54 as of March 31, 2014. As of March 31, 2014, there were $0.9M of standby letters of credit issued under the agreement. Represents subsidiary uncommitted lines of credit & overdraft facilities, which total $375.6M. Total subsidiary borrowings are limited to $300M due to restrictions in our Revolving Credit Facility, with the exception of Q3 when subsidiary borrowings are limited to $600M.

ManpowerGroup | April 2014 * Second Quarter Outlook Revenue Total Up 4-6% (Up 2-4% CC) Americas Up/Down 1% (Up 3-5% CC) Southern Europe Up 9-11% (Up 3-5% CC) Northern Europe Up 6-8% (Up 2-4% CC) APME Down 3-5% (Up/Down 1% CC) Right Management Right Management Flat/Down 2% (Down 1-3% CC) Gross Profit Margin Gross Profit Margin 16.7 – 16.9% Operating Profit Margin Operating Profit Margin 3.4 – 3.6% Tax Rate Tax Rate 39% EPS EPS $1.26 – $1.34 (favorable $0.02 currency)

ManpowerGroup | April 2014 * Highlights Strong first quarter execution Positive revenue momentum in major geographies Simplification plan driving sales focus and strong operating leverage. Management transition smooth and on track

ManpowerGroup | April 2014 * ManpowerGroup | April 2014 * Questions