Attached files
| file | filename |
|---|---|
| EX-99.3 - EX-99.3 - SONIC AUTOMOTIVE INC | d715492dex993.htm |
| EX-99.1 - EX-99.1 - SONIC AUTOMOTIVE INC | d715492dex991.htm |
| 8-K - FORM 8-K - SONIC AUTOMOTIVE INC | d715492d8k.htm |
Exhibit 99.2

Q1 2014 EARNINGS REVIEW
April 22, 2014
2
FORWARD-LOOKING STATEMENTS
This presentation contains “forward-looking statements” within the meaning of the Private Securities
Litigation Reform Act of 1995. These statements relate to future events, are not historical facts and are
based on our current expectations and assumptions regarding our business, the economy and other future
conditions. These statements can generally be identified by lead-in words such as “believe”, “expect”,
“anticipate”, “intend”, “plan”, “foresee”, “may” ,“will” and other similar words. Statements that describe
our Company’s objectives, plans or goals are also forward-looking statements. Examples of such forward-looking
information we may be discussing in this presentation include, without limitation, anticipated 2014
industry new vehicle sales volume, the implementation of growth and operating strategies, including
acquisitions of dealerships and properties, the development of open points and stand-alone pre-owned
stores, the return of capital to shareholders , anticipated future success and impacts from the
implementation of our strategic initiatives and earnings per share expectations.
You are cautioned that these forward-looking statements are not guarantees of future performance, involve
risks and uncertainties and actual results may differ materially from those projected in the forward-looking
statements as a result of various factors. These risks and uncertainties include, among other things, (a)
economic conditions in the markets in which we operate, (b) the success of our operational strategies, (c)
our relationships with the automobile manufacturers, (d) new and pre-owned vehicle sales volume, and (e)
earnings expectations for the year ended December 31, 2014. These risks and uncertainties, as well as
additional factors that could affect our forward-looking statements, are described in our Form 10-K for the
year ending December 31, 2013.
These forward-looking statements, risks, uncertainties and additional factors speak only as of the date of
this presentation. We undertake no obligation to update any such statements.
CONTENT
STRATEGIC FOCUS
QUARTER IN REVIEW
FINANCIAL RESULTS
OPERATIONS RECAP
SUMMARY AND OUTLOOK
3
4
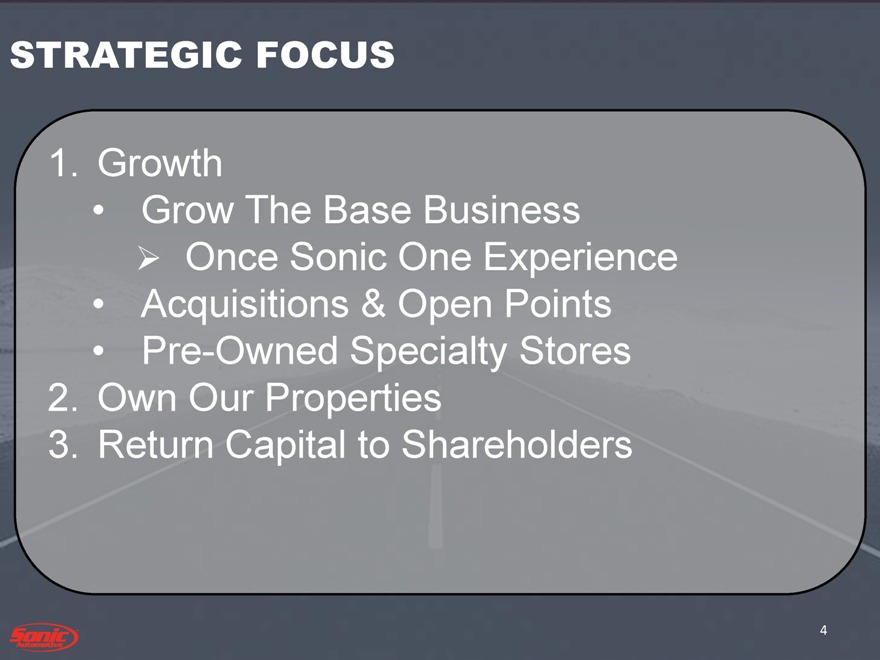
STRATEGIC FOCUS
1. Growth
Grow The Base Business
Once Sonic One Experience
Acquisitions & Open Points
Pre-Owned Specialty Stores
2. Own Our Properties
3. Return Capital to Shareholders
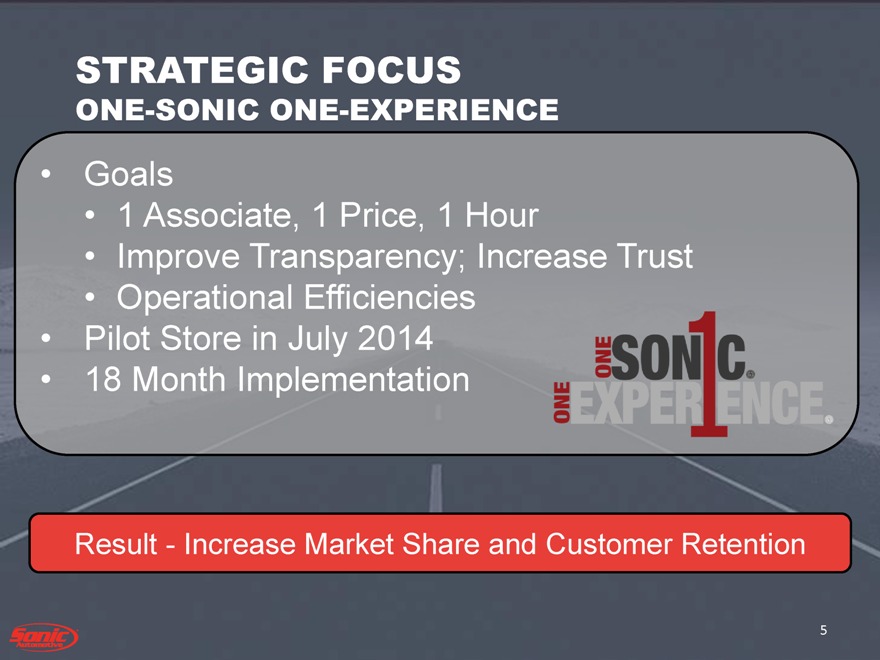
STRATEGIC FOCUS
ONE-SONIC ONE-EXPERIENCE
5
Goals
1 Associate, 1 Price, 1 Hour
Improve Transparency; Increase Trust
Operational Efficiencies
Pilot Store in July 2014
18 Month Implementation
Result—Increase Market Share and Customer Retention
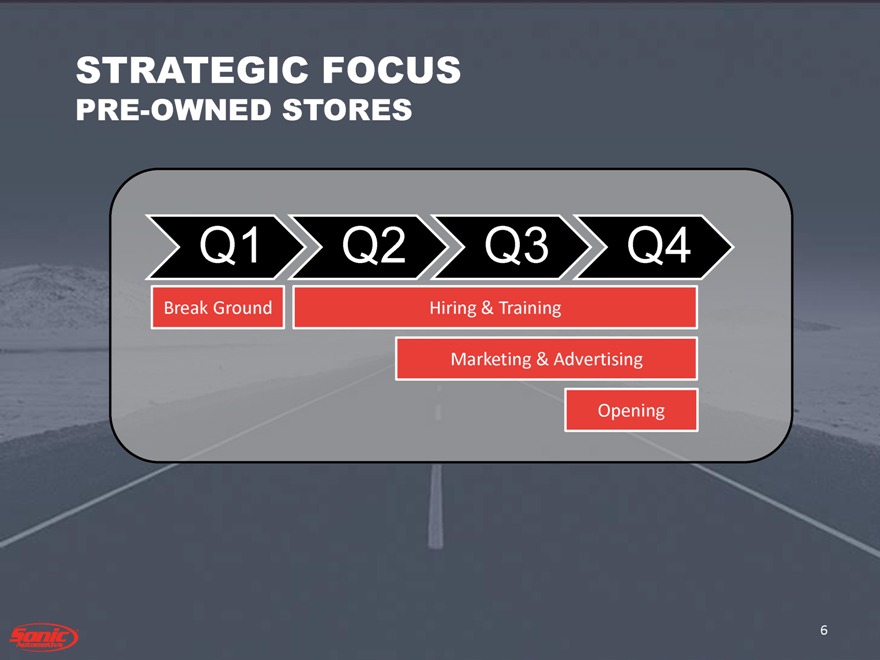
STRATEGIC FOCUS
PRE-OWNED STORES
6
Break Ground Hiring & Training
Marketing & Advertising
Opening
Q1 Q2 Q3 Q4
7
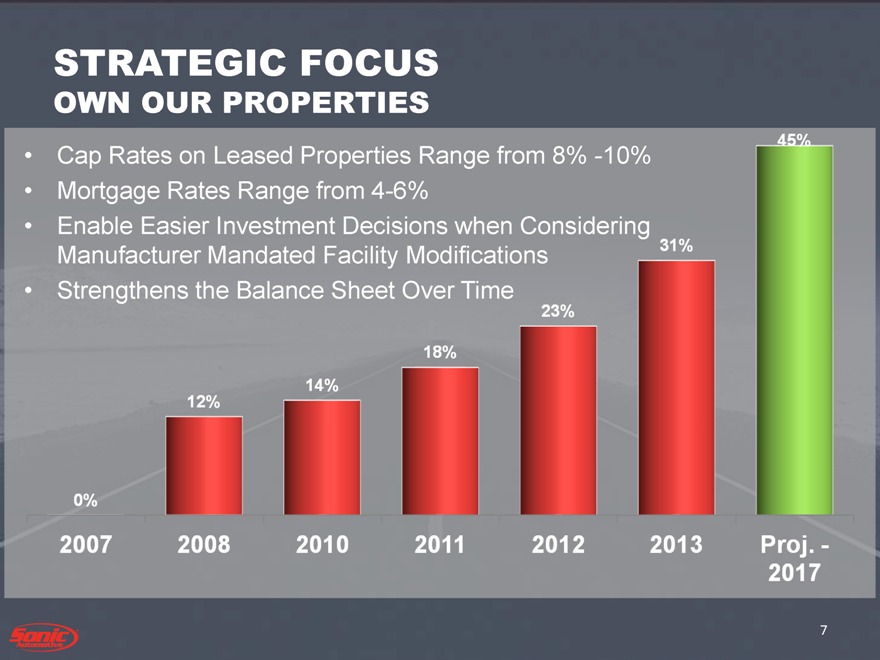
Cap Rates on Leased Properties Range from 8% -10%
Mortgage Rates Range from 4-6%
Enable Easier Investment Decisions when Considering
Manufacturer Mandated Facility Modifications
Strengthens the Balance Sheet Over Time
STRATEGIC FOCUS
OWN OUR PROPERTIES
2007 2008 2010 2011 2012 2013 Proj. 2017
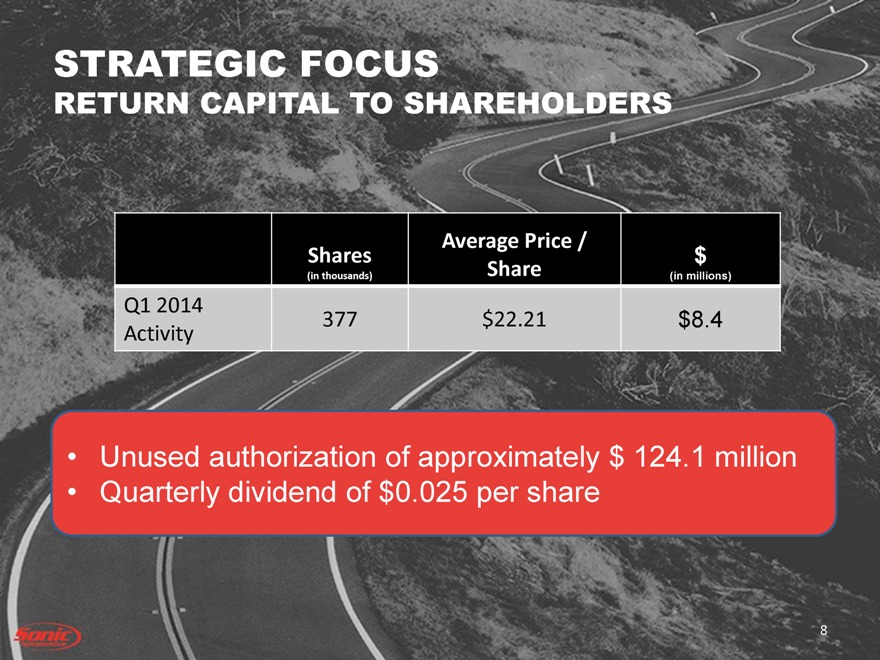
STRATEGIC FOCUS
RETURN CAPITAL TO SHAREHOLDERS
Unused authorization of approximately $ 124.1 million
Quarterly dividend of $0.025 per share
Shares
(in thousands)
Average Price /
Share $
(in millions)
Q1 2014
Activity
377 $22.21 $8.4
8
Q1 2014 FINANCIAL
REVIEW
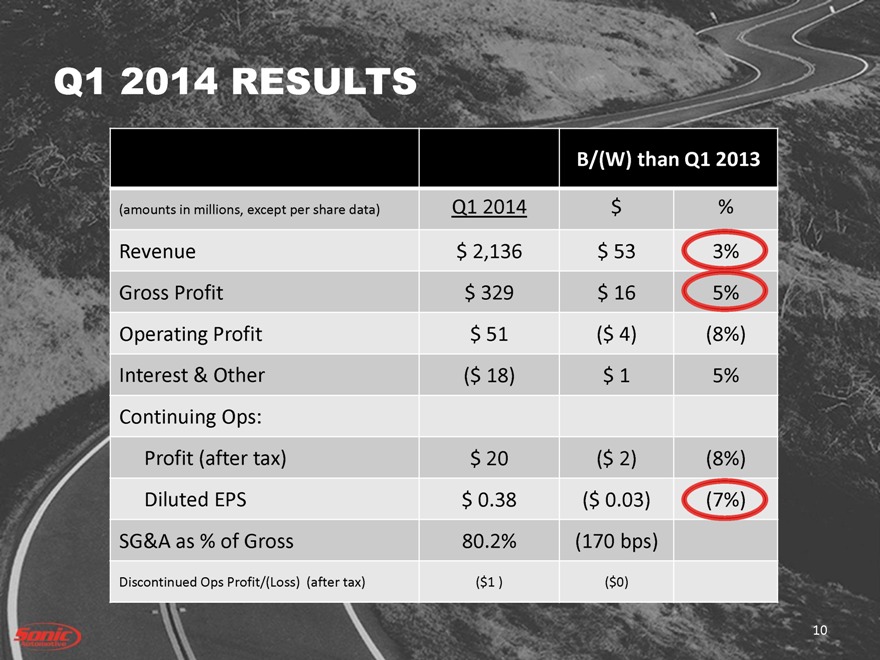
Q1 2014 RESULTS
B/(W) than Q1 2013
(amounts in millions, except per share data) Q1 2014 $ %
Revenue $ 2,136 $ 53 3%
Gross Profit $ 329 $ 16 5%
Operating Profit $ 51 ($ 4) (8%)
Interest & Other ($ 18) $ 1 5%
Continuing Ops:
Profit (after tax) $ 20 ($ 2) (8%)
Diluted EPS $ 0.38 ($ 0.03) (7%)
SG&A as % of Gross 80.2% (170 bps)
Discontinued Ops Profit/(Loss) (after tax) ($1 ) ($0)
10
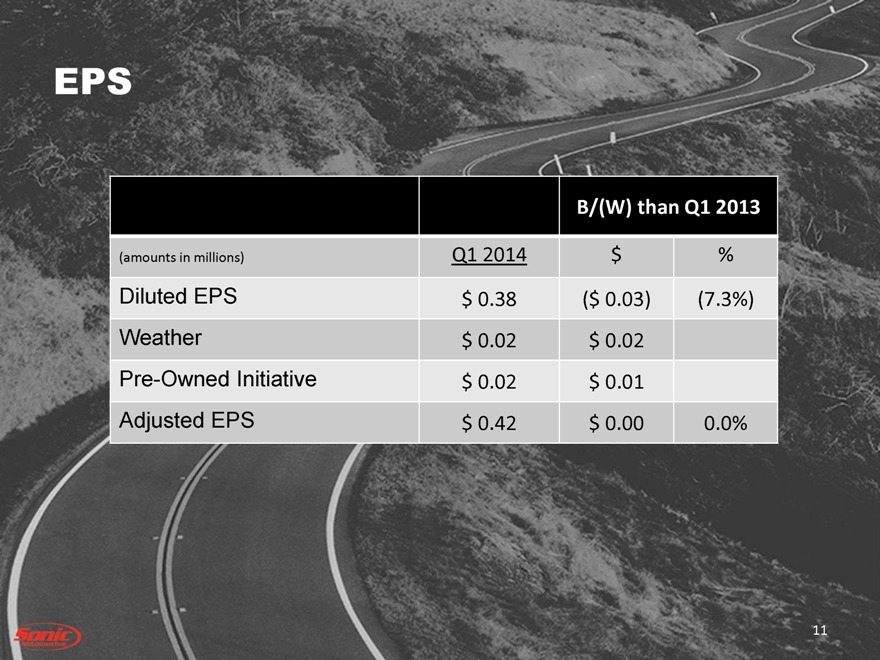
EPS
B/(W) than Q1 2013
(amounts in millions) Q1 2014 $ %
Diluted EPS $ 0.38 ($ 0.03) (7.3%)
Weather $ 0.02 $ 0.02
Pre-Owned Initiative $ 0.02 $ 0.01
Adjusted EPS $ 0.42 $ 0.00 0.0%
11
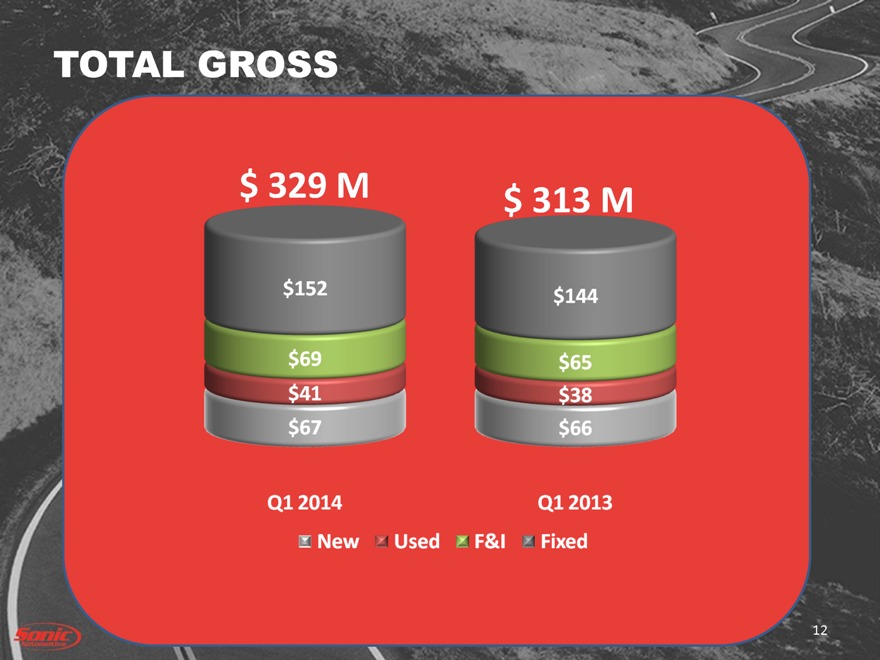
TOTAL GROSS
12
$ 329 M $ 313 M
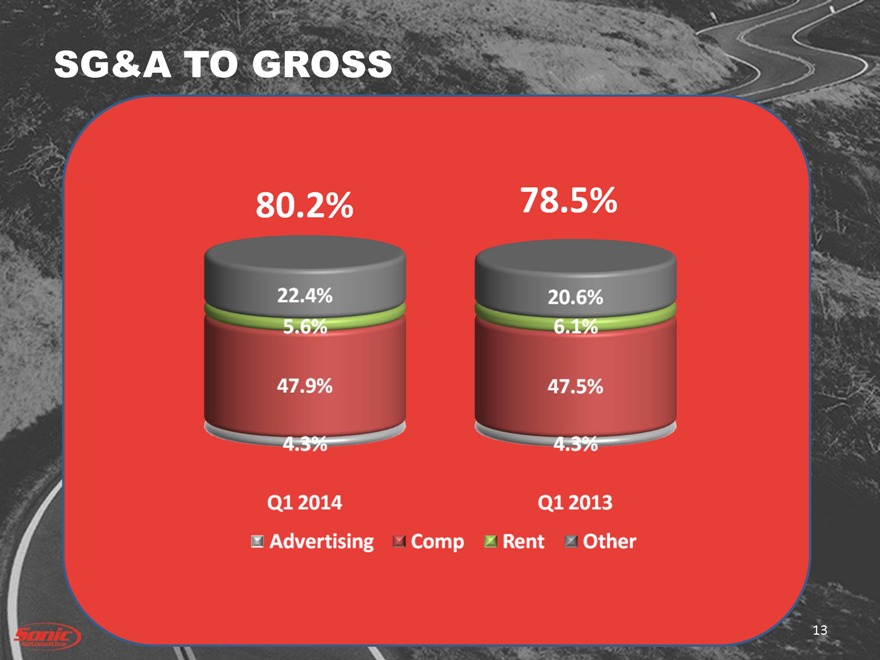
SG&A TO GROSS
13
80.2% 78.5%
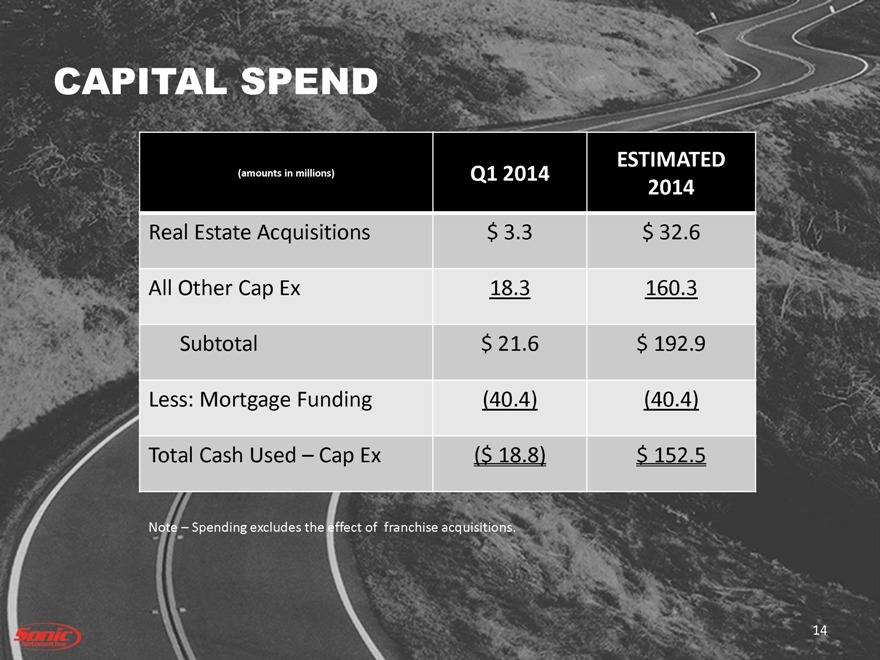
CAPITAL SPEND
(amounts in millions) Q1 2014
ESTIMATED
2014
Real Estate Acquisitions $ 3.3 $ 32.6
All Other Cap Ex 18.3 160.3
Subtotal $ 21.6 $ 192.9
Less: Mortgage Funding (40.4) (40.4)
Total Cash Used – Cap Ex ($ 18.8) $ 152.5
Note – Spending excludes the effect of franchise acquisitions.
14
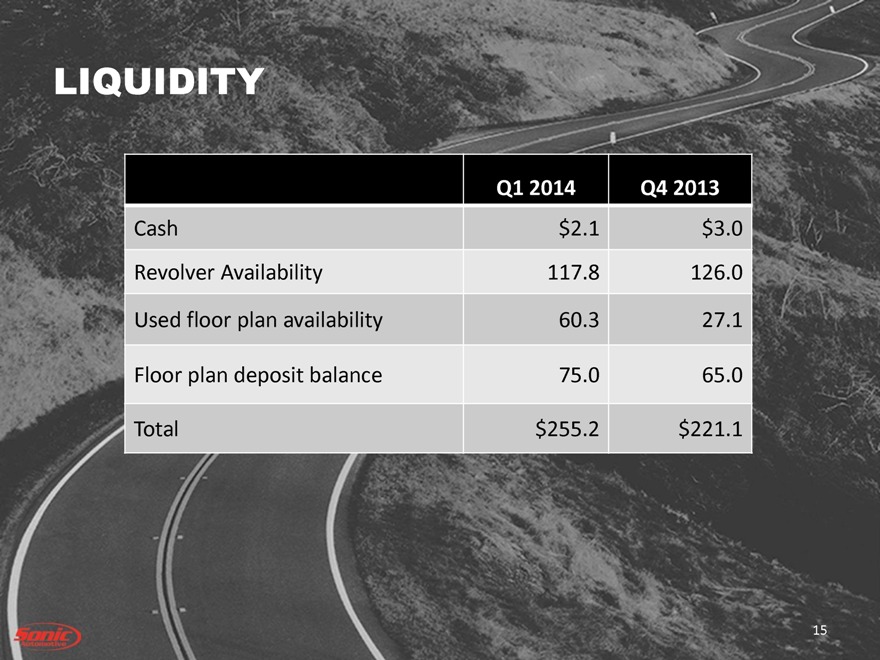
LIQUIDITY
Q1 2014 Q4 2013
Cash $2.1 $3.0
Revolver Availability 117.8 126.0
Used floor plan availability 60.3 27.1
Floor plan deposit balance 75.0 65.0
Total $255.2 $221.1
15
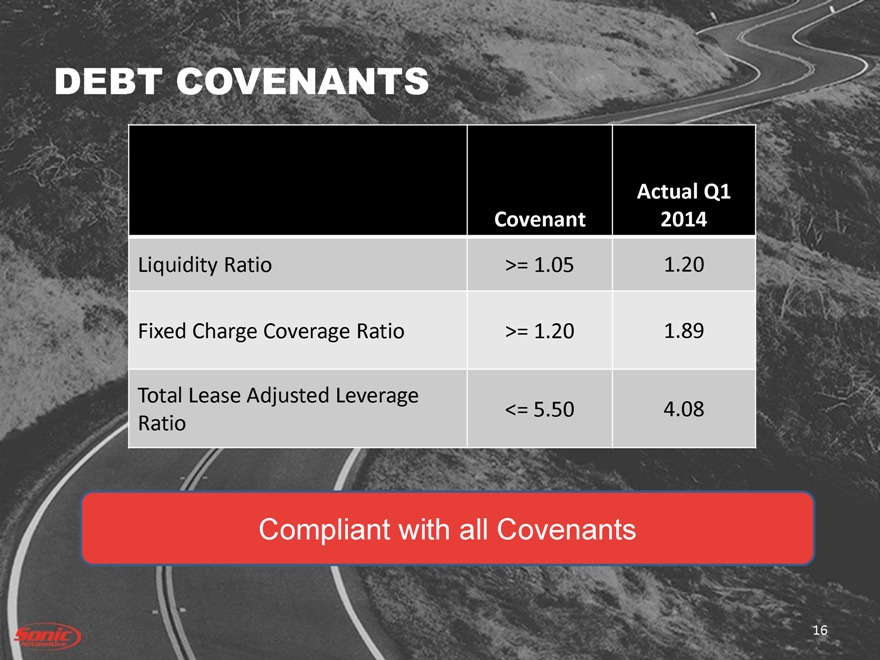
DEBT COVENANTS
Covenant
Actual Q1
2014
Liquidity Ratio >= 1.05 1.20
Fixed Charge Coverage Ratio >= 1.20 1.89
Total Lease Adjusted Leverage
Ratio
<= 5.50 4.08
Compliant with all Covenants
16
OPERATIONS
REVIEW
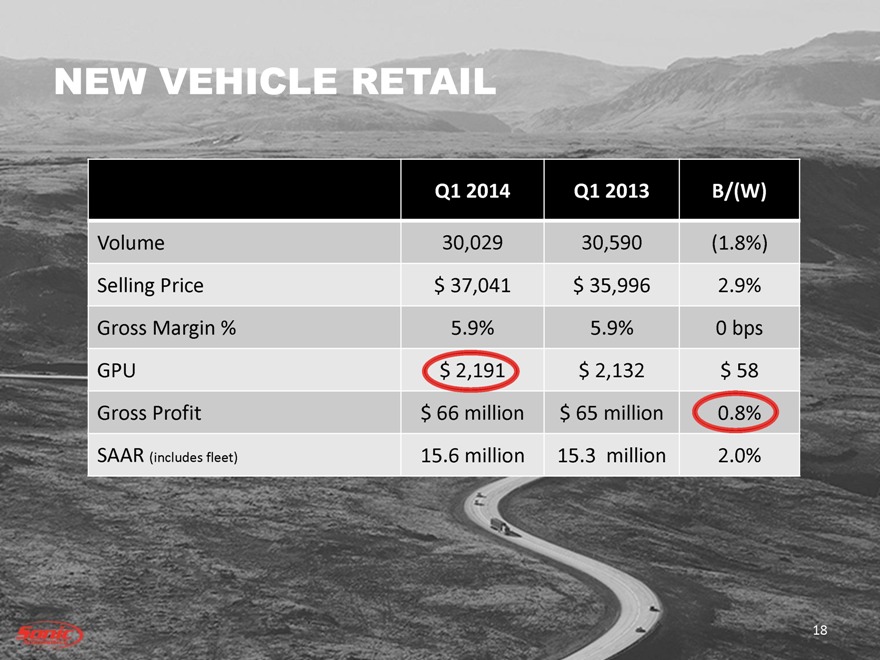
NEW VEHICLE RETAIL
Q1 2014 Q1 2013 B/(W)
Volume 30,029 30,590 (1.8%)
Selling Price $ 37,041 $ 35,996 2.9%
Gross Margin % 5.9% 5.9% 0 bps
GPU $ 2,191 $ 2,132 $ 58
Gross Profit $ 66 million $ 65 million 0.8%
SAAR (includes fleet) 15.6 million 15.3 million 2.0%
18
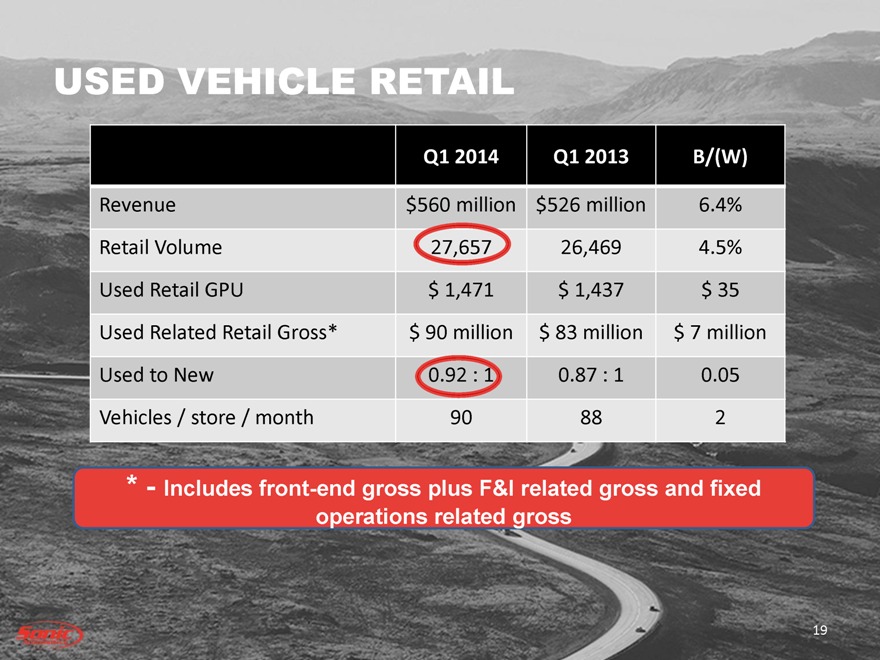
USED VEHICLE RETAIL
Q1 2014 Q1 2013 B/(W)
Revenue $560 million $526 million 6.4%
Retail Volume 27,657 26,469 4.5%
Used Retail GPU $ 1,471 $ 1,437 $ 35
Used Related Retail Gross* $ 90 million $ 83 million $ 7 million
Used to New 0.92 : 1 0.87 : 1 0.05
Vehicles / store / month 90 88 2
* - Includes front-end gross plus F&I related gross and fixed
operations related gross
19
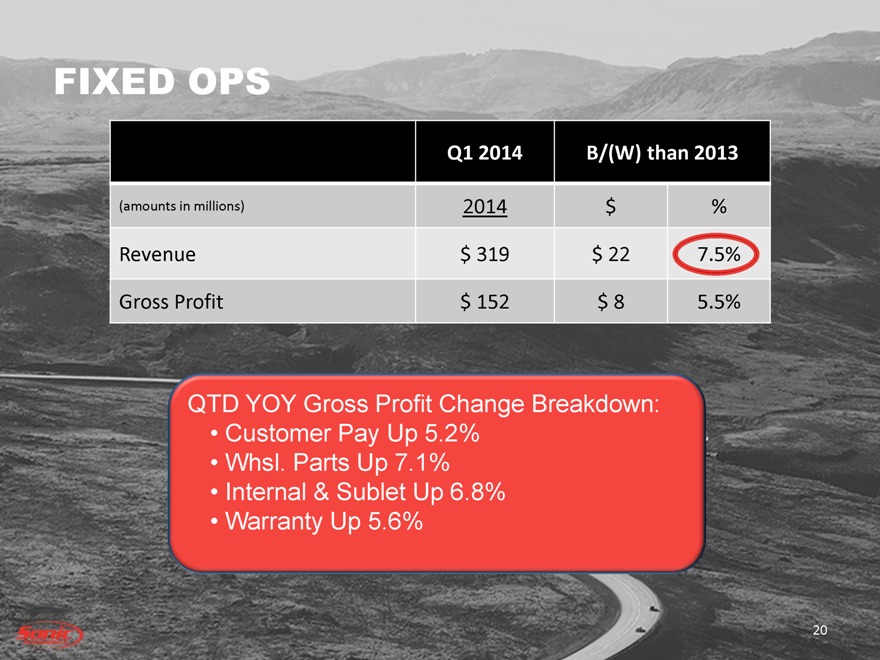
FIXED OPS
Q1 2014 B/(W) than 2013
(amounts in millions) 2014 $ %
Revenue $ 319 $ 22 7.5%
Gross Profit $ 152 $ 8 5.5%
QTD YOY Gross Profit Change Breakdown:
| • |
|
Customer Pay Up 5.2% |
| • |
|
Whsl. Parts Up 7.1% |
| • |
|
Internal & Sublet Up 6.8% |
| • |
|
Warranty Up 5.6% |
20
SUMMARY
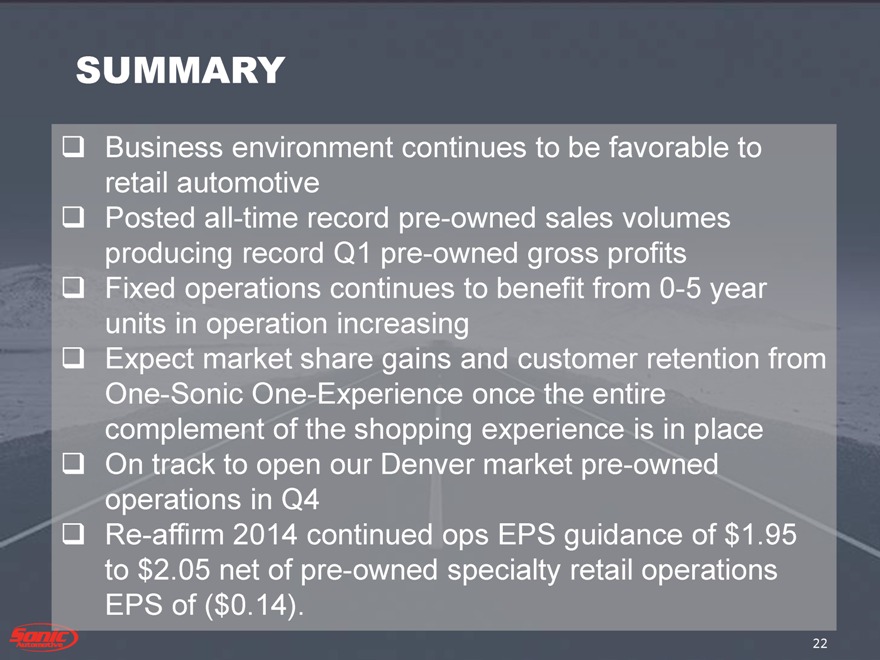
Business environment continues to be favorable to
retail automotive
Posted all-time record pre-owned sales volumes
producing record Q1 pre-owned gross profits
Fixed operations continues to benefit from 0-5 year
units in operation increasing
Expect market share gains and customer retention from
One-Sonic One-Experience once the entire
complement of the shopping experience is in place
On track to open our Denver market pre-owned
operations in Q4
Re-affirm 2014 continued ops EPS guidance of $1.95
to $2.05 net of pre-owned specialty retail operations
EPS of ($0.14).
SUMMARY
22