Attached files
| file | filename |
|---|---|
| 8-K - SHENANDOAH TELECOMMUNICATIONS COMPANY 8-K 4-22-2014 - SHENANDOAH TELECOMMUNICATIONS CO/VA/ | form8k.htm |
| EX-99.2 - EXHIBIT 99.2 - SHENANDOAH TELECOMMUNICATIONS CO/VA/ | ex99_2.htm |

April 22, 2014 2014 Shareholder Meeting Exhibit 99.1

* Safe Harbor Statement This presentation includes “forward-looking statements” within the meaning of Section 27A of the Securities Act and Section 21E of the Securities Exchange Act of 1934, as amended, regarding, among other things, our business strategy, our prospects and our financial position. These statements can be identified by the use of forward-looking terminology such as “believes,” “estimates,” “expects,” “intends,” “may,” “will,” “should,” “could,” or “anticipates” or the negative or other variation of these similar words, or by discussions of strategy or risks and uncertainties. These statements are based on current expectations of future events. If underlying assumptions prove inaccurate or unknown risks or uncertainties materialize, actual results could vary materially from the Company’s expectations and projections. Important factors that could cause actual results to differ materially from such forward-looking statements include, without limitation, risks related to the following: Increasing competition in the communications industry; and A complex and uncertain regulatory environment. A further list and description of these risks, uncertainties and other factors can be found in the Company’s SEC filings which are available online at www.sec.gov, www.shentel.com or on request from the Company. The Company does not undertake to update any forward-looking statements as a result of new information or future events or developments.

* Use of Non-GAAP Financial Measures Included in this presentation are certain non-GAAP financial measures that are not determined in accordance with US generally accepted accounting principles. These financial performance measures are not indicative of cash provided or used by operating activities and exclude the effects of certain operating, capital and financing costs and may differ from comparable information provided by other companies, and they should not be considered in isolation, as an alternative to, or more meaningful than measures of financial performance determined in accordance with US generally accepted accounting principles. These financial performance measures are commonly used in the industry and are presented because Shentel believes they provide relevant and useful information to investors. Shentel utilizes these financial performance measures to assess its ability to meet future capital expenditure and working capital requirements, to incur indebtedness if necessary, return investment to shareholders and to fund continued growth. Shentel also uses these financial performance measures to evaluate the performance of its businesses and for budget planning purposes.

Management Reports

* Record Financial Results 2012 Revenue Earnings per Share Dividend Net Income x x 2013

* Wireless Coverage

* Cable Markets
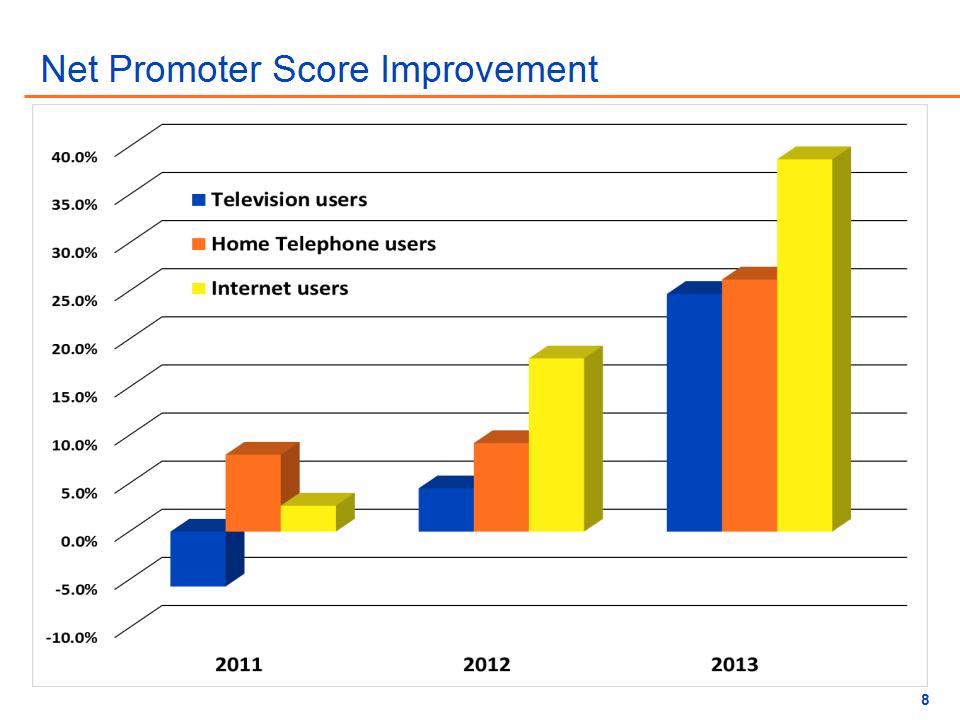
* Net Promoter Score Improvement
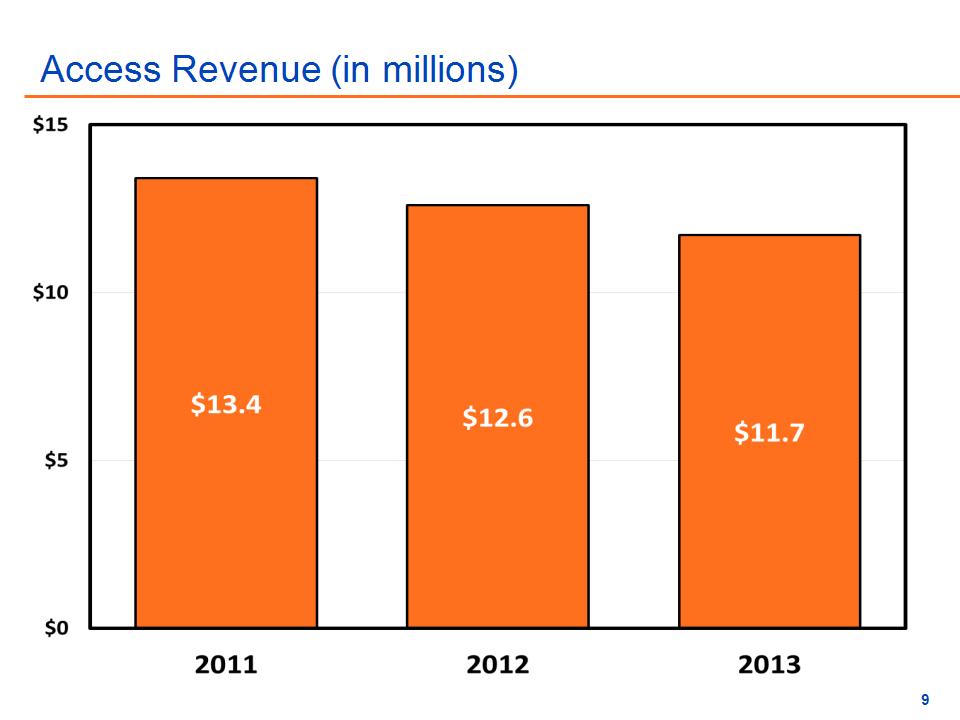
* Access Revenue (in millions)

* Percent of Households with Type of Telephone Source: Census Bureau

* Fiber Network
* Viacom

Competition * Voice/Internet Video Internet

* Associations
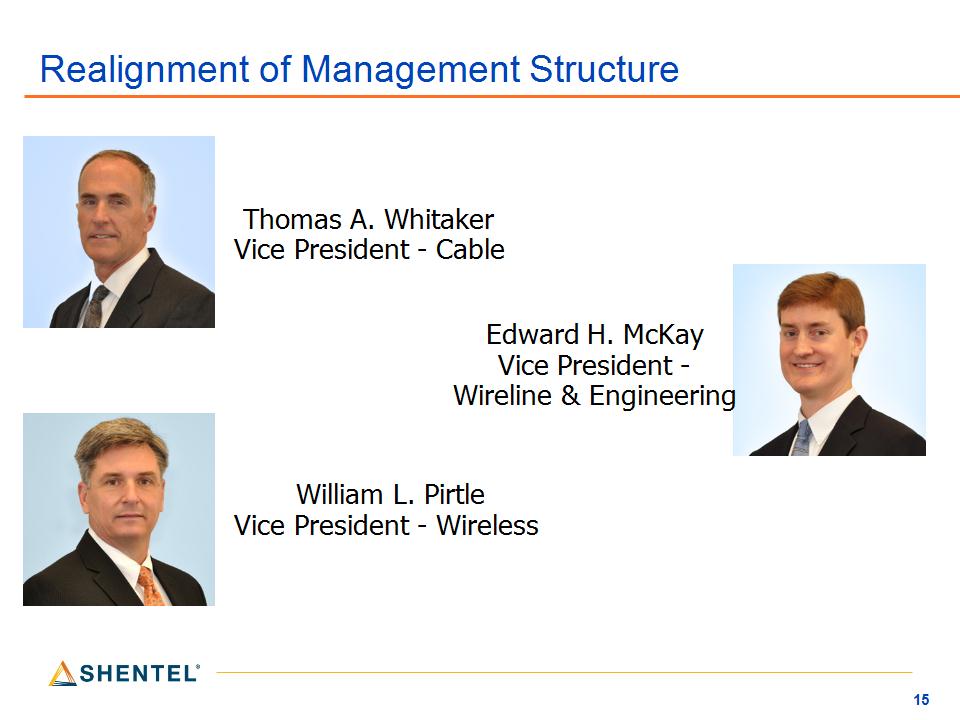
* Realignment of Management Structure Thomas A. Whitaker Vice President - Cable William L. Pirtle Vice President - Wireless Edward H. McKay Vice President - Wireline & Engineering
* Financial Reporting

* Stock Price (2012 – 2013)

* Earle MacKenzie EVP and COO
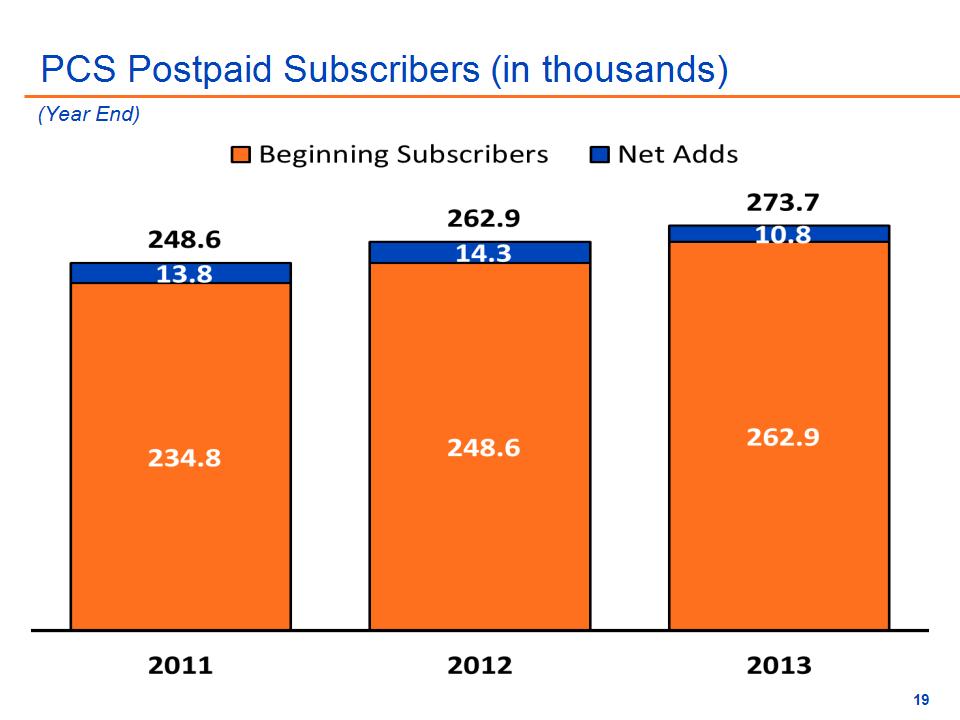
* PCS Postpaid Subscribers (in thousands) (Year End)

* PCS Postpaid Gross Billed Revenue per User

* PCS Prepaid Subscribers (in thousands) (Year End)

* PCS Prepaid Gross Billed Revenue per User

* How Does Shentel’s Wireless Compare? * Total Subs includes Wholesale Subscribers and Connected Device data plans. ** Adjusted for activity related to acquisitions and divestitures.

* Cable Revenue Generating Units (in thousands) (Year End)
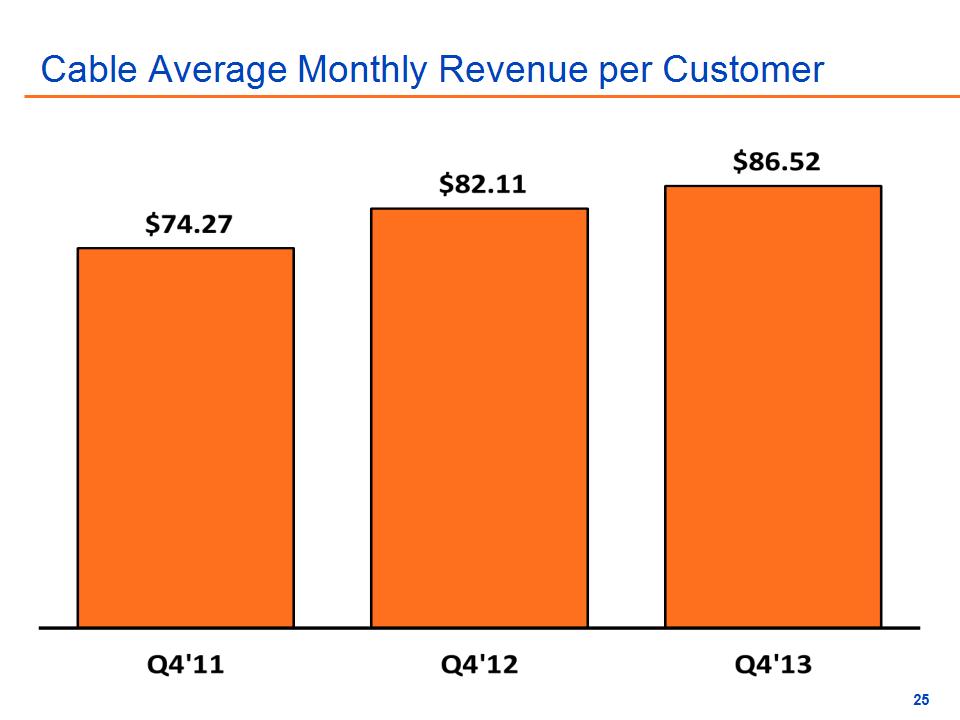
* Cable Average Monthly Revenue per Customer
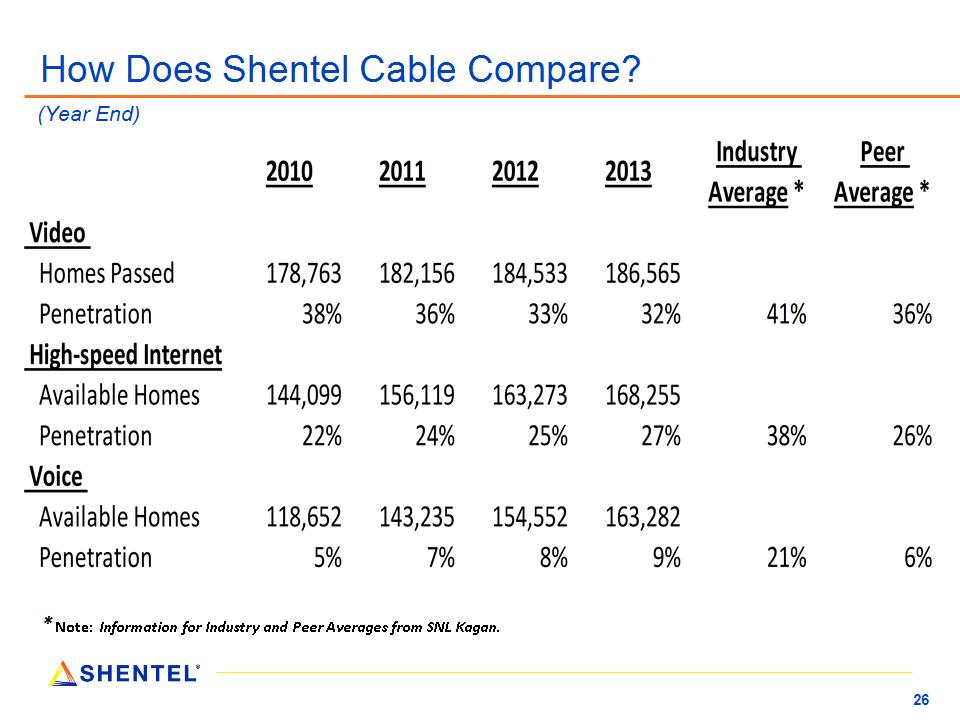
* How Does Shentel Cable Compare? * Note: Information for Industry and Peer Averages from SNL Kagan. (Year End)

* Wireline Customers (Year End)

* New Fiber Lease Contracts Signed (in millions)

* Major Upgrades Completed – CapEx Spending (in millions)

* Adele Skolits VP of Finance and CFO

* Consolidated Operating Revenues (in millions)

* Mix of Revenues
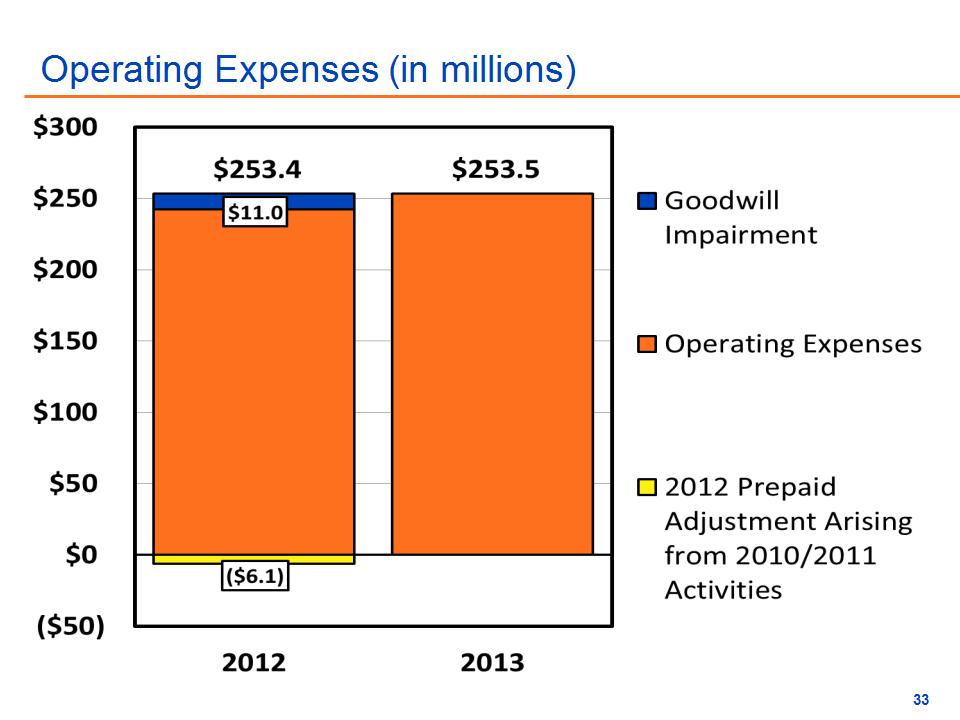
* Operating Expenses (in millions)
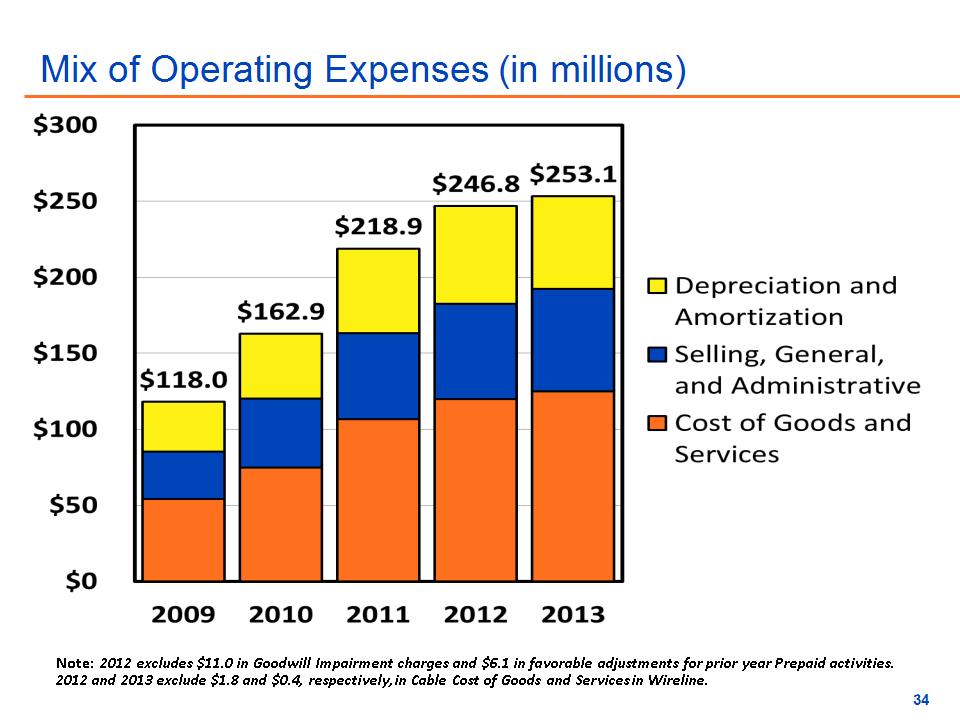
* Mix of Operating Expenses (in millions) Note: 2012 excludes $11.0 in Goodwill Impairment charges and $6.1 in favorable adjustments for prior year Prepaid activities. 2012 and 2013 exclude $1.8 and $0.4, respectively, in Cable Cost of Goods and Services in Wireline.
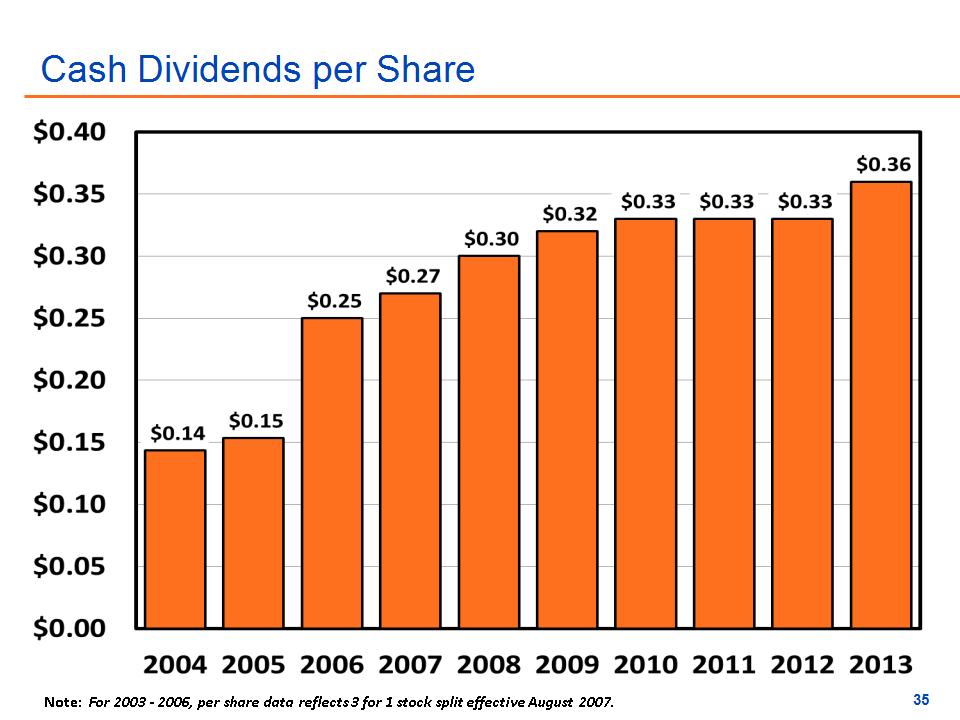
* Cash Dividends per Share Note: For 2003 – 2006, per share data reflects 3 for 1 stock split effective August 2007.

April 22, 2014 2014 Shareholder Meeting