Attached files
| file | filename |
|---|---|
| 8-K - 8-K - CIVISTA BANCSHARES, INC. | d712717d8k.htm |
Exhibit 99.1
2
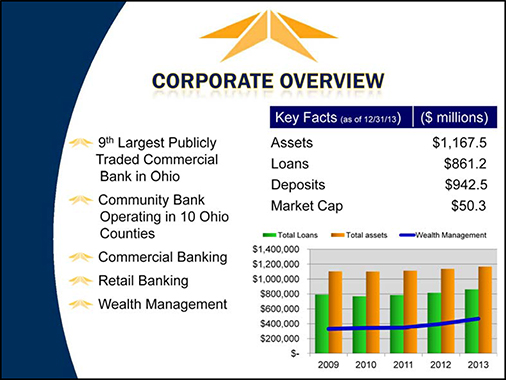
Corporate Overview
We are the 9th largest publicly traded commercial bank in the state of Ohio. We operate in 10 Ohio counties providing commercial and retail banking and wealth management.
3
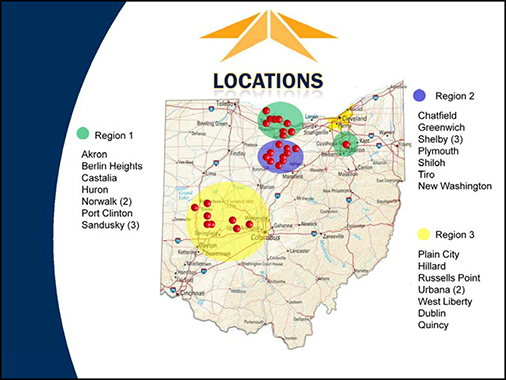
Locations
We view our operation in three regions. Region one is northern Ohio from Port Clinton to Akron. Region two is the Crawford and Richland county area. Region three is mid-Ohio from Urbana to Dublin.
4
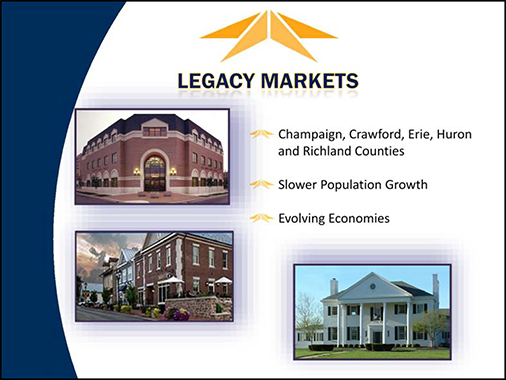
Legacy Markets
Within our regions we view ourselves as operating in legacy or defensive markets and growth, or offensive markets. Our legacy markets are the home town locations of Citizens and our acquisitions through the years. They would encompass Champaign, Crawford, Erie, Huron and Richland Counties. With the economic challenges over the last several years, we see slower economic and population growth. We view these markets as evolving economies. These markets are not what we remember growing up, they are changing and will probably take a generation to absorb the changes.
5
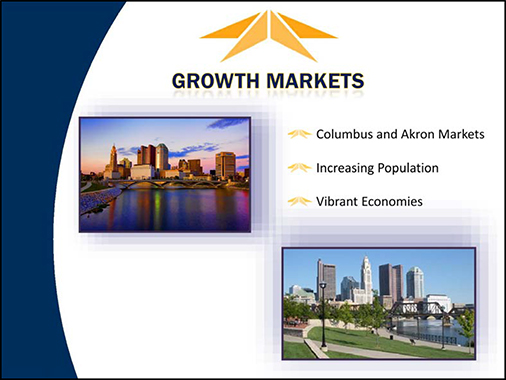
Growth Markets
Our Growth Markets are Columbus and Akron. These are areas of increasing population and vibrant economic growth. These areas weathered the recession and are coming back strong. They are the markets where we have made considerable investment in people. We have brought on experienced lenders with relationships and beefed up the infrastructure to support them.
6
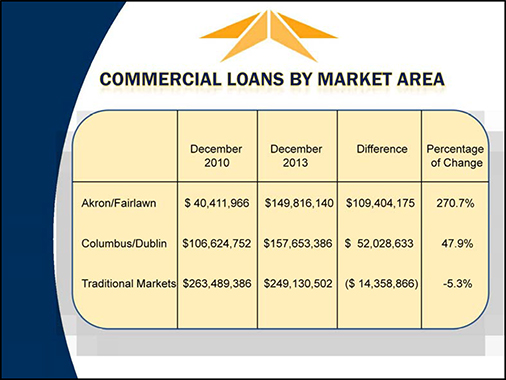
Commercial Loans by Market
You can see the results of our efforts in these more vibrant markets by the growth in commercial lending. Since the depth of the recession, we have enjoyed over $100,000,000 in commercial growth in the Akron market and over $50,000,000 in commercial growth in the Columbus markets. This is directly related to acquiring experienced, talented commercial lenders in these markets who were tired of the big bank atmosphere of previous employment and wanted to better serve their customers. Unfortunately, you can see what has happened in our legacy markets. We have a lot of customers, sizeable loan balances, but customers continue to make their payments and there is not much in the way of new opportunity to grow.
7
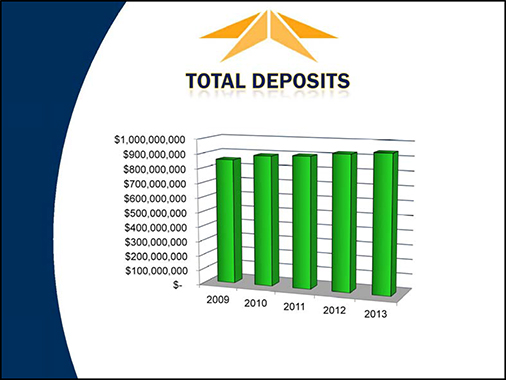
Total Deposits
As we always describe, our business is to gather deposits and make loans. At the end of the year our total deposits, our raw materials, were $920,000,000. There has been slow steady growth in the deposits since 2009 – in spite of the current interest rate environment. Our focus is on gathering core deposits. Checking accounts, interest checking and savings. While we offer certificates of deposit, we won’t chase rates.
8
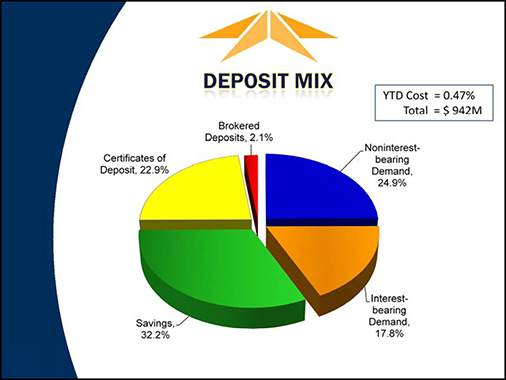
Deposit Mix
The results of our efforts can be seen in our deposit mix. Non-interest bearing demand, (plain old checking accounts), make up almost 25% of our deposit structure. Checking, interest checking, and savings – the lowest cost deposits – make up 75% of the mix. This is how we keep our interest costs low. These are also the type of accounts that won’t materially change as rates move up.
9
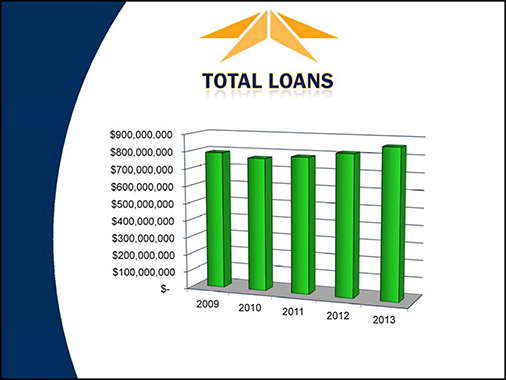
Total Loans
We gather deposits and make loans. At year end our loans totaled $861 million. This is up from a low of $767 million at the bottom of the recession. We have added almost $100 million net in three years, but also remember we receive approximately $15 million a month in payments that we must put to work. So over three years we have handled approximately $634 million in loan activity. This is approximately 73% of the portfolio and an important statistic we will talk about in later slides.
10
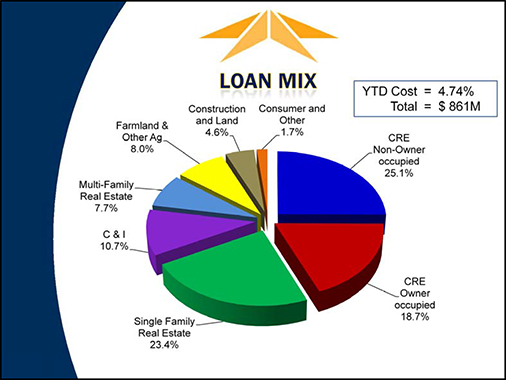
Loan Mix
If we look at our loan mix, it is real estate based. That’s our history and that is what we know. We have diversified with more Commercial and Industrial loans, but the bulk of our lending is real estate. Commercial Real Estate lending received bad press during the recession as values dropped and came under intense focus by the regulators. We have developed a robust process of evaluating our commercial real estate loans. By examining the types of businesses, properties, and locations, we can generate a high level evaluation our real estate lending risk.
11
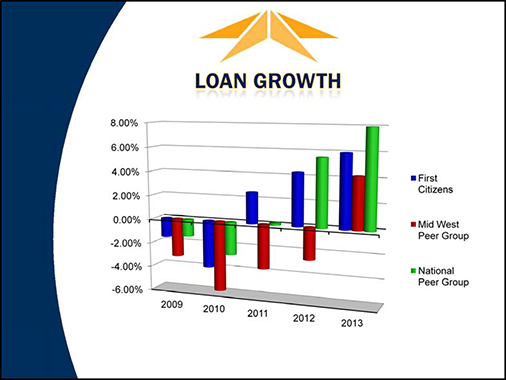
Loan Growth
Looking at First Citizens in comparison with national and Midwest peer statistics for loan growth, we have enjoyed better loan growth than our Midwest peers, but lag the national statistics. While the Ohio economy has steadily recovered, there are areas of the nation that have rebounded at a faster pace, creating greater loan opportunities.
12
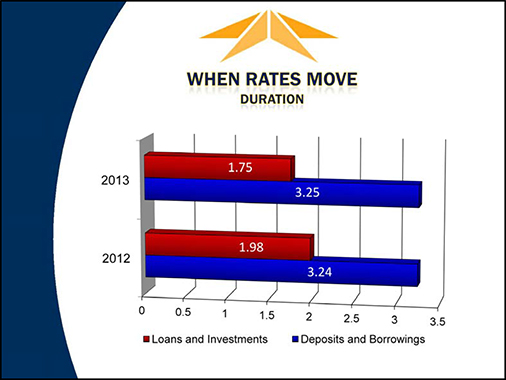
When Rates Move
The prime rate decreased to 3.25% in January 2008 and has not moved since. At some point rates will begin an upward trend. To protect the company from the risk of increasing rates, we actively manage our duration. The average duration of our loans and investments – that is, the average time for the opportunity to renegotiate or reprice a loan or investment is 1.75 years. If you recall the earlier slide that we turned over 73% of our loans from 2010 to 2013. This short duration will help protect the company by limiting rate risk when rates move. Likewise, the duration of our deposits and borrowings is over three years. When rates begin to move in earnest, we will be able to reprice our loans and investments quicker than the deposit and borrowing side – and increase our interest margin.
13
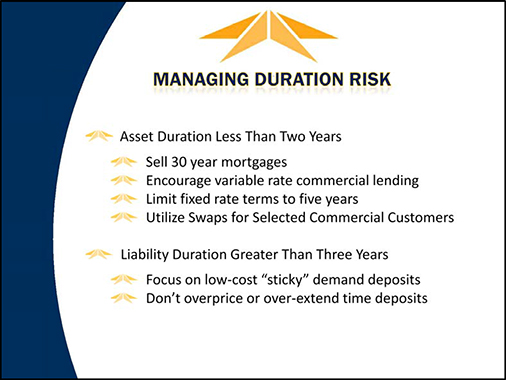
Managing Duration
We want to keep our asset duration less than two years. We will do this:
By selling 30 year mortgages.
By encouraging variable rate commercial lending.
By limiting fixed rate terms to five years.
By utilizing swaps for selected commercial customers.
At the same time we will try to keep liability duration longer than three years:
By focusing on low-cost “sticky” demand deposits.
By not overpricing or over-extending time deposits.
This will keep us positioned for rising rates.
14
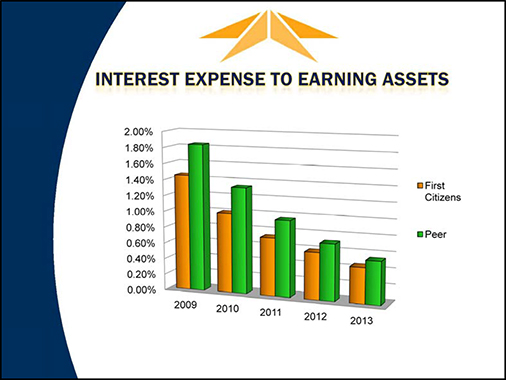
Interest Expense to Earning Assets
The cost of gathering deposits and other funding to put to work in loans and investments has always been less than our peers. Our focus on gathering deposits in less competitive rural markets and concentrating on checking and lower cost deposit accounts, results in an almost 10 basis point advantage over our peers in costs.
15
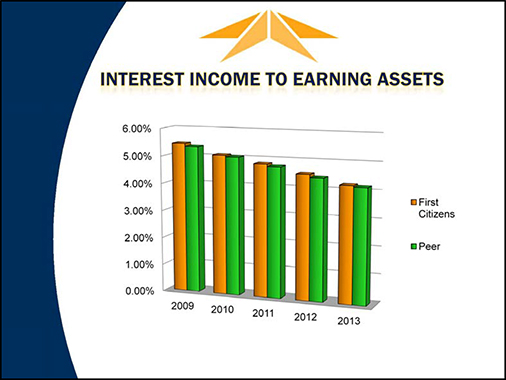
Interest Income to Earning Assets
When we put our dollars to work in loans and investments, we have historically been able to slightly outperform our peers. This comes from attention to loan rates and actively managing our investment portfolio to achieve the best return while managing the duration.
16
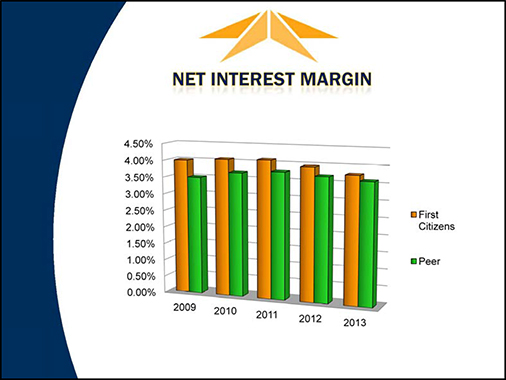
Net Interest Margin
Our resultant net interest margin has consistently outperformed our peers. The gap is narrowed by this low rate environment, but our process and focus works and the results are evident.
17
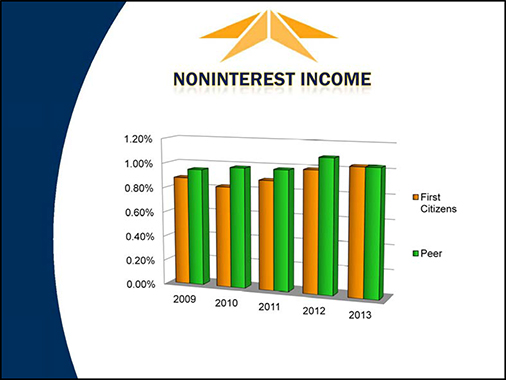
Noninterest Income
For a number of years our noninterest income was less than our peers. It was difficult to generate fee income in many of our rural markets. However, with more diversification into our more vibrant markets, increased contribution of our wealth management function, and other sources of noninterest revenue, we have been able to increase noninterest income from 19% of revenue to 23% of revenue since 2009.
18
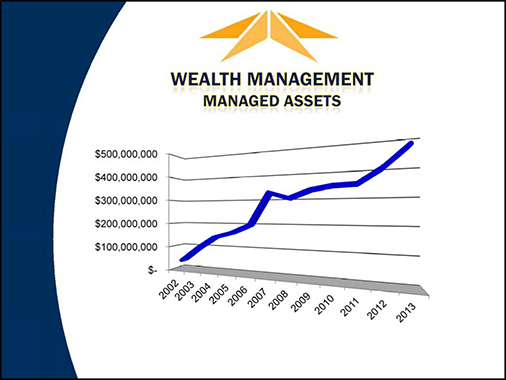
Wealth Management
We have been pleased at the growth in our wealth management function. We have surpassed $450 million in managed money which contributes approximately $2.7 million in revenue to noninterest income.
19
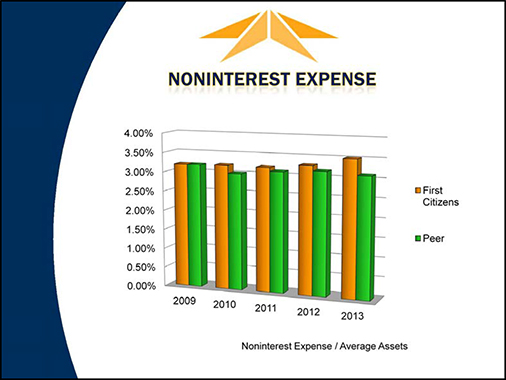
Noninterest expense
Our noninterest expense has traditionally been slightly higher than peer as a result of the number of offices we operate. However, the rural offices account for our strong interest margin which has historically justified the added expense. Recent increases in noninterest expense, relative to peer, is a result of the added production and support staff in our more vibrant markets. This has, in turn, contributed to the commercial loan growth displayed earlier. About 1⁄2 of the variance to peer for 2013 was the non-cash entry to recognize pension liability. While growth will take care of many of the expense issues, we are actively looking at opportunities to reduce expense.
20
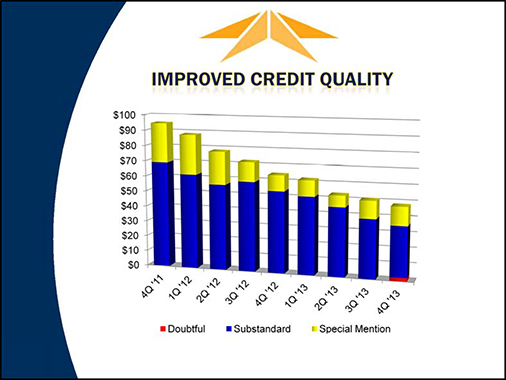
Improved Credit Quality
One issue from the last five years that has returned to normal has been challenged loans. You can see on this graph the continued decrease in the dollars classified as doubtful, sutstandard, and special mention.
21
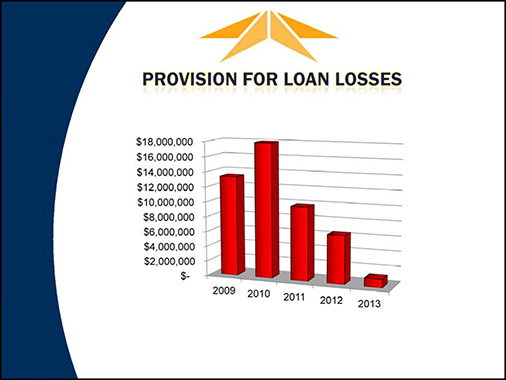
Provision for Loan Loss
Where the improved credit quality has paid off is in the dollars needed for the reserve for loan loss. You can see at the height of the recession we placed almost $18 million from earnings into the reserve. I am happy to report in 2013 we placed only $1.1million.
22
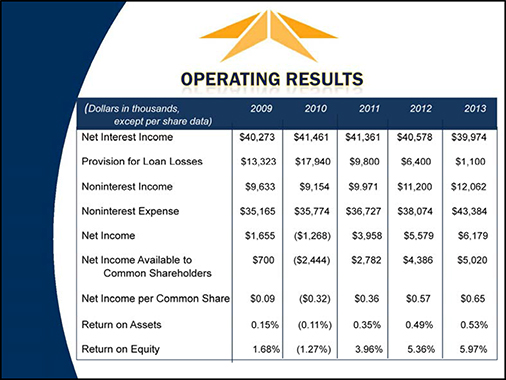
Operating Results
Here is the detail of our operating results for the last five years. This information is also in your annual report, but the main item I want to point out is the Net Interest Income, what we make by taking deposits and making loans and investments. Through this entire time period, in a recession, out of a recession, and in decreasing rates – our net interest income has not fluxuated more than 3 1⁄2 % during the entire time. This demonstrates that we have a chassis that can turn out consistent core earnings.
23
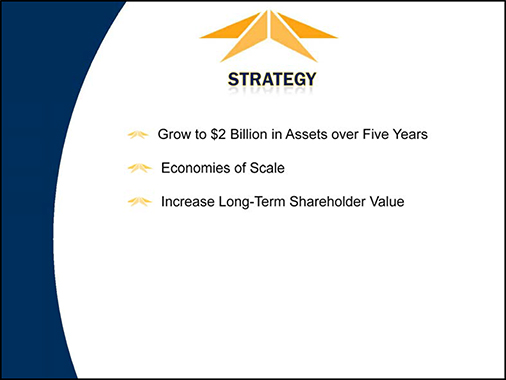
Strategy
You saw in the prior slide that we can consistently generate approximately $40 million in net interest income. To increase net interest income, we need to grow. Our goal is to grow the company to $2 billion in size. Increasing the size of the company will, of course, increase the net interest income. This would provide additional opportunity for non-interest income. But, importantly, the infrastructure we have built to accommodate customer service and compliance with regulation, can be spread over a larger company. We can grow without significant increases in fixed costs. This takes advantage of the economies of scale. We take advantage of the economies of scale and we, in turn, increase the long-term value of the shareholder.
24
Growth Opportunities
Organic
We have the capacity and are actively pursuing growth in all of our markets. In our legacy markets we are reaching out to who we don’t already have as a customer and we are working to provide more products to existing customers. In our growth markets we are pursuing selected potential customer opportunities.
Loan Production Offices
We want to open loan production offices in the more vibrant areas of the state. The key to this is finding established lenders to join our team. Anyone can hang their shingle in an active community, but you must have the relationship lender to make it work.
25

Growth Opportunities (cont.)
Smaller Rural Acquisitions
We continue to be interested in smaller rural acquisitions that will compliment our existing business and provide lending opportunity, but more importantly, sources of low-cost deposits.
Urban Acquisitions
There are many smaller institutions in urban areas that battle compliance costs, deposit competition, and are looking for partners. We see these institutions as a platform to expand lending in established locations while adding to scale.
26

Growth Opportunities (cont.)
Strategic Acquisitions
A strategic acquisition would be one of $500 million that would compliment our existing business and quickly bring us closer to the $2 billion goal that would leverage our infrastructure and increase profitability.
Growth is the key to increasing profitability and the franchise value of the company. We have a number of avenues to add growth, but, we cannot grow for growth’s sake. It has to be smart growth – growth at the right price.
27

28