Attached files
| file | filename |
|---|---|
| EX-99.1 - MEDIA RELEASE - IHS Inc. | exh991-482014.htm |
| 8-K - 8-K - IHS Inc. | a8k-investordayx482014.htm |

Supplemental Schedule 2014 Investor Day April 8, 2014 Exhibit 99.2

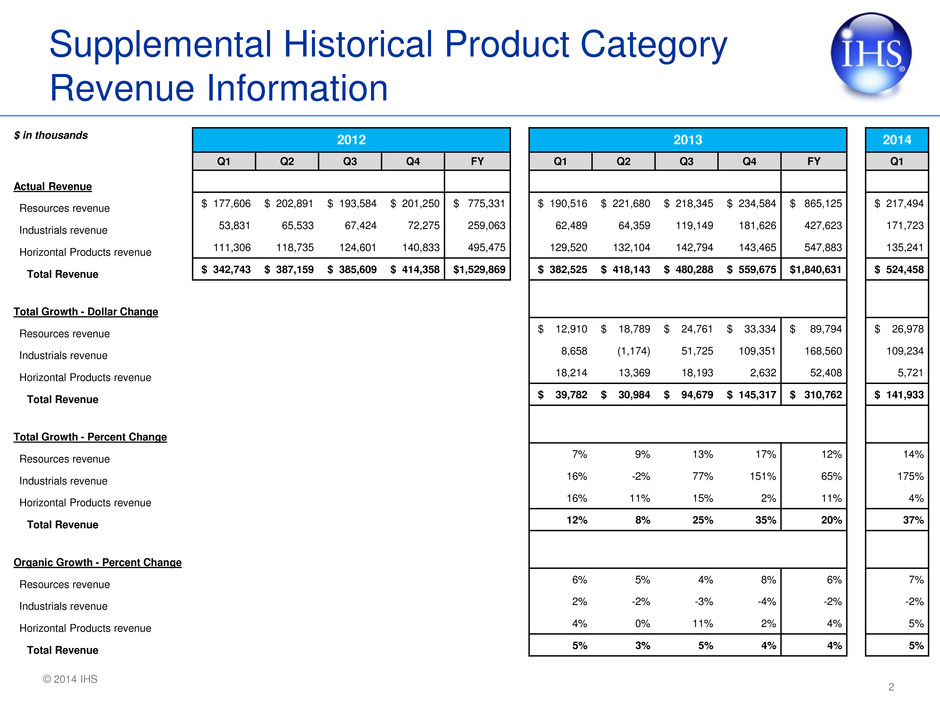
© 2014 IHS Supplemental Historical Product Category Revenue Information 2 $ in thousands 2012 2013 2014 Q1 Q2 Q3 Q4 FY Q1 Q2 Q3 Q4 FY Q1 Actual Revenue Resources revenue $ 177,606 $ 202,891 $ 193,584 $ 201,250 $ 775,331 $ 190,516 $ 221,680 $ 218,345 $ 234,584 $ 865,125 $ 217,494 Industrials revenue 53,831 65,533 67,424 72,275 259,063 62,489 64,359 119,149 181,626 427,623 171,723 Horizontal Products revenue 111,306 118,735 124,601 140,833 495,475 129,520 132,104 142,794 143,465 547,883 135,241 Total Revenue $ 342,743 $ 387,159 $ 385,609 $ 414,358 $1,529,869 $ 382,525 $ 418,143 $ 480,288 $ 559,675 $1,840,631 $ 524,458 Total Growth - Dollar Change Resources revenue $ 12,910 $ 18,789 $ 24,761 $ 33,334 $ 89,794 $ 26,978 Industrials revenue 8,658 (1,174) 51,725 109,351 168,560 109,234 Horizontal Products revenue 18,214 13,369 18,193 2,632 52,408 5,721 Total Revenue $ 39,782 $ 30,984 $ 94,679 $ 145,317 $ 310,762 $ 141,933 Total Growth - Percent Change Resources revenue 7% 9% 13% 17% 12% 14% Industrials revenue 16% -2% 77% 151% 65% 175% Horizontal Products revenue 16% 11% 15% 2% 11% 4% Total Revenue 12% 8% 25% 35% 20% 37% Organic Growth - Percent Change Resources revenue 6% 5% 4% 8% 6% 7% Industrials revenue 2% -2% -3% -4% -2% -2% Horizontal Products revenue 4% 0% 11% 2% 4% 5% Total Revenue 5% 3% 5% 4% 4% 5%
