Attached files
| file | filename |
|---|---|
| 8-K - 8-K - CAESARS HOLDINGS, INC. | d699504d8k.htm |
Exhibit 99.1
| A. | Executive summary |
Transaction overview
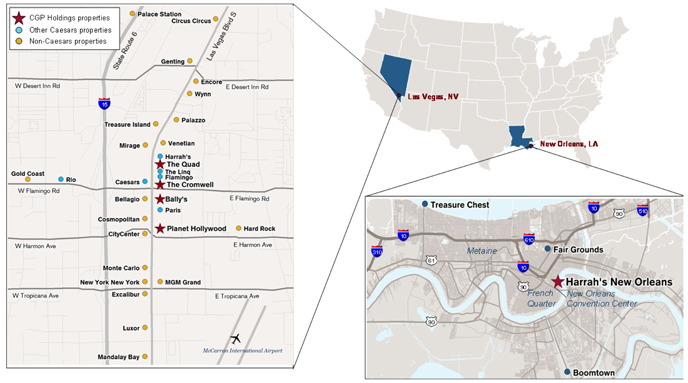
On March 3, 2014, Caesars Growth Partners, LLC (“CGP”), the indirect parent of Caesars Growth Properties Holdings, LLC (“CGPH” or the “Company”), announced that it had entered into a definitive agreement to acquire four casino properties (Bally’s Las Vegas, The Cromwell (formerly known as Bill’s Gamblin’ Hall & Saloon), The Quad (formerly known as The Imperial Palace) and Harrah’s New Orleans (collectively, the “Purchased Properties”) from Caesars Entertainment Operating Company, Inc. (“CEOC”), a subsidiary of Caesars Entertainment Corporation (“CEC”; NASDAQ: CZR). The total purchase price for the Purchased Properties is approximately $2.2 billion, which includes $185 million of assumed debt related to The Cromwell and planned capital expenditures of $223 million, resulting in cash consideration of approximately $1.8 billion. The definitive agreement was fully negotiated by and between a Special Committee of CEC Board of Directors (the “CEC Special Committee”) and a Special Committee of Caesars Acquisition Company’s (“CAC”) Board of Directors (the “CAC Special Committee”), each comprised solely of independent directors, and was recommended by both committees and approved by the Boards of Directors of CEC and CAC. The CEC Special Committee and the CAC Special Committee each was advised by its own legal and financial advisors. The CEC Special Committee, the CAC Special Committee and the Boards of Directors of CEC and CAC each received fairness opinions from firms with experience in valuation matters, which stated that, based upon and subject to (and in reliance on) the assumptions made, matters considered and limits of such review, in each case as set forth in the opinions, the purchase price was fair from a financial point of view to CEC and CGP, respectively.
Concurrently with the closing of the acquisition, CGP, which currently owns Planet Hollywood Resort & Casino (“PHW” or “Planet Hollywood” and, together with the Purchased Properties, the “Properties”), will contribute its equity ownership in Planet Hollywood, along with approximately $471 million of new cash equity (subject to fluctuations), into CGPH. The Cromwell will remain an unrestricted subsidiary outside of the credit. The acquisition of the Purchased Properties, as well as the refinancing of Planet Hollywood’s $485 million of existing CMBS debt, will be funded with $2.0 billion of debt financing that will be comprised of:
| • | $150 million First Lien Revolving Credit Facility (the “Revolver”) |
| • | $1,175 million First Lien Term Loan Facility (the “Term Loan”) |
| • | $675 million of Second Lien Notes (the “Notes”) |
Summary of the credit facilities
| Revolver |
Term Loan | |||
| Amount: |
$150 million | $1,175 million | ||
| Pricing: |
TBD | TBD | ||
| LIBOR floor: |
TBD | TBD | ||
| Upfront fee / issue price: |
TBD | TBD | ||
| Tenor: |
5 years | 7 years |
Company overview
The parent of CGPH, Caesars Growth Partners, LLC, is a casino asset and entertainment company focused on acquiring and developing a portfolio of high-growth operating assets and equity and debt investments in the gaming and interactive entertainment industries. CGP is a joint venture between Caesars Acquisition Company (NASDAQ: CACQ), which owns a 42% economic interest (and 100% of the voting interest) in CGP. Two subsidiaries of Caesars Entertainment Corporation own a 58% economic interest (and 0% of the voting interest) in CGP. As of 3/25/14, CAC had a public equity market value of $2.2 billion, which implies a total equity value of $5.2 billion for CGP. CAC was formed to make an equity investment in CGP. CAC has a separate board of directors from Caesars Entertainment Corporation. In FY 2013, the Company generated revenue and an estimated range of projected run-rate adjusted EBITDA (incl. development projects) – Pro forma of $1,039 million and $287 million – $320 million(1), respectively.
| (1) | Includes pro forma adjustments for Bally’s South Tower renovation, CGPH’s share of unrealized property-level cost savings and unallocated corporate cost savings and expenses, the Grand Bazaar lease, Harrah’s New Orleans resort fees, end of construction disruption related to the Linq and The Quad renovation and the impact of The Quad’s full renovation, less CEOC’s 50% share of anticipated management fees. See pages 29-33 for details of pro forma adjustments. |
| B. | Sources & uses |
($ in millions)
| (1) | Capacity of $150 million, undrawn at close. |
| (2) | Completion funds balance as of 3/21/14. |
| (3) | Includes $471 million (subject to fluctuation) of new cash equity from Caesars Growth Partners and $157 million of cash that was previously held at Planet Hollywood. |
| C. | Capitalization and credit statistics(1) |
| ($ in millions) | ||||||||||||
| As of December 31, 2013 | ||||||||||||
| Actual | Adjustments | Adjusted | ||||||||||
| Capitalization |
||||||||||||
| Cash (incl. cage cash) |
$ | 40 | — | $ | 40 | |||||||
| Pre-funded Quad capex |
— | 100 | 100 | |||||||||
| Existing Planet Hollywood debt |
$ | 485 | ($ | 485 | ) | — | ||||||
| New revolver (2) |
— | — | — | |||||||||
| New first lien term loan (3) |
— | 1,175 | 1,175 | |||||||||
|
|
|
|
|
|
|
|||||||
| Total first lien debt |
$ | 485 | $ | 690 | $ | 1,175 | ||||||
| New second lien notes |
— | 675 | 675 | |||||||||
|
|
|
|
|
|
|
|||||||
| Total debt |
$ | 485 | $ | 1,365 | $ | 1,850 | ||||||
| Operating statistics |
||||||||||||
| FY 2013 Estimated range of projected run-rate adjusted EBITDAM (incl. development projects) - Pro forma |
$ | 311 - $345 | ||||||||||
| FY 2013 Estimated range of projected run-rate adjusted EBITDA (incl. development projects) - Pro forma |
287 - 320 | |||||||||||
| Net cash interest expense |
144 | |||||||||||
| Maintenance capex |
32 | |||||||||||
| Credit statistics (4) |
||||||||||||
| Net first lien debt / Adj. EBITDAM |
3.3x - 3.7x | |||||||||||
| Net total debt / Adj. EBITDAM |
5.3x - 5.8 x | |||||||||||
| Adj. EBITDAM / Net cash interest expense |
2.2x - 2.4x | |||||||||||
| (Adj. EBITDAM - capex) / Net cash interest expense |
1.9x - 2.2x | |||||||||||
|
|
|
|||||||||||
| Net first lien debt / Adj. EBITDA |
3.5x - 3.9x | |||||||||||
| Net total debt / Adj. EBITDA |
5.7x - 6.3x | |||||||||||
| Adj. EBITDA / Net cash interest expense |
2.0x - 2.2x | |||||||||||
| (Adj. EBITDA - capex) / Net cash interest expense |
1.8x - 2.0x | |||||||||||
|
|
|
|||||||||||
Note: See pages 29-33 for detail on adjusted EBITDA adjustments and page 75 for a reconciliation of net income to adjusted EBITDA.
| (1) | Excludes The Cromwell. |
| (2) | Capacity of $150 million, undrawn at close. |
| (3) | LIBOR floor of 1%. |
| (4) | References to Adjusted EBITDAM and Adjusted EBITDA below are to the estimated range of projected run-rate adjusted EBITDAM (incl. development projects) - Pro forma and the estimated range of projected run-rate adjusted EBITDA (incl. development projects) - Pro forma, respectively. |
| D. | Reconciliation to estimated projected run-rate adjusted EBITDA – Pro forma |
The projections included below are based on current estimates of the Company, but they involve risks, uncertainties, assumptions and other factors that may cause actual results, performance or achievements of the Company to be materially different from any future results, performance or achievements expressed or implied by the projections. These projections reflect Management’s estimated range of projected run-rate adjusted EBITDA – pro forma once the projects described below are open or fully implemented and operated at a steady state, which may not occur until 12 to 24 months after the projects are completed and operations at each respective property commence. Prospective financial information is necessarily speculative in nature, and it can be expected that some or all of the assumptions of the information described below may not materialize or will vary significantly from actual results. The Company undertakes no obligation to update publicly any forward-looking statement for any reason after the date of this document to conform these statements to actual results or to changes to its expectations.
($ in millions)
| Combined FY 2013 | ||||
| Adjusted EBITDA (1) | $249 | |||
| Plus: Planet Hollywood historical management fees (2) | 18 | |||
| Plus: Cromwell 2013A EBITDA (3) | 1 | |||
|
| ||||
| Adjusted EBITDAM |
$267 | |||
| Pro forma EBITDAM adjustments | ||||

|
Plus: PF adj. for the full year benefit from Bally’s South Tower renovation |
$6 | ||

|
Plus: PF adj. for CGPH property-level cost savings yet to be realized |
3 | ||

|
Plus: PF adj. for lease payments received for the Grand Bazaar |
3 | ||
|
| ||||
| Adjusted EBITDAM - Pro forma |
$279 | |||
| Estimated range for projected run-rate EBITDAM adjustments | ||||

|
Less: CGPH’s share of unallocated corporate expenses, net of cost savings |
($6) - ($13) | ||

|
Plus: Implementation of Harrah’s New Orleans resort fees |
0 - 1 | ||
|
| ||||
| Estimated range of projected run-rate adjusted EBITDAM - Pro forma |
$266 - $273 | |||
| Estimated range for development project run-rate EBITDAM adjustments |
||||

|
Plus: End of construction disruption related to the Linq and The Quad renovation |
$14 - $25 | ||

|
Plus: Impact of The Quad’s full renovation |
31 - 47 | ||
|
| ||||
| Estimated range of projected run-rate adjusted EBITDAM (incl. development project) - Pro forma |
$311 - $345 | |||
| Less: CEOC’s 50% share of management fees (proposed) (4) | (23) - (24) | |||
|
| ||||
| Estimated range of projected run-rate adjusted EBITDA (incl. development project) - Pro forma |
$287 - $320 | |||
|
| ||||
| (1) | Refer to page 75 for reconciliation of net income to Adjusted EBITDA. |
| (2) | Historical management fees paid by Planet Hollywood to CEOC during FY 2013. |
| (3) | The Cromwell is an unrestricted subsidiary outside of the credit group. |
| (4) | CGP’s 50% of management fees will remain in the credit group. |
|
|
|
|
|
|
| (1) | The rent commencement date is the earlier of the opening date or February 28, 2015. The Company expects the opening date will occur in late 2014. |
| (2) | Subject to increases based on CPI beginning the sixth year after opening. |

|
CGPH’s share of unallocated corporate expenses, net of cost savings(1) | |||||
| (1) | Previously unallocated corporate cost savings and expenses will become allocated upon the implementation of ServicesCo, which is subject to regulatory approval and the review and approval of the CEC and CAC Special Committees. |

|
Harrah’s New Orleans resort fees |
|
|
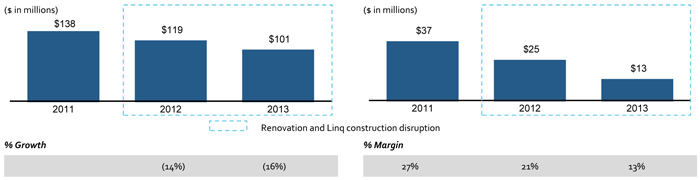
Impact of Linq construction and The Quad renovation disruptions |
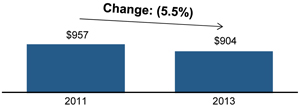
| Comparable LV CZR properties(1) – net revenue |
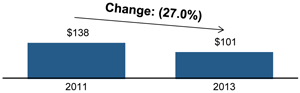
The Quad – net revenue | |
| ($ in millions) | ($ in millions) | |
|
| |
| (1) | Includes Harrah’s Las Vegas, Flamingo Las Vegas and Bally’s Las Vegas. |
From 2011 to 2013, The Quad experienced a 27% decline in net revenue. During the same timeframe, comparable Las Vegas CZR properties experienced a 5.5% decrease in net revenue. Caesars management attributes the decline in The Quad’s net revenue during this timeframe to disruption related to CEOC’s $90 million renovation of The Quad and construction of the Linq project (which encompassed The Quad gaming floor as well as areas directly adjacent to The Quad).
CGPH estimates the negative revenue impact of Linq construction and The Quad renovation disruption was $26 million – $33 million in FY 2013. Assuming 55% - 75% of net revenue flow through to Adjusted EBITDAM, CGPH estimates the Adjusted EBITDAM impact of Linq disruption was $14 million - $25 million in FY 2013.
Impact of Linq construction and The Quad renovation disruptions
| ($ in millions) | ||||||||||||
| Net revenue % decline 2011 to 2013 |
||||||||||||
| Las Vegas CZR comparable properties (1) |
(5.5 | %) | ||||||||||
| The Quad |
(27.0 | %) | ||||||||||
|
|
|
|||||||||||
| The Quad’s estimated % net revenue decline due to construction disruption |
(21.4 | %) | ||||||||||
| The Quad 2011 net revenue |
$ | 138 | ||||||||||
| (x) The Quad’s estimated net revenue decline due to construction disruption |
19 | % | — | 24 | % | |||||||
|
|
|
|
|
|
|
|||||||
| Net revenue impact from construction disruption |
$ | 26 | — | $ | 33 | |||||||
| (x) % Flowthrough |
55 | % | — | 75 | % | |||||||
|
|
|
|
|
|
|
|||||||
| Adjusted EBITDAM impact of disruption |
$ | 14 | — | $ | 25 | |||||||
|
|
|
|
|
|
|
|||||||
| (1) | Includes Harrah’s Las Vegas, Flamingo Las Vegas and Bally’s Las Vegas. |
 Impact of The Quad’s full renovation
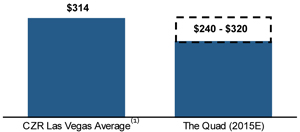
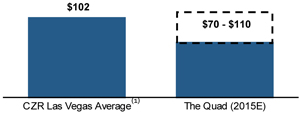
Renovation Adjusted EBITDAM uplift (2)
($ in millions, except WPD and cash ADR)
| Weighted average slot and table WPD | ||||||||||||||||||||||||
| $240 | $260 | $280 | $300 | $320 | ||||||||||||||||||||
| $ | 70 | $ | 31 | $ | 33 | $ | 35 | $ | 37 | $ | 39 | |||||||||||||
| 80 | 33 | 35 | 37 | 39 | 41 | |||||||||||||||||||
| Cash ADR | 90 | 35 | 37 | 39 | 41 | 43 | ||||||||||||||||||
| 100 | 36 | 39 | 41 | 43 | 45 | |||||||||||||||||||
| 110 | 38 | 41 | 43 | 45 | 47 | |||||||||||||||||||
| (1) | CZR Las Vegas average from CZR 2013 10-K. |
| (2) | Based on The Quad 2011 Adjusted EBITDAM margin of 27%. |
| E. | Summary of CGPH historical financials (including The Cromwell f.k.a. Bill’s Gamblin’ Hall & Saloon)(1) |
| Net revenue |
Adj. EBITDA | |
| ($ in millions) | ($ in millions) | |
|
|
|
| (1) | The Cromwell is an unrestricted subsidiary, outside of the credit. |
| F. | Summary corporate structure |
Corporate structure chart
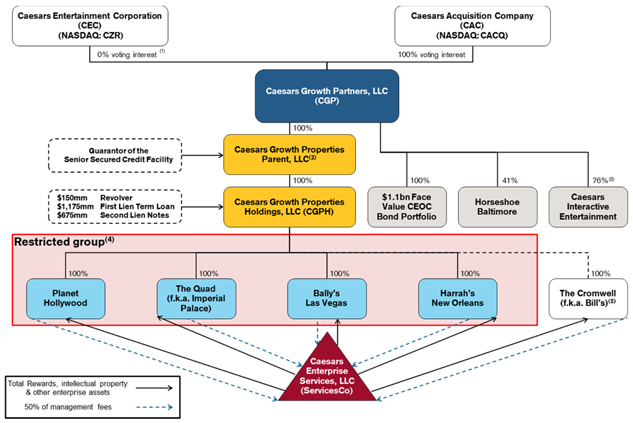
| Note: | Assumes (a) management agreements moved to ServicesCo, (b) management fee will go from ServicesCo to CEOC and (c) implementation of ServicesCo, which is subject to regulatory approval and the approval of the CEC and CAC Special Committees. |
| (1) | Caesars Entertainment Corp indirectly holds a 58% economic interest in Caesars Growth Partners and 100% of the non-voting interest. |
| (2) | Caesars Growth Properties Parent, LLC is a guarantor of the Senior Secured Credit Facility but not a guarantor of the Second Lien Notes. |
| (3) | Represents fully-diluted ownership as of 12/31/13. |
| (4) | Simplified structure chart does not reflect the intermediate holding companies for each casino property. |
| (5) | As a qualified non-recourse subsidiary, The Cromwell (i) will not guarantee the Senior Secured Credit Facilities or the Senior Lien Notes and will not provide any portion of the collateral securing the Senior Secured Credit Facilities or the Second Lien Notes, (ii) has no obligation to pay any amounts due pursuant to the Senior Secured Credit Facilities or the Second Lien Notes and (iii) will not be subject to any of the restrictive covenants in the Credit Agreement or the indenture governing the Notes. In addition, as of December 31, 2013, The Cromwell had approximately $185 million of outstanding secured indebtedness under the Credit Agreement, dated as of November 2, 2012, among The Cromwell and certain other parties thereto, all of which ranks senior to the Senior Secured Credit Facilities and the Second Lien Notes. |
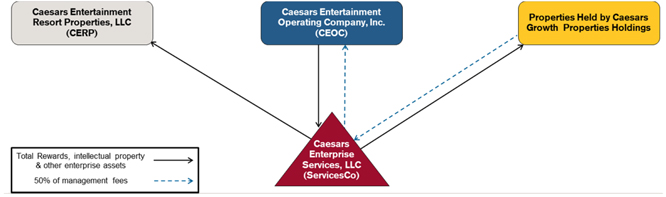
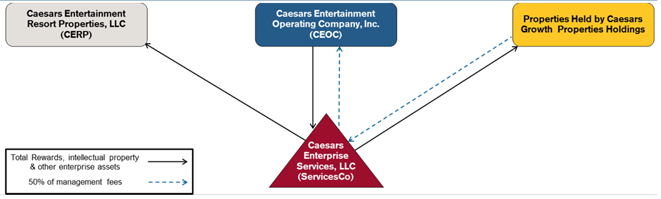
Caesars Enterprise Services, LLC
In connection with the transaction, Caesars Entertainment Operating Company, Inc., Caesars Entertainment Resort Properties, LLC and Caesars Growth Properties Holdings, LLC have agreed to use reasonable best efforts to establish a new services joint venture known as Caesars Enterprise Services, LLC (“ServicesCo”). The purpose of ServicesCo, subject to the review and approval of the special committees of CAC and Caesars Entertainment Corporation, is to provide certain centralized services to CEOC, CERP and CGPH, including but not limited to common management of the enterprise-wide intellectual property, which will be provided per a Shared Services Agreement by ServicesCo to each of the three entities, along with shared services operations across the portfolio of properties owned by CEOC, CERP, CGPH and their respective subsidiaries. The implementation of ServicesCo is subject to regulatory approval.
ServicesCo organizational chart
| I. | Recent developments |
Acquisition transaction
On March 21, 2014, CAC, CGP, CEC and its subsidiaries CEOC and CERP, a wholly-owned subsidiary of CEC, received a letter (the “Letter”) from a law firm acting on behalf of unnamed clients who claim to hold Second-Priority Secured Notes of CEOC, alleging, among other things, that CEOC is insolvent and that CEOC’s owners improperly transferred or seek to transfer valuable assets of CEOC to affiliated entities in connection with: (a) the transaction agreement dated October 21, 2013 by and among CEC, certain subsidiaries of CEC and CEOC, CAC and CGP, which, among other things, provide for the asset transfers from subsidiaries of CEOC to CGP of the Planet Hollywood casino and interests in Horseshoe Baltimore that was consummated in 2013 (the “2013 CGP Transaction”); (b) the transfer by CEOC to CERP of Octavius Tower and Project Linq that was consummated in 2013; and (c) the contemplated transfers by CEOC to CGP of the Properties (the “Contemplated Transaction”). The Letter does not identify the holders or specify the amount of Second-Priority Secured Notes or other securities that they may hold. The Letter includes allegations that these transactions constitute or will constitute voidable fraudulent transfers and represent breaches of alleged fiduciary duties owed to CEOC creditors and that certain disclosures concerning the transactions were inadequate. The Letter demands, among other things, that the transactions be rescinded or terminated, as would be applicable.
CGP strongly believes there is no merit to the Letter’s allegations and will defend itself vigorously and seek appropriate relief should any action be brought. If a court were to order rescission of the 2013 CGP Transaction or enjoin consummation of the Contemplated Transaction, CGP and CGPH may have to return the Properties and/or the assets transferred to CGP in the 2013 CGP Transaction or their value to CEC or CEOC, be forced to pay additional amounts therefor, or to take other actions ordered by the court. In addition, if the Contemplated Transaction were consummated and a court were to find that those transfers were improper, that could trigger a default under CGPH’s credit facilities and notes and a court could fashion a number of remedies, including declaring that the liens on the returned assets securing CGPH’s credit facilities and the notes are not valid or enforceable, or that they may be equitably subordinated or otherwise impaired. These consequences could have a material adverse effect on CGP’s and CGPH’s business, financial condition, results of operations and prospects and on the ability of lenders and noteholders to recover on claims under the credit facilities and the notes.
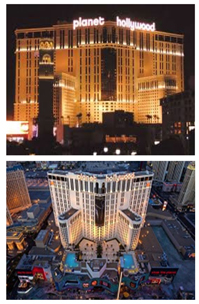
| A. | Diversified revenue streams and well-positioned properties |
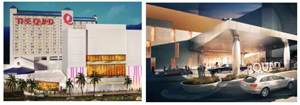
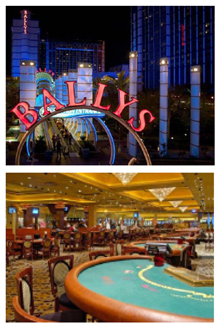
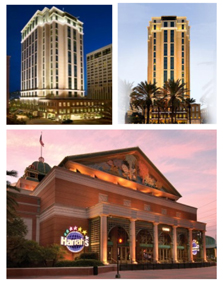
The Company’s properties consist of well-known, large entertainment facilities that bear some of the most highly recognized brand names in the gaming industry, including Planet Hollywood, Bally’s and Harrah’s. These brands have a strong identity and enjoy widespread customer recognition. The strategic location of the Company’s properties in both Las Vegas and New Orleans offers a variety of competitive advantages.
| Geographic footprint |
|
All of CGPH’s operating casinos have a successful track record of strong, stable revenue and free cash flow.
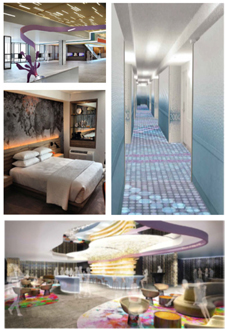
The Company’s Las Vegas assets generate a majority of their revenue from non-gaming sources, which generally tend to be higher-margin, higher-growth offerings. As part of the Company’s focus on expanding non-gaming business, the Company has and continues to invest significant capital towards its lodging, entertainment, food and beverage offerings. Further, the Company’s continued focus on newer and more luxurious offerings in the Las Vegas market is expected to result in higher spend per customer.
Though Harrah’s New Orleans generates the majority of its revenue from gaming, it has a leading market share and benefits from being one of four major gaming properties in the New Orleans market. Additionally, Harrah’s New Orleans is the only land-based casino in its market, and its share of the New Orleans market has improved by nearly 600 basis points over the past three years, from 54% in 2011 to 60% in 2013, based on gross gaming revenue as reported by the Louisiana Gaming Control Board. The Company believes the property will continue to benefit from the ongoing significant population growth in New Orleans, as well as strong trends in tourism.
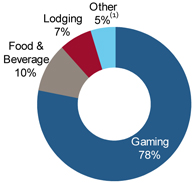
| Diverse revenue base | ||||
| Planet Hollywood | The Quad | |||
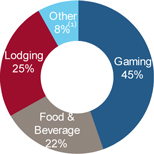
|
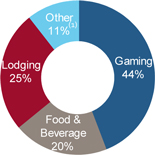
| |||
| Bally’s Las Vegas | Harrah’s New Orleans | |||
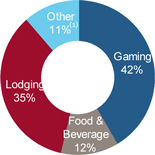
|
| |||
| (1) | Includes retail, entertainment, admissions and other revenue. |
| B. | Significant upside from ongoing capital projects |
The Company’s Las Vegas properties are located near or adjacent to several new large-scale developments in the city, all of which the Company expects will drive increased visitation to its properties. These projects include the current renovations to The Quad and the ongoing redevelopment of The Cromwell. These improvements to The Quad and The Cromwell, in conjunction with Caesars Entertainment’s Project Linq development, are expected to generate increased foot traffic and result in the presence of additional visitors to the area, which Management expects will improve both gaming and non-gaming revenues at its properties.
| • | The Quad renovation: Expected to be completed in mid-2015 and drive increased visitation to the casino and hotel, as the property currently has some of the lowest cash ADR and occupancy levels relative to other similarly located properties at the Las Vegas Strip |
| • | A significant amount of Adjusted EBITDA at The Quad is expected to be recovered from the $90 million renovation of The Quad and construction disruption due to Project Linq |
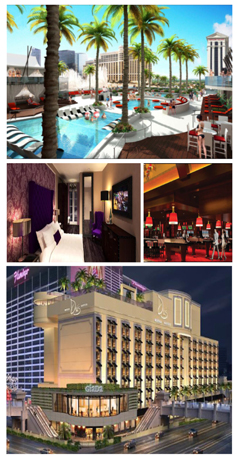
| • | The Cromwell Hotel: Newly developed as a luxury boutique hotel, the property is currently undergoing refurbishment at the North-East corner of East Flamingo Road and Las Vegas Boulevard |
| • | A $235 million investment to renovate and redevelop the former Bill’s Gamblin’ Hall & Saloon into a new boutique luxury hotel |
| • | The casino and hotel are expected to open in April 2014 and will feature 188 luxury hotel rooms |
| • | The 65,000 square foot pool and dayclub/nightclub, which will be operated by a third party, is expected to open in May 2014 |
| • | Project Linq and High Roller observation wheel (owned by Caesars Entertainment): A $533 million large-scale capital project aimed at creating an open-air dining, entertainment and retail development |
| • | Project Linq began opening in phases starting in December 2013 |
| • | Expected to be fully open during Q2 2014 |
Overview of current and future capital spending projects
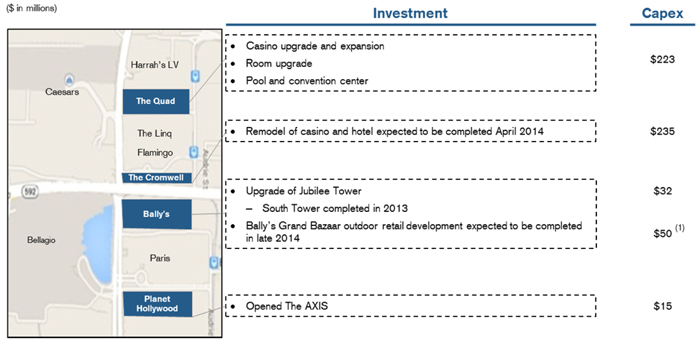
| (1) | Represents total development budget. CGPH will not invest any of the capital required to build the Grand Bazaar, but will receive lease payments. |
| E. | Attractive credit profile and strong free cash flow |
Upon completion of the transaction, CGPH will have one of the strongest credit profiles relative to its peers.
| • | Low leverage on CGPH assets: CGPH’s net first lien and net total leverage of 3.5x – 3.9x and 5.7x – 6.3x, respectively (excluding The Cromwell) is based on an estimated range of projected run-rate adjusted EBITDA (incl. development projects) – pro forma of $287 million – $320 million |
| • | Ample liquidity position: Strong pro forma liquidity position with $150 million available in an undrawn revolver |
| • | Significant underlying collateral value: High replacement cost asset base further enhances credit profile |
| • | High proportion of non-gaming revenue: Approximately 45% of revenue is from non-gaming sources, which are generally higher growth and higher margin businesses |
Select comparable leverage statistics(1)
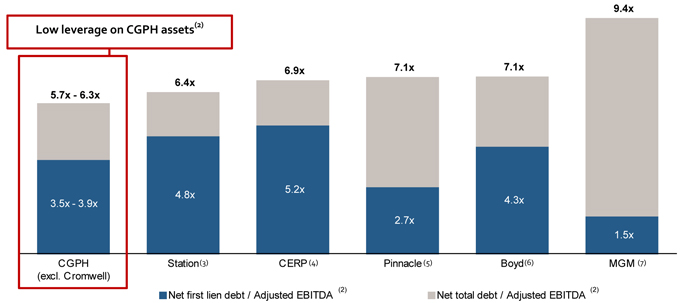
| (1) | As of FY 2013 for CGP Holdings, MGM Resorts, Boyd Gaming, Station Casinos and Pinnacle Entertainment. CERP as of October 2013 Offering Memorandum. |
| (2) | Based upon the Company’s estimated range of projected run-rate adjusted EBITDA (incl. development projects). The Company’s calculation of the estimated range of projected run-rate adjusted EBITDA (incl. development projects) is not directly comparable to the calculations of adjusted EBITDA by the companies presented below. The comparable companies presented below may include adjustments inconsistent with the Company’s calculation of adjusted EBITDA, or vice versa. |
| (3) | Excludes EBITDA of Fertitta Interactive attributable to Station. |
| (4) | CERP leverage based on mid-point of EBITDA as presented in October 2013 offering memorandum. |
| (5) | Pinnacle pro forma for acquisition of Ameristar Casinos. |
| (6) | Boyd leverage excludes Borgata. |
| (7) | MGM leverage based on Wholly Owned EBITDA. |
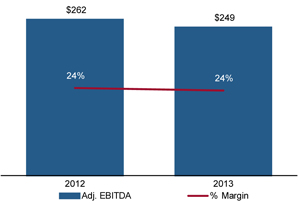
CGPH benefits from stable EBITDA, consistently strong margins and attractive free cash flow dynamics. Between FY 2012 and FY 2013, CGPH properties averaged a Adjusted EBITDA margin of 24%. Additionally, maintenance capex requirements at CGPH properties have been consistently minimal. On average, maintenance capex has represented only 10% of EBITDA over the last two years leading to an average free cash flow conversion of 90% during the same period.
| Historical Adjusted EBITDA | Historical free cash flow(1) | |||
| ($ in millions)
|
($ in millions)
|
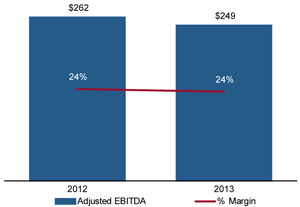
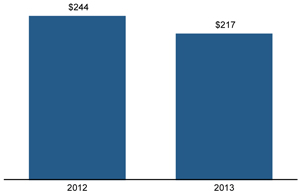
| Note: | Includes The Cromwell. |
| (1) | Free cash flow defined as EBITDA less maintenance capex. |
| F. | Well-capitalized parent with significant liquidity and independent capital structure |
The Company’s parent, Caesars Growth Partners, LLC, has an independent capital structure. Certain CGP assets, such as Caesars Interactive Entertainment (and its assets), are currently unencumbered. Pro forma for the transaction, CGP will have approximately $409 million on its balance sheet, which provides it with significant liquidity and the capacity to deploy its cash towards value enhancing investments. Additionally, CGP currently has a portfolio of debt investments, which could provide an additional source of future liquidity.
As of March 25, 2013, CGP’s parent, CAC, has a market capitalization of $2.2 billion, which implies an equity value of $5.2 billion for CGP.
CGPH organizational structure
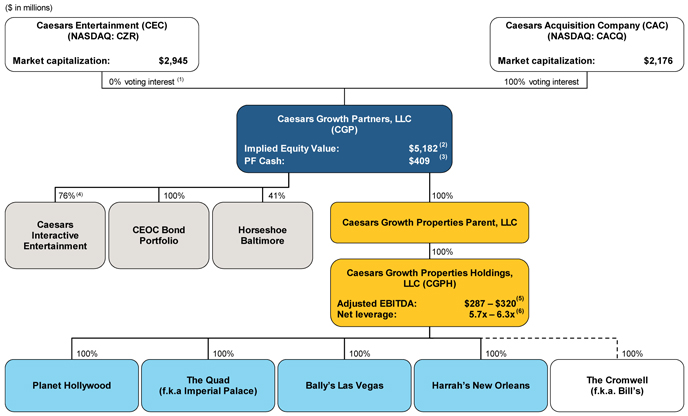
| Note: | Market values as of March 25, 2014. |
| (1) | Caesars Entertainment Corp. indirectly owns 58% of the economic interest in Caesars Growth Partners and 100% of the non-voting interest. |
| (2) | Calculated as CACQ market capitalization of $2,176 million divided by CACQ’s 42% economic interest in CGP. |
| (3) | Pro forma for the transactions. Does not include restricted cash at Horseshoe Baltimore and CIE. |
| (4) | Represents fully-diluted ownership. |
| (5) | Reflects estimated range of projected run-rate adjusted EBITDA (incl. development project) – Pro forma. See pages 29-33. Excludes EBITDA and net debt attributable to The Cromwell. |
| (6) | Represents net total debt / Adjusted EBITDA. |
| (7) | As a qualified non-recourse subsidiary, The Cromwell (i) will not guarantee the Senior Secured Credit Facilities or the Senior Lien Notes and will not provide any portion of the collateral securing the Senior Secured Credit Facilities or the Second Lien Notes, (ii) has no obligation to pay any amounts due pursuant to the Senior Secured Credit Facilities or the Second Lien Notes and (iii) will not be subject to any of the restrictive covenants in the Credit Agreement or the indenture governing the Notes. In addition, as of December 31, 2013, The Cromwell had approximately $185 million of outstanding secured indebtedness under the Credit Agreement, dated as of November 2, 2012, among The Cromwell and certain other parties thereto, all of which ranks senior to the Senior Secured Credit Facilities and the Second Lien Notes. |
| B. | Services |
Summary of management agreement
In October 2013, CAC and CGP entered into a Management Services Agreement (“CGP MSA”) with CEOC, under which CEOC and its subsidiaries provide certain management services to CAC, CGP and their subsidiaries, in exchange for a service fee. In accordance with the CGP MSA, CAC, CGP and their subsidiaries have the ability, at the request of CAC’s Board of Directors, to receive administrative and operational services from CEOC, while leveraging Caesars Entertainment’s infrastructure, corporate services, various back-office support functions, as well as business advisory services, including assistance with identifying and analyzing opportunistic investments, developing corporate strategies, design and construction consultancy services and analyzing and executing financing activities. The CGP MSA will remain in place after the closing of the acquisitions.
Summary of property management agreements
At closing, each of the four acquired properties will enter into Property Management Agreements (“PMA”) with management subsidiaries of CEOC (the “Property Managers”). Planet Hollywood’s current PMA with a subsidiary of CEOC will remain in place. The ongoing management fees payable by each of the four acquired properties will consist of the following:
| • | Base management fee of 2% of net operating revenues |
| • | Incentive management fee equal to 5% of EBITDA for each operating year |
Planet Hollywood’s management fee structure includes:
| • | Base management fee of 3% of net operating revenues |
| • | Incentive management fee equal to 4.5% of EBITDA for each operating year |
Following the closing of the acquisitions, at CGP’s request and subject to receipt of any required regulatory approvals, the PMAs will be assigned to ServicesCo, which will thereafter perform the obligations of the Property Managers (in which case CEOC’s guarantee of the obligations under the assigned PMAs will be released).
Overview of Caesars Enterprise Services, LLC
In connection with the transaction, Caesars Entertainment Operating Company, Inc., Caesars Entertainment Resort Properties, LLC and Caesars Growth Properties Holdings, LLC have agreed to use reasonable best efforts to establish a new services joint venture known as Caesars Enterprise Services, LLC (“ServicesCo”). The purpose of ServicesCo, subject to the review and approval of the special committees of CAC and Caesars Entertainment Corporation, is to provide certain centralized services to CEOC, CERP and CGPH, including but not limited to common management of the enterprise-wide intellectual property, which will be provided per the Shared Services Agreement by ServicesCo to each of the three entities, along with shared services operations across the portfolio of properties owned by CEOC, CERP, CGPH and their respective subsidiaries. The implementation of ServicesCo is subject to regulatory approval and the review and approval of the CEC and CAC Special Committees.
Licensing of intellectual property
Upon the implementation of ServicesCo, CEOC, CERP, CGP, ServicesCo and Caesars License Company, LLC (“CLC”), will use reasonable best efforts to enter into a Cross-License Agreement (the “CLA”). Pursuant to the CLA:
| • | CEOC and CLC will grant a non-exclusive, irrevocable, perpetual, royalty-free license in and to certain intellectual property assets to ServicesCo |
| • | CEOC will receive an irrevocable, perpetual, royalty-free license to certain intellectual property that is: |
| • | Specific to any of the Properties and any other property controlled by CGP, CERP or their respective subsidiaries |
| • | Owned by CGP, CERP or their respective subsidiaries |
| • | CGP or the relevant owner of each Property (except Planet Hollywood), will receive licenses from ServicesCo of certain agreed upon intellectual property in respect of the Properties |
| • | CERP will receive licenses from ServicesCo of the intellectual property currently licensed to CERP |
CGP, CERP and the relevant owner of each Property (except Planet Hollywood) will license any intellectual property specific to each such Property that is owned by CGP, CERP or any such owner to ServicesCo and CEOC in connection with uses that are not specifically tied to the Properties and consistent with such current uses.
In addition, CEOC, CERP, CGP and Caesars Entertainment will continue to have access to corporate and other shared services provided by ServicesCo. Further, ServicesCo will assign to CGP, CERP or a subsidiary designated by CGP or CERP, all property-specific intellectual property (with respect to a CGP- or CERP-owned property, respectively) that is created from time to time by or on behalf of ServicesCo.
ServicesCo organizational chart
| Historical revenue |
Historical Adj. EBITDAM |
Overview of The Quad capital improvements
Historical gaming revenue and market share
($ in millions)
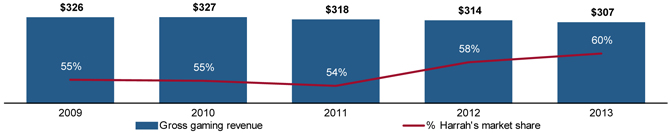
Source: Louisiana Gaming Control Board.
| (1) | Management projections reflect the annual run-rate Adjusted EBITDAM estimated from the property once open or fully implemented and operated at a steady state, which may not occur until 12 to 24 months after the property commences operations. These projections are based on Management’s current estimates and involve risks, uncertainties, assumptions and other factors that may cause actual results, performance or achievements to be materially different from any future results, performance or achievements expressed or implied by projections. |
Disclaimer
The following unaudited combined financial data of the Properties for the years ended, and as of, December 31, 2012 and 2013 constitute forward-looking statements and are based upon CGPH’s preliminary internal estimates and best judgment of its performance. The estimates for the years ended, and as of, December 31, 2012 and 2013 may be subject to adjustments in connection with CGPH’s audit procedures. CGPH’s actual results for the years ended, and as of, December 31, 2012 and 2013 may differ materially from its current estimates. The preliminary financial data for the years ended, and as of, December 31, 2012 and 2013 included above has been prepared by, and is the responsibility of, management.
| A. | Historical financials (unaudited) |
Balance sheet (unaudited)
| ($ in millions) |
||||||||
| Historical Combined | ||||||||
| As of December 31, | ||||||||
| 2013 | 2012 | |||||||
| ASSETS |
||||||||
| Current assets |
||||||||
| Cash and cash equivalents |
$ | 168.1 | $ | 151.7 | ||||
| Restricted Cash |
23.3 | 39.3 | ||||||
| Net Receivables |
36.4 | 33.6 | ||||||
| Deferred Income Taxes |
2.6 | 1.4 | ||||||
| Prepayments and other current assets |
21.4 | 18.9 | ||||||
| Inventories |
1.8 | 2.3 | ||||||
|
|
|
|
|
|||||
| Total current assets |
$ | 253.6 | $ | 247.2 | ||||
| Property and equipment, net |
$ | 1,994.6 | $ | 1,882.6 | ||||
| Restricted Cash |
117.1 | 167.1 | ||||||
| Goodwill |
361.6 | 361.6 | ||||||
| Intangible assets other than goodwill |
124.3 | 145.5 | ||||||
| Deferred charges and other |
39.8 | 28.1 | ||||||
|
|
|
|
|
|||||
| Total Assets |
$ | 2,891.0 | $ | 2,832.1 | ||||
| LIABILITIES AND STOCKHOLDERS’ EQUITY |
||||||||
| Current liabilities |
||||||||
| Accounts payable |
$ | 45.3 | $ | 25.3 | ||||
| Interest Payable |
4.5 | 4.3 | ||||||
| Accrued Expenses |
90.0 | 90.9 | ||||||
| Current portion of long-term debt |
3.9 | 2.1 | ||||||
| Due to affiliates, net |
13.3 | 7.3 | ||||||
|
|
|
|
|
|||||
| Total current liabilities |
$ | 157.0 | $ | 129.9 | ||||
| Long-term debt |
661.9 | 655.8 | ||||||
| Long-term debt - related party |
139.2 | 123.7 | ||||||
| Deferred credits and other |
12.4 | 14.2 | ||||||
| Deferred income taxes |
159.2 | 165.8 | ||||||
|
|
|
|
|
|||||
| Total liabilities |
$ | 1,129.7 | $ | 1,089.4 | ||||
| Commitments and contingencies |
||||||||
| Net parent investment |
$ | 2,048.0 | $ | 2,084.3 | ||||
| Retained deficit |
(286.7 | ) | (341.6 | ) | ||||
|
|
|
|
|
|||||
| Total stockholders’ equity |
$ | 1,761.3 | $ | 1,742.7 | ||||
|
|
|
|
|
|||||
| Total liabilities and equity |
$ | 2,891.0 | $ | 2,832.1 | ||||
|
|
|
|
|
|||||
Income statement (unaudited)
| ($ in millions) |
||||||||
| Historical Combined FYE 12/ 31, | ||||||||
| 2013 | 2012 | |||||||
| Revenues |
||||||||
| Casino |
$ | 663.6 | $ | 709.7 | ||||
| Food and beverage |
200.6 | 198.9 | ||||||
| Rooms |
240.9 | 240.3 | ||||||
| Other |
94.0 | 92.7 | ||||||
| Less: casino promotional allowances |
(160.2 | ) | (160.4 | ) | ||||
|
|
|
|
|
|||||
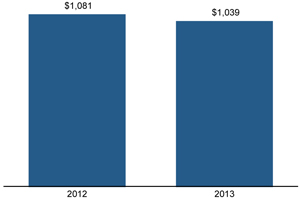
| Net revenues |
$ | 1,038.9 | $ | 1,081.2 | ||||
| Operating expenses |
||||||||
| Direct |
||||||||
| Casino |
$ | 341.1 | $ | 368.3 | ||||
| Food and beverage |
89.7 | 92.0 | ||||||
| Rooms |
66.9 | 72.1 | ||||||
| Property, general, administrative, and other |
293.6 | 288.6 | ||||||
| Depreciation and amortization |
63.2 | 64.0 | ||||||
| Write-downs, reserves, and project opening costs, net of recoveries |
16.9 | 2.5 | ||||||
| Amortization of intangible assets |
20.8 | 20.8 | ||||||
|
|
|
|
|
|||||
| Total operating expenses |
$ | 892.2 | $ | 908.3 | ||||
|
|
|
|
|
|||||
| Income from operations |
$ | 146.7 | $ | 172.9 | ||||
| Interest expense, net of interest capitalized |
($ | 69.8 | ) | ($ | 52.2 | ) | ||
| Gain on early extinguishments of debt |
(1.6 | ) | — | |||||
| Other income, including interest income |
0.2 | — | ||||||
|
|
|
|
|
|||||
| Income before income taxes |
$ | 75.5 | $ | 120.7 | ||||
| Provision for income taxes |
(20.6 | ) | (41.9 | ) | ||||
|
|
|
|
|
|||||
| Net income |
$ | 54.9 | $ | 78.8 | ||||
|
|
|
|
|
|||||
Adj. EBITDA reconciliation (unaudited)
| ($ in millions) |
||||||||
| Historical Combined FYE 12/ 31, | ||||||||
| 2013 | 2012 | |||||||
| Net income |
$ | 54.9 | $ | 78.8 | ||||
| Interest expense, net of capitalized interest and interest income |
69.6 | 52.2 | ||||||
| Provision for income taxes |
20.6 | 41.9 | ||||||
| Depreciation and amortization |
84.0 | 84.8 | ||||||
|
|
|
|
|
|||||
| EBITDA |
$ | 229.1 | $ | 257.7 | ||||
| Project opening costs, abandoned projects and development costs |
$ | 5.2 | $ | 1.3 | ||||
| Gains on early extinguishment of debt |
1.6 | — | ||||||
| Non-cash expense for stock compensation benefits |
0.4 | 0.4 | ||||||
| Other items |
12.2 | 2.1 | ||||||
|
|
|
|
|
|||||
| Adjusted EBITDA |
$ | 248.5 | $ | 261.5 | ||||
|
|
|
|
|
|||||
Management’s discussion and analysis
Net revenues for 2013 decreased when compared with 2012, primarily driven by reductions in casino revenues. Disruption in operations at the Quad, and the closure of Bill’s Gamblin’ Hall & Saloon in 2012, to be renovated and reopened as the Cromwell, drove the significant reduction in gaming revenues. These same impacts caused adverse changes in food and beverage and rooms revenues at the Purchased Properties, which were mostly offset by increased food and beverage and rooms revenues at Planet Hollywood. Income from operations decreased in 2013 when compared with 2012 due to the impact of reduced revenues and the increase in remediation expenses associated with certain of the Purchased Properties. Remediation expenses are not a component of Adjusted EBITDA or Property EBITDA.