Attached files
| file | filename |
|---|---|
| 8-K - 8-K - DOVER Corp | d694364d8k.htm |
 BAML Global Industrials & EU Autos Conference
Robert Livingston
President & CEO
March 20, 2014
Exhibit 99.1 |
| 2
Forward looking statements
We want to remind everyone that our comments may contain forward-looking
statements that are inherently subject to uncertainties. We caution everyone to
be guided in their analysis of Dover Corporation by referring to
our Form 10-K
for a list of factors that could cause our results to differ from those anticipated
in any such forward-looking statements.
We would also direct your attention to our website,
dovercorporation.com, where considerably more
information can be found. 2 |
 3
Since our last Dover Day investor meeting…
Building our industrial businesses
–
Continued to expand in our growth areas
Energy, Fluids, Refrigeration, Printing & ID all grew organically
and through acquisition
–
Anthony, Finder, KPS, Fibrelite and MS all expand product
breadth and geographic reach
–
Our business profile is more consistent and focused
with sustainable higher margins
New segment structure to capture growth opportunities
–
Energy, Fluids, Refrigeration & Food Equipment,
and Engineered Systems
The next generation of Dover leadership to drive performance
–
Andy Fincher, Bill Johnson and Soma Somasundaram to lead
Engineered Systems, Refrigeration & Food Equipment,
and Energy, respectively
3 |
 4
…but our strengths remain unchanged
Customer intimacy
–
Innovate for the customer
We win when we help our customers win
Recurring theme of delivering efficiency (energy, cost & speed)
and sustainability
–
Superior customer service
On-time delivery, quality, support
Leverage our scale
Generate cash
–
Free cash flow remains consistently strong
Market share leadership
–
Strong focus on technology leadership and innovation
drive share gains and customer loyalty
4 |
 5
Dover has several levers for value creation
5
GROWTH
3% -
5% organically,
complemented by
acquisition growth
MARGIN
Expand segment
margin to 19%
CASH FLOW
Generate free cash flow in
excess of 10% of revenue
Substantial growth
opportunities
Accelerated
productivity initiatives
Significant balance
sheet optionality
Mid-term targets*
*Mid-term: 2014 -2016 |
 6
Energy: At a glance
Dover
Energy
is
a
leading
provider
of
customer driven solutions and services for
safe and efficient production and
processing of fuels worldwide, and has a
strong presence in the bearings and
compression components market. |
 7
Growth opportunities: A look forward
Energy
–
Significant investments in sales, field engineering and
facilities are paying dividends….will continue in 2014
24% and 45% international growth* in 2012 and in 2013
–
Increase participation in global tenders
Middle East, South America & Australia
–
Seek additional industry partnership opportunities
–
Progressive cavity pumps……..others
–
Remote monitoring/automation for oil and gas production
–
Leverage plunger and gas lift technologies into international markets
–
Strengthen our position in faster growing basins
–
Increase OEM share in bearings and compression
7
*Note: Outside North America and Europe, on a pro forma basis
Continue to expand geographical presence
Fill in product gaps internally and through acquisition
Grow core business |
 8
Engineered Systems: At a glance
Dover
Engineered
Systems
is
focused
on
the design, manufacture and service of
critical equipment and components serving
the printing & identification, vehicle service,
waste handling, and select niche industrial
end-markets. |
 9
Growth opportunities: A look forward
Engineered Systems
–
Recent MS acquisition adds exposure to fast growing textile markets
Capitalize on “analog to digital”
trend
Leverage ink expertise to drive additional opportunity
Extend technology to other textiles including flooring and wall coverings
–
Grow North American and China presence in core markets
–
Concentrate on after-market customer productivity solutions
Curotto Can a great example of creating value in “mature”
markets
More opportunities in vehicle service markets
–
Expand in high growth recycling and waste-to energy markets
–
Achieve YOY 10%+ growth outside the US
–
Growing middle class consumption and higher operating costs
driving automation solutions in emerging markets
9
Expand markets served in Printing & Identification
Make focused industrial investments
Extend geographic reach |
 10
Fluids: At a glance
Dover
Fluids
is
focused
on
the
safe
handling of critical fluids across the oil &
gas, retail fueling, chemical, hygienic and
industrial end-markets. |
 11
Growth opportunities: A look forward
Fluids
–
Targeting
25%
growth
in
markets
outside
North
America
and
Europe
in
2014
Grow presence in Middle East and China through Maag and Finder channels
Double revenue in Australia through Ebsray’s LPG and chemical pump
technologies
–
Complete “station in a box”
offering worldwide with KPS and Fibrelite
–
Penetrate North American plastics and oil & gas markets though European
acquisitions
–
Build comprehensive offering of highly engineered pump technologies
–
Innovate around automation, energy efficiency and evolving regulatory
standards –
Expand hygienic pump presence
11
Leverage our global footprint to accelerate growth
Develop and acquire products that provide complete solutions
Access new markets through recent acquisitions |
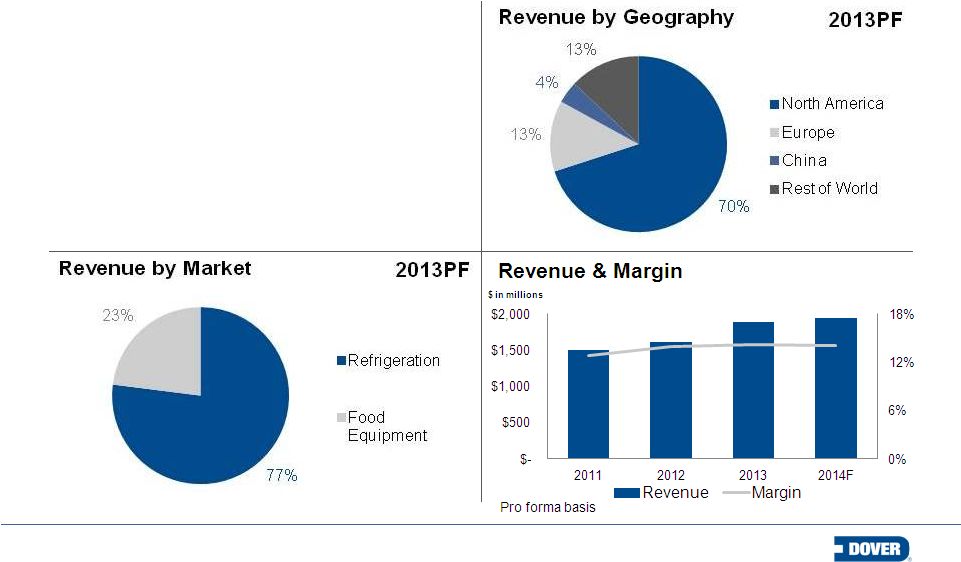 12
Refrigeration & Food Equipment: At a glance
Dover Refrigeration & Food Equipment
is the leading provider of energy efficient
equipment and systems serving the
commercial refrigeration and food service
industries. |
 13
Growth opportunities: A look forward
Refrigeration & Food Equipment
–
Build share with targeted accounts
–
Leverage strong customer relationships as supermarket chains expand globally
–
Rising energy costs and increasing government regulation are driving strong demand
for energy efficient solutions
Close-the-case sales grew +15% in 2013 with strong growth expected to
continue –
Large retailers shifting to smaller store formats
–
C-store and “Dollar”
stores expected to continue above market growth rates
–
Convergence of refrigeration and food equipment in supermarket
–
Extend Anthony after-market business
–
Build turn-key refrigeration capabilities in Brazil and Europe; Add-ons in
food equipment 13
Develop broader customer base
Capitalize on secular trends
Penetrate higher growth adjacent markets
Leverage new sales channel organization and synergies
Acquire assets that expand technology and geography |
 14
Margin enhancement through productivity
Global supply chain
–
Program now in its 5
th
year
–
Continuing to leverage the scale of Dover
Many spend categories are being reviewed again
$90
-$120
million
in
savings
or
cost
avoidance
expected
over
the
next
3
years
Shared manufacturing
–
Several consolidation projects are near completion
Hill
Phoenix
will
consolidate
4
sites
in
Atlanta
area
~$3M
of
annualized
savings
*
Energy
will
combine
5
sites
in
Houston
~$1M
of
annualized
savings
*
More projects are on the way
Investing in Lean and Post-Merger Integration (“PMI”)
–
Adding lean resources across segments
–
PMI leaders driven to integrate faster with focus on near term accretion
14
* Annualized savings over 3 years (2014 –
2016) |
 15
Capital allocation: Recent history
Consistently returning cash
to shareholders
Acquisition spending will
remain disciplined
15
* Includes Knowles capex and acquisitions |
 16
Capital allocation 2014
Strong balance sheet
–
$800 million cash as of December 31, 2013 (primarily overseas)
–
$400 million from Knowles
–
$170 million in proceeds from DEK sale (expected mid-year)
–
Strong free cash flow
We
expect
to
raise
the
dividend
for
59
th
consecutive
year
Capex expected to be roughly $200 million
Acquisitions
–
Pipeline is active
–
Could close $500 million to $1 billion in deals this year
Will complete $1 billion program in Q1
–
Capacity to do more; largely dependent on how pipeline develops
16 |
 17
Summary
2014
Organic
growth rate
Mid-term
(a)
Organic
Growth rate
Energy
4% -
5%
4% -
6%
Engineered Systems
3% -
4%
3% -
5%
Fluids
4% -
5%
4% -
6%
Refrigeration & Food
Equipment
2% -
3%
2% -
4%
Total organic
3% -
4%
3% -
5%
Acquisitions
3%
(b)
5%
Total growth
6% -
7%
8% -
10%
Mid-term growth complemented by:
–
Mid-term margin expansion to 19%
driven by continuing focus on lean and
productivity initiatives
–
Strong free cash flow generation in
excess of 10% of revenue
–
Consistent return of cash to
shareholders
17
(a): 2014 –
2016
(b): Growth from completed acquisitions
2014 is on track
–
Early bookings trends show solid
broad-based growth
–
Q1 revenue growth as expected,
sequentially in-line with Q4 2013
–
EPS seasonality generally consistent
with last year
Q1
2013
Q2
2013
Q3
2013
Q4
2013
FY
2013
Adjusted EPS*
$0.93
$1.13
$1.25
$1.02
$4.33
% of FY
21%
26%
29%
24%
100%
*
See appendix slide for reconciliation |
 *
*
*
*
*
*
*
*
*
***************************** |
 19
Appendix –
2013 Quarterly adjusted EPS from continuing operations
(unaudited) (in thousands, except per share data)
Q1
Q2
Q3
Q4
FY 2013
REVENUE:
Energy
462,679
$
465,906
$
467,688
$
457,580
$
1,853,853
$
Engineered Systems
605,325
639,426
642,205
651,606
2,538,562
Fluids
273,638
310,137
309,241
343,822
1,236,838
Refrigeration & Food Equipment
422,468
517,574
521,322
426,476
1,887,840
Intra-segment eliminations
(133)
(632)
(245)
(430)
(1,440)
Total consolidated revenue
1,763,977
$
1,932,411
$
1,940,211
$
1,879,054
$
7,515,653
$
EARNINGS FROM CONTINUING OPERATIONS:
Segment earnings:
Energy
118,708
$
109,662
$
119,086
$
112,193
$
459,649
$
Engineered Systems
83,283
102,804
111,850
101,511
399,448
Fluids
47,601
58,768
63,056
55,098
224,523
Refrigeration & Food Equipment
52,110
82,177
86,446
46,574
267,307
Total segments
301,702
353,411
380,438
315,376
1,350,927
Corporate expense / other
33,632
34,860
32,532
28,752
129,776
Net interest expense
30,284
30,232
30,236
29,920
120,672
Earnings from continuing operations before provision for
income taxes
237,786
288,319
317,670
256,704
1,100,479
Provision for income taxes
70,573
30,261
91,435
74,138
266,407
Earnings from continuing operations
167,213
$
258,058
$
226,235
$
182,566
$
834,072
$
BASIC EARNINGS PER COMMON SHARE:
Earnings from continuing operations
0.96
$
1.51
$
1.33
$
1.07
$
4.87
$
Weighted average shares outstanding
173,448
171,111
170,544
170,027
171,271
DILUTED EARNINGS PER COMMON SHARE:
Earnings from continuing operations
0.95
$
1.49
$
1.31
$
1.06
$
4.81
$
Weighted average shares outstanding
175,567
173,097
172,734
172,265
173,547
ADJUSTED EARNINGS FROM CONTINUING OPERATIONS:
Earnings from continuing operations
167,213
$
258,058
$
226,235
$
182,566
$
834,072
$
Gains from discrete and other tax items
4,343
61,477
7,751
6,084
79,655
Other one-time gains, net of tax
-
-
2,866
-
2,866
Adjusted earnings from continuing operations
162,870
$
196,581
$
211,782
$
180,318
$
751,551
$
ADJUSTED DILUTED EARNINGS PER COMMON SHARE:
Earnings from continuing operations
0.95
$
1.49
$
1.31
$
1.06
$
4.81
$
Gains from discrete and other tax items
0.02
0.36
0.04
0.04
0.46
Other one-time gains, net of tax
-
-
0.02
-
0.02
Adjusted earnings from continuing operations
0.93
$
1.13
$
1.25
$
1.02
$
4.33
$
2013 |