Attached files
| file | filename |
|---|---|
| 8-K - 8-K - Matador Resources Co | mtdr-20140312x8k.htm |
Exhibit 99.1
MATADOR RESOURCES COMPANY REPORTS FOURTH QUARTER AND FULL YEAR 2013
RESULTS AND PROVIDES OPERATIONAL UPDATE
DALLAS, Texas, March 12, 2014 -- Matador Resources Company (NYSE: MTDR) (“Matador” or the “Company”), an independent energy company engaged in the exploration, development, production and acquisition of oil and natural gas resources, with an emphasis on oil and natural gas shale and other unconventional plays and with a current focus on its Eagle Ford operations in South Texas and its Permian Basin operations in Southeast New Mexico and West Texas, today reported financial and operating results for the three months and year ended December 31, 2013. Headlines include the following:
• | Oil production of 2,133,000 Bbl for the year ended December 31, 2013, a year-over-year increase of 76% from 1,214,000 Bbl produced in 2012. |
• | Average daily oil equivalent production of 11,740 BOE per day for the year ended December 31, 2013, consisting of 5,843 Bbl of oil per day and 35.4 MMcf of natural gas per day, a year-over-year BOE increase of 30% from 9,000 BOE per day, consisting of 3,317 Bbl of oil per day and 34.1 MMcf of natural gas per day, produced in 2012. |
• | Oil and natural gas revenues of $269.0 million in 2013, a year-over-year increase of 72% from $156.0 million reported for the year ended December 31, 2012. |
• | Adjusted EBITDA of $191.8 million for the year ended December 31, 2013, a year-over-year increase of 65% from $115.9 million reported for the year ended December 31, 2012. |
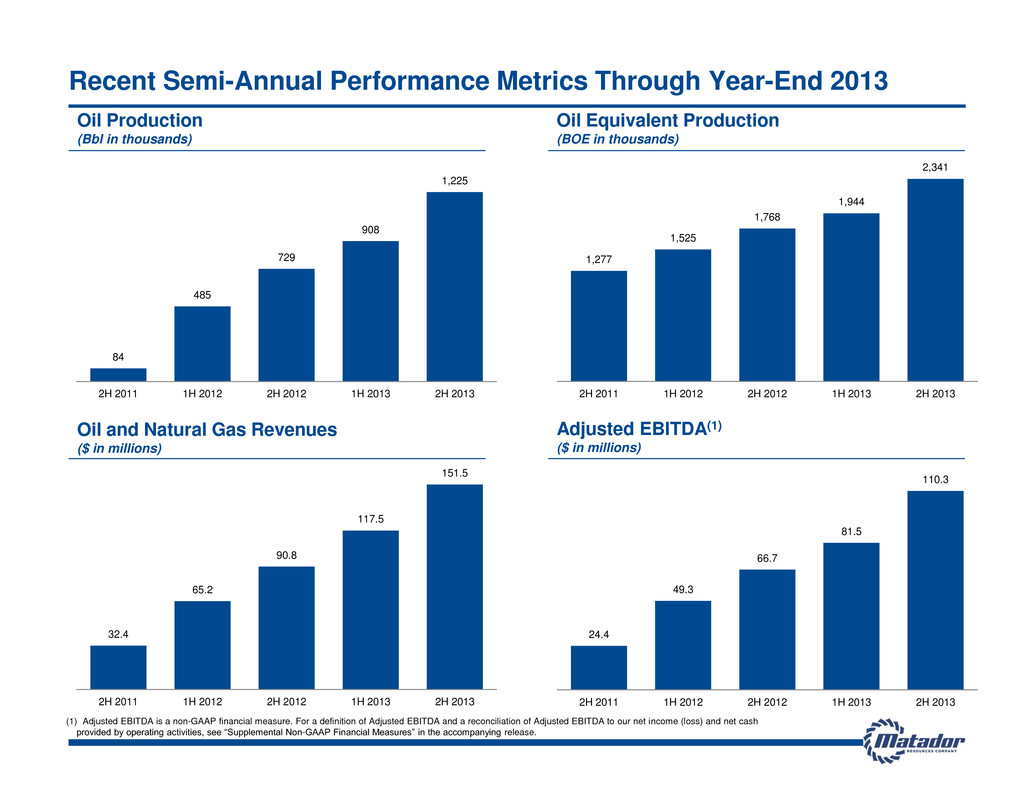
• | Oil production of 1,225,000 Bbl for the six months ended December 31, 2013, a sequential increase of 35% from 908,000 Bbl produced in the six months ended June 30, 2013, and a year-over-year increase of 68% from 729,000 Bbl of oil produced in the six months ended December 31, 2012. |
• | Oil and natural gas revenues of $151.5 million for the six months ended December 31, 2013, a sequential increase of 29% from $117.5 million reported for the six months ended June 30, 2013, and a year-over-year increase of 67% from $90.8 million in the six months ended December 31, 2012. |
• | Adjusted EBITDA of $110.3 million for the six months ended December 31, 2013, a sequential increase of 35% from $81.5 million reported for the six months ended June 30, 2013, and a year-over-year increase of 65% from $66.7 million reported for the six months ended December 31, 2012. |
• | Oil production of 608,000 Bbl for the fourth quarter of 2013, essentially flat as compared to 617,000 Bbl produced in the third quarter of 2013, despite 15 to 20% of production capacity shut in at various times during the fourth quarter, and a 43% year-over-year increase from 426,000 Bbl produced in the fourth quarter of 2012. |
• | Oil and natural gas revenues of $69.7 million for the fourth quarter of 2013, a 32% year-over-year increase from $52.7 million reported during the fourth quarter of 2012. |
• | Adjusted EBITDA of $48.8 million for the fourth quarter of 2013, a 28% year-over-year increase from $38.0 million reported during the fourth quarter of 2012. |
• | Total proved oil and natural gas reserves of 51.7 million BOE at December 31, 2013, including 16.4 million Bbl of oil and 212.2 Bcf of natural gas, an increase of 117% in BOE from 23.8 million BOE, including 10.5 million Bbl of oil and 80.0 Bcf of natural gas, at December 31, 2012. PV-10 of total proved reserves of $655.2 million at December 31, 2013, as compared to $423.2 million at December 31, 2012. |
• | Increased the borrowing base under its revolving credit facility to $385 million at March 12, 2014 based on the lenders’ review of Matador’s December 31, 2013 oil and natural gas reserves, up from |
1
the previous borrowing base of $350 million and compared to $200 million in borrowings outstanding at December 31, 2013.
• | Acquired an additional 7,000 gross (5,300 net) acres primarily in Lea and Eddy Counties, New Mexico between January 1 and March 12, 2014, bringing the Company’s total acreage position in the Permian Basin to approximately 77,800 gross (50,100 net) acres. |
• | Announced the 24-hour initial potential from the Rustler Breaks 12-24-27 #1H well, Matador’s first Wolfcamp “B” horizontal well in Eddy County, New Mexico, at 987 BOE per day (44% oil), including 436 Bbl of oil per day and 3.3 MMcf of natural gas per day, at 3,000 pounds per square inch (psi) on a 24/64th inch choke. |
• | Reaffirmed its full-year 2014 guidance estimates as provided at its Analyst Day on December 12, 2013, including (1) capital expenditures of $440 million, (2) oil production of 2.8 to 3.1 million Bbl, (3) natural gas production of 13.5 to 15.0 Bcf, (4) oil and natural gas revenues of $325 to $355 million and (5) Adjusted EBITDA of $235 to $265 million. Oil and natural gas revenues and Adjusted EBITDA guidance are based on an estimated realized oil price of $95.00 per barrel and an estimated realized natural gas price of $4.25 per Mcf for 2014. |
Year End 2013 Financial Results
Joseph Wm. Foran, Matador’s Chairman and CEO, commented, “2013 was another record year for Matador, and while we are very proud of our 2013 operating and financial accomplishments, we are looking forward to an even better year in 2014. During 2013, we increased earnings per share to $0.77 per common share from a loss of $0.62 per common share in 2012, with much of this increase due to the fact that we grew our oil production by more than 76% to 2.133 million Bbl from just over 1.2 million Bbl in 2012 and almost 14-fold from 154,000 Bbl in 2011. Oil production in 2013 constituted 50% of our total production by volume as compared to 37% in 2012 and only 6% in 2011. Our total proved oil and natural gas reserves increased 117% to 51.7 million BOE and our proved oil reserves increased 56% to 16.4 million Bbl at December 31, 2013, as compared to 23.8 million BOE and 10.5 million Bbl, respectively, at December 31, 2012. Adjusted EBITDA grew to $191.8 million in 2013, an increase of 65% from $115.9 million in 2012 and up almost four-fold from $49.9 million in 2011. Our total oil and natural gas production, total oil production, total proved reserves, proved oil reserves, proved natural gas reserves, oil and natural gas revenues and Adjusted EBITDA at and for the year ended December 31, 2013 were all the best in Matador’s history and either above or near the high end of 2013 guidance, which we revised upwards on November 6, 2013. These results reflect the continued successful execution of our stated goals at the time of our February 2012 initial public offering to significantly increase our oil production and oil reserves through our drilling operations in the Eagle Ford shale and to add the Permian Basin as one of our three main operating areas. During this time, our price per share has approximately doubled.
“Since the IPO, we have significantly increased our leasehold position in the Permian Basin, and today, we hold more than 77,800 gross (50,100 net) acres, primarily in Lea and Eddy Counties, New Mexico and Loving County, Texas, that we believe to be prospective for the Wolfcamp and Bone Spring plays, as well as other targets. We plan to run one contracted drilling rig in the Permian Basin in 2014, as we further evaluate and delineate our acreage position and methodically execute and improve our Permian drilling program. This program is off to a great start, and we have previously announced strong results from our first two horizontal wells in the Permian - the Ranger 33 State Com #1H, a Second Bone Spring completion in Lea County, New Mexico, and the Dorothy White #1H, a Wolfcamp “A” completion in Loving County, Texas, updated details of which are included in this press release. Today, we are pleased to announce that our Rustler Breaks 12-24-27 #1H well, a Wolfcamp “B” horizontal test in Eddy County, New Mexico, flowed 987 BOE per day (44% oil), including 436 Bbl of oil per day and 3.3 MMcf of natural gas per day at 3,000 psi on a 24/64th inch choke during a 24-hour initial potential test. As with the previous
2
two Permian wells, this well’s results have exceeded our initial expectations, and we are very encouraged by the continued strong performance of all three of these wells.
“The whole Matador drilling program is also off to a strong start in 2014. Our average daily oil production for the first two months of 2014 is averaging almost 6,800 Bbl of oil per day, despite having 15 to 20% of our oil production shut in at various times throughout this period while offsetting wells were being drilled and completed. These results are attributable to the better-than-expected results from our initial Permian wells and to the continued execution of our Eagle Ford development program. Drilling times and overall well costs have continued to improve in the Eagle Ford, and several recent wells on our western acreage in La Salle County in South Texas have been drilled in as few as eight days from spud to total depth with total drilling and completion costs at or below $6 million. The latest generation of our fracture treatment design, whereby we are pumping more fluid and more proppant while using more perforation clusters and tighter fracture spacing, is also resulting in better well performance, as compared to offsetting wells treated with earlier generation fracture treatment designs. Overall, our operations group is continuing to deliver better wells for less money in the Eagle Ford. In addition, with natural gas prices strengthening, we are expecting our interests in the Haynesville shale to make larger contributions to our expected gains in production, Adjusted EBITDA and shareholder value in 2014.
“It is also a pleasure to report that on March 12, 2014, we closed an amendment to our credit facility that increased our borrowing base from $350 million to $385 million, based upon the lenders’ review of our December 31, 2013 oil and natural gas reserves, and added Wells Fargo Bank, N.A. to our bank group. We will use this additional borrowing capacity, along with our cash flows from operations, to continue to fund our ongoing three-rig drilling program in the Eagle Ford shale and the Permian Basin.
“We look back on 2013 with satisfaction but believe 2014 will be even better as we are expecting significant gains in value from all three of our operating areas. As a result, we are pleased to reaffirm our 2014 guidance metrics previously announced at Analyst Day on December 12, 2013 and reaffirm our belief that 2014 will be another record year for Matador.”
Production and Revenues
Year Ended December 31, 2013 Compared to Year Ended December 31, 2012
Total oil production and average daily oil production for the year ended December 31, 2013 were the best in Matador’s history. Average daily oil production of 5,843 Bbl of oil per day was an increase of 76%, as compared to average daily oil production of 3,317 Bbl of oil per day during the year ended December 31, 2012. This increase in oil production was a direct result of Matador’s drilling operations in the Eagle Ford shale. Average daily oil equivalent production for the year ended December 31, 2013 was 11,740 BOE per day, including 5,843 Bbl of oil per day and 35.4 MMcf of natural gas per day, an increase of 30% as compared to 9,000 BOE per day, including 3,317 Bbl of oil per day and 34.1 MMcf of natural gas per day, for the year ended December 31, 2012. Oil production comprised 50% of total production (using a conversion ratio of one Bbl of oil per six Mcf of natural gas) for the year ended December 31, 2013, as compared to 37% for the year ended December 31, 2012 and 6% for the year ended December 31, 2011.
Total oil and natural gas revenues for the year ended December 31, 2013 were also the highest achieved in the Company’s history. For the year ended December 31, 2013, oil and natural gas revenues were $269.0 million, an increase of 72% from oil and natural gas revenues of $156.0 million for the year ended December 31, 2012. Oil revenues and natural gas revenues increased 72% and 74% to $212.8 million and $56.2 million, respectively, for the year ended December 31, 2013, as compared to $123.7 million and $32.3 million, respectively, for the year ended December 31, 2012. The increase in oil revenues is primarily attributable to the increased oil production, while the increased natural gas revenues are primarily a result of the higher weighted average natural gas price of $4.35 per Mcf realized in 2013, as compared to $2.59 per Mcf realized in 2012. This increase in the realized natural gas price reflects not only the general improvement in natural gas prices during 2013, but also the higher percentage of liquids-rich natural gas produced during 2013. In 2013, the Eagle Ford contributed approximately 42% of the Company’s daily natural gas production, as compared to 12% in 2012.
3
Adjusted EBITDA
Adjusted EBITDA, a non-GAAP financial measure, increased 65% to $191.8 million for the year ended December 31, 2013, as compared to $115.9 million for the year ended December 31, 2012. Adjusted EBITDA increased 28% to $48.8 million in the fourth quarter of 2013 from $38.0 million during the fourth quarter of 2012. Adjusted EBITDA increased 65% year-over-year to $110.3 million for the six months ended December 31, 2013 from $66.7 million for the six months ended December 31, 2012, and increased 35% sequentially, as compared to $81.5 million for the six months ended June 30, 2013.
For a definition of Adjusted EBITDA and a reconciliation of net income (GAAP) and net cash provided by operating activities (GAAP) to Adjusted EBITDA (non-GAAP), please see “Supplemental Non-GAAP Financial Measures” below.
Proved Oil and Natural Gas Reserves and PV-10
Matador’s estimated total proved oil and natural gas reserves were 51.7 million BOE, including 16.4 million Bbl of oil and 212.2 Bcf of natural gas, at December 31, 2013, an increase of 117% in BOE, as compared to estimated total proved reserves of 23.8 million BOE, including 10.5 million Bbl of oil and 80.0 Bcf of natural gas, at December 31, 2012. The Company’s estimated proved oil reserves increased 56% to 16.4 million Bbl at December 31, 2013, as compared to 10.5 million Bbl at December 31, 2012. This growth in proved oil reserves during 2013 was primarily attributable to Matador’s ongoing drilling program in the Eagle Ford shale. During 2013, oil accounted for approximately 50% of Matador’s total production by volume and almost 80% of Matador’s total oil and natural gas revenues. Matador reports its production and proved reserves in two streams: oil and natural gas, including both dry and liquids-rich gas. Where the Company produces liquids-rich natural gas, such as in the Eagle Ford shale and the Permian Basin, the economic value of the natural gas liquids (“NGL”) associated with the natural gas is included as an uplift to the estimated wellhead natural gas price on those properties where the NGL are extracted and sold. At times during 2013, this uplift amounted to as much as $2.50 to $3.00 per Mcf on the Company’s weighted average price received for its natural gas production in the Eagle Ford shale as compared to prices realized for its Haynesville shale and Cotton Valley natural gas production.
Proved natural gas reserves increased to 212.2 Bcf at December 31, 2013 from 80.0 Bcf at December 31, 2012. This large increase in proved natural gas reserves was attributable to the Company’s drilling and completion activities in 2013 and to improvements in natural gas prices during 2013. In 2013, natural gas prices ranged from just above $3.00 per MMBtu to approximately $4.50 per MMBtu, as compared to a range of just below $2.00 per MMBtu to approximately $4.00 per MMBtu during 2012. At June 30, 2012, Matador removed 97.8 Bcf of previously classified proved undeveloped natural gas reserves in the Haynesville shale in Northwest Louisiana from its total proved reserves due to lower natural gas prices. As a result of the continued improvement in natural gas prices throughout 2013, Matador re-classified a portion of these natural gas volumes as proved undeveloped reserves at June 30, 2013 and included additional Haynesville proved undeveloped natural gas reserves in its total proved reserves at December 31, 2013.
Proved developed reserves at December 31, 2013 included 8.3 million Bbl of oil and 53.5 Bcf of natural gas, and proved undeveloped reserves included 8.1 million Bbl of oil and 158.7 Bcf of natural gas. Proved developed reserves comprised 33% of the Company’s total proved oil and natural gas reserves at December 31, 2013. Based on its 2013 year-end proved reserves and its 2013 production of approximately 4.3 million BOE, Matador improved its proved reserves/production (“R/P”) ratio to 12.1 years at December 31, 2013, as compared to 7.2 years at December 31, 2012.
The present value, discounted at 10%, of the estimated future net cash flows before income taxes (“PV-10”) of Matador’s total proved oil and natural gas reserves at December 31, 2013 was $655.2 million, as compared to a PV-10 of $423.2 million at December 31, 2012, an increase of 55%. Matador has steadily increased the PV-10 of its proved reserves at a compounded annual growth rate of 75% since December 31, 2009.
4
For a reconciliation of PV-10 (non-GAAP) to Standardized Measure (GAAP), please see “Supplemental Non-GAAP Financial Measures” below.
Net Income (Loss)
For the year ended December 31, 2013, Matador reported net income (after taxes) of approximately $45.1 million and earnings of $0.77 per common share, as compared to a net loss of approximately $33.3 million and a loss of $0.62 per common share for the year ended December 31, 2012. The Company’s earnings per share for the year ended December 31, 2013 were impacted unfavorably by an unrealized net loss on derivatives of $7.2 million for the year as a whole, as well as a full-cost ceiling impairment charge to operations of $21.2 million recorded during the first quarter of 2013.
For the fourth quarter of 2013, Matador reported net income of approximately $15.4 million and earnings of $0.23 per common share, as compared to a net loss of approximately $21.2 million and a loss of $0.38 per common share in the fourth quarter of 2012. The Company’s earnings per share for the fourth quarter of 2013 were impacted unfavorably by an unrealized loss on derivatives of $0.6 million recorded during the quarter.
Three Months Ended December 31, 2013 Compared to Three Months Ended December 31, 2012
Oil production increased 43% to 608,000 Bbl of oil, or 6,612 Bbl of oil per day, during the fourth quarter of 2013, as compared to 426,000 Bbl of oil, or 4,630 Bbl of oil per day, during the fourth quarter of 2012. This increase in oil production is primarily a result of ongoing drilling operations in the Eagle Ford shale, but also reflects initial production from Matador’s first horizontal Second Bone Spring well in the Permian Basin. Average daily oil equivalent production increased to approximately 12,000 BOE per day (55% oil by volume) as compared to 10,400 BOE per day (45% oil by volume) in the fourth quarter of 2012.
Oil and natural gas revenues increased 32% to $69.7 million in the fourth quarter of 2013, as compared to $52.7 million in the fourth quarter of 2012. This increase in oil and natural gas revenues reflects an increase in oil revenues of $12.7 million coupled with an increase in natural gas revenues of $4.2 million between the respective periods. Oil revenues increased 30% to $55.3 million during the fourth quarter of 2013, as compared to $42.6 million during the fourth quarter of 2012. Natural gas revenues increased 42% to $14.4 million during the fourth quarter of 2013, as compared to $10.1 million during the fourth quarter of 2012.
Sequential Financial Results
• | Oil production was 608,000 Bbl, or 6,612 Bbl of oil per day, in the fourth quarter of 2013, essentially flat as compared to 617,000 Bbl, or 6,703 Bbl of oil per day, in the third quarter of 2013. Natural gas production was approximately 3.0 Bcf, or about 32.1 MMcf per day, in the fourth quarter of 2013, down 21% from 3.7 Bcf, or about 40.7 MMcf per day in the third quarter of 2013. The Company had 15 to 20% of its oil and natural gas production shut in at various times during the fourth quarter of 2013, including some of its operated Haynesville shale natural gas production, while offsetting wells were being drilled and completed, as compared to having almost no production capacity shut in or restricted during the third quarter of 2013. |
• | Oil production increased 35% to 1,225,000 Bbl for the six months ended December 31, 2013, as compared to 908,000 Bbl of oil produced in the six months ended June 30, 2013. |
• | Oil and natural gas revenues decreased 15% to $69.7 million in the fourth quarter of 2013 from $81.9 million in the third quarter of 2013. This decrease was attributable to a decline in the weighted average oil price realized in the fourth quarter of 2013 to $90.91 per Bbl, as compared to a weighted average oil price of $104.15 per Bbl realized in the third quarter of 2013, and to 15 to 20% of the Company’s production capacity being shut in during the fourth quarter. The Company realized a weighted average natural gas price of $4.86 per Mcf in the fourth quarter of 2013, as compared to $4.71 per Mcf during the third quarter of 2013. |
5
• | Oil and natural gas revenues increased 29% to $151.5 million for the six months ended December 31, 2013, as compared to $117.5 million in the six months ended June 30, 2013. |
• | Adjusted EBITDA decreased 21% to $48.8 million in the fourth quarter of 2013, as compared to $61.5 million reported in the third quarter of 2013. This was attributable to the lower weighted average oil price realized in the fourth quarter of 2013 and to the 15 to 20% shut-in production capacity at various times, as compared to the third quarter. |
• | Adjusted EBITDA increased 35% to $110.3 million for the six months ended December 31, 2013, as compared to $81.5 million reported for the six months ended June 30, 2013. |
Operating Expenses Update
Year Ended December 31, 2013 Compared to Year Ended December 31, 2012
Production Taxes and Marketing
Production taxes and marketing expenses increased to $21.0 million (or $4.89 per BOE) for the year ended December 31, 2013, as compared to $11.7 million (or $3.54 per BOE) for the year ended December 31, 2012. The majority of this increase was attributable to increased production taxes associated with the large increase in oil production and oil revenues during 2013 resulting primarily from drilling operations in the Eagle Ford shale in South Texas.
Lease Operating Expenses (“LOE”)
Total lease operating expenses increased to $38.7 million (or $9.04 per BOE) for the year ended December 31, 2013, as compared to $28.2 million (or $8.56 per BOE) for the year ended December 31, 2012. The increase in LOE was primarily attributable to the increase in oil production and the higher lifting costs associated with oil production between the two comparable periods, as well as to the percentage of oil being produced, which was 50% oil by volume for the year ended December 31, 2013, as compared to 37% oil by volume in 2012. Lease operating expenses per unit of production increased only 6% to $9.04 per BOE for the year ended December 31, 2013, as compared to $8.56 per BOE for the year ended December 31, 2012. The Company made significant progress in reducing its LOE throughout 2013, particularly on its Eagle Ford properties. Of note, total LOE declined by 30% to $17.7 million, or $7.55 per BOE, during the final six months of 2013, as compared to $21.0 million, or $10.82 per BOE, during the first six months of 2013.
Depletion, depreciation and amortization (“DD&A”)
Total depletion, depreciation and amortization expenses increased to $98.4 million (or $22.96 per BOE) for the year ended December 31, 2013, as compared to $80.5 million (or $24.43 per BOE) for the year ended December 31, 2012. This increase in total DD&A expenses by 22% reflects the 30% increase in the Company’s total oil and natural gas production in 2013, which was offset by the increase in the Company’s proved oil and natural gas reserves by 117% at December 31, 2013, as compared to December 31, 2012. As a result of this increase in proved reserves, DD&A expenses on a unit-of-production basis actually decreased to $22.96 per BOE for the year ended December 31, 2013, or a decrease of about 6%, from $24.43 per BOE for the year ended December 31, 2012.
General and administrative (“G&A”)
General and administrative expenses increased to $20.8 million (or $4.85 per BOE) for the year ended December 31, 2013, as compared to $14.5 million (or $4.42 per BOE) for the year ended December 31, 2012. The increase in G&A expenses was primarily attributable to a non-cash increase of $3.8 million in stock-based compensation costs to $3.9 million for the year ended December 31, 2013, as compared to $0.1 million for the year ended December
6
31, 2012. The increase in stock-based compensation expense resulted from the continued vesting of awards granted in 2012 and new awards granted in 2013, as well as the increased fair value of liability-based stock options during 2013 due to the increase in the Company’s stock price from $8.20 per share at December 31, 2012 to $18.64 per share at December 31, 2013. The remaining increase in G&A expenses was primarily due to additional payroll expenses associated with new employees added to Matador’s staff during 2013 to support its increased level of operations. At December 31, 2013, Matador had 66 full-time employees, as compared to 50 full-time employees at December 31, 2012.
Operations Update
Eagle Ford Shale - South Texas
During the year ended December 31, 2013, Matador continued to successfully execute its strategy to increase its oil production and reserves, principally through the development of its Eagle Ford shale properties in South Texas. During 2013, the Company completed and began producing oil and natural gas from 32 gross (27.6 net) Eagle Ford wells, including 25 gross (25.0 net) operated and 7 gross (2.6 net) non-operated wells. During the fourth quarter of 2013, the Company completed and began producing oil and natural gas from 9 gross (9.0 net) operated and 3 gross (1.1 net) non-operated wells. These fourth quarter operated completions included four Martin Ranch wells and two Newman wells in La Salle County, two Danysh wells in Karnes County and one Lewton well in DeWitt County. The Company also participated in two non-operated wells on its Troutt acreage and one non-operated well on its Northcut acreage in La Salle County. Several of these wells, including the four Martin Ranch wells and the three non-operated wells, were not placed on production until December, in part due to batch drilling operations, and therefore, these wells did not contribute fully to fourth quarter production. As a result of these cost-saving practices, increased completion activity and other conservative operating practices aimed at protecting the wells during fracturing the wells and maintaining bottomhole pressure, Matador had 15 to 20% of its production capacity shut in or restricted during the fourth quarter of 2013, as compared to having almost no production capacity shut in or restricted during the third quarter.
Over the past two years, Matador believes it has made significant progress and increased its knowledge on how to drill, complete and produce its Eagle Ford wells. During this time, the Company has progressed from drilling wells on single well pads to multi-well pad drilling, and most recently, to multi-well batch drilling. In August 2013, Matador began drilling certain wells on its western Eagle Ford acreage from batch drilled pads using a drilling rig equipped with a “walking” package and, as a result, the Company has achieved improvement in both drilling times and drilling costs. Matador has realized cost savings of approximately $325,000 per well on initial wells drilled using this rig, and expects the use of batch drilling and the “walking” rig will lead to total cost savings of approximately $400,000 per well or more going forward. Recent wells drilled on the Company’s western Eagle Ford acreage in La Salle County have drilling times from spud to total depth of 8 to 10 days per well and costs at or just below $6 million per well. In April 2014, Matador expects to replace the drilling rig currently operating in the central portion of its acreage in Karnes and Wilson Counties with a new “walking” rig. At that time, the Company will have two “walking” rigs operating in the Eagle Ford and will conduct batch drilling operations on its properties using these rigs for the balance of 2014. Recent wells in Matador’s central Eagle Ford acreage have been drilled for between $7.0 and $7.5 million, but the Company expects to see further cost improvements with the initiation of batch drilling operations in this area as well. The Company anticipates that it will drill almost 250,000 lateral feet with two rigs in 2014, as compared to 150,000 feet using two rigs in 2012 and effectively 1.5 rigs in 2013, an increased drilling efficiency of almost 70%.
During 2013, the Company continued to refine the design of its hydraulic fracture treatments to enhance well productivity and ultimate hydrocarbon recovery, increasing fluid volumes to 40 Bbl per foot and proppant volumes to more than 2,000 pounds per foot, while decreasing the spacing between perforation clusters where the fractures are initiated. These Generation 5, and now Generation 6, fracture treatments are resulting in significant improvements in initial well productivity as compared to earlier generation treatment designs. The Company also believes that initiating the use of gas lift relatively early in the life of its newly drilled Eagle Ford wells has
7
accelerated oil production, reduced lease operating expenses, lowered maintenance costs and helped its wells recover faster after being shut in for offset well operations.
The Company’s downspacing program in the Eagle Ford is also providing encouraging results. As of March 12, 2014, Matador has now drilled seven 40 to 50-acre spaced wells on its central acreage in Karnes County. These wells, completed with the Company’s Generation 5 or Generation 6 fracture treatment design, are all performing better initially than earlier wells drilled on these properties using previous generation fracture treatments. Two of these wells were completed and placed on production in the fourth quarter of 2013, and three were completed and placed on production during February 2014. These five wells are all on the Company’s Danysh/Pawelek property. The initial flow rates and flowing pressures of these five wells on comparable choke sizes were better than those observed on the 80-acre wells drilled on these properties, and the flowing pressures observed on these wells suggest minimal to no depletion at these locations from the earlier wells. Two of these wells flowed at approximately 1,100 to 1,200 BOE per day (almost 90% oil) at about 3,500 psi on 14/64th inch chokes during 24-hour initial potential tests, making them two of the best wells drilled by Matador in this area. Based on these results, the Company plans to drill future locations on its central acreage in Karnes and Wilson Counties on 40-acre spacing.
The Company also drilled four additional 40-acre spaced wells on its Martin Ranch lease during the fourth quarter of 2013; all were completed with the Company’s Generation 6 fracture treatment design. The initial flow rates and flowing pressures on three of these wells were comparable to those observed on several of the better 80-acre wells drilled on the property. One of these 40-acre spaced wells, drilled between two of the best wells on the lease, showed some pressure depletion attributable to the nearby producers. These results are comparable with other initial 40-acre tests at Martin Ranch. Several 40-acre wells showed little sign of pressure interference while others, especially those infill wells drilled near the best wells in the center of the property, have exhibited some pressure depletion.
Given the incremental recovery associated with these infill wells, the accelerated oil production from the property as a whole, and the significant improvement in well costs currently being achieved, the Company believes the continued development of the Martin Ranch lease on 40-acre spacing using batch drilling and Generation 6 or later fracture treatment designs will be the best way to optimize oil recovery and overall project economics. In addition, as the Company drills new wells in the northern and southern portions of the Martin Ranch lease, there are fewer true infill wells to be drilled. The Company expects these wells to encounter essentially original reservoir pressure and to be stimulated with a Generation 6 or later fracture treatment design tailored to its 40-acre development plans. The Company will also continue to test 40-acre spacing on its other properties in northwest La Salle County.
At March 12, 2014, the Company was running two contracted drilling rigs in the Eagle Ford - one in La Salle County and one in southern Wilson County - and plans to run two rigs in South Texas throughout 2014. The Company plans to direct 72%, or about $318 million, of its 2014 estimated capital expenditures of $440 million to the Eagle Ford shale, and expects that the Eagle Ford will continue to be the primary driver of the Company’s growth in 2014.
Permian Basin - Southeast New Mexico and West Texas
Matador is pleased to announce today the initial results from its third horizontal well in the Permian Basin. The Rustler Breaks 12-24-27 #1H well, the Company’s first well in Eddy County, New Mexico, flowed 987 BOE per day (44% oil), including 436 Bbl of oil per day and 3.3 MMcf of natural gas per day at 3,000 psi on a 24/64th inch choke during a 24-hour initial potential test. The Rustler Breaks 12-24-27 #1H well is a 4,500-ft horizontal lateral testing the Wolfcamp “B” formation at approximately 9,800 feet vertical depth. This well was completed with a 19-stage hydraulic fracture treatment, including 180,000 Bbl of fluid and 8.5 million pounds of proppant. The Wolfcamp “B” formation is a geopressured reservoir having an estimated bottomhole pressure gradient of approximately 0.7 psi per foot, implying a reservoir pressure of about 6,900 psi. The Company is pleased by this well’s early test results, which include significantly better oil and natural gas flow rates at a higher flowing surface pressure on comparable choke sizes as compared to Wolfcamp “B” tests by other operators in the immediate vicinity.
8
The Company continues to be pleased with the performance to date of its first two horizontal wells in the Permian Basin. The Ranger State 33 State Com #1H well, completed in the Second Bone Spring sand in Lea County, New Mexico, was placed on production in late October 2013 and has continued to exhibit strong performance since that time. In the past several weeks, the well has continued to produce between 450 and 500 Bbl of oil per day, and in about four months on production, including its initial cleanup phase, the Ranger 33 State Com #1H well has already produced almost 63,000 BOE (90% oil), including almost 57,000 Bbl of oil, and continues to flow with gas lift assist. The Dorothy White #1H well, completed in the Wolfcamp “A” formation in Loving County, Texas, exhibited a 30-day flow rate of 1,019 BOE per day, including 678 Bbl of oil per day and 2.05 MMcf of natural gas per day. In about two months on production, including its initial cleanup phase, the Dorothy White #1H well has already produced almost 56,000 BOE (66% oil), including almost 37,000 Bbl of oil, and continues to flow at almost 3,000 psi surface pressure.
Matador plans to run one contracted drilling rig in the western Permian Basin, primarily in Lea and Eddy Counties, New Mexico and Loving County, Texas, targeting the Bone Spring and Wolfcamp plays throughout 2014 to further evaluate and delineate its acreage position. The Company has allocated about 25% of its 2014 capital expenditure budget of $440 million, or approximately $109 million, to the testing of its acreage and the acquisition of additional leasehold in the Permian Basin in 2014. Matador plans to drill 12 gross (9.8 net) wells across its various leasehold positions in the western Permian Basin in 2014. At March 12, 2014, Matador is currently drilling the Pickard 20-18-24 #2H well, which is planned to be a Wolfcamp “D” test, in the northern portion of its Ranger/Querecho Plains prospect area in Lea County, New Mexico.
Acreage Acquisitions
At December 31, 2013, Matador held 70,800 gross (44,800 net) acres in the Permian Basin, primarily in Lea and Eddy Counties, New Mexico and Loving County, Texas. Between January 1 and March 12, 2014, the Company has acquired an additional 7,000 gross (5,300 net) acres in Southeast New Mexico and West Texas, bringing Matador’s total Permian Basin acreage position to 77,800 gross (50,100 net) acres. At March 12, 2014, these acreage totals included approximately 13,700 gross (9,800 net) acres in Matador’s Ranger/Querecho Plains area in Lea County, 14,200 gross (10,100 net) acres in its Indian Draw/Rustler Breaks area in Eddy County, 5,400 gross (3,500 net) acres in its Wolf area in Loving County and 32,100 gross (21,800 net) acres in its Twin Lakes area in Lea County. Matador also is continuing to pursue opportunistic acquisitions in the Eagle Ford and Haynesville areas.
Liquidity Update
At December 31, 2013, Matador had cash totaling approximately $6.3 million, the borrowing base under the Company’s revolving credit facility was $350.0 million and the Company had $200.0 million of outstanding long-term borrowings and approximately $0.3 million in outstanding letters of credit. These borrowings bore interest at an effective interest rate of approximately 3.3% per annum.
During the first quarter of 2014, Matador’s lenders completed their review of the Company’s total proved oil and natural gas reserves at December 31, 2013, and as a result, on March 12, 2014, the borrowing base under the Company’s revolving credit facility was increased to $385.0 million, and the conforming borrowing base was increased to $310.0 million. From January 1 through March 12, 2014, Matador borrowed an additional $50.0 million under the Credit Agreement to finance a portion of its working capital requirements and capital expenditures. At March 12, 2014, Matador had $250.0 million of outstanding long-term borrowings and approximately $0.3 million in outstanding letters of credit.
Hedging Positions
From time to time, Matador uses derivative financial instruments to mitigate its exposure to commodity price risk associated with oil, natural gas and natural gas liquids prices and to protect its cash flows and borrowing capacity.
9
At March 12, 2014, Matador had the following hedges in place, in the form of costless collars and swaps, for the remainder of 2014.
• | Approximately 2.0 million Bbl of oil at a weighted average floor price of $88 per Bbl and a weighted average ceiling price of $99 per Bbl. |
• | Approximately 9.9 Bcf of natural gas at a weighted average floor price of $3.50 per MMBtu and a weighted average ceiling price of $4.93 per MMBtu. |
• | Approximately 6.4 million gallons of natural gas liquids at a weighted average price of $1.25 per gallon. |
2014 Guidance Affirmation
Matador affirms the 2014 guidance estimates previously announced at its Analyst Day presentation on
December 12, 2013, including (1) capital expenditures of $440 million, (2) total oil production of 2.8 to 3.1 million Bbl, (3) total natural gas production of 13.5 to 15.0 billion cubic feet, (4) oil and natural gas revenues of $325 to $355 million and (5) Adjusted EBITDA of $235 to $265 million. Oil and natural gas revenues and Adjusted EBITDA guidance are based on an estimated realized oil price of $95.00 per barrel and an estimated realized natural gas price of $4.25 per Mcf for 2014.
Conference Call Information
The Company will host a conference call on Thursday, March 13, 2014, at 9:00 a.m. Central Time to discuss its fourth quarter and full year 2013 financial and operational results. To access the conference call, domestic participants should dial (866) 515-2915 and international participants should dial (617) 399-5129. The participant passcode is 92441224. The conference call will also be available through the Company’s website at www.matadorresources.com on the Presentations & Webcasts page under the Investors tab. Domestic participants accessing the telephonic replay should dial (888) 286-8010 and international participants should dial (617) 801-6888. The participant passcode is 35659378. The replay for the event will also be available on the Company’s website at www.matadorresources.com through Thursday, April 3, 2014.
About Matador Resources Company
Matador is an independent energy company engaged in the exploration, development, production and acquisition of oil and natural gas resources in the United States, with an emphasis on oil and natural gas shale and other unconventional plays. Its current operations are focused primarily on the oil and liquids-rich portion of the Eagle Ford shale play in South Texas and the Wolfcamp and Bone Spring plays in the Permian Basin in Southeast New Mexico and West Texas. Matador also operates in the Haynesville shale and Cotton Valley plays in Northwest Louisiana and East Texas. In addition, Matador has a large exploratory leasehold position in Southwest Wyoming and adjacent areas of Utah and Idaho where it is testing the Meade Peak shale.
For more information, visit Matador Resources Company at www.matadorresources.com.
Forward-Looking Statements
This press release includes “forward-looking statements” within the meaning of Section 27A of the Securities Act of 1933, as amended, and Section 21E of the Securities Exchange Act of 1934, as amended. “Forward-looking statements” are statements related to future, not past, events. Forward-looking statements are based on current expectations and include any statement that does not directly relate to a current or historical fact. In this context, forward-looking statements often address expected future business and financial performance, and often contain words such as “could,” “believe,” “would,” “anticipate,” “intend,” “estimate,” “expect,” “may,” “should,” “continue,” “plan,” “predict,” “potential,” “project” and similar expressions that are intended to identify forward-looking statements, although not all forward-looking statements contain such identifying words. Actual results and future events could differ materially from those anticipated in such statements, and such forward-looking statements may not prove to be accurate. These forward-looking statements involve certain risks and uncertainties, including,
10
but not limited to, the following risks related to financial and operational performance: general economic conditions; the Company’s ability to execute its business plan, including whether its drilling program is successful; changes in oil, natural gas and natural gas liquids prices and the demand for oil, natural gas and natural gas liquids; its ability to replace reserves and efficiently develop current reserves; costs of operations; delays and other difficulties related to producing oil, natural gas and natural gas liquids; its ability to make acquisitions on economically acceptable terms; availability of sufficient capital to execute its business plan, including from future cash flows, increases in its borrowing base and otherwise; weather and environmental conditions; and other important factors which could cause actual results to differ materially from those anticipated or implied in the forward-looking statements. For further discussions of risks and uncertainties, you should refer to Matador’s SEC filings, including the “Risk Factors” section of Matador’s most recent Annual Report on Form 10-K and any subsequent Quarterly Reports on Form 10-Q. Matador undertakes no obligation and does not intend to update these forward-looking statements to reflect events or circumstances occurring after the date of this press release, except as required by law, including the securities laws of the United States and the rules and regulations of the SEC. You are cautioned not to place undue reliance on these forward-looking statements, which speak only as of the date of this press release. All forward-looking statements are qualified in their entirety by this cautionary statement.
Contact Information
Mac Schmitz
Investor Relations
(972) 371-5225
mschmitz@matadorresources.com
11
Matador Resources Company and Subsidiaries
CONSOLIDATED BALANCE SHEETS - UNAUDITED
(In thousands, except par value and share data) | December 31, | ||||||||
2013 | 2012 | ||||||||
ASSETS | |||||||||
Current assets | |||||||||
Cash | $ | 6,287 | $ | 2,095 | |||||
Certificates of deposit | — | 230 | |||||||
Accounts receivable | |||||||||
Oil and natural gas revenues | 25,823 | 24,422 | |||||||
Joint interest billings | 4,785 | 4,118 | |||||||
Other | 1,066 | 974 | |||||||
Derivative instruments | 19 | 4,378 | |||||||
Deferred income taxes | 1,636 | — | |||||||
Lease and well equipment inventory | 785 | 877 | |||||||
Prepaid expenses | 1,771 | 1,103 | |||||||
Total current assets | 42,172 | 38,197 | |||||||
Property and equipment, at cost | |||||||||
Oil and natural gas properties, full-cost method | |||||||||
Evaluated | 1,090,656 | 763,527 | |||||||
Unproved and unevaluated | 194,306 | 149,675 | |||||||
Other property and equipment | 29,910 | 27,258 | |||||||
Less accumulated depletion, depreciation and amortization | (468,995 | ) | (349,370 | ) | |||||
Net property and equipment | 845,877 | 591,090 | |||||||
Other assets | |||||||||
Derivative instruments | 173 | 771 | |||||||
Deferred income taxes | — | 411 | |||||||
Other assets | 2,108 | 1,560 | |||||||
Total other assets | 2,281 | 2,742 | |||||||
Total assets | $ | 890,330 | $ | 632,029 | |||||
LIABILITIES AND SHAREHOLDERS’ EQUITY | |||||||||
Current liabilities | |||||||||
Accounts payable | $ | 25,358 | $ | 28,120 | |||||
Accrued liabilities | 63,987 | 59,179 | |||||||
Royalties payable | 7,798 | 6,541 | |||||||
Derivative instruments | 2,692 | 670 | |||||||
Advances from joint interest owners | — | 1,515 | |||||||
Deferred income taxes | — | 411 | |||||||
Income taxes payable | 404 | — | |||||||
Other current liabilities | 88 | 56 | |||||||
Total current liabilities | 100,327 | 96,492 | |||||||
Long-term liabilities | |||||||||
Borrowings under Credit Agreement | 200,000 | 150,000 | |||||||
Asset retirement obligations | 7,309 | 5,109 | |||||||
Derivative instruments | 253 | — | |||||||
Deferred income taxes | 10,929 | — | |||||||
Other long-term liabilities | 2,588 | 1,324 | |||||||
Total long-term liabilities | 221,079 | 156,433 | |||||||
Shareholders’ equity | |||||||||
Common stock — Class A, $0.01 par value, 80,000,000 shares authorized; 66,958,867 and 56,778,718 shares issued; and 65,652,690, and 55,577,667 shares outstanding, respectively | 670 | 568 | |||||||
Additional paid-in capital | 548,935 | 404,311 | |||||||
Retained earnings (deficit) | 30,084 | (15,010 | ) | ||||||
Treasury stock, at cost, 1,306,177 and 1,201,051 shares, respectively | (10,765 | ) | (10,765 | ) | |||||
Total shareholders’ equity | 568,924 | 379,104 | |||||||
Total liabilities and shareholders’ equity | $ | 890,330 | $ | 632,029 | |||||
12
Matador Resources Company and Subsidiaries
CONSOLIDATED STATEMENTS OF OPERATIONS - UNAUDITED
(In thousands, except per share data) | For the Years Ended December 31, | ||||||||||||
2013 | 2012 | 2011 | |||||||||||
Revenues | |||||||||||||
Oil and natural gas revenues | $ | 269,030 | $ | 155,998 | $ | 67,000 | |||||||
Realized (loss) gain on derivatives | (909 | ) | 13,960 | 7,106 | |||||||||
Unrealized (loss) gain on derivatives | (7,232 | ) | (4,802 | ) | 5,138 | ||||||||
Total revenues | 260,889 | 165,156 | 79,244 | ||||||||||
Expenses | |||||||||||||
Production taxes and marketing | 20,973 | 11,672 | 6,278 | ||||||||||
Lease operating | 38,720 | 28,184 | 7,244 | ||||||||||
Depletion, depreciation and amortization | 98,395 | 80,454 | 31,754 | ||||||||||
Accretion of asset retirement obligations | 348 | 256 | 209 | ||||||||||
Full-cost ceiling impairment | 21,229 | 63,475 | 35,673 | ||||||||||
General and administrative | 20,779 | 14,543 | 13,394 | ||||||||||
Total expenses | 200,444 | 198,584 | 94,552 | ||||||||||
Operating income (loss) | 60,445 | (33,428 | ) | (15,308 | ) | ||||||||
Other income (expense) | |||||||||||||
Net loss on asset sales and inventory impairment | (192 | ) | (485 | ) | (154 | ) | |||||||
Interest expense | (5,687 | ) | (1,002 | ) | (683 | ) | |||||||
Interest and other income | 225 | 224 | 315 | ||||||||||
Total other (expense) income | (5,654 | ) | (1,263 | ) | (522 | ) | |||||||
Income (loss) before income taxes | 54,791 | (34,691 | ) | (15,830 | ) | ||||||||
Income tax provision (benefit) | |||||||||||||
Current | 404 | — | (46 | ) | |||||||||
Deferred | 9,293 | (1,430 | ) | (5,475 | ) | ||||||||
Total income tax provision (benefit) | 9,697 | (1,430 | ) | (5,521 | ) | ||||||||
Net income (loss) | $ | 45,094 | $ | (33,261 | ) | $ | (10,309 | ) | |||||
Earnings (loss) per common share | |||||||||||||
Basic | |||||||||||||
Class A | $ | 0.77 | $ | (0.62 | ) | $ | (0.25 | ) | |||||
Class B | $ | — | $ | (0.35 | ) | $ | 0.02 | ||||||
Diluted | |||||||||||||
Class A | $ | 0.77 | $ | (0.62 | ) | $ | (0.25 | ) | |||||
Class B | $ | — | $ | (0.35 | ) | $ | 0.02 | ||||||
Weighted average common shares outstanding | |||||||||||||
Basic | |||||||||||||
Class A | 58,777 | 53,852 | 41,687 | ||||||||||
Class B | — | 105 | 1,031 | ||||||||||
Total | 58,777 | 53,957 | 42,718 | ||||||||||
Diluted | |||||||||||||
Class A | 58,929 | 53,852 | 41,687 | ||||||||||
Class B | — | 105 | 1,031 | ||||||||||
Total | 58,929 | 53,957 | 42,718 | ||||||||||
13
Matador Resources Company and Subsidiaries
CONSOLIDATED STATEMENTS OF CASH FLOWS - UNAUDITED
(In thousands) | For the Years Ended December 31, | |||||||||||||
2013 | 2012 | 2011 | ||||||||||||
Operating activities | ||||||||||||||
Net income (loss) | $ | 45,094 | $ | (33,261 | ) | $ | (10,309 | ) | ||||||
Adjustments to reconcile net income (loss) to net cash provided by operating activities | ||||||||||||||
Unrealized loss (gain) on derivatives | 7,232 | 4,802 | (5,138 | ) | ||||||||||
Depletion, depreciation and amortization | 98,395 | 80,454 | 31,754 | |||||||||||
Accretion of asset retirement obligations | 348 | 256 | 209 | |||||||||||
Full-cost ceiling impairment | 21,229 | 63,475 | 35,673 | |||||||||||
Stock-based compensation expense | 3,897 | 140 | 2,406 | |||||||||||
Deferred income tax provision (benefit) | 9,293 | (1,430 | ) | (5,475 | ) | |||||||||
Loss on asset sales and inventory impairment | 192 | 485 | 154 | |||||||||||
Changes in operating assets and liabilities | ||||||||||||||
Accounts receivable | (2,160 | ) | (16,342 | ) | (1,523 | ) | ||||||||
Lease and well equipment inventory | 243 | 50 | 21 | |||||||||||
Prepaid expenses | (668 | ) | 50 | 650 | ||||||||||
Other assets | (548 | ) | (673 | ) | (814 | ) | ||||||||
Accounts payable, accrued liabilities and other current liabilities | (3,638 | ) | 19,740 | 13,497 | ||||||||||
Royalties payable | 1,257 | 4,685 | 873 | |||||||||||
Advances from joint interest owners | (1,515 | ) | 1,515 | (723 | ) | |||||||||
Income taxes payable | 404 | — | — | |||||||||||
Other long-term liabilities | 415 | 282 | 613 | |||||||||||
Net cash provided by operating activities | 179,470 | 124,228 | 61,868 | |||||||||||
Investing activities | ||||||||||||||
Oil and natural gas properties capital expenditures | (363,192 | ) | (300,689 | ) | (156,431 | ) | ||||||||
Expenditures for other property and equipment | (3,977 | ) | (7,332 | ) | (4,671 | ) | ||||||||
Purchases of certificates of deposit | (61 | ) | (496 | ) | (4,298 | ) | ||||||||
Maturities of certificates of deposit | 291 | 1,601 | 5,312 | |||||||||||
Net cash used in investing activities | (366,939 | ) | (306,916 | ) | (160,088 | ) | ||||||||
Financing activities | ||||||||||||||
Repayments of borrowings under Credit Agreement | (130,000 | ) | (123,000 | ) | (103,000 | ) | ||||||||
Borrowings under Credit Agreement | 180,000 | 160,000 | 191,000 | |||||||||||
Proceeds from issuance of common stock | 149,069 | 146,510 | 592 | |||||||||||
Swing sale profit contribution | — | 24 | — | |||||||||||
Cost to issue equity | (7,390 | ) | (11,599 | ) | (1,710 | ) | ||||||||
Proceeds from stock options exercised | — | 2,660 | 837 | |||||||||||
Taxes paid related to net share settlement of stock-based compensation | (18 | ) | — | — | ||||||||||
Payment of dividends — Class B | — | (96 | ) | (275 | ) | |||||||||
Net cash provided by financing activities | 191,661 | 174,499 | 87,444 | |||||||||||
Increase (decrease) in cash | 4,192 | (8,189 | ) | (10,776 | ) | |||||||||
Cash at beginning of year | 2,095 | 10,284 | 21,060 | |||||||||||
Cash at end of year | $ | 6,287 | $ | 2,095 | $ | 10,284 | ||||||||
14
Matador Resources Company and Subsidiaries
SELECTED OPERATING DATA - UNAUDITED
Year Ended December 31, | |||||||||||||
2013 | 2012 | 2011 | |||||||||||
Net Production Volumes:(1) | |||||||||||||
Oil (MBbl) | 2,133 | 1,214 | 154 | ||||||||||
Natural gas (Bcf) | 12.9 | 12.5 | 14.5 | ||||||||||
Total oil equivalent (MBOE)(2),(3) | 4,285 | 3,294 | 2,573 | ||||||||||
Average daily production (BOE/d)(3) | 11,740 | 9,000 | 7,049 | ||||||||||
Average Sales Prices: | |||||||||||||
Oil, with realized derivatives (per Bbl) | $ | 98.67 | $ | 103.55 | $ | 93.80 | |||||||
Oil, without realized derivatives (per Bbl) | $ | 99.79 | $ | 101.86 | $ | 93.80 | |||||||
Natural gas, with realized derivatives (per Mcf) | $ | 4.47 | $ | 3.55 | $ | 4.11 | |||||||
Natural gas, without realized derivatives (per Mcf) | $ | 4.35 | $ | 2.59 | $ | 3.62 | |||||||
Operating Expenses (per BOE): | |||||||||||||
Production taxes and marketing | $ | 4.89 | $ | 3.54 | $ | 2.44 | |||||||
Lease operating | $ | 9.04 | $ | 8.56 | $ | 2.82 | |||||||
Depletion, depreciation and amortization | $ | 22.96 | $ | 24.43 | $ | 12.34 | |||||||
General and administrative | $ | 4.85 | $ | 4.42 | $ | 5.21 | |||||||
(1) Production volumes and proved reserves reported in two streams: oil and natural gas, including both dry and liquids-rich natural gas. | |||||||||||||
(2) Thousands of barrels of oil equivalent. | |||||||||||||
(3) Estimated using a conversion ratio of one Bbl of oil per six Mcf of natural gas. | |||||||||||||
SELECTED ESTIMATED PROVED RESERVES DATA - UNAUDITED
At December 31, | |||||||||||
2013 | 2012 | 2011 | |||||||||
Estimated proved reserves:(1),(2) | |||||||||||
Oil (MBbl) | 16,362 | 10,485 | 3,794 | ||||||||
Natural Gas (Bcf) | 212.2 | 80.0 | 170.4 | ||||||||
Total (MBOE)(3) | 51,729 | 23,819 | 32,196 | ||||||||
Estimated proved developed reserves: | |||||||||||
Oil (MBbl) | 8,258 | 4,764 | 1,419 | ||||||||
Natural Gas (Bcf) | 53.5 | 54.0 | 56.5 | ||||||||
Total (MBOE)(3) | 17,168 | 13,771 | 10,843 | ||||||||
Percent developed | 33.2 | % | 57.8 | % | 33.7 | % | |||||
Estimated proved undeveloped reserves: | |||||||||||
Oil (MBbl) | 8,104 | 5,721 | 2,375 | ||||||||
Natural Gas (Bcf) | 158.7 | 26.0 | 113.9 | ||||||||
Total (MBOE)(3) | 34,561 | 10,048 | 21,353 | ||||||||
PV-10 (in millions) | $ | 655.2 | $ | 423.2 | $ | 248.7 | |||||
Standardized Measure (in millions) | $ | 578.7 | $ | 394.6 | $ | 215.5 | |||||
(1) Numbers in table may not total due to rounding. | |||||||||||
(2) Production volumes and proved reserves reported in two streams: oil and natural gas, including both dry and liquids-rich natural gas. | |||||||||||
(3) Thousands of barrels of oil equivalent, estimated using a conversion ratio of one Bbl of oil per six Mcf of natural gas. | |||||||||||
15
Supplemental Non-GAAP Financial Measures
Adjusted EBITDA
This press release includes the non-GAAP financial measure of Adjusted EBITDA. Adjusted EBITDA is a supplemental non-GAAP financial measure that is used by management and external users of consolidated financial statements, such as industry analysts, investors, lenders and rating agencies. “GAAP” means Generally Accepted Accounting Principles in the United States of America. The Company believes Adjusted EBITDA helps it evaluate its operating performance and compare its results of operations from period to period without regard to its financing methods or capital structure. The Company defines Adjusted EBITDA as earnings before interest expense, income taxes, depletion, depreciation and amortization, accretion of asset retirement obligations, property impairments, unrealized derivative gains and losses, certain other non-cash items and non-cash stock-based compensation expense, and net gain or loss on asset sales and inventory impairment. Adjusted EBITDA is not a measure of net income (loss) or net cash provided by operating activities as determined by GAAP.
Adjusted EBITDA should not be considered an alternative to, or more meaningful than, net income (loss) or net cash provided by operating activities as determined in accordance with GAAP or as an indicator of the Company’s operating performance or liquidity. Certain items excluded from Adjusted EBITDA are significant components of understanding and assessing a company’s financial performance, such as a company’s cost of capital and tax structure. Adjusted EBITDA may not be comparable to similarly titled measures of another company because all companies may not calculate Adjusted EBITDA in the same manner. The following table presents the calculation of Adjusted EBITDA and the reconciliation of Adjusted EBITDA to the GAAP financial measures of net income (loss) and net cash provided by operating activities, respectively, that are of a historical nature. Where references are forward-looking or prospective in nature, and not based on historical fact, the table does not provide a reconciliation. The Company could not provide such reconciliation without undue hardship because the forward-looking Adjusted EBITDA numbers included in this press release are estimations, approximations and/or ranges. In addition, it would be difficult for the Company to present a detailed reconciliation on account of many unknown variables for the reconciling items.
16
Year Ended December 31, | Six Months Ended | Three Months Ended | ||||||||||||||||||||||||||||||||||
(In thousands) | 2013 | 2012 | 2011 | 12/31/2013 | 6/30/2013 | 12/31/2012 | 6/30/2012 | 12/31/2011 | 12/31/2013 | 9/30/2013 | 12/31/2012 | |||||||||||||||||||||||||
Unaudited Adjusted EBITDA Reconciliation to Net Income (Loss): | ||||||||||||||||||||||||||||||||||||
Net (loss) income | $ | 45,094 | $ | (33,261 | ) | $ | (10,309 | ) | $ | 35,479 | $ | 9,615 | $ | (30,385 | ) | $ | (2,875 | ) | $ | 10,135 | $ | 15,374 | $ | 20,105 | $ | (21,188 | ) | |||||||||
Interest expense | 5,687 | 1,002 | 683 | 2,806 | 2,881 | 693 | 309 | 393 | 768 | 2,038 | 549 | |||||||||||||||||||||||||
Total income tax provision (benefit) | 9,697 | (1,430 | ) | (5,521 | ) | 9,619 | 78 | (781 | ) | (649 | ) | 1,430 | 7,056 | 2,563 | (188 | ) | ||||||||||||||||||||
Depletion, depreciation and amortization | 98,395 | 80,454 | 31,754 | 49,929 | 48,466 | 49,335 | 31,119 | 16,463 | 23,802 | 26,127 | 27,655 | |||||||||||||||||||||||||
Accretion of asset retirement obligations | 348 | 256 | 209 | 186 | 162 | 145 | 111 | 113 | 100 | 86 | 86 | |||||||||||||||||||||||||
Full-cost ceiling impairment | 21,229 | 63,475 | 35,673 | — | 21,229 | 30,270 | 33,205 | — | — | — | 26,674 | |||||||||||||||||||||||||
Unrealized loss (gain) on derivatives | 7,232 | 4,802 | (5,138 | ) | 9,933 | (2,701 | ) | 16,646 | (11,844 | ) | (6,474 | ) | 606 | 9,327 | 3,653 | |||||||||||||||||||||
Stock-based compensation expense | 3,897 | 140 | 2,406 | 2,373 | 1,524 | 312 | (172 | ) | 2,225 | 1,134 | 1,239 | 363 | ||||||||||||||||||||||||
Net (gain) loss on asset sales and inventory impairment | 192 | 485 | 154 | — | 192 | 425 | 60 | 154 | — | — | 425 | |||||||||||||||||||||||||
Adjusted EBITDA | $ | 191,771 | $ | 115,923 | $ | 49,911 | $ | 110,325 | $ | 81,446 | $ | 66,660 | $ | 49,264 | $ | 24,439 | $ | 48,840 | $ | 61,485 | $ | 38,029 | ||||||||||||||
Year Ended December 31, | Six Months Ended | Three Months Ended | ||||||||||||||||||||||||||||||||||
(In thousands) | 2013 | 2012 | 2011 | 12/31/2013 | 6/30/2013 | 12/31/2012 | 6/30/2012 | 12/31/2011 | 12/31/2013 | 9/30/2013 | 12/31/2012 | |||||||||||||||||||||||||
Unaudited Adjusted EBITDA Reconciliation to Net Cash Provided by Operating Activities: | ||||||||||||||||||||||||||||||||||||
Net cash provided by operating activities | $ | 179,470 | $ | 124,228 | $ | 61,868 | $ | 95,558 | $ | 83,912 | $ | 72,702 | $ | 51,526 | $ | 42,337 | $ | 52,278 | $ | 43,280 | $ | 43,903 | ||||||||||||||
Net change in operating assets and liabilities | 6,210 | (9,307 | ) | (12,594 | ) | 11,635 | (5,425 | ) | (6,735 | ) | (2,571 | ) | (18,291 | ) | (3,630 | ) | 15,265 | (6,235 | ) | |||||||||||||||||
Interest expense | 5,687 | 1,002 | 683 | 2,806 | 2,881 | 693 | 309 | 393 | 768 | 2,038 | 549 | |||||||||||||||||||||||||
Current income tax provision (benefit) | 404 | — | (46 | ) | 326 | 78 | — | — | — | (576 | ) | 902 | (188 | ) | ||||||||||||||||||||||
Adjusted EBITDA | $ | 191,771 | $ | 115,923 | $ | 49,911 | $ | 110,325 | $ | 81,446 | $ | 66,660 | $ | 49,264 | $ | 24,439 | $ | 48,840 | $ | 61,485 | $ | 38,029 | ||||||||||||||
PV-10
PV-10 is a non-GAAP financial measure and generally differs from Standardized Measure, the most directly comparable GAAP financial measure, because it does not include the effects of income taxes on future net revenues. PV-10 is not an estimate of the fair market value of the Company’s properties. Matador and others in the industry use PV-10 as a measure to compare the relative size and value of proved reserves held by companies and of the potential return on investment related to the companies’ properties without regard to the specific tax characteristics of such entities. The PV-10 at December 31, 2013, December 31, 2012, December 31, 2011, December 31, 2010 and December 31, 2009 were, in millions, $655.2, $423.2, $248.7, $119.9 and $70.4, respectively, and may be reconciled to the Standardized Measure of discounted future net cash flows at such dates by reducing PV-10 by the discounted future income taxes associated with such reserves. The discounted future income taxes at December 31, 2013, December 31, 2012, December 31, 2011, December 31, 2010 and December 31, 2009 were, in millions, $76.5, $28.6, $33.2, $8.8 and $5.3, respectively.
17
18