Attached files
| file | filename |
|---|---|
| EX-14 - EX-14 - MYERS INDUSTRIES INC | d691118dex14.htm |
| 8-K - FORM 8-K - MYERS INDUSTRIES INC | d691118d8k.htm |
 Myers
Industries, Inc. Investor Presentation
March 2014
Exhibit 99.1 |
 Forward Looking
Statements 2
Statements in this presentation concerning the Company’s goals, strategies, and expectations for
business and financial results may be "forward-looking statements" within the
meaning of the Private Securities Litigation Reform Act of 1995 and are based on current
indicators and expectations. Whenever you read a statement that is not simply a statement of historical fact (such as when
we describe what we "believe," "expect," or "anticipate" will occur, and other
similar statements), you must remember that our expectations may not be correct, even though we
believe they are reasonable. We do not guarantee that the transactions and events
described will happen as described (or that they will happen at all). You should review this presentation with the
understanding that actual future results may be materially different from what we expect. Many
of the factors that will determine these results are beyond our ability to control or
predict. You are cautioned not to put undue reliance on any forward-looking
statement. We do not intend, and undertake no obligation, to update these forward-looking
statements. These statements involve a number of risks and uncertainties that could cause
actual results to differ materially from those expressed or implied in the applicable
statements. Such risks include:
(1) Fluctuations in product demand and market acceptance (2) Uncertainties
associated with the general economic conditions in domestic and international markets
(3) Increased competition in our markets (4) Changes in
seasonality (5) Difficulties in manufacturing operations, such as production outages or maintenance programs (6) Raw material
availability (7)
Fluctuations in raw material costs; fluctuations outside the “normal” range of industry cycles
(8) Changes in laws and regulations and approvals and decisions of courts, regulators, and
governmental bodies Myers Industries,
Inc. encourages investors to learn more about these risk factors. A detailed explanation
of these factors is available in the Company’s publicly filed quarterly and annual reports,
which can be found online at www.myersindustries.com and at the SEC.gov web site. |
 Strategic
Goals Strategic & Financial Goals to Drive Shareholder Value
•
Focus
on
industries
that
have
strong,
sustainable growth and profit
potential
•
Position
our businesses to grow
through new products, geographic
expansion and acquisitions
•
Invest
within
our
five
business
growth platforms for value creation
•
Maintain
a strong and flexible
balance sheet, providing funds for
acquisitions and returns to
shareholders
•
Optimize
Lawn & Garden with Phase
1 and Phase 2 projects
3
•
Sales
Growth
>
1.5x
GDP
•
Gross
Margin
>
29%
•
EPS
Growth > 20%
CAGR •
Free
Cash
Flow
100%
of
Net
Income
•
ROIC
>
Cost
of
Capital
•
L&G
to
return
Cost
of
Capital
in
2015
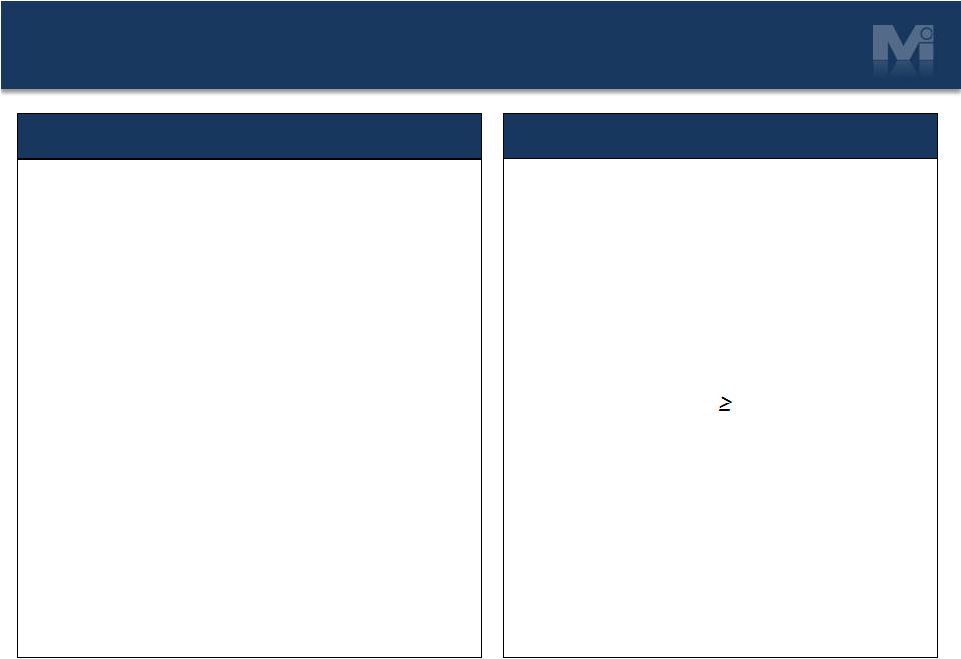
Financial Goals |
 Company at a
Glance 4
2013 Net Sales
2013
Adjusted
EBIT
Material Handling
Lawn & Garden
Engineered Products
Distribution
Two core businesses; four
reporting segments:
1.
Manufacturer of polymer
products
1.
Material Handling
2.
Engineered Products
3.
Lawn and Garden
2.
Wholesale distributor
4.
Distribution
Restructuring in Process
50%
14%
17%
19%
39%
25%
21%
15% |
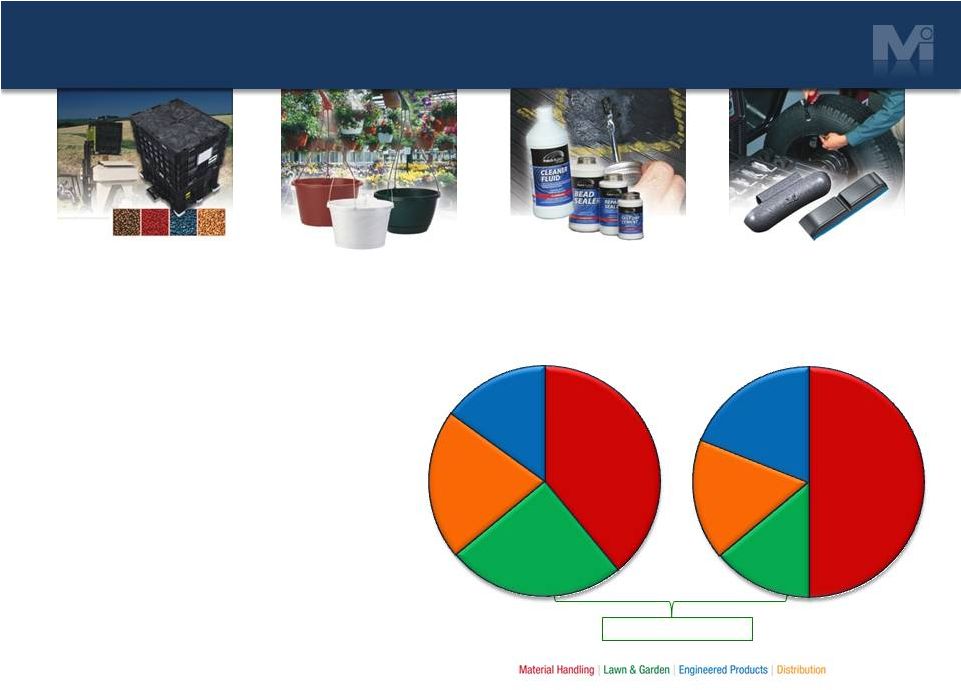
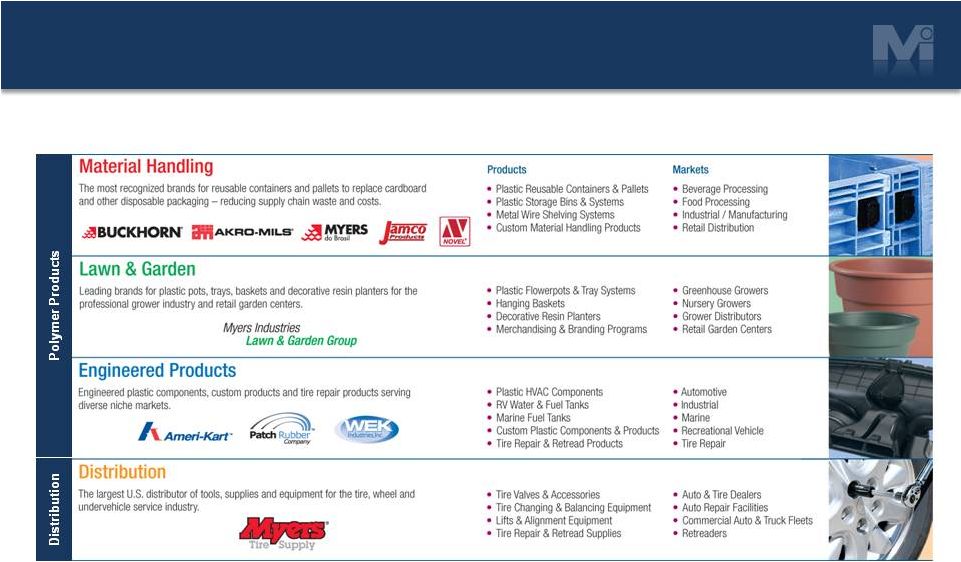 Business
Segments 5 |
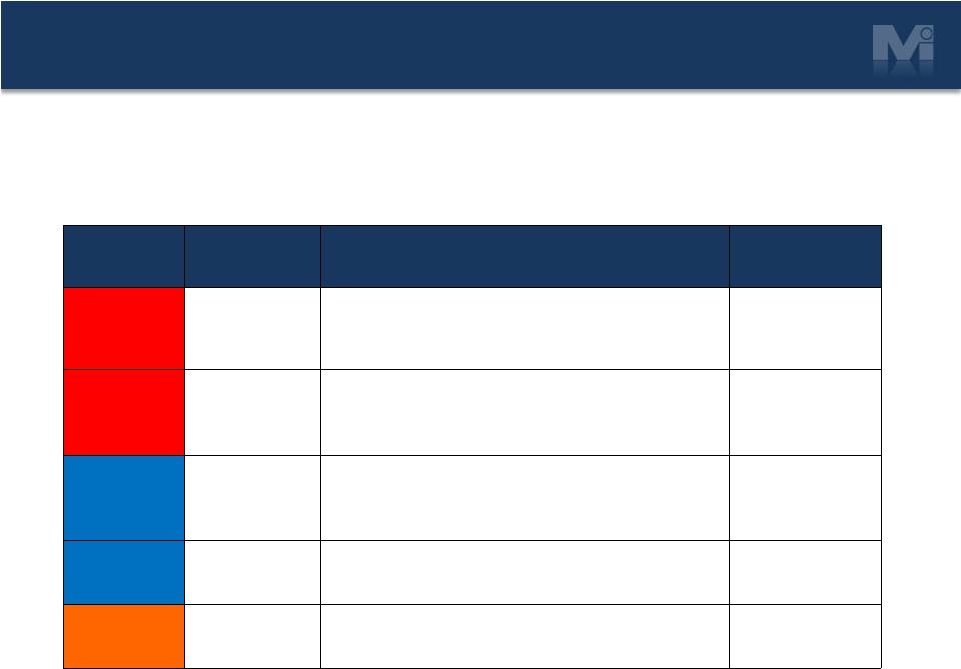 Growth
Platforms 6
Platform
Segment
Growth
Recent
Acquisitions
Returnable
Packaging
Material
Handling
Drive conversions to reusable products through
further penetration of food, liquid, bulk solids and
agricultural markets.
Novel
Storage &
Safety
Products
Material
Handling
Further grow platform with acquisitions. Strengthen
competitive advantage through distribution channels.
Jamco Products
Inc.
Tire Repair
& Retread
Products
Engineered
Products
Leverage product and customer expertise to grow
niche market.
Specialty
Molding
Engineered
Products
Expand our capabilities to further grow our positions
in Marine and RV.
Tire Supply
Distribution
Distribution
Grow through market reach, innovative products and
expanded global sourcing.
Myers Tyre Supply
India Limited
We will continuously upgrade Myers’
performance through:
Disciplined Portfolio Management
and
Investment in Profitable Growth |
 Tiltview
Product Line
Innovative New Products in 2013
7
Polymer Products
Distribution
Lawn and Garden
Material Handling
Engineered Products
Grower
Decorative
Containers
Decorative Products
for Retail
32x30 Bulk Box
(Gen II)
640-lb
CheeseBox
Novel
Beverage
Crate
Divider
Label Tab
Angle Vu Label Holder
Redesigned
AkroBin Lids
AirFlexx
Bendable
Air Valve
Myers Pneumatics Line
TPMS Program Tool
Akro-
Shelf
Myers Tire Supply |
 Full Year 2013
Highlights •
Achieved 6.4% increase in adjusted EPS
•
$1.00 compared to $0.94 in 2012
•
Generated 95% increase in free cash flow
•
$66.1 million compared to $33.8 million
•
6% of total sales in 2013 came from products, services or markets
developed in the last three years.
•
Realized $16 million in Operations Excellence savings
•
3% of Cost of Goods sold
•
2012
Novel
&
Jamco
acquisitions
performed
as
anticipated
in
2013
and
continue to be a good strategic fit
•
Increased dividend 12.5% to $0.09 per quarter or $0.36 per year
•
Invested $8.1 million to repurchase common stock
8
•
As part of Innovation initiative more than 40 new products and services
were introduced |
  Full Year 2013
Financial Summary 9
•
Sales increased 4.3%
•
Novel and Jamco acquisitions
were the primary contributor to
the increase
•
Adjusted gross margin
expanded to 27.7% from 27.4%
•
Operations Excellence
initiatives
drove productivity improvements
and cost savings
•
Adjusted net income increased
6.1%
•
Adjusted EPS increased 6.4%
Note: All figures except ratios and percents are $Millions
FY
FY
Highlights
2013
2012
B/(W)
Net sales
$825.2
$791.2
4.3%
Gross profit
margin -
adjusted¹
27.7%
27.4%
1.1%
SG&A
$173.7
$163.4
(6.3%)
Net income -
adjusted²
$34.1
$32.1
6.1%
Effective tax
rate
34.0%
36.7%
EPS -
adjusted²
$1.00
$0.94
6.4%
¹
See Reconciliation of Non-GAAP Measures slide 16
²
See Reconciliation of Non-GAAP Measures on slide 17 |
 Progress
Towards Financial Goals 10
Metric
Goal
2013
2012
Sales Growth
(1)
> 1.5x GDP
4.3%
4.7%
Adjusted Gross Margin
> 29%
27.7%
27.4%
Adjusted EPS Growth
>20% CAGR
39.3%
21.8%
Free Cash Flow
= 100% of Net Income
254%
113%
ROIC
(2)
> 10%
10%
10%
Innovation / NPD
(3)
>10% of Sales
6%
6%
Operations Excellence Savings
5% of COGS (gross)
3%
3%
(1) Using real GDP forecasted and actual growth rates, 1.5x GDP growth = 2.9% and 3.3% for 2013 and
2012 respectively. (2) ROIC = Net Operating Profit After Tax/(Debt + Equity).
(3) NPD = New Product Development calculation based on products/services introduced within the last
three years. Key Accomplishment Metrics
See Reconciliations of Non-GAAP Measures on slides 16 & 17 for details regarding
adjusted calculations in the above chart |
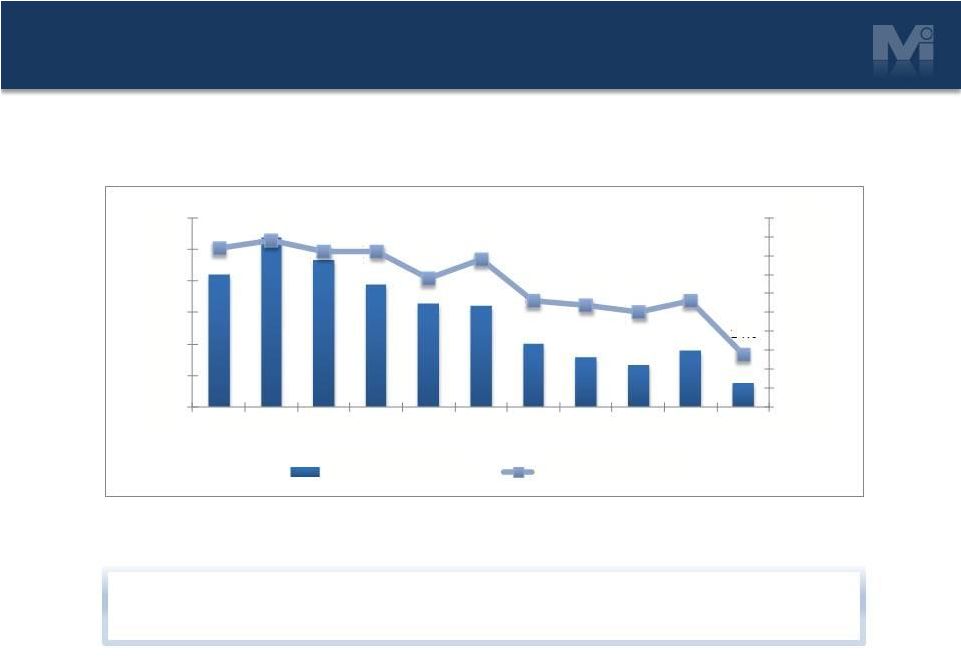 Strong &
Flexible Balance Sheet 11
Note:
1) Net Debt-to-Capital ratio calculated as net debt/(net debt +
equity). Net Debt-to-Capital
Maintaining strong balance sheet for investments and
returning capital to shareholders
42%
44%
41%
41%
34%
39%
28%
27%
25%
28%
14%
0%
5%
10%
15%
20%
25%
30%
35%
40%
45%
50%
$0
$50
$100
$150
$200
$250
$300
2003
2004
2005
2006
2007
2008
2009
2010
2011
2012
2013
Net Debt ($ Millions)
Net Debt-to-Capital |
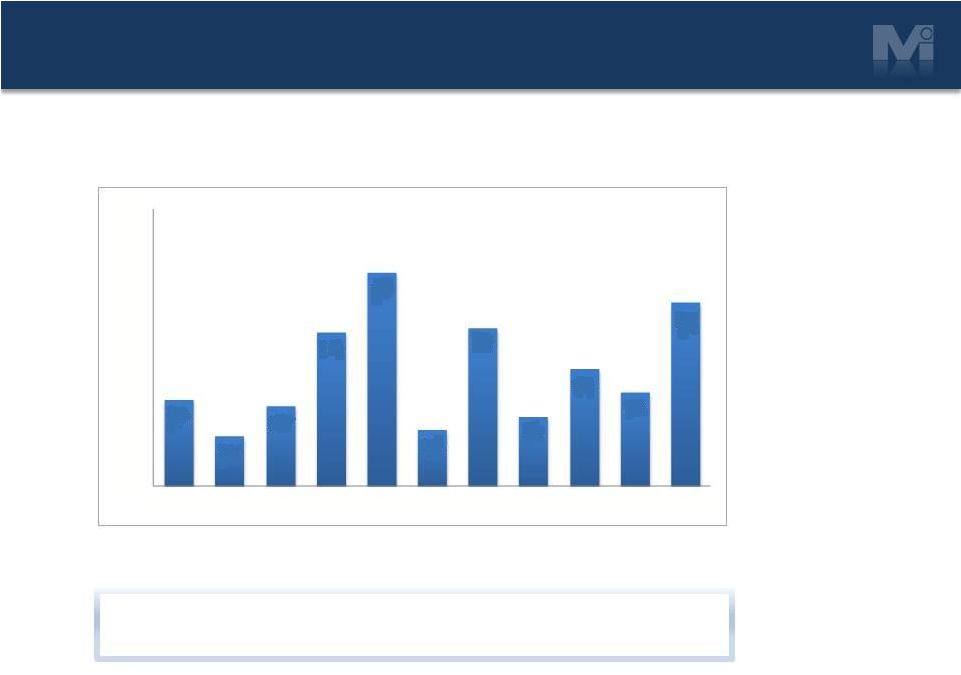 Solid Cash
Flow Generation 12
$(Millions)
Free Cash Flow
Generating Free Cash Flow, Investing for the Future and
Returning Cash to Shareholders
$31
$18
$29
$55
$77
$20
$57
$25
$42
$34
$66
$0
$20
$40
$60
$80
$100
2003
2004
2005
2006
2007
2008
2009
2010
2011
2012
2013
Notes:
1)
Free cash flow calculated as cash flow from continuing operations less capital expenditures. |
 Balanced
Approach to Capital Allocation 13
•
New product development
•
Acquisitions
•
Dividends
•
Share repurchases
•
Debt reduction
Grow Shareholder Value
Return Capital to Shareholders
Re-invest in the Business
•
Organic growth capital expenditures
•
Process improvements |
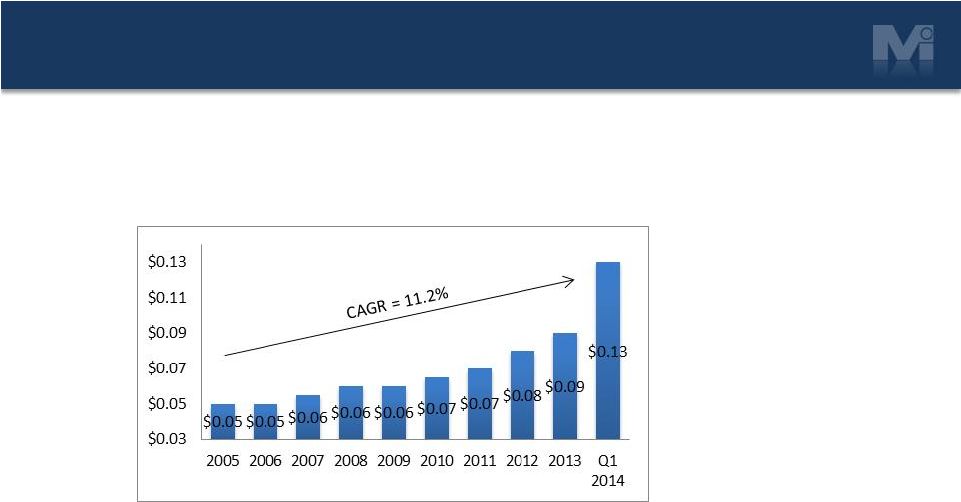 Returning Cash
to Shareholders 14
•
Increasing Dividends
•
Increased Q1 2014 quarterly dividend by 44% to $0.13 per share
Quarterly Dividends Paid
Notes:
1) Above adjusted for stock dividends and splits in 2000, 2001, 2002 and 2004.
2) In 2007 there was an additional special dividend (not shown above) of $0.28 or $9.9M
accrued but not paid until 2008, resulting from a merger termination payment.
•
Buying Back Shares
•
Investing $40M to buy back shares in 2014
•
Invested $33M to buy back 2.8M shares from 2011 to 2013 |
 Appendix
15 |
 16
Reconciliation of Non-GAAP Measures
MYERS INDUSTRIES, INC.
RECONCILIATION OF NON-GAAP FINANCIAL MEASURES
CONDENSED CONSOLIDATED GROSS PROFIT (UNAUDITED)
(Dollars in thousands)
Twelve Months Ended
December 31
2013
2012
Gross Profit as reported
217,628
215,281
Restructuring and other adjustments in cost of sales
Material Handling Segment
Lawn & Garden Segment
Engineered Products Segment
56
1,121
Gross Profit as adjusted
228,819
216,402
10,957
178
$
$
$
$
Note on
Reconciliation
of
Income
and
Earnings
Data:
Gross
profit
excluding
the
items
mentioned
above
in
the
text
of
this
release
and
in
this
reconciliation chart is a non-GAAP financial measure that Myers Industries,
Inc. calculates according to the schedule above, using GAAP amounts from
the unaudited Consolidated Financial Statements. The Company believes that the excluded items are not primarily related to core operational
activities. The Company believes that gross profit excluding items that are not
primarily related to core operating activities is generally viewed as
providing useful information regarding a company's operating profitability.
Management uses gross profit excluding these items as well as other
financial
measures
in
connection
with
its
decision-making
activities.
Gross
profit
excluding
these
items
should
not
be
considered
in
isolation
or
as
a
substitute
for
gross
profit prepared
in accordance
with
GAAP.
The
Company's
method
for
calculating
gross
profit
excluding
these
items
may
not
be
comparable
to
methods
used
by
other
companies.
—
— |
 Reconciliation
of Non-GAAP Measures 17
MYERS INDUSTRIES, INC.
RECONCILIATION OF NON-GAAP FINANCIAL MEASURES
INCOME (LOSS) BEFORE TAXES BY SEGMENT (UNAUDITED)
(Dollars in millions, except per share data)
Twelve Months Ended
December 31
2013
2012
Material Handling
Income before taxes as reported
$
41.1
$
47.5
Restructuring expenses
0.2
0.2
Income before taxes as adjusted
41.3
47.7
Lawn and Garden
Income (loss) before taxes as reported
(1.5)
2.9
Restructuring expenses and other adjustments
11.4
0.6
Loss on disposal of assets
0.6
0.0
Depreciation recapture
1.3
0.0
Income before taxes as adjusted
11.8
3.5
Distribution
Income before taxes as reported
14.4
14.8
Restructuring expenses
0.2
0.7
Gain on building sale
0.0
(0.8)
Income before taxes as adjusted
14.6
14.7
Engineered Products
Income before taxes as reported
15.3
14.5
Restructuring expenses
0.2
1.2
Income before taxes as adjusted
15.5
15.7
Corporate and interest expense
Income (loss) before taxes as reported
(29.9)
(32.4)
Severance and other
0.0
1.8
Loss before taxes as adjusted
(29.9)
(30.6)
Consolidated
Income before taxes as reported
39.4
47.3
Restructuring expenses and other adjustments
13.9
3.7
Income before taxes as adjusted
53.3
51.0
Income taxes
19.2
18.9
Net Income as adjusted
$
34.1
$
32.1
Adjusted earnings per diluted share
$
1.00
$
0.94
Note: Numbers in the Corporate and interest expense section above may
be rounded for presentation purposes. Note on
Reconciliation
of
Income
and
Earnings
Data:
Income (loss)
excluding
the
items
mentioned
above in
the
text
of
this
release
and
in
this reconciliation chart is a non-GAAP financial measure that Myers
Industries, Inc. calculates according to the schedule above, using GAAP
amounts from the unaudited Consolidated Financial Statements. The Company believes that the excluded items are
not
primarily related to core operational activities. The Company believes that income
(loss) excluding items that are not primarily related to
core operating activities is generally viewed as providing useful information
regarding a company's operating profitability. Management uses income (loss)
excluding these items as well as other financial measures in connection
with
its
decision-making
activities.
Income
(loss)
excluding
these
items
should
not
be
considered
in
isolation
or
asa
substitute
for
net
income(loss),
income
(loss)
before
taxes
or
other
consolidated
income
data
prepared
in
accordance
with
GAAP.
The
Company's
method
for
calculating
income
(loss)
excluding
these
items
may not be comparable to methods used by other companies.
|
 Strategic
Principles 18
Customer
Dedication
Innovation
Operations
Excellence
Organization
Development
Financial
Strength
•
Deliver next-generation products/services in high niche markets
•
•
Market based strategic planning
•
Maintain highest standards in safety and productivity
•
Ensure process for continuous quality, service and productivity
improvement
•
Ensure industry-best talent
•
Make Myers’
training and development a competitive advantage
Utilize “Voice of the Customer” tools Structure the organization
closer to the customer - decentralize
Build and maintain processes to maximize customer input Lead our industries in service,
quality and delivery
Generate strong financial results – EBITDA growth, Cash, ROIC Maintain a strong balance sheet Build industry leading
decision-making tools across the business
•
•
•
•
•
• |
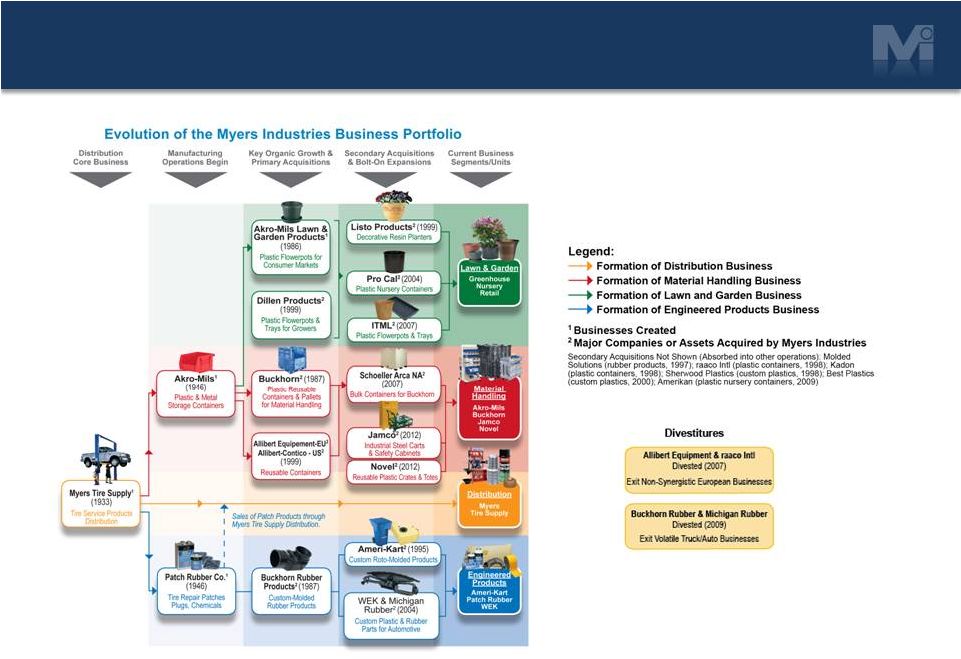 Portfolio
Evolution 19 |
 Macro
Indicators 20
Material Handling
MHEM (Material Handling Equipment) Index
Source: Material Handling Industry Feb 2014 Forecast |
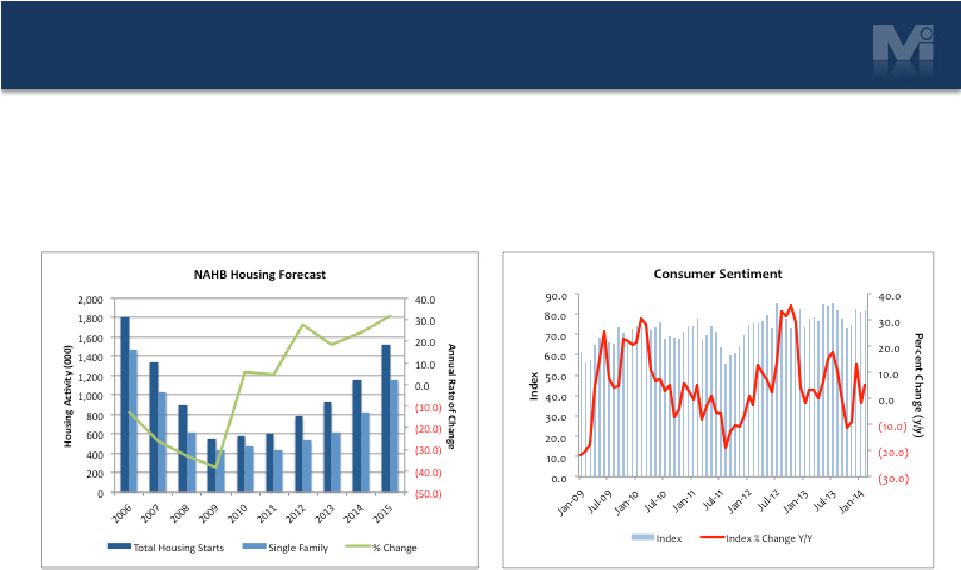 Macro
Indicators 21
Lawn & Garden
Housing Starts; Consumer Sentiment
Sources: National Association of Home Builders (NAHB), Jan 2014;
Thomson Reuters/University of Michigan, Feb 2014 |
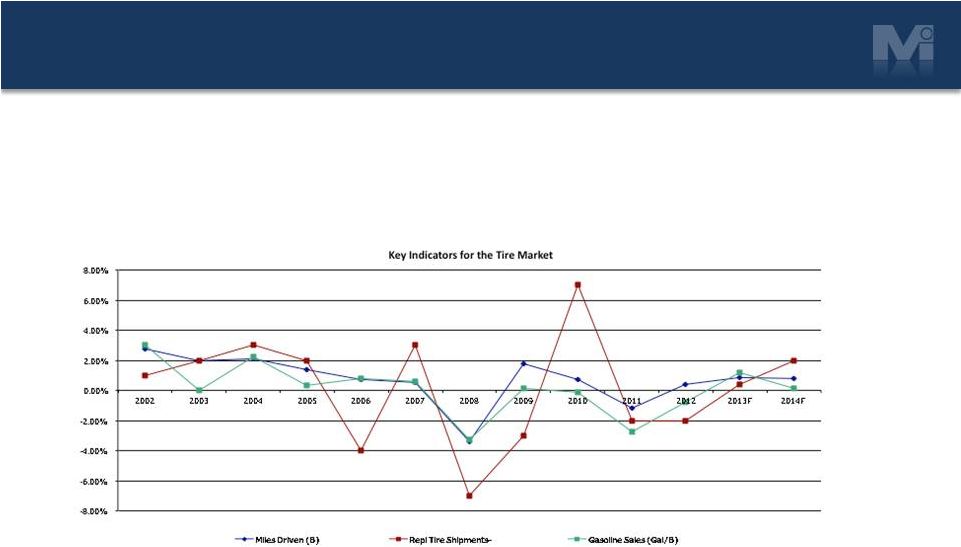 Macro
Indicators 22
Distribution
Replacement Tire Shipments; Miles Driven; Fuel Prices
Source: JP Morgan, RMA, Energy Information Administration, Feb 2014
|
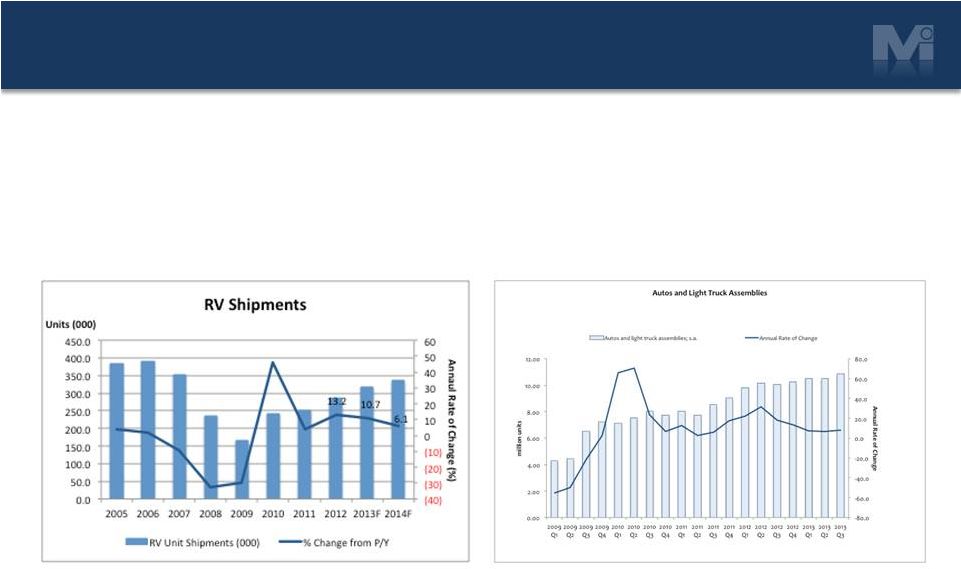 Macro
Indicators 23
Engineered Products
RVIA; Motor Vehicle and Parts Production
Sources: RVIA Forecasts, Dec 2013;
FRB G17 Release, Feb 2014 |
 |