Attached files
| file | filename |
|---|---|
| 8-K - CURRENT REPORT OF MATERIAL EVENTS OR CORPORATE CHANGES - Sizmek Inc. | a14-7730_18k.htm |
Exhibit 99.1
|
|
Investor Presentation Craig Holmes, CFO |
|
|
This presentation may contain forward-looking statements, including, without limitation, statements regarding financial guidance, business strategy, new products and services, customer prospects, expectations, goals, and industry conditions, which are based on Company management’s current beliefs. Readers and participants are cautioned to read the risks, uncertainties and contingencies described in the Company’s 10K, 10Q and other filings with the Securities and Exchange Commission. These risks, uncertainties and contingencies could cause actual results to vary materially from the statements in this presentation. In addition, the presentations include “non-GAAP financial measures” as defined by the Securities and Exchange Commission and such measures should not be substituted for GAAP measures. These non-GAAP measures are reconciled to GAAP measures in the last slide of the financial presentation. Risks and Uncertainties |
|
|
© 2014 Sizmek, Inc. all rights reserved. 3 3/9/2014 Sizmek is an open ad management company uniquely positioned to help our customers win through powerful technology and the delivery of innovative multiscreen advertising. |
|
|
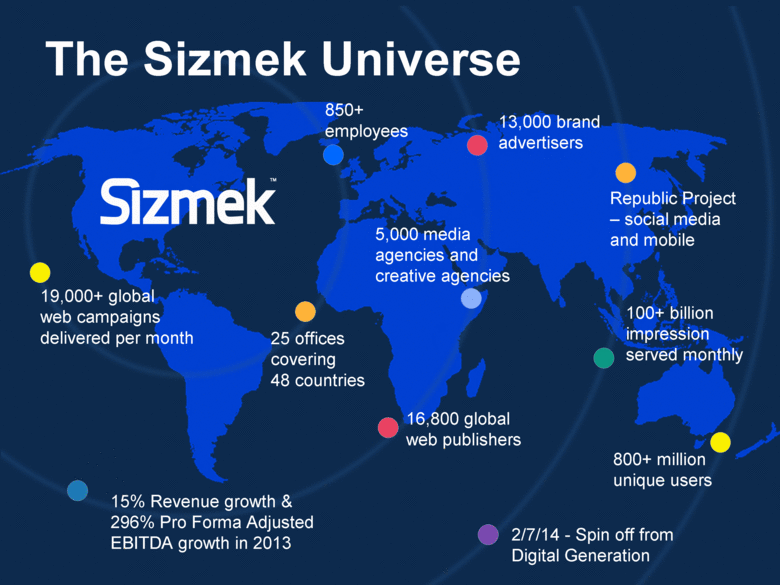
850+ employees 25 offices covering 48 countries 16,800 global web publishers 13,000 brand advertisers 5,000 media agencies and creative agencies 100+ billion impression served monthly 800+ million unique users 19,000+ global web campaigns delivered per month Republic Project – social media and mobile The Sizmek Universe 15% Revenue growth & 296% Pro Forma Adjusted EBITDA growth in 2013 2/7/14 - Spin off from Digital Generation |
|
|
Media Agency Creative Agency Advertisers Video Emerging Networks Display Open Ad Management for a Multiscreen World Consumers Agencies Media Suppliers Overcome noise Integrated reach Impact & relevancy CAMPAIGN MANAGEMENT MEDIA CHANNELS (SERVED/TRACKED) MEDIA BUYING DATA COLLECTION ADVANCED DATA APPLICATIONS ANALYTICS INFRASTRUCTURE Sizmek MDX |

|
|
Open Ad Management for a Multiscreen World Control over media, content, context and audiences Efficiently reach audiences across all media, all devices Engage with impact and relevancy Analyze and report for optimization The outcome – greater ROI for advertisers!! |

|
|
Campaign Management Analytics Dynamic Creative Professional Services Trading Verification Attribution Programmatic Data [Peer39] Mobile Video Rich Media Display Social [Republic Project] Ad Delivery Services Channels Advance Data Capabilities |

|
|
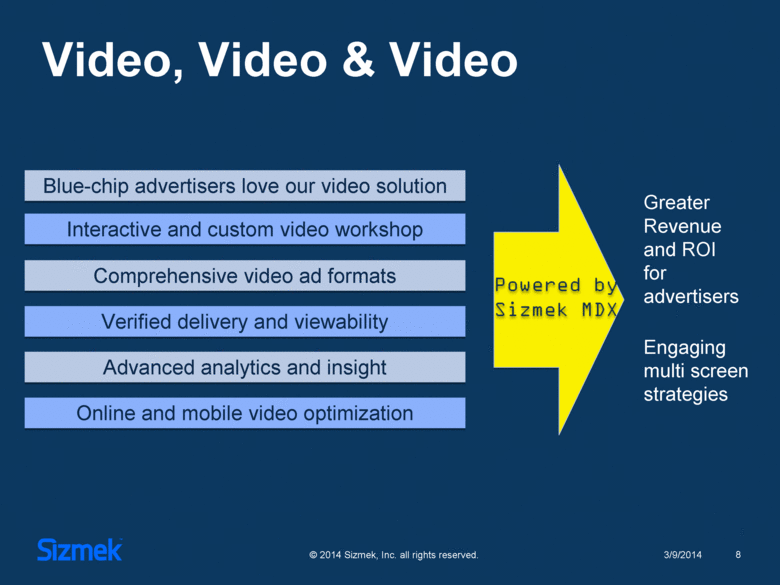
Blue-chip advertisers love our video solution Interactive and custom video workshop Video, Video & Video Comprehensive video ad formats Verified delivery and viewability Advanced analytics and insight Online and mobile video optimization Greater Revenue and ROI for advertisers Engaging multi screen strategies |
|
|
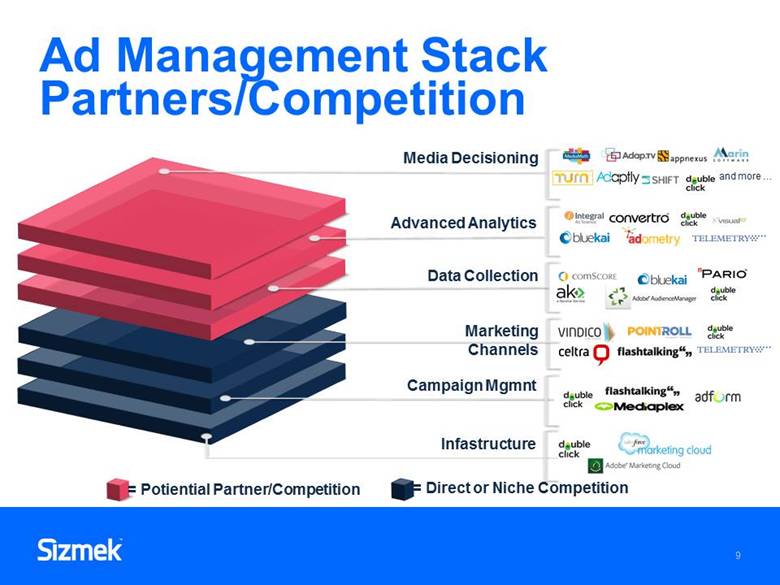
Ad Management Stack Partners/Competition Media Decisioning Advanced Analytics Data Collection Marketing Channels Campaign Mgmnt Infastructure = Potiential Partner/Competition = Direct or Niche Competition |
|
|
Market Size and Growth $47B global online advertising market * *eMarketer Video, 40% Video, 36% Rich, 13% Rich, 11% Mobile, 50% Mobile, 49% Social , 37% Social , 27% Standard, -2% Standard, -4% 2012-20132013-2014Digital Media Growth Source: eMarketer, March 2014 |

|
|
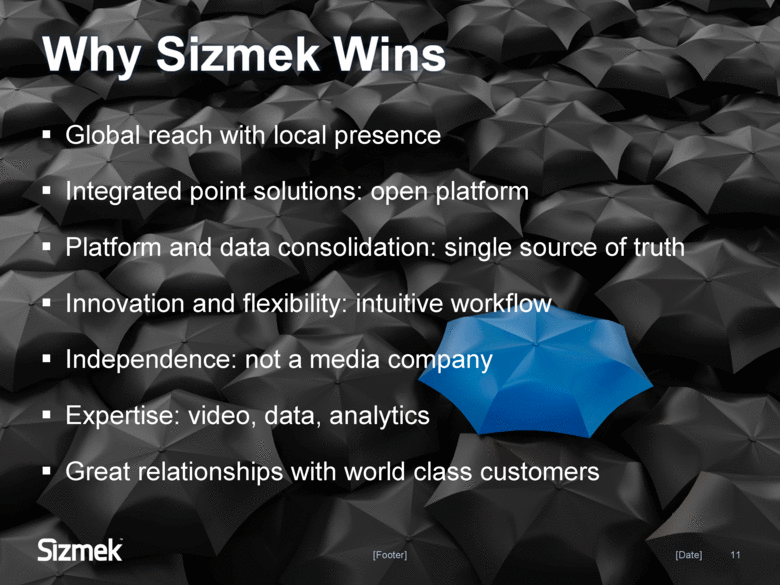
[Date] [Footer] 11 Global reach with local presence Integrated point solutions: open platform Platform and data consolidation: single source of truth Innovation and flexibility: intuitive workflow Independence: not a media company Expertise: video, data, analytics Great relationships with world class customers |
|
|
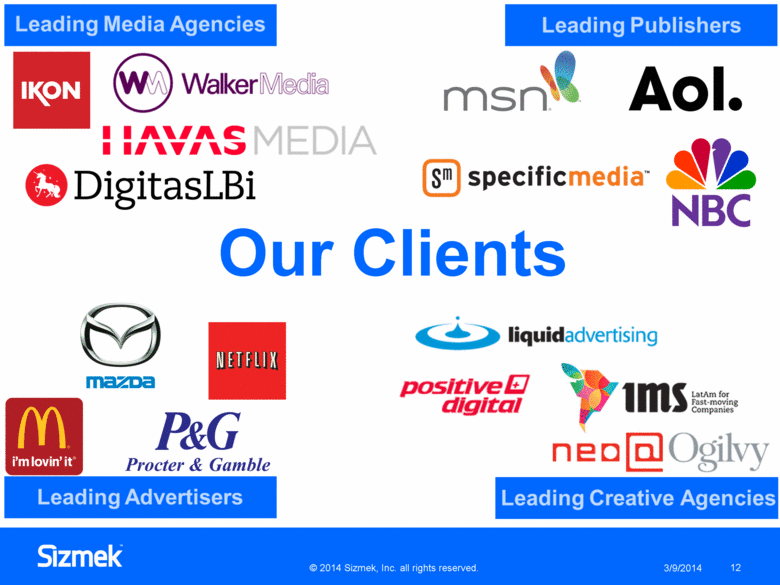
Our Clients |
|
|
Financial Overview 2/27/14 ©2014 Sizmek, Inc. All rights reserved. 13 |

|
|
Investment Highlights Largest independent ad management platform Unique open platform technology provides flexibility, ‘land and expand’ Established top tier global customer base Operations in 48 countries Diversified operations – geography, channels and offerings New products addressing fastest growing segments of online advertising: video, mobile, social Proven technology and expertise 15 year history Israeli based technology center Solid balance sheet & scalable business model Rapidly increasing “growth” investor interest 14 ©2014 Sizmek, Inc. All rights reserved. 2/27/14 |
|
|
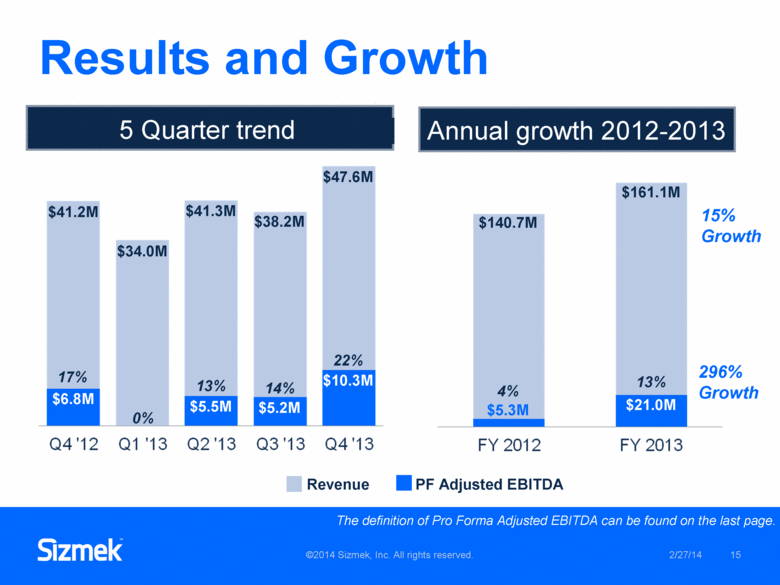
The definition of Pro Forma Adjusted EBITDA can be found on the last page. Results and Growth ©2014 Sizmek, Inc. All rights reserved. 15 5 Quarter trend Annual growth 2012-2013 $41.2M $6.8M $34.0M $41.3M $5.5M $38.2M $5.2M $47.6M $10.3M $140.7M $161.1M $5.3M $21.0M 15% Growth 296% Growth Revenue PF Adjusted EBITDA 17% 13% 14% 22% 13% 4% 0% 2/27/14 |
|
|
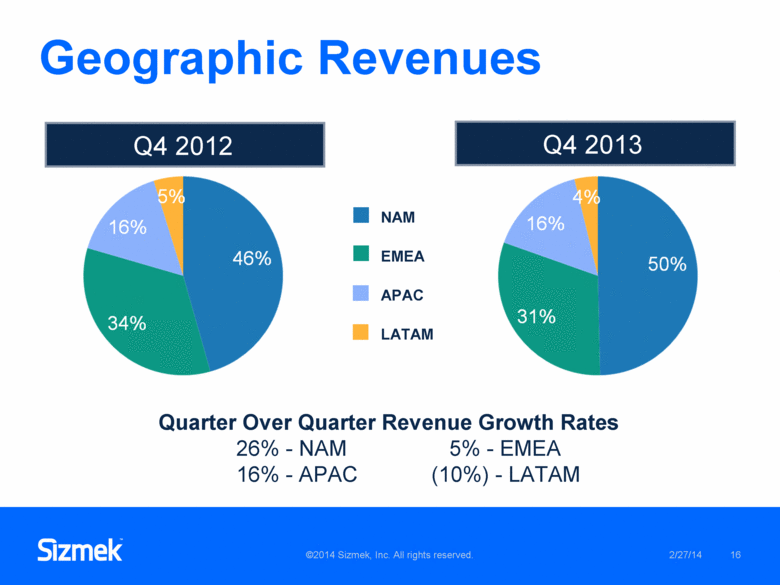
Geographic Revenues ©2014 Sizmek, Inc. All rights reserved. 16 Q4 2012 Q4 2013 NAM EMEA APAC LATAM Q4 2013 Q4 2012 2/27/14 Quarter Over Quarter Revenue Growth Rates 26% - NAM 5% - EMEA 16% - APAC (10%) - LATAM |
|
|
Balance Sheet and Cash Flow Highlights Pro Forma includes the impact of the spin off from DG. 17 ©2014 Sizmek, Inc. All rights reserved. 2/27/14 |

|
|
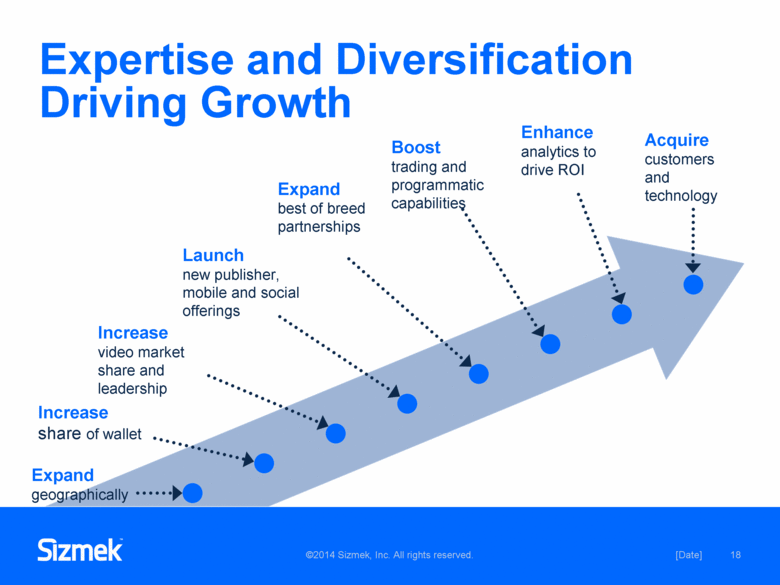
Expertise and Diversification Driving Growth [Date] ©2014 Sizmek, Inc. All rights reserved. 18 Expand geographically Increase share of wallet Increase video market share and leadership Launch new publisher, mobile and social offerings Boost trading and programmatic capabilities Enhance analytics to drive ROI Expand best of breed partnerships Acquire customers and technology |
|
|
© 2014 Sizmek, Inc. all rights reserved. 19 3/8/2014 |

|
|
© 2014 Sizmek, Inc. all rights reserved. 20 3/8/2014 |
|
|
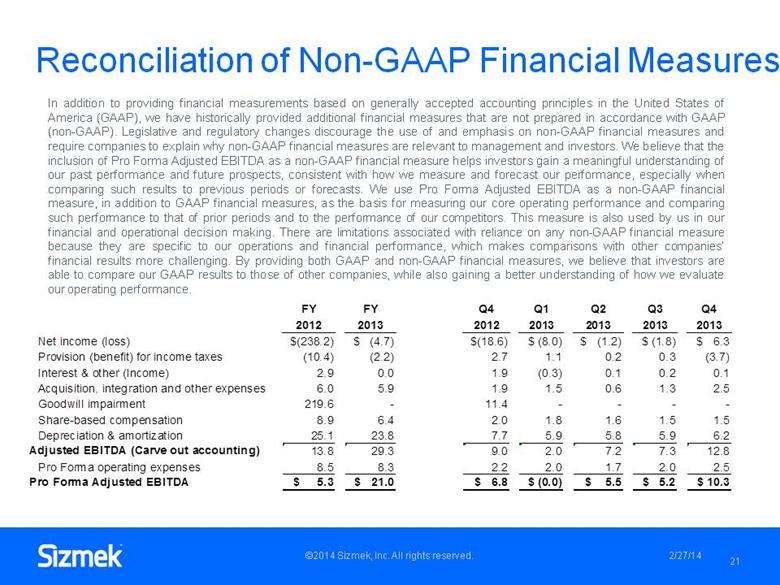
($ in millions) Reconciliation of Non-GAAP Financial Measures 21 ©2014 Sizmek, Inc. All rights reserved. 2/27/14 In addition to providing financial measurements based on generally accepted accounting principles in the United States of America (GAAP), we have historically provided additional financial measures that are not prepared in accordance with GAAP (non-GAAP). Legislative and regulatory changes discourage the use of and emphasis on non-GAAP financial measures and require companies to explain why non-GAAP financial measures are relevant to management and investors. We believe that the inclusion of Pro Forma Adjusted EBITDA as a non-GAAP financial measure helps investors gain a meaningful understanding of our past performance and future prospects, consistent with how we measure and forecast our performance, especially when comparing such results to previous periods or forecasts. We use Pro Forma Adjusted EBITDA as a non-GAAP financial measure, in addition to GAAP financial measures, as the basis for measuring our core operating performance and comparing such performance to that of prior periods and to the performance of our competitors. This measure is also used by us in our financial and operational decision making. There are limitations associated with reliance on any non-GAAP financial measure because they are specific to our operations and financial performance, which makes comparisons with other companies’ financial results more challenging. By providing both GAAP and non-GAAP financial measures, we believe that investors are able to compare our GAAP results to those of other companies, while also gaining a better understanding of how we evaluate our operating performance. FY FY Q4 Q1 Q2 Q3 Q4 2012 2013 2012 2013 2013 2013 2013 Net income (loss) $(238.2) $ (4.7) $(18.6) $ (8.0) $ (1.2) $ (1.8) $ 6.3 Provision (benefit) for income taxes (10.4) (2.2) 2.7 1.1 0.2 0.3 (3.7) Interest & other (Income) 2.9 0.0 1.9 (0.3) 0.1 0.2 0.1 Acquisition, integration and other expenses 6.0 5.9 1.9 1.5 0.6 1.3 2.5 Goodwill impairment 219.6 - 11.4 - - - - Share-based compensation 8.9 6.4 2.0 1.8 1.6 1.5 1.5 Depreciation & amortization 25.1 23.8 7.7 5.9 5.8 5.9 6.2 Adjusted EBITDA (Carve out accounting) 13.8 29.3 9.0 2.0 7.2 7.3 12.8 Pro Forma operating expenses 8.5 8.3 2.2 2.0 1.7 2.0 2.5 Pro Forma Adjusted EBITDA $ 5.3 $ 21.0 $ 6.8 $ (0.0) $ 5.5 $ 5.2 $ 10.3 |