Attached files
| file | filename |
|---|---|
| EX-32.1 - EX-32.1 - First Eagle Alternative Capital BDC, Inc. | d663657dex321.htm |
| EX-10.19 - EX-10.19 - First Eagle Alternative Capital BDC, Inc. | d663657dex1019.htm |
| EX-31.2 - EX-31.2 - First Eagle Alternative Capital BDC, Inc. | d663657dex312.htm |
| EX-10.15 - EX-10.15 - First Eagle Alternative Capital BDC, Inc. | d663657dex1015.htm |
| EX-32.2 - EX-32.2 - First Eagle Alternative Capital BDC, Inc. | d663657dex322.htm |
| EX-10.13 - EX-10.13 - First Eagle Alternative Capital BDC, Inc. | d663657dex1013.htm |
| EX-31.1 - EX-31.1 - First Eagle Alternative Capital BDC, Inc. | d663657dex311.htm |
| EX-10.17 - EX-10.17 - First Eagle Alternative Capital BDC, Inc. | d663657dex1017.htm |
Table of Contents
UNITED STATES
SECURITIES AND EXCHANGE COMMISSION
WASHINGTON, DC 20549
FORM 10-K
(Mark One)
| x | ANNUAL REPORT PURSUANT TO SECTION 13 OR 15(d) OF THE SECURITIES EXCHANGE ACT OF 1934. |
For the fiscal year ended December 31, 2013
OR
| ¨ | TRANSITION REPORT PURSUANT TO SECTION 13 OR 15(d) OF THE SECURITIES EXCHANGE ACT OF 1934. |
For the transition period from to
Commission file number 814-00789
THL CREDIT, INC.
(Exact Name of Registrant as Specified in Its Charter)
| Delaware | 27-0344947 | |
| (State or Other Jurisdiction of Incorporation or Organization) |
(I.R.S. Employer Identification No.) | |
| 100 Federal St., 31st Floor, Boston, MA | 02110 | |
| (Address of Principal Executive Offices) | (Zip Code) | |
Registrant’s Telephone Number, Including Area Code: 800-454-4424
Securities registered pursuant to 12(b) of the Act:
| Title of Each Class |
Name of Each Exchange on Which Registered | |
| Common Stock, par value $0.001 per share |
NASDAQ Global Select Market |
Securities registered pursuant to 12(g) of the Act:
None.
Indicate by check mark if the registrant is a well-known seasoned issuer, as defined in Rule 405 of the Securities Act. Yes ¨ No x
Indicate by check mark if the registrant is not required to file reports pursuant to Section 13 or Section 15(d) of the Act. Yes ¨ No x
Indicate by check mark whether the registrant (1) has filed all reports required to be filed by Section 13 or 15(d) of the Securities Exchange Act of 1934 during the preceding 12 months (or for such shorter period that the Registrant was required to file such reports), and (2) has been subject to such filing requirements for the past 90 days. Yes x No ¨
Indicate by check mark whether the registrant has submitted electronically and posted on its corporate Web site, if any, every Interactive Data File required to be submitted and posted pursuant to Rule 405 of Regulation S-T (§232.405 of this chapter) during the preceding 12 months (or for such shorter period that the registrant was required to submit and post such files). Yes ¨ No ¨
Indicate by check mark if disclosure of delinquent filers pursuant to Item 405 of Regulation S-K is not contained herein, and will not be contained, to the best of the Registrant’s knowledge, in definitive proxy or information statements incorporated by reference in Part III of this Form 10-K or any amendment to this Form 10-K. ¨
Indicate by check mark whether the registrant is a large accelerated filer, an accelerated filer, a non-accelerated filer, or a smaller reporting company. See the definitions of “large accelerated filer,” “accelerated filer” and “smaller reporting company” in Rule 12b-2 of the Exchange Act.
| Large accelerated filer |
¨ | Accelerated filer | x | |||||
| Non-Accelerated filer |
¨ | (Do not check if a smaller reporting company) |
Smaller reporting company | ¨ | ||||
Indicate by check mark whether the registrant is a shell company (as defined in Rule 12b-2 of the Securities Exchange Act of 1934). Yes ¨ No x
The aggregate market value of common stock held by non-affiliates of the Registrant as of the last business day of the Registrant’s most recently completed second fiscal quarter was approximately $515.0 million based on the closing price on that date of $15.19 on the NASDAQ Global Select Market. For the purposes of calculating this amount only, all directors and executive officers of the Registrant have been treated as affiliates.
As of March 7, 2014, there were 33,905,202 shares of the Registrant’s common stock outstanding.
Documents Incorporated by Reference
Portions of the Registrant’s definitive Proxy Statement relating to its 2014 Annual Meeting of Stockholders, to be filed pursuant to Regulation 14A with the Securities and Exchange Commission, are incorporated by reference into Part III of this Annual Report on Form 10-K as indicated herein.
Table of Contents
THL CREDIT, INC.
FORM 10-K FOR THE YEAR ENDED DECEMBER 31, 2013
| PART I | ||||||
| Item 1. | 3 | |||||
| Item 1A. | 32 | |||||
| Item 1B. | 57 | |||||
| Item 2. | 57 | |||||
| Item 3. | 57 | |||||
| Item 4. | 57 | |||||
| PART II | ||||||
| Item 5. | 58 | |||||
| Item 6. | 62 | |||||
| Item 7. | Management’s Discussion and Analysis of Financial Condition and Results of Operations |
64 | ||||
| Item 7A. | 94 | |||||
| Item 8. | 95 | |||||
| Item 9. | Changes in and Disagreements with Accountants on Accounting and Financial Disclosure |
139 | ||||
| Item 9A. | 139 | |||||
| Item 9B. | 140 | |||||
| PART III | ||||||
| Item 10. | 141 | |||||
| Item 11. | 141 | |||||
| Item 12. | Security Ownership of Certain Beneficial Owners and Management and Related Stockholder Matters |
141 | ||||
| Item 13. | Certain Relationships and Related Transactions and Director Independence |
141 | ||||
| Item 14. | 141 | |||||
| PART IV | ||||||
| Item 15. | 142 | |||||
| Signatures |
145 | |||||
2
Table of Contents
In this annual report on Form 10-K, except where the context suggests otherwise, the terms “we,” “us,” “our” and “THL Credit” refer to THL Credit, Inc.; “THL Credit Advisors,” the “Advisor” or the “Administrator” refers to THL Credit Advisors LLC; “Greenway” refers to THL Credit Greenway Fund LLC; “Greenway II” refers to THL Credit Greenway Fund II LLC and related investment vehicle; “THL Credit Opportunities” refers to THL Credit Opportunities, L.P.; “BDC Holdings” refers to THL Credit Partners BDC Holdings, L.P. Some of the statements in this annual report constitute forward-looking statements, which relate to future events, future performance or financial condition. These forward-looking statements involve risk and uncertainties and actual results could differ materially from those projected in the forward-looking statements for any reason, including those factors discussed in “Risk Factors” and elsewhere in this report.
| Item 1. | Business |
THL Credit, Inc.
We are an externally managed, non-diversified closed-end management investment company incorporated in Delaware on May 26, 2009, that has elected to be regulated as a business development company, or BDC, under the Investment Company Act of 1940, or the 1940 Act. In addition, we have elected to be treated for tax purposes as a regulated investment company, or RIC, under Subchapter M of the Code. Our investment activities are managed by THL Credit Advisors and supervised by our board of directors, a majority of whom are independent of THL Credit Advisors and its affiliates. As a BDC, we are required to comply with certain regulatory requirements. We are also registered as an investment adviser under the Investment Advisers Act of 1940, as amended, or the Advisers Act.
Our investment objective is to generate both current income and capital appreciation, primarily through investments in privately negotiated debt and equity securities of middle market companies. We are a direct lender to middle market companies and invest in subordinated, or mezzanine, debt and second lien secured debt, which may include an associated equity component such as warrants, preferred stock or other similar securities. We may also selectively invest in first lien secured loans that generally have structures with higher interest rates, which include unitranche investments, or loan structures that combine characteristics of traditional first lien senior secured as well as second lien and subordinated loans. In certain instances we will also make direct equity investments, including equity investments into or through funds, and we may also selectively invest in more broadly syndicated first lien secured loans as well as residual interests, or equity, of collateralized loan obligations, or CLOs, from time to time. We also may provide advisory services to managed funds.
We define middle market companies to mean both public and privately-held companies with annual revenues of between $25 million and $500 million. We expect to generate returns through a combination of contractual interest payments on debt investments, equity appreciation (through options, warrants, conversion rights or direct equity investments) and origination and similar fees. We can offer no assurances that we will achieve our investment objective.
Since April 2010, after we completed our initial public offering and commenced principal operations, we have been responsible for making, on behalf of ourselves and managed funds, over an aggregate $1,120 million in commitments into 62 separate portfolio investments through a combination of both initial and follow-on investments. Since inception, we received $488 million from paydowns of investments. The Company alone has invested over an aggregate $875 million in commitments since commencing principal operations. The Company alone has received $389 million from paydowns of investments.
As a BDC, we are required to comply with certain regulatory requirements. We are required to invest at least 70% of our total assets primarily in securities of private and certain U.S. public companies (other than certain financial institutions), cash, cash equivalents and U.S. government securities and other high quality debt investments that mature in one year or less.
3
Table of Contents
We are permitted to borrow money from time to time within the levels permitted by the 1940 Act (which generally allows us to incur leverage for up to one half of our assets). We have used, and expect to continue to use, our credit facilities, along with proceeds from the rotation of our portfolio and proceeds from public and private offerings of securities to finance our investment objectives. See “Item 1. Business—Regulation” for discussion of BDC regulation and other regulatory considerations.
We are also registered as an investment adviser under the Investment Advisers Act of 1940, as amended, or the Advisers Act.
Organizational Overview
The Company was organized as a Delaware corporation on May 26, 2009 and initially funded on July 23, 2009. We commenced principal operations on April 21, 2010. The Company has formed wholly owned subsidiaries which serve as tax blockers, which include THL Credit Holdings, Inc., THL Credit AIM Media Holdings, Inc. and THL Credit YP Holdings, Inc., and hold equity or equity-like investments in portfolio companies organized as limited liability companies or other forms of pass-through entities. The Company also has formed wholly owned subsidiaries which serve as the administrative agents on certain investment transactions, which include THL Corporate Finance, Inc. and THL Corporate Finance, LLC, its wholly owned subsidiary.
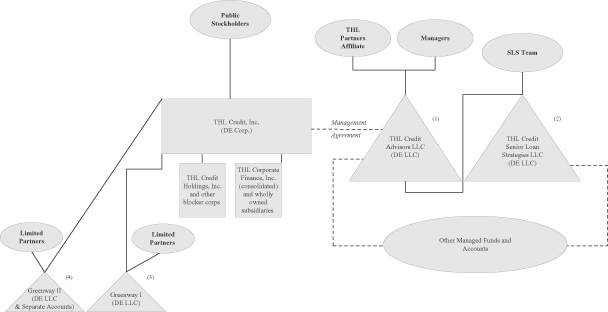
| (1) | THL Credit Advisors LLC is owned and controlled by certain of the THL Credit Investment Principals (defined below) and a partnership consisting of certain of the partners of THL Partners (defined below). |
| (2) | THL Credit SLS Senior Loan Strategies LLC, a majority-owned subsidiary of THL Credit Advisors, focuses principally on broadly syndicated senior loans. |
| (3) | Greenway I is an investment fund with $150 million of capital committed by affiliates of a single institutional investor, together with a nominal amount committed by the Company, all of which has been paid in and invested by Greenway I, which is managed by us. |
| (4) | Greenway II is an investment fund and, together with a related vehicle, has $187 million of capital committed by third party investors, together with a nominal amount committed by the Company, which is managed by us. |
4
Table of Contents
THL Credit Advisors LLC
Our investment activities are managed by our investment adviser, THL Credit Advisors. THL Credit Advisors is responsible for sourcing potential investments, conducting research on prospective investments, analyzing investment opportunities, structuring our investments, and monitoring our investments and portfolio companies on an ongoing basis. We pay THL Credit Advisors a management fee as a percentage of our gross assets and incentive fees as a percentage of our ordinary income and capital gains. THL Credit Advisors was formed as a Delaware limited liability company on June 26, 2009 and is registered as an investment adviser under the Advisers Act. THL Credit Advisors is led by James K. Hunt, W. Hunter Stropp, Sam W. Tillinghast and Christopher J. Flynn, who, along with Terrence W. Olson and Stephanie Paré Sullivan constitute its principals, collectively the THL Credit Principals. Messrs. Hunt, Stropp, Tillinghast and Flynn constitute the investment principals of THL Credit Advisors, or the THL Credit Investment Principals.
The THL Credit Investment Principals and other investment professionals make up our investment team. THL Credit Advisors is owned and controlled by certain of the THL Credit Principals and a partnership consisting of certain of the partners of THL Partners. The THL Credit Investment Principals have worked together over the past six and one half years and in the past investing through multiple business and credit cycles, across the entire capital structure. We believe the THL Credit Investment Principals bring a unique investment perspective and skill set by virtue of their complementary, collective experience as both debt and equity investors. In addition, we believe they bring an active equity ownership mentality and focus on adding value to portfolio companies through board representation, when possible, active monitoring and direct dialogue with management. See “Investment Management Agreement”.
The Advisor is an investment manager for both direct lending and broadly syndicated high yielding investments through public and private vehicles, collateralized loan obligations, separately managed accounts and co-mingled funds. The Advisor maintains a variety of advisory or sub-advisory relationships across its investment platform. For example the Advisor may serve as an investment adviser to one or more private funds or registered closed-end funds and presently serves as an investment adviser to a collateralized loan obligation (CLO), THL Credit Wind River 2013-2 CLO, Ltd., and a subadviser to a closed-end fund, THL Credit Senior Loan Fund (NYSE: TSLF).
THL Credit Advisors also serves as our Administrator and leases office space to us and provides us with equipment and office services. The tasks of the Administrator include overseeing our financial records, preparing reports to our stockholders and reports filed with the SEC and generally monitoring the payment of our expenses and the performance of administrative and professional services rendered to us by others. THL Credit Senior Loan Strategies LLC (“THL Credit SLS”), a subsidiary of THL Credit Advisors, acquired McDonnell Investment Management’s Alternative Credit Strategies group on June 29, 2012. THL Credit SLS focuses principally on broadly syndicated senior loans. The acquisition has been beneficial to the Company because it provides access to greater credit resources, including, but not limited to, origination sources, credit analysis and industry specialization that the THL Credit SLS team has developed over the years. The Company does not expect to co-invest with THL Credit SLS on transactions, except in limited circumstances on identical terms.
Thomas H. Lee Partners, L.P. (“THL Partners”)
Founded in 1974, THL Partners is a leading private equity firm based in Boston, MA. THL Partners focuses on identifying and obtaining substantial ownership positions in large growth-oriented companies where it can add managerial and strategic expertise to create value for its partners. As one of the oldest and most experienced private equity firms, THL Partners has raised approximately $20 billion of equity capital and invested in more than 100 businesses with an aggregate purchase price of more than $150 billion. THL Partners seeks to build companies of lasting value while generating superior returns for its investors and operating partners. We benefit from THL Credit Advisors’ relationship with THL Partners. THL Credit Advisors has access to the contacts and industry knowledge of THL Partners’ investment team to enhance its transaction sourcing capabilities and
5
Table of Contents
consults with the THL Partners team on specific industry issues, trends and other matters to complement our investment process.
Investment Approach
Our investment approach consists of the following four separate and distinct phases: (1) sourcing; (2) selecting; (3) structuring; and (4) supervising investments. Sourcing involves our efforts to generate as vast a universe of relevant and actionable investment opportunities as possible. Selecting represents our decision making process regarding which of those investments to pursue. Structuring summarizes our creative approach to deploying capital on a case by case basis in a way that maximizes value. Supervising is a reference to our ongoing rigorous credit monitoring.
Sourcing
The elements of our sourcing efforts include: (i) determining the market in which we intend to participate; (ii) identifying the opportunities within that market; (iii) having a clear strategy; (iv) knowing the competition; and (v) distinguishing our competitive advantages.
Determining the Market
We invest primarily in debt securities of sponsored and unsponsored issuers, including subordinated or mezzanine debt and second lien secured debt, which may include an associated equity component such as warrants, preferred stock and other similar securities. We may also selectively invest in first lien secured loans that generally have structures with higher interest rates, which include unitranche investments, or loan structures that combine characteristics of traditional first lien senior secured as well as second lien and subordinated loans. In certain instances we will also make direct equity investments, including equity investments into or through funds, and we may also selectively invest in more broadly syndicated first lien secured loans as well as notional interests, or equity of collateralized loan obligations, or CLOs, from time to time. We also may provide advisory services to managed funds.
It is also our belief that a combination of sponsored and unsponsored investments in debt securities is important to having the most attractive opportunities across investment cycles. To that end, our nationwide origination efforts target both private equity sponsors and referral sources of unsponsored companies.
Unsponsored companies are either privately-held companies typically owned and controlled by entrepreneurs rather than private equity firms or microcap public companies, or those public companies with market capitalization of less than $300 million. We believe that unsponsored middle market companies represent a large, attractive and less competitive investment opportunity for two primary reasons: (1) the number of unsponsored companies far exceeds the number of sponsored companies; and (2) many debt investors focus primarily on sponsored companies. We also believe because unsponsored companies often have less access to capital providers, they generally provide us more attractive economics, greater alignment of interests with management, and greater control over the business and capital structure.
With respect to sponsored transactions, which we define as those companies controlled by private equity firms, or sponsors, we expect the demand for leveraged buyouts to grow as mergers and acquisition activity increases, although with reduced senior lending from banks and what may be reduced participation from collateralized loan obligation vehicles in the middle market. We believe debt providers will see increasing opportunities to fill this financing gap. We expect significant demand from sponsors who need to recapitalize the balance sheets of certain of their portfolio companies or, in certain situations, acquire portfolio companies.
6
Table of Contents
Market opportunity
We believe the environment for investing in middle market companies is attractive for several reasons, including:
Improved company fundamentals creating favorable lending trends. Middle market companies are experiencing improved fundamentals driven by a stabilizing economy and an increase in confidence. During 2013, middle market companies displayed improvements in operating performance, resulting in stronger credit quality. Default levels remain relatively low, and volatility in the broader capital markets has eased, resulting in more middle market companies seeking growth capital at attractive lender credit metrics.
Consolidation among commercial banks has reduced the focus on middle market business. We believe that many senior lenders have de-emphasized their service and product offerings to middle market companies in favor of lending to large corporate clients, managing capital markets transactions and providing other non-credit services to their customers. Further, many financial institutions and traditional lenders are faced with constrained balance sheets and are requiring existing issuers to reduce leverage.
Middle market companies are increasingly seeking lenders with long-term capital for debt and equity capital. We believe that many middle market companies prefer to execute transactions with private capital providers such as us, rather than execute high-yield bond or equity transactions in the public markets, which may necessitate increased financial and regulatory compliance and reporting obligations. Further, we believe many middle market companies are inclined to seek capital from a small number of skilled, reliable and predictable providers with access to permanent capital that can satisfy their specific needs and serve as value-added financial partners with an understanding of, and longer-term view oriented towards the growth of their businesses.
The current market environment may mean more favorable opportunities for investing in lower middle market companies. We believe that as part of the path of economic recovery following the credit crisis, select market participants such as hedge funds and CLO vehicles are not as active as lenders in the middle market, a space in which we focus, resulting in fewer lender participants and a greater opportunity for us to originate proprietary investment opportunities in the lower middle market. Fewer participants also results in a more disciplined approach to investment opportunities, a situation on which we are well positioned to capitalize given the extensive level of experience of the THL Credit Investment Principals, who have worked closely together and have invested through multiple business and credit cycles. In addition, investing in debt securities in the middle market may offer more favorable returns relative to their investment risk, when compared to investments in public high yield or syndicated bank loan securities. For example, such securities generally involve better pricing terms, access to information, and the ability to diligence and evaluate management teams.
Investment strategy
We believe a strategy focused primarily on debt securities in middle market companies has a number of compelling attributes. First, the market for these instruments is relatively inefficient, allowing an experienced investor an opportunity to produce high risk-adjusted returns. Second, downside risk can be managed through an extensive credit-oriented underwriting process, creative structuring techniques and intensive portfolio monitoring. We believe private debt investments generally require the highest level of credit and legal due diligence among debt or credit asset classes. Lastly, compared with equity investments, returns on debt loans tend to be less volatile given the substantial current return component and seniority in the capital structure relative to equity.
Competition
Our primary competitors to providing financing to middle market companies will include other BDCs, public and private funds, commercial and investment banks, CLO funds, commercial finance companies and, to
7
Table of Contents
the extent they provide an alternative form of financing, private equity and hedge funds. Many of our competitors are substantially larger and have considerably greater financial and marketing resources than we do. For example, some competitors may have access to funding sources that are not available to us. In addition, some of our competitors may have higher risk tolerances or different risk assessments, which could allow them to consider a wider variety of investments and establish more relationships than us.
Competitive advantages
We believe that, through THL Credit Advisors, we possess the following competitive advantages over many other debt lenders to middle market companies:
Experienced management team. As stated above, the THL Credit Investment Principals are experienced and have worked together extensively through multiple business and credit cycles, investing across the entire capital structure with the objective of generating attractive, long-term, risk-adjusted returns. Each of the THL Credit Investment Principals brings a unique investment perspective and skill-set by virtue of their complementary collective experiences as both debt and equity investors.
Proactive Sourcing Platform. We take a proactive, hands-on, and creative approach to investment sourcing. Our disciplined origination process includes proprietary tools and resources and employs a national platform with a regional focus. With offices in Boston, Chicago, Houston, Los Angeles and New York, the THL Credit Investment Principals have a deep and diverse relationship network in the debt capital and private equity markets. These activities and relationships provide an important channel through which we generate investment opportunities consistent with our investment strategy. The THL Credit Investment Principals have activities and relationships with investment bankers, commercial bankers (national, regional and local), lawyers, accountants and business brokers as well as access to the extensive network of THL Partners, which has 38 years of experience. The THL Credit Investment Principals actively utilize these activities, relationships and networks to source and execute attractive investments, and maintain a database and set of reports where the details of all potential investment opportunities are tracked. Further, we believe the investment history and long-standing reputation of the THL Credit Investment Principals provides us with an early look at new investment opportunities.
Ability to execute unsponsored transactions. We believe we are one of the few credit market participants that actively seeks unsponsored investments and possesses the experience and resources, as a result of the long-standing relationships of the THL Credit Investment Principals and ongoing development of new relationships with referral sources and equity sponsors, to source unsponsored transactions. Furthermore, we have the capability to perform the rigorous in-house due diligence, structuring and monitoring activities necessary to execute such transactions.
Affiliation with THL Partners and THL Credit SLS. We are managed by THL Credit Advisors, the credit affiliate of THL Partners and parent of THL Credit SLS. As such, we have access to the relationship network and industry knowledge of both THL Partners and THL Credit SLS to enhance transaction sourcing capabilities. This provides us with the opportunity to consult with the THL Partners investment teams on specific industry issues, trends and other complementary matters.
Selecting
Selecting investments to pursue requires us to have an employable investment philosophy, know our key metrics, have a process to consistently measure those metrics and adhere to a repeatable underwriting process that enables our investment committee to make well-reasoned decisions.
Investment Philosophy
Our investment philosophy will focus on capital preservation, relative value, and establishing close relationships with portfolio companies. It is our expectation that this multifaceted focus should generate consistent, attractive, risk-adjusted returns coupled with low volatility.
8
Table of Contents
Capital Preservation. We believe that the key to capital preservation is comprehensive and fundamental credit analysis. We take a long term view of our investments and portfolios with the perspective that most of our investments may need to endure through economic cycles. We refrain from market timing and generally do not enter into investments with the sole intention of realizing short term gains based on changes in market prices. However, we will not hesitate to sell an investment if we believe that it is deteriorating in value and that more recovery will be obtained by selling rather than holding the investment.
Relative Value. Relative value is an essential part of every investment decision. Relative value is determined in a variety of ways including comparisons to other opportunities available in the same asset class and with portfolio companies in the same or similar industries. Relative value is also analyzed across asset classes (senior vs. subordinate, secured vs. unsecured, debt vs. equity) to ensure that the return of a potential investment is appropriate relative to its position in the capital structure.
Key Investment Metrics
Our value-oriented investment philosophy is primarily focused on maximizing yield relative to risk. Upon identifying a potential opportunity, THL Credit Advisors performs an initial screen to determine whether pursuing intensive due diligence is merited. As part of this process, we have identified several criteria we believe are important in evaluating and investing in prospective portfolio companies. These criteria provide general guidelines for our investment decisions. However, each prospective portfolio company in which we choose to invest may not meet all of these criteria.
Value orientation/positive cash flow. Our investment philosophy places a premium on fundamental credit analysis and has a distinct value orientation. We generally focus on companies in which we can invest at relatively low multiples of operating cash flow and that are profitable at the time of investment on an operating cash flow basis. Although we obtain liens on collateral when appropriate and available, we are primarily focused on the predictability of future cash flow. We generally do not intend to invest in start-up companies or companies with speculative business plans.
Seasoned management with significant equity ownership. Strong, committed management teams are important to the success of an investment and we focus on companies where strong management teams are either already in place or where new management teams have been identified. Additionally, we will generally require the portfolio companies to have in place compensation provisions that appropriately incentivize management to succeed and to act in our interests as investors.
Strong competitive position. We will seek to invest in companies that have developed competitive advantages and defensible market positions within their respective markets and are well positioned to capitalize on growth opportunities.
Exit strategy. We will seek companies that we believe will generate consistent cash flow to repay our loans and reinvest in their respective businesses. We expect such internally generated cash flow in portfolio companies to be a key means by which we exit from our investments over time. In addition, we will invest in companies whose business models and expected future cash flows offer attractive exit possibilities for the equity component of our returns. These companies include candidates for strategic acquisition by other industry participants and companies that may repay our investments through an initial public offering of common stock or another capital market transaction.
Due Diligence and Investment Process
We employ a rigorous and disciplined underwriting and due diligence process. Our process includes a comprehensive understanding of a portfolio company’s industry, market, operational, financial, organizational and legal position and prospects. In addition to our own analysis, we will frequently use the service of third
9
Table of Contents
parties (either those of the sponsor, if applicable, or those which we retain) for quality of earnings reports, environmental diligence, legal reviews, industry and customer surveys, and background checks. We conduct thorough reference and background checks on senior management for all investments, including, but not limited to reference calls to several constituencies including senior management of past employers, business associates, customers, industry experts, such as equity research analysts and, when appropriate, competitors.
We seek borrowers that have proven management teams that have a vested interest in the company in the form of a meaningful level of equity ownership, that generate stable and predictable cash flow, and whose market position is defensible. We invest in companies with the expectation that we will own the investment through a complete business cycle, and possibly a recession, and we determine the appropriate amount of debt for the company accordingly. In addition, we view a sale of the company which might result in a refinancing of our investment as a possibility but not an expectation. Our intention is to craft strong and lender-friendly credit agreements with covenants, events of default, remedies and inter-creditor agreements being an integral part of our legal documents.
Our due diligence will typically include the following elements (although not all elements will necessarily form part of every due diligence project):
Portfolio Company Characteristics: key levers of the business including a focus on drivers of cash flow and growth; revenue visibility; customer and supplier concentrations; historical revenue and margin trends; fixed versus variable costs; free cash flow analysis; portfolio company performance in view of industry performance; and sensitivity analysis around various future performance scenarios (with a focus on downside scenario analysis);
Industry Analysis: including the portfolio company’s position within the context of the general economic environment and relevant industry cycles; industry size and growth rates; competitive landscape; barriers to entry and potential new entrants; product position and defensibility of market share; technological, regulatory and similar threats; and pricing power and cost considerations;
Management: including the quality, breadth and depth of the portfolio company’s management; track record and prior experience; background checks; reputation; compensation and equity incentives; corporate overhead; motivation; interviews with management, employees, customers and vendors;
Financial Analysis: an understanding of relevant financial ratios and statistics, including various leverage, liquidity, free cash flow and fixed charge coverage ratios; impact on ratios in various future performance scenarios and comparison of ratios to industry competitors; satisfaction with the auditor of the financial statements; quality of earnings analysis;
Capital Structure: diverse considerations regarding leverage (including understanding seniority and leverage multiples); ability to service debt; collateral and security protections; covenants and guarantees; equity investment amounts and participants (where applicable); review of other significant structural terms and pertinent legal documentation; and
Collateral and Enterprise Value: analysis of relevant collateral coverage, including assets on a liquidation basis and enterprise value on a going concern basis; matrix analysis of cash flow and valuation multiples under different scenarios along with recovery estimates; comparison to recent transaction multiples and valuations.
Investment Committee
The purpose of the investment committee is to evaluate and approve, as deemed appropriate, all investments by THL Credit Advisors. The committee process is intended to bring the diverse experience and perspectives of the committee’s members to the analysis and consideration of every investment. The committee also serves to
10
Table of Contents
provide investment consistency and adherence to THL Credit Advisors’ investment philosophies and policies. The investment committee also determines appropriate investment sizing and suggests ongoing monitoring requirements.
In addition to reviewing investments, the investment committee meetings serve as a forum to discuss credit views and outlooks. Potential transactions and investment sourcing are also reviewed on a regular basis. Members of our investment team are encouraged to share information and views on credits with the investment committee early in their analysis. This process improves the quality of the analysis and assists the deal team members to work more efficiently.
Each transaction is presented to the investment committee in a formal written report. Our investment committee currently consists of James K. Hunt, W. Hunter Stropp, Sam W. Tillinghast and Christopher J. Flynn. To approve a new investment, or to exit or sell an existing investment, the consent of a majority of the four members of the committee is required, with Mr. Hunt, the Chief Executive Officer and Chief Investment Officer, having veto power.
Structuring
Our approach to structuring involves us choosing the most appropriate variety of security for each particular investment and negotiating the best and most favorable terms.
Investment Structure
We invest primarily in debt securities, including subordinated, or mezzanine debt, and second lien senior secured debt, which may include an associated equity component such as warrants, preferred stock or other similar securities. We may also selectively invest in first lien secured loans that generally have structures with higher interest rates, which include unitranche investments, or loan structures that combine characteristics of traditional first lien senior secured as well as second lien, subordinated loans, and notional interests, or equity, of collateralized loan obligations, or CLOs. In certain instances we will also make direct equity investments, including equity investments into or through funds, and we may also selectively invest in more broadly syndicated first lien secured loans from time to time.
We generally do not intend to invest in start-up companies, operationally distressed situations or companies with speculative business plans. In addition, we may invest up to 30% of our portfolio in opportunistic investments which will be intended to diversify or complement the remainder of our portfolio and to enhance our returns to stockholders. These investments may include high-yield bonds, private equity investments, securities of public companies that are broadly traded and securities of non-U.S. companies. We expect that these public companies generally will have debt securities that are non-investment grade.
Once we have determined that a prospective portfolio company is suitable for investment, we work with the management of that company and its other capital providers, including, as applicable, senior, junior, and equity capital providers, to structure an investment, typically investing an average of approximately $10 million to $25 million of capital per transaction. We negotiate among these parties to agree on how our investment is expected to perform relative to the other capital in the portfolio company’s capital structure.
Security types we invest in include:
Mezzanine Loans. We structure our subordinated, or mezzanine investments, primarily as unsecured, subordinated loans that provide for relatively high, fixed interest rates that will provide us with current interest income. Generally, mezzanine loans rank subordinate in priority of payment to senior debt, such as senior bank debt, and are often unsecured. However, mezzanine loans rank senior to common and preferred equity in a borrowers’ capital structure. Mezzanine loans typically have interest-only payments in the early years, with
11
Table of Contents
amortization of principal deferred to the later years and may include an associated equity component such as warrants, preferred stock or other similar securities. The warrants associated with mezzanine loans are typically detachable, which allows lenders to receive repayment of their principal on an agreed amortization schedule while retaining their equity interest in the borrower. Also, in some cases our mezzanine loans will be collateralized by a subordinated lien on some or all of the assets of the borrower. Typically, our mezzanine loans will have maturities of five to ten years. In determining whether a prospective mezzanine loan investment satisfies our investment criteria, we generally seek a high total return potential, although there can be no assurance we will find investments satisfying that criterion or that any such investments will perform in accordance with expectations.
Second Lien Loans. We structure our second lien investments as junior, secured loans. We obtain security interests in the assets of the portfolio company that serve as collateral in support of the repayment of such loans. This collateral may take the form of second priority liens on the assets of a portfolio company. Second lien loans may provide for moderate loan amortization in the initial years of the facility, with the majority of the amortization deferred until loan maturity, although there can be no assurance we will find investments providing for such amortization.
First Lien Senior Secured Loans. To the extent we invest in first lien or senior secured loans, we expect such loans to have terms of three to ten years and may provide for deferred interest payments in the first few years of the term of the loan. To the extent we invest in senior secured loans, we obtain first lien security interests in the assets of these portfolio companies that serve as collateral in support of the repayment of these loans. First lien secured loans may also include unitranche loan structures, which typically combine characteristics of traditional first lien senior secured and second lien and subordinated loans. We may obtain security interests in the asset of the portfolio company that serve as collateral in support of the repayment of these loans. This collateral may take the form of first-priority liens on the assets of the portfolio company and may provide for moderate loan amortization in the initial years of the facility, with the majority of the amortization deferred until loan maturity, although there can be no assurance we will find investments providing for such amortization. Unitranche loans generally allow the borrower to make a large lump sum payment of principal at the end of the loan term, and there is a risk of loss if the borrower is unable to pay the lump sum or refinance the amount owed at maturity.
CLO Residual Interests. Residual interests, subordinated notes or income notes are subordinated to the secured notes issued in connection with each CLO. The secured notes in each structure are collateralized by portfolios consisting primarily of broadly syndicated senior secured bank loans. The income notes are part of a class of subordinated notes, which are paid equal with other subordinated notes within this class. In each case, the subordinated notes do not have a stated rate of interest, but are entitled to receive distributions on quarterly payment dates subject to the priority of payments to secured note holders in the structures if and to the extent funds are available for such purpose. The payments on the subordinated notes are subordinated not only to the interest and principal claims of all secured notes issued, but to certain administrative expenses, taxes, and the base and subordinated fees paid to the collateral manager. Payments to the subordinated notes may vary significantly quarter to quarter for a variety of reasons and may be subject to 100% loss. Investments in subordinated notes, due to the structure of the CLO, can be significantly impacted by change in the market value of the assets, the distributions on the assets, defaults and recoveries on the assets, capital gains and losses on the assets along with prices, interest rates and other risks associated with the assets.
Investment Terms
We tailor the terms of each investment to the facts and circumstances of the transaction and the prospective portfolio company, negotiating a structure that protects our rights and manages our risk while creating incentives for the portfolio company to achieve its business plan and improve its profitability. We seek to limit the downside potential of our investments by:
| • | requiring a total return on our investments (including both interest and potential equity appreciation) that compensates us for credit risk; and |
12
Table of Contents
| • | negotiating covenants in connection with our investments that afford our portfolio companies as much flexibility in managing their businesses as possible, consistent with preservation of our capital. Such restrictions may include affirmative and negative covenants, default penalties, lien protection, change of control provisions and board rights, including either observation or rights to a seat on the board under some circumstances or participation rights. |
Our investments may include equity features, such as warrants or options to buy a minority interest in the portfolio company. Any warrants we receive with our debt securities generally require only a nominal cost to exercise, and thus, as a portfolio company appreciates in value, we may achieve additional investment return from this equity interest. We may structure the warrants to provide provisions protecting our rights as a minority-interest holder, as well as puts, or rights to sell such securities back to the company, upon the occurrence of specified events. In many cases, we also obtain registration rights in connection with these equity interests, which may include demand and “piggyback” registration rights.
Supervising
Successful supervision of our investments involves employing active monitoring methods and developing strong underlying management teams at each portfolio company.
Monitoring
We view active portfolio monitoring as a vital part of our investment process. We consider board observation and information rights, regular dialogue with company management and sponsors, and detailed internally generated monitoring reports to be critical to our performance. We have developed a monitoring template that promotes compliance with these standards and that is used as a tool by the Advisor’s investment committee to assess investment performance relative to plan. In addition, our portfolio investments may rely on us to provide financial and capital market expertise and may view us as a value-added resource.
As part of the monitoring process, the Advisor assesses the risk profile of each of our investments and assigns each portfolio investment a score of a 1, 2, 3, 4 or 5
The revised investment performance scores, or IPS, are as follows:
1 – The portfolio investment is performing above our underwriting expectations.
2 – The portfolio investment is performing as expected at the time of underwriting. All new investments are initially scored a 2.
3 – The portfolio investment is operating below our underwriting expectations, and requires closer monitoring. The company may be out of compliance with financial covenants, however, principal or interest payments are generally not past due.
4 – The portfolio investment is performing materially below our underwriting expectations and returns on our investment are likely to be impaired. Principal or interest payments may be past due, however, full recovery of principal and interest payments are expected.
5 – The portfolio investment is performing substantially below expectations and the risk of the investment has increased substantially. The company is in payment default and the principal and interest payments are not expected to be repaid in full.
For any investment receiving a score of a 3 or lower, our Advisor increases its level of focus and prepares regular updates for the investment committee summarizing current operating results, material impending events and recommended actions. In 2013, we assigned an investment score of 4 to three portfolio companies.
13
Table of Contents
The Advisor monitors and, when appropriate, changes the investment scores assigned to each investment in our portfolio. In connection with our investment valuation process, the Advisor and board of directors review these investment scores on a quarterly basis. Our average investment score was 2.13 and 2.12 at December 31, 2013 and December 31, 2012, respectively. The following is a distribution of the investment scores of our portfolio investments at December 31, 2013 (in millions):
| December 31, 2013 | December 31, 2012 | |||||||||||||||
| Investment Score |
Fair Value | % of Total Portfolio |
Fair Value | % of Total Portfolio |
||||||||||||
|
1(a) |
$ | 58.9 | 9.1 | % | $ | 20.0 | 5.1 | % | ||||||||
|
2(b) |
484.5 | 74.7 | % | 312.4 | 79.2 | % | ||||||||||
|
3(c) |
72.9 | 11.2 | % | 55.5 | 14.1 | % | ||||||||||
|
4(d) |
32.6 | 5.0 | % | 6.4 | 1.6 | % | ||||||||||
| 5 |
— | — | — | — | ||||||||||||
|
|
|
|
|
|
|
|
|
|||||||||
| Total |
$ | 648.9 | 100.00 | % | $ | 394.3 | 100.0 | % | ||||||||
|
|
|
|
|
|
|
|
|
|||||||||
| (a) | As of December 31, 2013, Investment Score “1” included no loans to companies in which we also hold equity securities. As of December 31, 2012, Investment Score “1” included $8.2 million of loans to companies in which we also hold equity securities. |
| (b) | As of December 31, 2013 and December 31, 2012, Investment Score “2” included $62.4 million and $49.4 million, respectively, of loans to companies in which we also hold equity securities. |
| (c) | As of December 31, 2013 and December 31, 2012, Investment Score “3” included $14.5 million and $27.0 million, respectively, of loans to companies in which we also hold equity securities. |
| (d) | As of December 31, 2013, Investment Score “4” included $10.2 million of loans to companies in which we also hold equity securities. As of December 31, 2012, Investment Score “4” included no loans to companies in which we also hold equity securities. |
Loans are placed on non-accrual status when principal or interest payments are past due 30 days or more and/or when it is no longer probable that principal or interest will be collected. However, we may make exceptions to this policy if the loan has sufficient collateral value and is in the process of collection. As of December 31, 2013, we had two loans on non-accrual with an amortized cost basis of $21.0 million and fair value of $16.8 million. As of December 31, 2012, we had no loans on non-accrual.
Investment management agreement
THL Credit Advisors serves as our investment adviser. THL Credit Advisors is registered as an investment adviser under the Advisers Act. Subject to the overall supervision of our board of directors, THL Credit Advisors manages the day-to-day operations of, and provide investment advisory and management services to, THL Credit, Inc. The address of THL Credit Advisors is 100 Federal Street, 31st Floor, Boston, Massachusetts 02110.
Under the terms of our investment management agreement, THL Credit Advisors:
| • | determines the composition of our portfolio, the nature and timing of the changes to our portfolio and the manner of implementing such changes; |
| • | identifies, evaluates and negotiates the structure of the investments we make (including performing due diligence on our prospective portfolio companies); and |
| • | closes, monitors and administers the investments we make, including the exercise of any voting or consent rights. |
THL Credit Advisors’ services under the investment management agreement are not exclusive, and it is free to furnish similar services to other entities so long as its services to us are not impaired.
14
Table of Contents
Pursuant to our investment management agreement, we pay THL Credit Advisors a fee for investment advisory and management services consisting of a base management fee and a two-part incentive fee.
Management Fee. The base management fee is calculated at an annual rate of 1.5% of our gross assets payable quarterly in arrears on a calendar quarter basis. For purposes of calculating the base management fee, “gross assets” is determined without deduction for any liabilities. For the first quarter of our operations, the base management fee was calculated based on the initial value of our gross assets. Beginning with our second quarter of operations, the base management fee was calculated based on the value of our gross assets at the end of the most recently completed calendar quarter, and appropriately adjusted for any share issuances or repurchases during the current calendar quarter. Base management fees for any partial quarter are appropriately prorated. For the years ended December 31, 2013, 2012 and 2011, THL Credit Advisors earned base management fees of $7.5 million, $4.9 million and $4.0 million, respectively, from us.
Incentive Fee. The incentive fee has two components, ordinary income and capital gains, calculated as follows:
The ordinary income component is calculated and payable quarterly in arrears based on our preincentive fee net investment income for the immediately preceding calendar quarter, subject to a total return requirement and deferral of non-cash amounts, and will be 20.0% of the amount, if any, by which our preincentive fee net investment income, expressed as a rate of return on the value of our net assets attributable to our common stock, for the immediately preceding calendar quarter exceeds a 2.0% (which is 8.0% annualized) hurdle rate and a “catch-up” provision measured as of the end of each calendar quarter. Under this provision, in any calendar quarter, our investment adviser receives no incentive fee until our preincentive fee net investment income equals the hurdle rate of 2.0%, but then receives, as a “catch-up,” 100% of our preincentive fee net investment income with respect to that portion of such preincentive fee net investment income, if any, that exceeds the hurdle rate but is less than 2.5%. The effect of the “catch-up” provision is that, subject to the total return and deferral provisions discussed below, if preincentive fee net investment income exceeds 2.5% in any calendar quarter, our investment adviser receives 20.0% of our preincentive fee net investment income as if a hurdle rate did not apply. For this purpose, preincentive fee net investment income means interest income, dividend income and any other income (including any other fees, such as commitment, origination, structuring, diligence, managerial assistance and consulting fees or other fees that we receive from portfolio companies) accrued during the calendar quarter, minus our operating expenses for the quarter (including the base management fee, expenses payable under the administration agreement (as defined below), and any interest expense and any dividends paid on any issued and outstanding preferred stock, but excluding the incentive fee and any offering expenses and other expenses not charged to operations but excluding certain reversals to the extent such reversals have the effect of reducing previously accrued incentive fees based on the deferral of non-cash interest). Preincentive fee net investment income includes, in the case of investments with a deferred interest feature (such as original issue discount, debt instruments with PIK interest and zero coupon securities), accrued income that we have not yet received in cash. The foregoing incentive fee is subject to a total return requirement, which provides that no incentive fee in respect of the Company’s preincentive fee net investment income will be payable except to the extent 20.0% of the cumulative net increase in net assets resulting from operations over the then current and 11 preceding quarters exceeds the cumulative incentive fees accrued and/or paid for the 11 preceding quarters. In other words, any ordinary income incentive fee that is payable in a calendar quarter will be limited to the lesser of (i) 20% of the amount by which our preincentive fee net investment income for such calendar quarter exceeds the 2.0% hurdle, subject to the “catch-up” provision, and (ii) (x) 20% of the cumulative net increase in net assets resulting from operations for the then current and 11 preceding calendar quarters minus (y) the cumulative incentive fees accrued and/or paid for the 11 preceding calendar quarters. For the foregoing purpose, the “cumulative net increase in net assets resulting from operations” is the amount, if positive, of the sum of preincentive fee net investment income, base management fees, realized gains and losses and unrealized appreciation and depreciation of the Company for the then current and 11 preceding calendar quarters. In addition, the portion of such incentive fee that is attributable to deferred interest (such as PIK interest or OID) will be paid to THL Credit
15
Table of Contents
Advisors, together with interest thereon from the date of deferral to the date of payment, only if and to the extent we actually receive such interest in cash, and any accrual thereof will be reversed if and to the extent such interest is reversed in connection with any write-off or similar treatment of the investment giving rise to any deferred interest accrual. Any reversal of such accounts would reduce net income for the quarter by the net amount of the reversal (after taking into account the reversal of incentive fees payable) and would result in a reduction and possibly elimination of the incentive fees for such quarter. There is no accumulation of amounts on the hurdle rate from quarter to quarter and accordingly there is no clawback of amounts previously paid if subsequent quarters are below the quarterly hurdle and there is no delay of payment if prior quarters are below the quarterly hurdle.
Preincentive fee net investment income does not include any realized capital gains, realized capital losses or unrealized capital appreciation or depreciation. Because of the structure of the incentive fee, it is possible that we may pay an incentive fee in a quarter where we incur a loss, subject to the total return requirement and deferral of non-cash amounts. For example, if we receive preincentive fee net investment income in excess of the quarterly minimum hurdle rate, we will pay the applicable incentive fee even if we have incurred a loss in that quarter due to realized and unrealized capital losses. Our net investment income used to calculate this component of the incentive fee is also included in the amount of our gross assets used to calculate the 1.5% base management fee. These calculations will be appropriately prorated for any period of less than three months and adjusted for any share issuances or repurchases during the current quarter.
The following is a graphical representation of the calculation of the income-related portion of the incentive fee:
Quarterly Incentive Fee Based on Net Investment Income
Pre-incentive fee net investment income (expressed as a percentage of the value of net assets)
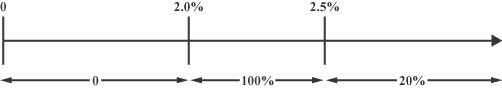
Percentage of pre-incentive fee net investment income allocated to first component of incentive fee
The capital gains component of the incentive fee is determined and payable in arrears as of the end of each calendar year (or upon termination of the investment management agreement, as of the termination date) and is equal to 20.0% of our cumulative aggregate realized capital gains from inception through the end of that calendar year, computed net of our aggregate cumulative realized capital losses and our aggregate cumulative unrealized capital depreciation through the end of such year, less the aggregate amount of any previously paid capital gains incentive fees. If such amount is negative, then no capital gains incentive fee will be payable for such year. Additionally, if the investment management agreement is terminated as of a date that is not a calendar year end, the termination date will be treated as though it were a calendar year end for purposes of calculating and paying the capital gains incentive fee. For the years ended December 31, 2013, 2012 and 2011, THL Credit Advisors earned incentive fees of $10.7 million, $7.0 million and $4.8 million, respectively, from us.
16
Table of Contents
Examples of Quarterly Incentive Fee Calculation
Example 1: Income Portion of Incentive Fee before Total Return Requirement Calculation:
Assumptions
| • | Hurdle rate(1) = 2.00% |
| • | Base management fee(2) = 0.375% |
| • | Other expenses (legal, accounting, custodian, transfer agent, etc.)(3) = 0.40% |
Alternative 1
Additional Assumptions
| • | Investment income (including interest, dividends, fees, etc.) = 1.25% |
| • | Pre-incentive fee net investment income (investment income—(base management fee + other expenses)) = 0.475% |
Pre-incentive net investment income does not exceed hurdle rate, therefore there is no incentive fee.
Alternative 2
Additional Assumptions
| • | Investment income (including interest, dividends, fees, etc.) = 2.90% |
| • | Preincentive fee net investment income (investment income—(base management fee + other expenses)) = 2.125% |
Preincentive fee net investment income exceeds hurdle rate, therefore there is an incentive fee.
Incentive fee = (100% × “Catch-Up”) + (the greater of 0% AND (20.0% × (preincentive fee net investment income—2.5%)))
= (100.0% x (preincentive fee net investment income—2.00%)) +0%
= (100.0% x (2.125%—2.00%))
= 100% x 0.125%
= 0.125%
Alternative 3
Additional Assumptions
| • | Investment income (including interest, dividends, fees, etc.) = 3.50% |
| • | Preincentive fee net investment income (investment income—(base management fee + other expenses)) = 2.725% |
Preincentive fee net investment income exceeds hurdle rate, therefore there is an incentive fee.
Incentive Fee = (100% × “Catch-Up”) + (the greater of 0% AND (20.0% × (preincentive fee net investment income—2.5%)))
= (100% × (2.5%—2.0%)) + (20.0% × (2.725%—2.5%))
= 0.5% + (20.0% × 0.225%)
17
Table of Contents
= 0.5% + 0.045%
= 0.545%
| (1) | Represents 8.0% annualized hurdle rate. |
| (2) | Represents 1.5% annualized base management fee. |
| (3) | Excludes organizational and offering expenses. |
Example 2: Income Portion of Incentive Fee with Total Return Requirement Calculation:
Assumptions
| • | Hurdle rate (1) = 2.00% |
| • | Base management fee (2) = 0.375% |
| • | Other expenses (legal, accounting, transfer agent, etc.) (3) = 0.40% |
| • | Cumulative incentive compensation accrued and/or paid for preceding 11 calendar quarters = $9,000,000 |
Alternative 1
Additional Assumptions
| • | Investment income (including interest, dividends, fees, etc.) = 3.50% |
| • | Preincentive fee net investment income (investment income – (base management fee + other expenses)) = 2.725% |
| • | 20.0% of cumulative net increase in net assets resulting from operations over current and preceding 11 calendar quarters = $8,000,000 |
Although our preincentive fee net investment income exceeds the hurdle rate of 2.0% (as shown in Alternative 3 of Example 1 above), no incentive fee is payable because 20.0% of the cumulative net increase in net assets resulting from operations over the then current and 11 preceding calendar quarters did not exceed the cumulative income and capital gains incentive fees accrued and/or paid for the preceding 11 calendar quarters.
Alternative 2
Additional Assumptions
| • | Investment Income (including interest, dividends, fees, etc.) = 3.50% |
| • | Preincentive fee net investment income (investment income – (base management fee + other expenses)) = 2.725%. |
| • | 20% of cumulative net increase in net assets resulting from operations over current and preceding 11 calendar quarters = $10,000,000 |
Because our preincentive fee net investment income exceeds the hurdle rate of 2.0% and because 20.0% of the cumulative net increase in net assets resulting from operations over the then current and 11 preceding calendar quarters exceeds the cumulative income and capital gains incentive fees accrued and/or paid for the preceding 11 calendar quarters, an incentive fee would be payable, as shown in Alternative 3 of Example 1 above.
| (1) | Represents 8.0% annualized hurdle rate. |
| (2) | Represents 1.5% annualized base management fee. |
| (3) | Excludes organizational and offering expenses. |
18
Table of Contents
Example 3: Capital Gains Portion of Incentive Fee:
Alternative 1:
Assumptions
| • | Year 1: $20 million investment made in Company A (“Investment A”), and $30 million investment made in Company B (“Investment B”) |
| • | Year 2: Investment A sold for $50 million and fair market value, or FMV, of Investment B determined to be $32 million |
| • | Year 3: FMV of Investment B determined to be $25 million |
| • | Year 4: Investment B sold for $31 million |
The capital gains portion of the incentive fee would be:
| • | Year 1: None |
| • | Year 2: Capital gains incentive fee of $6.0 million ($30 million realized capital gains on sale of Investment A multiplied by 20.0%) |
| • | Year 3: None; $5.0 million (20.0% multiplied by ($30 million cumulative capital gains less $5 million cumulative capital depreciation)) less $6.0 million (previous capital gains fee paid in Year 2) |
| • | Year 4: Capital gains incentive fee of $200,000; $6.20 million ($31 million cumulative realized capital gains multiplied by 20.0%) less $6.0 million (capital gains fee paid in Year 2) |
Alternative 2
Assumptions
| • | Year 1: $20 million investment made in Company A (“Investment A”), $30 million investment made in Company B (“Investment B”) and $25 million investment made in Company C (“Investment C”) |
| • | Year 2: Investment A sold for $50 million, FMV of Investment B determined to be $25 million and FMV of Investment C determined to be $25 million |
| • | Year 3: FMV of Investment B determined to be $27 million and Investment C sold for $30 million |
| • | Year 4: FMV of Investment B determined to be $35 million |
| • | Year 5: Investment B sold for $20 million |
The capital gains portion of the incentive fee would be:
| • | Year 1: None |
| • | Year 2: Capital gains incentive fee of $5.0 million; 20.0% multiplied by $25 million ($30 million realized capital gains on Investment A less $5 million unrealized capital depreciation on Investment B) |
| • | Year 3: Capital gains incentive fee of $1.4 million; $6.4 million (20.0% multiplied by $32 million ($35 million cumulative realized capital gains less $3 million unrealized capital depreciation on Investment B)) less $5.0 million capital gains fee paid in Year 2 |
| • | Year 4: None |
| • | Year 5: None; $5.0 million of capital gains incentive fee (20.0% multiplied by $25 million (cumulative realized capital gains of $35 million less realized capital losses of $10 million)) less $6.4 million cumulative capital gains fee paid in Year 2 and Year 3 |
19
Table of Contents
Payment of our expenses
All investment professionals and staff of THL Credit Advisors, when and to the extent engaged in providing investment advisory and management services, and the compensation and routine overhead expenses of such personnel allocable to such services (including health insurance, 401(k) plan benefits, payroll taxes and other compensation related matters), are provided and paid for by THL Credit Advisors. We bear all other costs and expenses of our operations and transactions, including those relating to:
| • | our organization; |
| • | calculating our net asset value and net asset value per share (including the cost and expenses of any independent valuation firm); |
| • | expenses, including travel-related expenses, incurred by THL Credit Advisors or payable to third parties in originating investments for the portfolio, performing due diligence on prospective portfolio companies, monitoring our investments and, if necessary, enforcing our rights; |
| • | interest payable on debt, if any, incurred to finance our investments; |
| • | the costs of future offerings of common shares and other securities, if any; |
| • | the base management fee and any incentive management fee; |
| • | distributions on our shares; |
| • | administrator expenses payable under our administration agreement; |
| • | transfer agent and custody fees and expenses; |
| • | the allocated costs incurred by THL Credit Advisors as our Administrator in providing managerial assistance to those portfolio companies that request it; |
| • | amounts payable to third parties relating to, or associated with, evaluating, making and disposing of investments; |
| • | brokerage fees and commissions; |
| • | registration fees; |
| • | listing fees; |
| • | taxes; |
| • | independent director fees and expenses; |
| • | costs of preparing and filing reports or other documents with the SEC; |
| • | the costs of any reports, proxy statements or other notices to our stockholders, including printing costs; |
| • | costs of holding stockholder meetings; |
| • | our fidelity bond; |
| • | directors and officers/errors and omissions liability insurance, and any other insurance premiums; |
| • | litigation, indemnification and other non-recurring or extraordinary expenses; |
| • | direct costs and expenses of administration and operation, including audit and legal costs; |
| • | fees and expenses associated with marketing efforts, including to investors, sponsors and other origination sources; |
| • | dues, fees and charges of any trade association of which we are a member; and |
| • | all other expenses reasonably incurred by us or the Administrator in connection with administering our business, such as the allocable portion of overhead under our administration agreement, including rent and other allocable portions of the cost of certain of our officers and their respective staffs. |
20
Table of Contents
We reimburse THL Credit Advisors for costs and expenses incurred by THL Credit Advisors for office space rental, office equipment and utilities allocable to the performance by THL Credit Advisors of its duties under the investment management agreement, as well as any costs and expenses incurred by THL Credit Advisors relating to any non-investment advisory, administrative or operating services provided by THL Credit Advisors to us or in the form of managerial assistance to portfolio companies that request it.
THL Credit Advisors may pay amounts owed by us to third party providers of goods or services. We will subsequently reimburse THL Credit Advisors for such amounts paid on our behalf.
Limitation of liability and indemnification
The investment management agreement provides that THL Credit Advisors and its officers, directors, employees and affiliates are not liable to us or any of our stockholders for any act or omission by it or its employees in the supervision or management of our investment activities or for any loss sustained by us or our stockholders, except that the foregoing exculpation does not extend to any act or omission constituting willful misfeasance, bad faith, gross negligence or reckless disregard of its obligations under the investment management agreement. The investment management agreement also provides for indemnification by us of THL Credit Advisors’ members, directors, officers, employees, agents and control persons for liabilities incurred by it in connection with their services to us, subject to the same limitations and to certain conditions.
Duration and termination
The investment management agreement was approved by our board of directors on March 4, 2014, as described further below under “Business—Board Approval of the Investment Advisory Agreement.” Unless terminated earlier as described below, it will remain in effect from year to year if approved annually by our board of directors or by the affirmative vote of the holders of a majority of our outstanding voting securities, including, in either case, approval by a majority of our directors who are not interested persons. The investment management agreement will automatically terminate in the event of its assignment. The investment management agreement may be terminated by either party without penalty upon not less than 60 days written notice to the other. Any termination by us must be authorized either by our board of directors or by vote of our stockholders. See “Risk Factors—Risks relating to our business.” We are dependent upon senior management personnel of our investment adviser for our future success, and if our investment adviser is unable to retain qualified personnel or if our investment adviser loses any member of its senior management team, our ability to achieve our investment objective could be significantly harmed.
Board Approval of the Investment Advisory Agreement
At a meeting of our Board of Directors held on March 4, 2014, our board of directors unanimously voted to approve the investment advisory agreement. In reaching a decision to approve the investment advisory agreement, the board of directors reviewed a significant amount of information and considered, among other things:
| • | the nature, quality and extent of the advisory and other services to be provided to us by THL Credit Advisors LLC; |
| • | the fee structures of comparable externally managed business development companies that engage in similar investing activities; |
| • | our projected operating expenses and expense ratio compared to business development companies with similar investment objectives; |
| • | any existing and potential sources of indirect income to THL Credit Advisors LLC from its relationship with us and the profitability of that relationship, including through the investment advisory agreement; |
| • | information about the services to be performed and the personnel performing such services under the investment advisory agreement; |
21
Table of Contents
| • | the organizational capability and financial condition of THL Credit Advisors LLC and its affiliates; and |
| • | various other matters. |
Based on the information reviewed and the discussions detailed above, the board of directors, including all of the directors who are not “interested persons” as defined in the 1940 Act, concluded that the investment advisory fee rates and terms are reasonable in relation to the services provided and approved the investment advisory agreement as being in the best interests of our stockholders.
Administration Agreement
We have entered into an administration agreement with THL Credit Advisors, which we refer to as the “administration agreement,” under which the Administrator provides administrative services to us. For providing these services, facilities and personnel, we reimburse the Administrator for our allocable portion of overhead and other expenses incurred by the Administrator in performing its obligations under the administration agreement, including rent and our allocable portion of the cost of certain of our officers and their respective staffs.
The Administrator may pay amounts owed by us to third-party providers of goods or services. We will subsequently reimburse the Administrator for such amounts paid on our behalf.
Additionally, at our request, the Administrator provides on our behalf significant managerial assistance to our portfolio companies to which we are required to provide such assistance.
License agreement
We and THL Credit Advisors have entered into a license agreement with THL Partners under which THL Partners has granted to us and THL Credit Advisors a non-exclusive, personal, revocable worldwide non-transferable license to use the trade name and service mark THL, which is a proprietary mark of THL Partners, for specified purposes in connection with our respective businesses. This license agreement is royalty-free, which means we are not charged a fee for our use of the trade name and service mark THL. The license agreement is terminable either in its entirety or with respect to us or THL Credit Advisors by THL Partners at any time in its sole discretion upon 60 days prior written notice, and is also terminable with respect to either us or THL Credit Advisors by THL Partners in the case of certain events of non-compliance. After the expiration of its first one year term, the entire license agreement is terminable by either us or THL Credit Advisors at our or its sole discretion upon 60 days prior written notice. Upon termination of the license agreement, we and THL Credit Advisors must cease to use the name and mark THL, including any use in our respective legal names, filings, listings and other uses that may require us to withdraw or replace our names and marks. Other than with respect to the limited rights contained in the license agreement, we and THL Credit Advisors have no right to use, or other rights in respect of, the THL name and mark. We are an entity operated independently from THL Partners, and third parties who deal with us have no recourse against THL Partners.
Staffing
We do not currently have any employees and do not expect to have any employees. Our Advisor and Administrator have hired and expect to continue to hire professionals with skills applicable to our business plan and investment objective, including experience in middle market investment, leveraged finance and capital markets. Each of our executive officers is an employee and executive officer of our Advisor or Administrator. Our day-to-day investment operations are managed by our Advisor. The services necessary for the origination and administration of our investment portfolio are provided by investment professionals employed by our advisor. Our Advisor’s investment professionals focus on origination and transaction development and the ongoing monitoring of our investments. We reimburse our Advisor for costs and expenses incurred by our Advisor for office space rental, office equipment and utilities allocable to our Advisor under the management agreement, as well as any costs and expenses incurred by our Advisor relating to any non-investment advisory,
22
Table of Contents
administrative or operating services provided by our Advisor to us. In addition, we reimburse our Administrator for our allocable portion of expenses it incurs in performing its obligations under the administration agreement, including rent and our allocable portion of the cost of certain of our officers and their respective staffs.
Material Conflicts of Interest
The Advisor and its affiliates may also manage other funds in the future that may have investment mandates that are similar, in whole and in part, with ours. For example, the Advisor may serve as investment adviser to one or more private funds or registered closed-end funds, and presently serves as an investment adviser to a collateralized loan obligation (CLO), THL Credit Wind River 2013-2 CLO, Ltd., and a subadviser to a closed-end fund, THL Credit Senior Loan Fund (NYSE: TSLF). In addition, our officers may serve in similar capacities for one or more private funds or registered closed-end funds. The Advisor and its affiliates may determine that an investment is appropriate for us and for one or more of those other funds. In such event, depending on the availability of such investment and other appropriate factors, the Advisor or its affiliates may determine that we should invest side-by-side with one or more other funds. Any such investments will be made only to the extent permitted by applicable law and interpretive positions of the SEC and its staff, and consistent with the Advisor’s allocation procedures.
The 1940 Act prohibits us from making certain negotiated co-investments with affiliates unless we receive an order from the SEC permitting us to do so. We, THL Credit Advisors and certain of its affiliates have submitted an exemptive application to the SEC to permit us to co-invest with other funds managed by THL Credit Advisors or its affiliates in a manner consistent with our investment objective, positions, policies, strategies and restrictions as well as regulatory requirements and other pertinent factors. There can be no assurance that any such exemptive order will be obtained.
THL Credit Advisors’ policies are also designed to manage and mitigate the conflicts of interest associated with the allocation of investment opportunities if we are able to co-invest, either pursuant to SEC interpretive positions or an exemptive order, with other accounts managed by our investment adviser and its affiliates. Generally, under the investment allocation policy, a portion of each opportunity that is appropriate for us and any affiliated fund, which may vary based on asset class and liquidity, among other factors, will be offered to us and such other eligible accounts, as determined by THL Credit Advisors. The investment allocation policy further provides that allocations among us and other eligible accounts will generally be made in accordance with SEC interpretive positions or an exemptive order. THL Credit Advisors seeks to treat all clients fairly and equitably in a manner consistent with its fiduciary duty to each of them; however, in some instances, especially in instances of limited liquidity, the factors may not result in pro rata allocations or may result in situations where certain accounts receive allocations where others do not.
Regulation
Regulated Investment Company and Business Development Company Regulations
We have elected to be regulated as a BDC under the 1940 Act. We have also elected to be treated for tax purposes as a RIC under Subchapter M of the Code. The 1940 Act contains prohibitions and restrictions relating to transactions between BDCs and their affiliates (including any investment advisers or sub-advisers), principal underwriters and affiliates of those affiliates or underwriters and requires that a majority of the directors be persons other than “interested persons,” as that term is defined in the 1940 Act.
In addition, the 1940 Act provides that we may not change the nature of our business so as to cease to be, or to withdraw our election as, a BDC unless approved by “a majority of our outstanding voting securities” as defined in the 1940 Act. A majority of the outstanding voting securities of a company is defined under the 1940 Act as the lesser of: (a) 67% or more of such company’s voting securities present at a meeting if more than 50% of the outstanding voting securities of such company are present or represented by proxy, or (b) more than 50%
23
Table of Contents
of the outstanding voting securities of such company. We do not anticipate any substantial change in the nature of our business.
We are not generally able to issue and sell our common stock at a price below net asset value per share. We may, however, issue and sell our common stock, or warrants, options or rights to acquire our common stock, at a price below the then-current net asset value of our common stock if (1) our board of directors determines that such sale is in our best interests and the best interests of our stockholders, and (2) our stockholders have approved our policy and practice of making such sales within the preceding 12 months. In any such case, the price at which our securities are to be issued and sold may not be less than a price which, in the determination of our board of directors, closely approximates the market value of such securities. At our Annual Meeting of Stockholders on June 10, 2013, our stockholders approved a proposal authorizing us to sell up to 25% of our common stock at a price below our then-current net asset value per share, subject to approval by our board of directors for the offering. The authorization expires on the earlier of June 10, 2014 and the date of our 2014 Annual Meeting of Stock holders, which is expected to be held in June 2014. Our stockholders also approved a proposal to authorize us to offer and issue debt with warrants or debt convertible into shares of our common stock at an exercise or conversion price that, at the time such warrants or convertible debt are issued, will not be less than the market value per share but may be below our then-current net asset value per share.
As a BDC, we are required to meet a coverage ratio of the value of total assets to senior securities, which include all of our borrowings and any preferred stock we may issue in the future, of at least 200%. We may also be prohibited under the 1940 Act from knowingly participating in certain transactions with our affiliates without the prior approval of our board of directors who are not interested persons and, in some cases, prior approval by the SEC.
Legislation was recently introduced in the U.S. House of Representatives intended to revise certain regulations applicable to BDCs. The legislation provides for (i) modifying the asset coverage ratio from 200% to 150%, (ii) permitting BDCs to file registration statements with the U.S. Securities and Exchange Commission that incorporate information from already-filed reports by reference, (iii) utilizing other streamlined registration processes afforded to operating companies, and (iv) allowing BDCs to own investment adviser subsidiaries. There are no assurances as to when the legislation will be enacted by Congress, if at all, or, if enacted, what final form the legislation would take.
We may invest up to 100% of our assets in securities acquired directly from issuers in privately negotiated transactions. With respect to such securities, we may, for the purpose of public resale, be deemed an “underwriter” as that term is defined in the Securities Act of 1933, or the Securities Act. We do not intend to acquire securities issued by any investment company that exceed the limits imposed by the 1940 Act. Under these limits, except for registered money market funds, we generally cannot acquire more than 3% of the voting stock of any investment company, invest more than 5% of the value of our total assets in the securities of one investment company or invest more than 10% of the value of our total assets in the securities of more than one investment company. With regard to that portion of our portfolio invested in securities issued by investment companies, it should be noted that such investments might indirectly subject our stockholders to additional expenses as they will indirectly be responsible for the costs and expenses of such companies. None of our investment policies are fundamental and any may be changed without stockholder approval.
Qualifying assets
Under the 1940 Act, a BDC may not acquire any asset other than assets of the type listed in section 55(a) of the 1940 Act, which are referred to as qualifying assets, unless, at the time the acquisition is made, qualifying assets represent at least 70% of the company’s total assets. The principal categories of qualifying assets relevant to our business are the following:
| • | Securities purchased in transactions not involving any public offering from the issuer of such securities, which issuer (subject to certain limited exceptions) is an eligible portfolio company, or from |
24
Table of Contents
| any person who is, or has been during the preceding 13 months, an affiliated person of an eligible portfolio company, or from any other person, subject to such rules as may be prescribed by the SEC. An eligible portfolio company is defined in the 1940 Act as any issuer which: |
| • | is organized under the laws of, and has its principal place of business in, the United States; |
| • | is not an investment company (other than a small business investment company wholly owned by the BDC) or a company that would be an investment company but for certain exclusions under the 1940 Act; and |
| • | satisfies either of the following: |
| • | has a market capitalization of less than $250 million or does not have any class of securities listed on a national securities exchange; or |
| • | is controlled by a BDC or a group of companies including a BDC, the BDC actually exercises a controlling influence over the management or policies of the eligible portfolio company, and, as a result thereof, the BDC has an affiliated person who is a director of the eligible portfolio company. |
| • | Securities of any eligible portfolio company which we control. |
| • | Securities purchased in a private transaction from a U.S. issuer that is not an investment company or from an affiliated person of the issuer, or in transactions incident thereto, if the issuer is in bankruptcy and subject to reorganization or if the issuer, immediately prior to the purchase of its securities was unable to meet its obligations as they came due without material assistance other than conventional lending or financing arrangements. |
| • | Securities of an eligible portfolio company purchased from any person in a private transaction if there is no ready market for such securities and we already own 60% of the outstanding equity of the eligible portfolio company. |
| • | Securities received in exchange for or distributed on or with respect to securities described above, or pursuant to the exercise of warrants or rights relating to such securities. |
| • | Cash, cash equivalents, U.S. Government securities or high-quality debt securities maturing in one year or less from the time of investment. |
Control, as defined by the 1940 Act, is presumed to exist where a BDC beneficially owns more than 25% of the outstanding voting securities of the portfolio company.
Significant managerial assistance to portfolio companies
A BDC must have been organized and have its principal place of business in the United States and must be operated for the purpose of making investments in the types of securities described in “Business—Regulation—Qualifying assets” above. However, in order to count portfolio securities as qualifying assets for the purpose of the 70% test, the BDC must either control the issuer of the securities or must offer to make available to the issuer of the securities (other than small and solvent companies described above) significant managerial assistance. Where the BDC purchases such securities in conjunction with one or more other persons acting together, the BDC will satisfy this test if one of the other persons in the group makes available such managerial assistance, although this may not be the sole method by which the BDC satisfies the requirement to make available managerial assistance. Making available managerial assistance means, among other things, any arrangement whereby the BDC, through its directors, officers or employees, offers to provide, and, if accepted, does so provide, significant guidance and counsel concerning the management, operations or business objectives and policies of a portfolio company.
25
Table of Contents
Temporary investments
Pending investment in other types of “qualifying assets,” as described above, our investments may consist of cash, cash equivalents, U.S. government securities or high-quality debt securities maturing in one year or less from the time of investment, which we refer to, collectively, as temporary investments, so that 70% of our assets are qualifying assets. Typically, we invest in highly rated commercial paper, U.S. Government agency notes, U.S. Treasury bills or in repurchase agreements relating to such securities that are fully collateralized by cash or securities issued by the U.S. government or its agencies. A repurchase agreement involves the purchase by an investor, such as us, of a specified security and the simultaneous agreement by the seller to repurchase it at an agreed-upon future date and at a price which is greater than the purchase price by an amount that reflects an agreed-upon interest rate. Consequently, repurchase agreements are functionally similar to loans. There is no percentage restriction on the proportion of our assets that may be invested in such repurchase agreements. However, the 1940 Act and certain diversification tests in order to qualify as a RIC for federal income tax purposes typically require us to limit the amount we invest with any one counterparty. Our investment adviser monitors the creditworthiness of the counterparties with which we enter into repurchase agreement transactions.
Warrants and Options
Under the 1940 Act, a BDC is subject to restrictions on the amount of warrants, options, restricted stock or rights to purchase shares of capital stock that it may have outstanding at any time. Under the 1940 Act, we may generally only offer warrants provided that (i) the warrants expire by their terms within ten years, (ii) the exercise or conversion price is not less than the current market value at the date of issuance, (iii) our stockholders authorize the proposal to issue such warrants, and our board of directors approves such issuance on the basis that the issuance is in the best interests of THL Credit and its stockholders and (iv) if the warrants are accompanied by other securities, the warrants are not separately transferable unless no class of such warrants and the securities accompanying them has been publicly distributed. The 1940 Act also provides that the amount of our voting securities that would result from the exercise of all outstanding warrants, as well as options and rights, at the time of issuance may not exceed 25% of our outstanding voting securities. In particular, the amount of capital stock that would result from the conversion or exercise of all outstanding warrants, options or rights to purchase capital stock cannot exceed 25% of the BDC’s total outstanding shares of capital stock.
Senior securities
We are permitted, under specified conditions, to issue multiple classes of indebtedness and one class of stock senior to our common stock if our asset coverage, as defined in the 1940 Act, is at least equal to 200% immediately after each such issuance. In addition, while any preferred stock or publicly traded debt securities are outstanding, we must make provisions to prohibit any distribution to our stockholders or the repurchase of such securities or shares unless we meet the applicable asset coverage ratios at the time of the distribution or repurchase. We may also borrow amounts up to 5% of the value of our total assets for temporary or emergency purposes without regard to asset coverage. For a discussion of the risks associated with leverage, see “Risks—Risks related to our operations as a BDC.”
No-action relief from registration as a commodity pool operator
We are relying on a no-action letter (the “No-Action Letter”) issued by the staff of the Commodity Futures Trading Commission (the “CFTC”) as a basis to avoid registration with the CFTC as a commodity pool operator (“CPO”). The No-Action Letter allows an entity to engage in CFTC-regulated transactions (“commodity interest transactions”) that are “bona fide hedging” transactions (as that term is defined and interpreted by the CFTC and its staff), but prohibit an entity from entering into commodity interest transactions if they are non-bona fide hedging transactions, unless immediately after entering such non-bona fide hedging transaction (a) the sum of the amount of initial margin deposits on the entity’s existing futures or swaps positions and option or swaption premiums does not exceed 5% of the market value of the entity’s liquidating value, after taking into account unrealized profits and unrealized losses on any such transactions, or (b) the aggregate net notional value of the
26
Table of Contents
entity’s commodity interest transactions would not exceed 100% of the market value of the entity’s liquidating value, after taking into account unrealized profits and unrealized losses on any such transactions. We are required to operate pursuant to these trading restrictions if we intend to continue to rely on the No-Action Letter as a basis to avoid CPO registration.
Proxy voting policies and procedures
We have delegated our proxy voting responsibility to THL Credit Advisors. The Proxy Voting Policies and Procedures of THL Credit Advisors are set forth below. The guidelines are reviewed periodically by THL Credit Advisors and our independent directors, and, accordingly, are subject to change.
Introduction
THL Credit Advisors is registered as an investment adviser under the Advisers Act. As an investment adviser registered under the Advisers Act, THL Credit Advisors has fiduciary duties to us. As part of this duty, THL Credit Advisors recognizes that it must vote client securities in a timely manner free of conflicts of interest and in our best interests and the best interests of our stockholders. THL Credit Advisors’ Proxy Voting Policies and Procedures have been formulated to ensure decision-making consistent with these fiduciary duties.
These policies and procedures for voting proxies for our investment advisory clients are intended to comply with Section 206 of, and Rule 206(4)-6 under, the Advisers Act.
Proxy policies
THL Credit Advisors evaluates routine proxy matters, such as proxy proposals, amendments or resolutions on a case-by-case basis. Routine matters are typically proposed by management and THL Credit Advisors will normally support such matters so long as they do not measurably change the structure, management control, or operation of the corporation and are consistent with industry standards as well as the corporate laws of the state of incorporation.
THL Credit Advisors also evaluates non-routine matters on a case-by-case basis. Non-routine proposals concerning social issues are typically proposed by stockholders who believe that the corporation’s internally adopted policies are ill-advised or misguided. If THL Credit Advisors has determined that management is generally socially responsible, THL Credit Advisors will generally vote against these types of non-routine proposals. Non-routine proposals concerning financial or corporate issues are usually offered by management and seek to change a corporation’s legal, business or financial structure. THL Credit Advisors will generally vote in favor of such proposals provided the position of current stockholders is preserved or enhanced. Non-routine proposals concerning stockholder rights are made regularly by both management and stockholders. They can be generalized as involving issues that transfer or realign board or stockholder voting power. THL Credit Advisors typically would oppose any proposal aimed solely at thwarting potential takeovers by requiring, for example, super-majority approval. At the same time, THL Credit Advisors believes stability and continuity promote profitability. THL Credit Advisors’ guidelines in this area seek a middle road and individual proposals will be carefully assessed in the context of their particular circumstances.
If a vote may involve a material conflict of interest, prior to approving such vote, THL Credit Advisors must consult with its chief compliance officer to determine whether the potential conflict is material and if so, the appropriate method to resolve such conflict. If the conflict is determined not to be material, THL Credit Advisors’ employees shall vote the proxy in accordance with THL Credit Advisors’ proxy voting policy.
27
Table of Contents
Proxy voting records
You may obtain information about how we voted proxies by making a written request for proxy voting information to:
General Counsel
THL Credit, Inc.
100 Federal Street, 31st Floor
Boston, MA 02110
Code of ethics
We have adopted a code of ethics pursuant to Rule 17j-1 under the 1940 Act and we have also approved our investment adviser’s equivalent of a code of ethics under the title of Employee Investment Transaction Policy that was adopted by it under Rule 17j-1 under the 1940 Act and Rule 204A-1 of the Advisers Act. These codes establish procedures for personal investments and restrict certain personal securities transactions. Personnel subject to the code may invest in securities for their personal investment accounts so long as such investments are made in accordance with the code’s requirements. You may read and copy our code of ethics and our code of ethics and business conduct at the SEC’s Public Reference Room located at 100 F Street, NE, Washington, DC 20549. You may obtain information on the operation of the Public Reference Room by calling the SEC at 1-800-SEC-0330. In addition, our code of ethics and our code of ethics and business conduct are available on the EDGAR Database on the SEC’s Internet site at http://www.sec.gov and are available on our corporate governance webpage at http://investor.thlcredit.com/governance.
Privacy Principles
We are committed to maintaining the privacy of stockholders and to safeguarding our non-public personal information. The following information is provided to help you understand what personal information we collect, how we protect that information and why, in certain cases, we may share information with select other parties.
Generally, we do not receive any nonpublic personal information relating to our stockholders, although certain nonpublic personal information of our stockholders may become available to us. We do not disclose any nonpublic personal information about our stockholders or former stockholders to anyone, except as permitted by law or as is necessary in order to service stockholder accounts (for example, to a transfer agent or third party administrator).
We restrict access to nonpublic personal information about our stockholders to our investment adviser’s employees with a legitimate business need for the information. We maintain physical, electronic and procedural safeguards designed to protect the nonpublic personal information of our stockholders.
Compliance with Corporate Governance Regulations
The Sarbanes-Oxley Act of 2002 (the “Sarbanes-Oxley Act”) imposes a wide variety of regulatory requirements on publicly-held companies and their insiders. Many of these requirements affect us. The Sarbanes-Oxley Act has required us to review our policies and procedures to determine whether we comply with the Sarbanes-Oxley Act and the regulations promulgated thereunder. We will continue to monitor our compliance with all future regulations that are adopted under the Sarbanes-Oxley Act and will take actions necessary to ensure that we are in compliance therewith.
In addition, The NASDAQ Global Select Market has adopted various corporate governance requirements as part of its listing standards. We believe we are in compliance with such corporate governance listing standards. We will continue to monitor our compliance with all future listing standards and will take actions necessary to ensure that we are in compliance therewith.
28
Table of Contents
Other
We have adopted an investment policy that mirrors the requirements applicable to us as a BDC under the 1940 Act.
We are subject to periodic examination by the SEC for compliance with the Exchange Act and the 1940 Act.
We are required to provide and maintain a bond issued by a reputable fidelity insurance company to protect us against larceny and embezzlement. Furthermore, as a BDC, we are prohibited from protecting any director or officer against any liability to us or our stockholders arising from willful misfeasance, bad faith, gross negligence or reckless disregard of the duties involved in the conduct of such person’s office.
We and THL Credit Advisors have adopted and implemented written policies and procedures reasonably designed to prevent violation of the federal securities laws, and will review these policies and procedures annually for their adequacy and the effectiveness of their implementation. We and THL Credit Advisors have designated a chief compliance officer to be responsible for administering the policies and procedures.
You may read and copy any materials we file with the SEC at the SEC’s Public Reference Room at 100 F Street, NE, Washington, DC 20549, on official business days during the hours of 10:00 am to 3:00 pm. You may obtain information on the operation of the Public Reference Room by calling the SEC at (202)551-8090. The SEC maintains an Internet site that contains reports, proxy and information statements, and other information regarding issuers that file electronically with the SEC. The address of that site is http://www.sec.gov.
Our internet address is www.thlcredit.com. We make available free of charge on our website our annual report on Form 10-K, quarterly reports on Form 10-Q, current reports on Form 8-K and amendments to those reports as soon as reasonably practicable after we electronically file such material with, or furnish it to, the SEC.
Certain U.S Federal Income Tax Considerations
We have elected to be treated as a RIC under Subchapter M of the Code. As a RIC, we generally do not have to pay corporate-level federal income taxes on any income that we distribute to our stockholders from our tax earnings and profits. To maintain our qualification as a RIC, we must, among other things, meet certain source of income and asset diversification requirements (as described below). In addition, in order maintain RIC tax treatment, we must distribute to our stockholders, for each taxable year, at least 90% of our “investment company taxable income,” which is generally our net ordinary income plus the excess, if any, of realized net short-term capital gains over realized net long-term capital losses (the “Annual Distribution Requirement”).
Taxation as a Regulated Investment Company
If we:
| • | maintain our qualification as a RIC; and |
| • | satisfy the Annual Distribution Requirement, |
then we will not be subject to U.S. federal income tax on the portion of our income we distribute (or are deemed to distribute) to stockholders. We will be subject to U.S. federal income tax at the regular corporate rates on any income or capital gains not distributed (or deemed distributed) to our stockholders.
In order to maintain our qualification as a RIC for federal income tax purposes, we must, among other things:
| • | continue to qualify as a BDC under the 1940 Act at all times during each taxable year; |
29
Table of Contents
| • | derive in each taxable year at least 90% of our gross income from dividends, interest, payments with respect to certain securities loans, gains from the sale of stock or other securities, net income from certain “qualified publicly traded partnerships,” or other income derived with respect to our business of investing in such stock or securities (the “90% Income Test”); and |
| • | diversify our holdings so that at the end of each quarter of the taxable year: |
| • | at least 50% of the value of our assets consists of cash, cash equivalents, U.S. Government securities, securities of other RICs, and other securities if such other securities of any one issuer do not represent more than 5% of the value of our assets or more than 10% of the outstanding voting securities of the issuer; and |
| • | no more than 25% of the value of our assets is invested in the securities, other than U.S. Government securities or securities of other RICs, of one issuer, of two or more issuers that are controlled, as determined under applicable Code rules, by us and that are engaged in the same or similar or related trades or businesses or of certain “qualified publicly traded partnerships” (the “Diversification Tests”). |
We will be subject to a 4% nondeductible federal excise tax on certain undistributed income unless we distribute in a timely manner an amount at least equal to the sum of (1) 98% of our net ordinary income for each calendar year, (2) 98.2% of our capital gain net income for each calendar year and (3) any income recognized, but not distributed, in preceding years and on which we paid no federal income tax (the “Excise Tax Avoidance Requirement”). We may choose to retain a portion of our ordinary income and/or capital gain net income in any year and pay the 4% U.S. federal excise tax on the retained amounts. For federal income tax purposes, we may be required to recognize taxable income in circumstances in which we do not receive a corresponding payment in cash. For example, if we hold debt obligations that are treated under applicable tax rules as having original issue discount (such as debt instruments with PIK interest or, in certain cases, increasing interest rates or debt instruments that were issued with warrants), we must include in income each year a portion of the original issue discount that accrues over the life of the obligation, regardless of whether cash representing such income is received by us in the same taxable year. We may also have to include in income other amounts that we have not yet received in cash, such as deferred loan origination fees that are paid after origination of the loan or are paid in non-cash compensation such as warrants or stock. Certain consolidated subsidiaries of the Company are subject to U.S. federal and state income taxes. These taxable entities are not consolidated with the Company for income tax purposes and may generate income tax liabilities or assets from temporary differences in the recognition of items for financial reporting and income tax purposes at the subsidiaries.
Because any original issue discount or other amounts accrued will be included in our investment company taxable income for the year of the accrual, we may be required to make a distribution to our stockholders in order to satisfy the Annual Distribution Requirement, even though we will not have received any corresponding cash amount. As a result, we may have difficulty meeting the annual distribution requirement necessary to obtain and maintain RIC tax treatment under the Code. We may have to sell some of our investments at times and/or at prices we would not consider advantageous, raise additional debt or equity capital or forgo new investment opportunities for this purpose. If we are not able to obtain cash from other sources, we may fail to qualify for RIC tax treatment and thus become subject to corporate-level income tax.
We are authorized to borrow funds and to sell assets in order to satisfy distribution requirements. However, under the 1940 Act, we are not permitted to make distributions to our stockholders while our debt obligations and other senior securities are outstanding unless certain “asset coverage” tests are met. Moreover, our ability to dispose of assets to meet our distribution requirements may be limited by (1) the illiquid nature of our portfolio and/or (2) other requirements relating to our status as a RIC, including the Diversification Tests. If we dispose of assets in order to meet the Annual Distribution Requirement or the Excise Tax Avoidance Requirement, we may make such dispositions at times that, from an investment standpoint, are not advantageous.
30
Table of Contents
Certain of our investment practices may be subject to special and complex federal income tax provisions that may, among other things, (1) treat dividends that would otherwise qualify for the dividends received deduction or constitute qualified dividend income as ineligible for such treatment, (2) disallow, suspend or otherwise limit the allowance of certain losses or deductions, (3) convert lower-taxed long-term capital gain into higher-taxed short-term capital gain or ordinary income, (4) convert an ordinary loss or a deduction into a capital loss (the deductibility of which is more limited), (5) cause us to recognize income or gain without receipt of a corresponding distribution of cash, (6) adversely affect the time as to when a purchase or sale of stock or securities is deemed to occur, (7) adversely alter the characterization of certain complex financial transactions and (8) produce income that will not be qualifying income for purposes of the 90% Income Test. We will monitor our transactions and may make certain tax elections to mitigate the potential adverse effect of these provisions, but there can be no assurance that any adverse effects of these provisions will be mitigated.
If we purchase shares in a “passive foreign investment company” (a “PFIC”), we may be subject to federal income tax on its allocable share of a portion of any “excess distribution” received on, or any gain from the disposition of, such shares even if our allocable share of such income is distributed as a taxable dividend to its stockholders. Additional charges in the nature of interest generally will be imposed on us in respect of deferred taxes arising from any such excess distribution or gain. If we invest in a PFIC and elect to treat the PFIC as a “qualified electing fund” under the Code (a “QEF”), in lieu of the foregoing requirements, we will be required to include in income each year our proportionate share of the ordinary earnings and net capital gain of the QEF, even if such income is not distributed by the QEF. Alternatively, we may be able to elect to mark-to-market at the end of each taxable year our shares in a PFIC; in this case, we will recognize as ordinary income our allocable share of any increase in the value of such shares, and as ordinary loss our allocable share of any decrease in such value to the extent that any such decrease does not exceed prior increases included in its income. Under either election, we may be required to recognize in a year income in excess of distributions from PFICs and proceeds from dispositions of PFIC stock during that year, and such income will nevertheless be subject to the Annual Distribution Requirement and will be taken into account for purposes of the 4% excise tax.
31
Table of Contents
| Item 1A. | Risk Factors |
Before you invest in our securities, you should be aware of various risks, including those described below. You should carefully consider these risk factors, together with all of the other information included in this prospectus, before you decide whether to make an investment in our securities. The risks set out below are not the only risks we face, but they are the principal risks associated with an investment in the Company. If any of the following events occur, our business, financial condition and results of operations could be materially adversely affected. In such case, our net asset value and the trading price of our common stock could decline, and you may lose all or part of your investment.
RISKS RELATED TO OUR BUSINESS
We may suffer credit losses.
Investment in middle market companies is highly speculative and involves a high degree of risk of credit loss, and therefore our securities may not be suitable for someone with a low tolerance for risk. These risks are likely to increase during an economic recession.
The lack of liquidity in our investments may adversely affect our business.
Our investments generally are made in private companies. Substantially all of these securities are subject to legal and other restrictions on resale or will be otherwise less liquid than publicly traded securities. The illiquidity of our investments may make it difficult for us to sell such investments if the need arises. In addition, if we are required to liquidate all or a portion of our portfolio quickly, we may realize significantly less than the value at which we had previously recorded our investments. Further, we may face other restrictions on our ability to liquidate an investment in a portfolio company to the extent that we or an affiliated manager have material non-public information regarding such portfolio company.
There will be uncertainty as to the value of our portfolio investments.
A large percentage of our portfolio investments are in the form of securities that are not publicly traded. The fair value of securities and other investments that are not publicly traded may not be readily determinable. We value these securities on a quarterly basis in accordance with our valuation policy, which is at all times consistent with U.S. generally accepted accounting policies (“GAAP”). Our board of directors utilizes the services of third-party valuation firms to aid it in determining the fair value of these securities. The board of directors discusses valuations and determines the fair value in good faith based on the input of our investment adviser and the respective third-party valuation firms. The factors that may be considered in fair value pricing our investments include the nature and realizable value of any collateral, the portfolio company’s ability to make payments and its earnings, the markets in which the portfolio company does business, comparisons to publicly traded companies, discounted cash flow and other relevant factors. Because such valuations, and particularly valuations of private securities and private companies, are inherently uncertain, may fluctuate over short periods of time and may be based on estimates, our determinations of fair value may differ materially from the values that would have been used if a ready market for these securities existed. Our net asset value could be adversely affected if our determinations regarding the fair value of our investments were materially higher than the values that we ultimately realize upon the disposal of such securities.
Our financial condition and results of operations depend on our ability to manage future growth effectively.
Our ability to achieve our investment objective depends on our ability to acquire suitable investments and monitor and administer those investments, which depends, in turn, on our investment adviser’s ability to identify, invest in and monitor companies that meet our investment criteria.
32
Table of Contents
Accomplishing this result on a cost-effective basis is largely a function of the structuring of our investment process and the ability of our investment adviser to provide competent, attentive and efficient services to us. Our executive officers and the members of our investment adviser’s investment committee have substantial responsibilities in connection with their roles at THL Credit and with the other THL Credit funds, as well as responsibilities under the investment advisory and management agreement. They may also be called upon to provide significant managerial assistance to certain of our portfolio companies. These demands on their time, which will increase as the number of investments grow, may distract them or slow the rate of investment. In order to grow, THL Credit will need to hire, train, supervise, manage and retain new employees. However, we cannot assure you that we will be able to do so effectively. Any failure to manage our future growth effectively could have a material adverse effect on our business, financial condition and results of operations.
In addition, as we grow, we may open up new offices in new geographic regions that may increase our direct operating expenses without corresponding revenue growth.
We may experience fluctuations in our periodic operating results.
We could experience fluctuations in our periodic operating results due to a number of factors, including the interest rates payable on the debt securities we acquire, the default rates on such securities, the level of our expenses (including the interest rates payable on our borrowings), the dividend rates payable on preferred stock we issue, variations in and the timing of the recognition of realized and unrealized gains or losses, the degree to which we encounter competition in our markets and general economic conditions. As a result of these factors, results for any period should not be relied upon as being indicative of performance in future periods.
We are exposed to risks associated with changes in interest rates, including fluctuations in interest rates which could adversely affect our profitability.
General interest rate fluctuations may have a substantial negative impact on our investments and investment opportunities, and, accordingly, may have a material adverse effect on our investment objective and rate of return on investment capital. A portion of our income will depend upon the difference between the rate at which we borrow funds and the interest rate on the debt securities in which we invest. Because we will borrow money to make investments and may issue debt securities, preferred stock or other securities, our net investment income is dependent upon the difference between the rate at which we borrow funds or pay interest or dividends on such debt securities, preferred stock or other securities and the rate at which we invest these funds. Typically, we anticipate that our interest earning investments will accrue and pay interest at both variable and fixed rates, and that our interest-bearing liabilities will accrue interest at variable rates. The benchmarks used to determine the floating rates earned on our interest earning investments are LIBOR with maturities that range between one and twelve months and alternate base rate, or ABR, (commonly based on the Prime Rate or the Federal Funds Rate), with no fixed maturity date. As a result, there can be no assurance that a significant change in market interest rates will not have a material adverse effect on our net investment income. We use a combination of equity and long-term and short-term borrowings to finance our investment activities.
A significant increase in market interest rates could harm our ability to attract new portfolio companies and originate new loans and investments. We expect that a portion of our investments in debt will be at floating rates with a floor. However, in the event that we make investments in debt at variable rates, a significant increase in market interest rates could also result in an increase in our non-performing assets and a decrease in the value of our portfolio because our floating-rate loan portfolio companies may be unable to meet higher payment obligations. In periods of rising interest rates, our cost of funds would increase, resulting in a decrease in our net investment income. In addition, a decrease in interest rates may reduce net income, because new investments may be made at lower rates despite the increased demand for our capital that the decrease in interest rates may produce. We may, but will not be required to, hedge against the risk of adverse movement in interest rates in our short-term and long-term borrowings relative to our portfolio of assets. If we engage in hedging activities, it may limit our ability to participate in the benefits of lower interest rates with respect to the hedged portfolio. Adverse
33
Table of Contents
developments resulting from changes in interest rates or hedging transactions could have a material adverse effect on our business, financial condition, and results of operations.
Any failure on our part to maintain our status as a BDC would reduce our operating flexibility.
If we fail to continue to qualify as a BDC, we might be regulated as a closed-end investment company under the 1940 Act, which would subject us to substantially more regulatory restrictions under the 1940 Act and correspondingly decrease our operating flexibility and could significantly increase our costs of doing business. Furthermore, any failure to comply with the requirements imposed on BDCs by the 1940 Act could cause the SEC to bring an enforcement action against us.
To the extent we use debt or preferred stock to finance our investments, changes in interest rates will affect our cost of capital and net investment income.
To the extent we borrow money, or issue preferred stock, to make investments, our net investment income will depend, in part, upon the difference between the rate at which we borrow funds or pay dividends on preferred stock and the rate at which we invest those funds. As a result, we can offer no assurance that a significant change in market interest rates will not have a material adverse effect on our net investment income in the event we use debt to finance our investments. In periods of rising interest rates, our cost of funds would increase, except to the extent we issue fixed rate debt or preferred stock, which could reduce our net investment income. We expect that our long-term fixed-rate investments will be financed primarily with equity and long-term debt. We may use interest rate risk management techniques in an effort to limit our exposure to interest rate fluctuations. Such techniques may include various interest rate hedging activities to the extent permitted by the 1940 Act.
A rise in the general level of interest rates can be expected to lead to higher interest rates applicable to our debt investments. Accordingly, an increase in interest rates would make it easier for us to meet or exceed the incentive fee hurdle rate and may result in a substantial increase of the amount of incentive fees payable to our investment adviser with respect to our pre-incentive fee net investment income.
Because we borrow money, there could be increased risk in investing in our company.
Lenders have fixed dollar claims on our assets that are superior to the claims of stockholders, and we have granted, and may in the future grant, lenders a security interest in our assets in connection with borrowings. In the case of a liquidation event, those lenders would receive proceeds before our stockholders. In addition, borrowings, also known as leverage, magnify the potential for gain or loss on amounts invested and, therefore, increase the risks associated with investing in our securities. Leverage is generally considered a speculative investment technique. If the value of our assets increases, then leveraging would cause the net asset value attributable to our common stock to increase more than it otherwise would have had we not leveraged.
Conversely, if the value of our assets decreases, leveraging would cause the net asset value attributable to our common stock to decline more than it otherwise would have had we not leveraged. Similarly, any increase in our revenue in excess of interest expense on our borrowed funds would cause our net income to increase more than it would without the leverage. Any decrease in our revenue would cause our net income to decline more than it would have had we not borrowed funds and could negatively affect our ability to make distributions on common stock. Our ability to service any debt that we incur will depend largely on our financial performance and will be subject to prevailing economic conditions and competitive pressures. We and, indirectly, our stockholders will bear the cost associated with our leverage activity.
There is $232.0 million available to borrow under our revolving credit agreement, or Revolving Facility, and $93.0 million available to borrow under our term loan agreement, or Term Loan Facility.
34
Table of Contents
The Revolving Facility has a maturity date of May 2017 (with a one year term out period beginning in May 2016). The one year term out period is the one year anniversary between the revolver termination date, or the end of the availability period, and the maturity date. During this time, we are required to make mandatory prepayments on our loans from the proceeds we receive from the sale of assets, extraordinary receipts, returns of capital or the issuances of equity or debt.
The Term Loan Facility has a maturity date of May 2018. Each of the Revolving Facility and Term Loan Facility, together the Facilities, includes an accordion feature permitting us to expand the Facilities, if certain conditions are satisfied; provided, however, that the aggregate amount of the Facilities, collectively, is capped at $400.0 million. ING serves as administrative agent, lead arranger and bookrunner under each of the Facilities. As of December 31, 2013 and 2012 there was $204.3 million and $50.0 million of borrowings outstanding against the Facilities at a weighted average interest rate of 3.63% and 4.21%, respectively. As of December 31, 2103 and 2012, our asset coverage ratio was over 200%. Accordingly, to cover the annual interest on our borrowings outstanding at December 31, 2013 and 2012, at the then current rates, we would have to receive an annual yield of at least 0.28% and 0.15% (net of expenses), respectively. This example is for illustrative purposes only, and actual interest rates on our Facility borrowing are likely to fluctuate. See “Management’s Discussion and Analysis of Financial Condition and Results of Operations—Financial Condition, Liquidity and Capital resources—Credit Facility” for additional information about the Facilities.
As a BDC, generally we are not permitted to incur indebtedness unless immediately after such borrowing we have an asset coverage for total borrowings of at least 200% (i.e., the amount of debt may not exceed 50% of the value of our assets). In addition, we may not be permitted to declare any cash dividend or other distribution on our outstanding common shares, or purchase any such shares, unless, at the time of such declaration or purchase, we have asset coverage of at least 200% after deducting the amount of such dividend, distribution, or purchase price. If this ratio declines below 200%, we may not be able to incur additional debt and may need to sell a portion of our investments to repay some debt when it is disadvantageous to do so, and we may not be able to make distributions.
The following table is designed to illustrate the effect on return to a holder of our common stock on the leverage created by our use of borrowing at December 31, 2013 of $204.3 million at an average interest rate at the time of 3.63%, and assuming hypothetical annual returns on our portfolio of minus 10 to plus 10 percent. The table also assumes that we maintain a constant level of leverage and a constant weighted average interest rate. The amount of leverage we use will vary from time to time.
As can be seen, leverage generally increases the return to stockholders when the portfolio return is positive and decreases return to stockholders when the portfolio return is negative. Actual returns may be greater or less than those appearing in the table below.
| Assumed return on portfolio (net of expenses)(1) |
(10.00%) | (5.00%) | 0.00% | 5.00 | % | 10.00 | % | |||||||||||||
| Corresponding return to common stockholders(2) |
(12.23%) | (6.38%) | (0.53%) | 5.31 | % | 11.16 | % |
| (1) | The assumed portfolio return is required by regulation of the SEC and is not a prediction of, and does not represent, our projected or actual performance. |
| (2) | In order to compute the “corresponding return to common stockholders,” the “assumed return on the portfolio” is multiplied by the total value of our assets at the beginning of the period ($406.3 million as of December 31, 2012) to obtain an assumed return to us. From this amount, all interest expense expected to be accrued during the period ($1.9 million) is subtracted to determine the return available to stockholders. The return available to stockholders is then divided by the total value of our net assets as of the beginning of the period ($347.5 million) to determine the “corresponding return to common stockholders.” |
The following table is designed to illustrate the effect on return to a holder of our common stock on the leverage created by our use of borrowing at December 31, 2012 of $50.0 million at an average interest rate at the
35
Table of Contents
time of 4.21%, and assuming hypothetical annual returns on our portfolio of minus 10 to plus 10 percent. The table also assumes that we maintain a constant level of leverage and a constant weighted average interest rate. The amount of leverage we use will vary from time to time. As can be seen, leverage generally increases the return to stockholders when the portfolio return is positive and decreases return to stockholders when the portfolio return is negative. Actual returns may be greater or less than those appearing in the table below.
| Assumed return on portfolio (net of expenses)(1) |
(10.00%) | (5.00%) | 0.00% | 5.00 | % | 10.00 | % | |||||||||||||
| Corresponding return to common stockholders(2) |
(10.55%) | (5.37%) | (0.20%) | 4.98 | % | 10.16 | % |
| (1) | The assumed portfolio return is required by regulation of the SEC and is not a prediction of, and does not represent, our projected or actual performance. |
| (2) | In order to compute the “corresponding return to common stockholders,” the “assumed return on the portfolio” is multiplied by the total value of our assets at the beginning of the period ($277.1 million as of December 31, 2011) to obtain an assumed return to us. From this amount, all interest expense expected to be accrued during the period ($0.7 million) is subtracted to determine the return available to stockholders. The return available to stockholders is then divided by the total value of our net assets as of the beginning of the period ($267.6 million) to determine the “corresponding return to common stockholders.” |
We may default under the Facilities or any future borrowing facility we enter into or be unable to amend, repay or refinance any such facility on commercially reasonable terms, or at all, which could have a material adverse effect on our business, financial condition, results of operations and cash flows.
As of December 31, 2013, substantially all of our assets were pledged as collateral under the Facilities. In the event we default under the Facilities or any other future borrowing facility, our business could be adversely affected as we may be forced to sell all or a portion of our investments quickly and prematurely at what may be disadvantageous prices to us in order to meet our outstanding payment obligations and/or support working capital requirements under the Facilities or such future borrowing facility, any of which would have a material adverse effect on our business, financial condition, results of operations and cash flows. In addition, following any such default, the agent for the lenders under the Facilities or such future borrowing facility could assume control of the disposition of any or all of our assets, including the selection of such assets to be disposed and the timing of such disposition, which would have a material adverse effect on our business, financial condition, results of operations and cash flows.
Substantially all of our assets are subject to security interests under the Facilities and if we default on our obligations under the Facilities we may suffer adverse consequences, including foreclosure on our assets.
As of December 31, 2013, substantially all of our assets were pledged as collateral under the Facilities. If we default on our obligations under the Facilities, the lenders may have the right to foreclose upon and sell, or otherwise transfer, the collateral subject to their security interests or their superior claim. In such event, we may be forced to sell our investments to raise funds to repay our outstanding borrowings in order to avoid foreclosure and these forced sales may be at times and at prices we would not consider advantageous. Moreover, such deleveraging of our company could significantly impair our ability to effectively operate our business in the manner in which we have historically operated. As a result, we could be forced to curtail or cease new investment activities and lower or eliminate the dividends that we have historically paid to our stockholders.
In addition, if the lenders exercise their right to sell the assets pledged under the Facilities, such sales may be completed at distressed sale prices, thereby diminishing or potentially eliminating the amount of cash available to us after repayment of the amounts outstanding under the Facilities.
36
Table of Contents
Because we use debt to finance our investments and may in the future issue senior securities including preferred stock and debt securities, if market interest rates were to increase, our cost of capital could increase, which could reduce our net investment income.
Because we borrow money to make investments and may in the future issue senior securities including preferred stock and debt securities, our net investment income will depend, in part, upon the difference between the rate at which we borrow funds and the rate at which we invest those funds. As a result, we can offer no assurance that a significant change in market interest rates would not have a material adverse effect on our net investment income in the event we use debt to finance our investments. In periods of rising interest rates, our cost of funds would increase, which could reduce our net investment income. We may use interest rate risk management techniques in an effort to limit our exposure to interest rate fluctuations. We may utilize instruments such as forward contracts, currency options and interest rate swaps, caps, collars and floors to seek to hedge against fluctuations in the relative values of our portfolio positions from changes in currency exchange rates and market interest rates to the extent permitted by the 1940 Act. For example, to the extent any such instruments were to constitute senior securities under the 1940 Act, we would have to and will comply with the asset coverage requirements thereunder or, as permitted in lieu thereof, place certain assets in a segregated account to cover such instruments in accordance with SEC guidance, including, for example, Investment Company Act Release No. IC-10666, as applicable. There is otherwise no limit as to our ability to enter into such derivative transactions. In addition, a rise in the general level of interest rates typically leads to higher interest rates applicable to our debt investments. Accordingly, an increase in interest rates may result in an increase of the amount of our pre-incentive fee net investment income and, as a result, an increase in incentive fees payable to THL Credit Advisors. Adverse developments resulting from changes in interest rates or hedging transactions could have a material adverse effect on our business, financial condition and results of operations.
We may in the future determine to fund a portion of our investments with preferred stock, which would magnify the potential for gain or loss and the risks of investing in us in the same way as our borrowings.
Preferred stock, which is another form of leverage, has the same risks to our common stockholders as borrowings because the dividends on any preferred stock we issue must be cumulative. Payment of such dividends and repayment of the liquidation preference of such preferred stock must take preference over any dividends or other payments to our common stockholders, and preferred stockholders are not subject to any of our expenses or losses and are not entitled to participate in any income or appreciation in excess of their stated preference.
Our use of borrowed funds to make investments exposes us to risks typically associated with leverage.
We borrow money and may issue additional debt securities or preferred stock to leverage our capital structure. As a result:
| • | our common shares would be exposed to incremental risk of loss; therefore, a decrease in the value of our investments would have a greater negative impact on the value of our common shares than if we did not use leverage; |
| • | any depreciation in the value of our assets may magnify losses associated with an investment and could totally eliminate the value of an asset to us; |
| • | if we do not appropriately match the assets and liabilities of our business and interest or dividend rates on such assets and liabilities, adverse changes in interest rates could reduce or eliminate the incremental income we make with the proceeds of any leverage; |
| • | our ability to pay dividends on our common stock may be restricted if our asset coverage ratio, as provided in the 1940 Act, is not at least 200%, and any amounts used to service indebtedness or preferred stock would not be available for such dividends; |
| • | any credit facility would be subject to periodic renewal by our lenders, whose continued participation cannot be guaranteed; |
37
Table of Contents
| • | such securities would be governed by an indenture or other instrument containing covenants restricting our operating flexibility or affecting our investment or operating policies, and may require us to pledge assets or provide other security for such indebtedness; |
| • | we, and indirectly our common stockholders, bear the entire cost of issuing and paying interest or dividends on such securities; |
| • | if we issue preferred stock, the special voting rights and preferences of preferred stockholders may result in such stockholders’ having interests that are not aligned with the interests of our common stockholders, and the rights of our preferred stockholders to dividends and liquidation preferences will be senior to the rights of our common stockholders; |
| • | any convertible or exchangeable securities that we issue may have rights, preferences and privileges more favorable than those of our common shares; and |
| • | any custodial relationships associated with our use of leverage would conform to the requirements of the 1940 Act, and no creditor would have veto power over our investment policies, strategies, objectives or decisions except in an event of default or if our asset coverage was less than 200%. |
Under the provisions of the 1940 Act, we are permitted, as a BDC, to issue senior securities only in amounts such that our asset coverage ratio equals at least 200% after each issuance of senior securities. If the value of our assets declines, we may be unable to satisfy this test and we may be required to sell a portion of our investments and, depending on the nature of our leverage, repay a portion of our senior securities at a time when such sales may be disadvantageous.
There is a risk that we may not make distributions and consequently will become subject to corporate-level income tax.
We cannot assure you that we will achieve investment results that will allow us to make a specified level of cash distributions or periodically increase our dividend rate.
As a BDC, we are required to carry our investments at market value or, if no market value is ascertainable, at fair value as determined in good faith by or under the direction of our board of directors. Decreases in the market values or fair values of our investments will be recorded as unrealized depreciation. Any unrealized depreciation in our investment portfolio could be an indication of a portfolio company’s potential inability to meet its repayment obligations to us. This could result in realized losses in the future and ultimately in reductions of our income available for distribution in future periods.
To maintain our qualification as a RIC under the Code, we must meet certain source of income, asset diversification and annual distribution requirements. The annual distribution requirement for a RIC is satisfied if we distribute at least 90% of our ordinary income and realized net short-term capital gains in excess of realized net long-term capital losses, if any, to our stockholders on an annual basis. To the extent we use debt financing or preferred stock, we may become subject to certain asset coverage ratio requirements and other financial covenants under the terms of our debt or preferred stock, and could in some circumstances also become subject to similar requirements under the 1940 Act, that could, under certain circumstances, restrict us from making distributions necessary to qualify as a RIC. To qualify as a RIC, we must also meet certain asset diversification requirements as the end of each calendar quarter. Failure to meet these tests may result in our having to dispose of certain investments quickly in order to prevent the loss of RIC status. Because we anticipate that most of our investments will be in private companies, any such dispositions could be made at disadvantageous prices and may result in substantial losses. If we are unable to obtain cash from other sources, or otherwise prohibited from making distributions, we may fail to qualify as a RIC and, thus, may be subject to corporate-level income tax. If we fail to qualify as a RIC for any reason and become subject to corporate-level income tax, the resulting corporate-level income taxes could substantially reduce our net assets, the amount of income available for distribution and the amount of our distributions.
38
Table of Contents
To the extent original issue discount and PIK interest constitute a portion of our income, we will be exposed to typical risks associated with such income being required to be included in taxable and accounting income prior to receipt of cash representing such income.
Our investments may include original issue discount, or OID, instruments and contractual PIK, interest, which represents contractual interest added to a loan balance and due at the end of such loan’s term. To the extent OID or PIK interest constitute a portion of our income, we are exposed to typical risks associated with such income being required to be included in taxable and accounting income prior to receipt of cash.
We may have difficulty paying our required distributions if we recognize income before or without receiving cash representing such income.
For federal income tax purposes, we may include in income certain amounts that we have not yet received in cash, such as original issue discount, which may arise if we receive warrants in connection with the making of a loan or possibly in other circumstances, or PIK interest, which represents contractual interest added to the loan balance and due at the end of the loan term. Such original issue discount, which could be significant relative to our overall investment activities, or increases in loan balances as a result of PIK arrangements are included in income before we receive any corresponding cash payments. In addition, the PIK interest of many subordinated loans effectively operates as negative amortization of loan principal, thereby increasing credit risk exposure over the life of the loan because more will be owed at the end of the term of the loan than was owed when the loan was initially originated. We also may be required to include in income certain other amounts that we do not receive in cash.
Since we may recognize income before or without receiving cash representing such income, we may have difficulty meeting the tax requirement to distribute at least 90% of our ordinary income and realized net short-term capital gains in excess of realized net long-term capital losses, if any, to maintain our status as a RIC. Accordingly, we may have to sell some of our investments at times we would not consider advantageous, raise additional debt or equity capital or reduce new investment originations to meet these distribution requirements.
We may pay incentive fee on income we do not receive in cash.
That part of the incentive fee payable by us that relates to our net investment income is computed and paid on income that may include interest that has been accrued but not yet received in cash. If a portfolio company defaults on a loan, it is possible that accrued interest previously used in the calculation of the incentive fee will become uncollectible. Consequently, while we may make incentive fee payments on income accruals that we may not collect in the future and with respect to which we do not have a formal clawback right against our investment adviser per se, the amount of accrued income written off in any period will reduce the income in the period in which such write-off was taken and thereby reduce such period’s incentive fee payment, but only to the extent that such an incentive fee is payable for that period because the write-off will not be carried forward to reduce any incentive fee payable in subsequent quarters.
The highly competitive market in which we operate may limit our investment opportunities.
A number of entities compete with us to make the types of investments that we make. We compete with other BDCs, public and private funds, commercial and investment banks, CLO funds, commercial finance companies, and, to the extent they provide an alternative form of financing, private equity and hedge funds. Additionally, because competition for investment opportunities generally has increased among alternative investment vehicles such as hedge funds, entities have begun to invest in areas in which they had not traditionally invested. As a result of these new entrants, competition for investment opportunities intensified in recent years and may intensify further in the future. Some of our existing and potential competitors are substantially larger and have considerably greater financial, technical and marketing resources than we do. For example, some competitors may have a lower cost of funds and access to funding sources that are not available to us. In addition,
39
Table of Contents
some of our competitors may have higher risk tolerances or different risk assessments, which could allow them to consider a wider variety of investments and establish more relationships than us. Furthermore, many of our competitors are not subject to the regulatory restrictions that the 1940 Act imposes on us as a BDC and that the Code imposes on us as a RIC. We cannot assure you that the competitive pressures we face will not have a material adverse effect on our business, financial condition and results of operations. Also, as a result of this existing and potentially increasing competition, we may not be able to take advantage of attractive investment opportunities from time to time, and we can offer no assurance that we will be able to identify and make investments that are consistent with our investment objective.
We are dependent upon senior management personnel of our investment adviser for our future success, and if our investment adviser is unable to retain qualified personnel or if our investment adviser loses any member of its senior management team, our ability to achieve our investment objective could be significantly harmed.
We depend on the members of senior management of THL Credit Advisors, particularly its Chief Executive Officer and Chief Investment Officer, James K. Hunt, its Co-Presidents, W. Hunter Stropp, Sam W. Tillinghast, and Christopher J. Flynn, its Chief Operating Officer and Chief Financial Officer, Terrence W. Olson, its Chief Legal Officer, Stephanie Paré Sullivan, collectively, the THL Credit Principals. Messrs. Hunt, Stropp, Tillinghast and Flynn constitute the investment principals of THL Credit Advisors, or the THL Credit Investment Principals. The THL Credit Investment Principals and other investment professionals make up our investment team and are responsible for the identification, final selection, structuring, closing and monitoring of our investments. These investment team members have critical industry experience and relationships that we will rely on to implement our business plan. Our future success depends on the continued service of the THL Credit Principals and the rest of our investment adviser’s senior management team. The departure of any of the members of THL Credit Advisors’ senior management or a significant number of the members of its investment team could have a material adverse effect on our ability to achieve our investment objective. As a result, we may not be able to operate our business as we expect, and our ability to compete could be harmed, which could cause our operating results to suffer. In addition, we can offer no assurance that THL Credit Advisors will remain our investment adviser or our administrator.
Our investment adviser has the right to resign on 60 days’ notice, and we may not be able to find a suitable replacement within that time, resulting in a disruption in our operations that could adversely affect our business, financial condition and results of operations.
THL Credit Advisors has the right, under our investment management agreement, to resign at any time upon not more than 60 days’ written notice, whether we have found a new replacement or not. If our investment adviser resigns, we may not be able to find a new investment adviser or hire internal management with similar expertise and ability to provide the same or equivalent services on acceptable terms within 60 days, or at all. If we are unable to do so quickly, our operations are likely to experience a disruption, our financial condition, business and results of operations as well as our ability to pay distributions are likely to be adversely affected and the market price of our shares may decline. In addition, the coordination of our internal management and investment activities is likely to suffer if we are unable to identify and reach an agreement with a single institution or group of executives having the expertise possessed by our investment adviser and its affiliates. Even if we are able to retain comparable management, whether internal or external, the integration of such management and their lack of familiarity with our investment objective may result in additional costs and time delays that may adversely affect our business, financial condition and results of operations.
Because we expect to distribute substantially all of our net investment income and net realized capital gains to our stockholders, we will need additional capital to finance our growth and such capital may not be available on favorable terms or at all.
We have elected to be taxed for federal income tax purposes as a RIC under Subchapter M of the Code. If we meet certain requirements, including source of income, asset diversification and distribution requirements,
40
Table of Contents
and if we continue to qualify as a BDC, we will continue to qualify to be a RIC under the Code and will not have to pay corporate-level income taxes on income we distribute to our stockholders as dividends, allowing us to substantially reduce or eliminate our corporate-level income tax liability. As a BDC, we are generally required to meet a coverage ratio of total assets to total senior securities, which includes all of our borrowings and any preferred stock we may issue in the future, of at least 200% at the time we issue any debt or preferred stock. This requirement limits the amount that we may borrow. Because we will continue to need capital to grow our investment portfolio, this limitation may prevent us from incurring debt or preferred stock and require us to raise additional equity at a time when it may be disadvantageous to do so. We cannot assure you that debt and equity financing will be available to us on favorable terms, or at all, and debt financings may be restricted by the terms of any of our outstanding borrowings. In addition, as a BDC, we are generally not permitted to issue common stock priced below net asset value without stockholder approval. If additional funds are not available to us, we could be forced to curtail or cease new lending and investment activities, and our net asset value could decline.
Our board of directors may change our investment objective, operating policies and strategies without prior notice or stockholder approval.
Our board of directors has the authority to modify or waive certain of our operating policies and strategies without prior notice and without stockholder approval (except as required by the 1940 Act). However, absent stockholder approval, we may not change the nature of our business so as to cease to be, or withdraw our election as, a BDC. We cannot predict the effect any changes to our current operating policies and strategies would have on our business, operating results or value of our stock. Nevertheless, the effects could adversely affect our business and impact our ability to make distributions and cause you to lose all or part of your investment.
Our investment adviser and its affiliates, senior management and employees have certain conflicts of interest.
Our investment adviser, its senior management and employees serve or may serve as investment advisers, officers, directors or principals of entities that operate in the same or a related line of business. For example, THL Credit Advisors serves as investment adviser to one or more registered closed-end funds. In addition, our officers may serve in similar capacities for one or more registered closed-end funds. Accordingly, these individuals may have obligations to investors in those entities or funds, the fulfillment of which might not be in our best interests or the best interests of our stockholders. In addition, certain of the personnel employed by our investment adviser or focused on our business may change in ways that are detrimental to our business. Any affiliated investment vehicle formed in the future and managed by THL Credit Advisors or its affiliates may invest in asset classes similar to those targeted by us. As a result, THL Credit Advisors may face conflicts in allocating investment opportunities between us and such other entities. Although THL Credit Advisors will endeavor to allocate investment opportunities in a fair and equitable manner, it is possible that we may not be given the opportunity to participate in such investments. In any such case, if THL Credit Advisors forms other affiliates in the future, it is possible we may co-invest on a concurrent basis with such other affiliates, subject to compliance with applicable regulations and regulatory guidance, as well as applicable allocation procedures. In certain circumstances, negotiated co-investments may be made only if we receive an order from the SEC permitting us to do so. We, THL Credit Advisors and certain of its affiliates have submitted an exemptive application to the SEC to permit us to co-invest with other funds managed by THL Credit Advisors or its affiliates in a manner consistent with our investment objective, positions, policies, strategies and restrictions as well as regulatory requirements and other pertinent factors. There can be no assurance that any such exemptive order will be obtained.
There are potential conflicts of interest between us and the funds managed by us which could impact our investment returns.
THL Credit Greenway Fund LLC, or Greenway, and THL Credit Greenway Fund II LLC, or Greenway II LLC, are portfolio companies and are managed by us. As contemplated in the Greenway II LLC limited liability agreement, we established a related investment vehicle and entered into an investment management agreement
41
Table of Contents
with an account set up by an unaffiliated third party investor to invest alongside Greenway II LLC pursuant to similar economic terms. The account is also managed by us. References to “Greenway II” herein include Greenway II LLC and the accounts of related investment vehicles.
Certain of our officers serve or may serve in an investment management capacity to Greenway and Greenway II. As a result, investment professionals may allocate such time and attention as is deemed appropriate and necessary to carry out operations of Greenway and Greenway II. In this respect, they may experience diversions of their attention from us and potential conflicts of interest between their work for us and their work for Greenway and Greenway II in the event that the interests of Greenway and Greenway II run counter to our interests.
Greenway and Greenway II invests in the same or similar asset classes that we target. These investments may be made at the direction of the same individuals acting in their capacity on behalf of us, Greenway and Greenway II. As a result, there may be conflicts in the allocation of investment opportunities between us, Greenway and Greenway II. We may or may not participate in investments made by funds managed by us or one of our affiliates.
We are dependent on information systems and systems failures could significantly disrupt our business, which may, in turn, negatively affect the market price of our common stock and our ability to pay dividends.
Our business is dependent on our and third parties’ communications and information systems. Any failure or interruption of those systems, including as a result of the termination of an agreement with any third-party service providers, could cause delays or other problems in our activities. Our financial, accounting, data processing, backup or other operating systems and facilities may fail to operate properly or become disabled or damaged as a result of a number of factors including events that are wholly or partially beyond our control and adversely affect our business. There could be:
| • | sudden electrical or telecommunications outages; |
| • | natural disasters such as earthquakes, tornadoes and hurricanes; |
| • | disease pandemics; |
| • | events arising from local or larger scale political or social matters, including terrorist acts; and |
| • | cyber-attacks. |
These events, in turn, could have a material adverse effect on our operating results and negatively affect the market price of our common stock and our ability to pay dividends to our stockholders.
Our base management fee may induce our investment adviser to incur leverage.
Our base management fee is calculated on the basis of our total assets, including assets acquired with the proceeds of leverage. This may encourage the Advisor to use leverage to increase the aggregate amount of and the return on our investments, even when it may not be appropriate to do so, and to refrain from delevering when it would otherwise be appropriate to do so. Under certain circumstances, the use of increased leverage may increase the likelihood of default, which would impair the value of our common stock. Given the subjective nature of the investment decisions made by our investment adviser on our behalf, we will not be able to monitor this conflict of interest.
42
Table of Contents
Our incentive fee may induce our investment adviser to make certain investments, including speculative investments.
The incentive fee payable by us to THL Credit Advisors may create an incentive for THL Credit Advisors to make investments on our behalf that are risky or more speculative than would be the case in the absence of such compensation arrangement. The way in which the incentive fee payable to THL Credit Advisors is determined, which is calculated separately in two components as a percentage of the interest and other ordinary income in excess of a quarterly minimum hurdle rate and as a percentage of the realized gain on invested capital, may encourage our THL Credit Advisors to use leverage or take additional risk to increase the return on our investments. Under certain circumstances, the use of leverage may increase the likelihood of default, which would disfavor the holders of our common stock, or of securities convertible into our common stock or warrants representing rights to purchase our common stock or securities convertible into our common stock. In addition, THL Credit Advisors receives the incentive fee based, in part, upon net capital gains realized on our investments. Unlike the portion of the incentive fee based on ordinary income, there is no minimum level of gain applicable to the portion of the incentive fee based on net capital gains. As a result, THL Credit Advisors may have an incentive to invest more in investments that are likely to result in capital gains as compared to income producing securities or to advance or delay realizing a gain in order to enhance its incentive fee. This practice could result in our investing in more speculative securities than would otherwise be the case, which could result in higher investment losses, particularly during economic downturns. A rise in the general level of interest rates can be expected to lead to higher interest rates applicable to certain of our debt investments and may accordingly result in a substantial increase of the amount of incentive fees payable to our investment adviser with respect to our pre-incentive fee net investment income.
We may invest, to the extent permitted by law, in the securities and instruments of other investment companies, including private funds, and, to the extent we so invest, we will bear our ratable share of any such investment company’s expenses, including management and performance fees. We will also remain obligated to pay management and incentive fees to THL Credit Advisors with respect to the assets invested in the securities and instruments of other investment companies. With respect to each of these investments, each of our common stockholders will bear his or her share of the management and incentive fee of THL Credit Advisors as well as indirectly bear the management and performance fees and other expenses of any investment companies in which we invest.
We may be obligated to pay our investment adviser incentive compensation payments even if we have incurred unrecovered cumulative losses from more than three years prior to such payments and may pay more than 20% of our net capital gains as incentive compensation payments because we cannot recover payments made in previous years.
Our investment adviser will be entitled to incentive compensation for each fiscal quarter in an amount equal to a percentage of the excess of our investment income for that quarter (before deducting incentive compensation) above a threshold return for that quarter and subject to a total return requirement. The general effect of this total return requirement is to prevent payment of the foregoing incentive compensation except to the extent 20.0% of the cumulative net increase in net assets resulting from operations over the then current and 11 preceding calendar quarters exceeds the cumulative incentive fees accrued and/or paid for the 11 preceding calendar quarters. Consequently, we may pay an incentive fee if we incurred losses more than three years prior to the current calendar quarter even if such losses have not yet been recovered in full. Thus, we may be required to pay our investment adviser incentive compensation for a fiscal quarter even if there is a decline in the value of our portfolio or we incur a net loss for that quarter. If we pay an incentive fee of 20.0% of our realized capital gains (net of all realized capital losses and unrealized capital depreciation on a cumulative basis) and thereafter experience additional realized capital losses or unrealized capital depreciation, we will not be able to recover any portion of the incentive fee previously paid.
43
Table of Contents
RISKS RELATED TO OUR INVESTMENTS
We invest primarily in debt and equity securities of middle market companies and we may not realize gains from our equity investments.
We are a direct lender to middle market companies, and invest in subordinated, or mezzanine, debt and second lien senior secured debt, which may include an associated equity component such as warrants, preferred stock or other similar securities. We may also selectively invest in first lien secured loans that generally have structures with higher interest rates, which include unitranche investments, or loan structures that combine characteristics of traditional first lien senior secured as well as second lien and subordinated loans. In certain instances we will also make direct equity investments, including equity investments into or through funds, and we may also selectively invest in more broadly syndicated first lien secured loans from time to time. From time to time, we will also make direct equity investments in equity of collateralized loan obligations, or CLOs. Investments in CLOs can be significantly impacted by change in the market value of the assets, the distributions on the assets, defaults and recoveries on the assets, capital gains and losses on the assets along with prices, interest rates and other risks associated with the assets. Our goal is ultimately to dispose of such equity interests and realize gains upon our disposition of such interests. However, the equity interests we receive may not appreciate in value and, in fact, may decline in value. Accordingly, we may not be able to realize gains from our equity interests, and any gains that we do realize on the disposition of any equity interests may not be sufficient to offset any other losses we experience.
Our investments in prospective private and middle market portfolio companies are risky, and we could lose all or part of our investment.
Investment in private and middle market companies involves a number of significant risks. Generally, little public information exists about these companies, and we are required to rely on the ability of THL Credit Advisors’ investment professionals to obtain adequate information to evaluate the potential returns from investing in these companies. If we are unable to uncover all material information about these companies, we may not make a fully informed investment decision, and we may lose money on our investments. Middle market companies may have limited financial resources and may be unable to meet their obligations under their debt securities that we hold, which may be accompanied by a deterioration in the value of any collateral and a reduction in the likelihood of our realizing any guarantees we may have obtained in connection with our investment. In addition, they typically have shorter operating histories, narrower product lines and smaller market shares than larger businesses, which tend to render them more vulnerable to competitors’ actions and market conditions, as well as general economic downturns. Additionally, middle market companies are more likely to depend on the management talents and efforts of a small group of persons; therefore, the death, disability, resignation or termination of one or more of these persons could have a material adverse impact on our portfolio company and, in turn, on us. Middle market companies also generally have less predictable operating results, may from time to time be parties to litigation, may be engaged in rapidly changing businesses with products subject to a substantial risk of obsolescence and may require substantial additional capital to support their operations, finance expansion or maintain their competitive position. In addition, our executive officers, directors and our investment adviser may, in the ordinary course of business, be named as defendants in litigation arising from our investments in the portfolio companies.
Our investments in lower credit quality obligations are risky and highly speculative, and we could lose all or part of our investment.
Most of our debt investments are likely to be in lower grade obligations. The lower grade investments in which we invest may be rated below investment grade by one or more nationally-recognized statistical rating agencies at the time of investment or may be unrated but determined by the Advisor to be of comparable quality. Debt securities rated below investment grade are commonly referred to as “junk bonds” and are considered speculative with respect to the issuer’s capacity to pay interest and repay principal. The debt in which we invest typically is not rated by any rating agency, but we believe that if such investments were rated, they would be
44
Table of Contents
below investment grade (rated lower than “Baa3” by Moody’s Investors Service, lower than “BBB-” by Fitch Ratings or lower than “BBB-” by Standard & Poor’s). We may invest without limit in debt of any rating, as well as debt that has not been rated by any nationally recognized statistical rating organization.
Investment in lower grade investments involves a substantial risk of loss. Lower grade securities or comparable unrated securities are considered predominantly speculative with respect to the issuer’s ability to pay interest and principal and are susceptible to default or decline in market value due to adverse economic and business developments. The market values for lower grade debt tend to be very volatile and are less liquid than investment grade securities. For these reasons, your investment in our company is subject to the following specific risks: increased price sensitivity to a deteriorating economic environment; greater risk of loss due to default or declining credit quality; adverse company specific events are more likely to render the issuer unable to make interest and/or principal payments; and if a negative perception of the lower grade debt market develops, the price and liquidity of lower grade securities may be depressed. This negative perception could last for a significant period of time.
We may not be in a position to exercise control over our portfolio companies or to prevent decisions by management of our portfolio companies that could decrease the value of our investments.
We do not generally intend to take controlling equity positions in our portfolio companies. To the extent that we do not hold a controlling equity interest in a portfolio company, we are subject to the risk that such portfolio company may make business decisions with which we disagree, and the stockholders and management of such portfolio company may take risks or otherwise act in ways that are adverse to our interests. Due to the lack of liquidity for the debt and equity investments that we typically hold in our portfolio companies, we may not be able to dispose of our investments in the event we disagree with the actions of a portfolio company, and may therefore suffer a decrease in the value of our investments.
In addition, we may not be in a position to control any portfolio company by investing in its debt securities. As a result, we are subject to the risk that a portfolio company in which we invest may make business decisions with which we disagree and the management of such company, as representatives of the holders of their common equity, may take risks or otherwise act in ways that do not serve our interests as debt investors.
Our portfolio companies may be highly leveraged.
Some of our portfolio companies may be highly leveraged, which may have adverse consequences to these companies and to us as an investor. These companies may be subject to restrictive financial and operating covenants and the leverage may impair these companies’ ability to finance their future operations and capital needs. As a result, these companies’ flexibility to respond to changing business and economic conditions and to take advantage of business opportunities may be limited. Further, a leveraged company’s income and net assets will tend to increase or decrease at a greater rate than if borrowed money were not used.
Our portfolio companies may incur debt that ranks equally with, or senior to, our investments in such companies.
The portfolio companies in which we have invested debt capital usually have, or may be permitted to incur with certain limitations, other debt that ranks equally with, or senior to, the debt securities in which we invest. By their terms, such debt instruments may provide that the holders are entitled to receive payment of interest or principal on or before the dates on which we are entitled to receive payments in respect of the debt securities in which we invest. Also, in the event of insolvency, liquidation, dissolution, reorganization or bankruptcy of a portfolio company, holders of debt instruments ranking senior to our investment in that portfolio company would typically be entitled to receive payment in full before we receive any distribution in respect of our investment. After repaying such senior creditors, such portfolio company may not have any remaining assets to use for repaying its obligation to us. In the case of debt ranking equally with debt securities in which we invest, we
45
Table of Contents
would have to share any distributions on an equal and ratable basis with other creditors holding such debt in the event of an insolvency, liquidation, dissolution, reorganization or bankruptcy of the relevant portfolio company.
Additionally, certain loans that we make to portfolio companies may be secured on a second priority basis by the same collateral securing senior secured debt of such companies. The first priority liens on the collateral will secure the portfolio company’s obligations under any outstanding senior debt and may secure certain other future debt that may be permitted to be incurred by the portfolio company under the agreements governing the loans. The holders of obligations secured by the first priority liens on the collateral will generally control the liquidation of and be entitled to receive proceeds from any realization of the collateral to repay their obligations in full before us. In addition, the value of the collateral in the event of liquidation will depend on market and economic conditions, the availability of buyers and other factors. There can be no assurance that the proceeds, if any, from the sale or sales of all of the collateral would be sufficient to satisfy the loan obligations secured by the second priority liens after payment in full of all obligations secured by the first priority liens on the collateral. If such proceeds are not sufficient to repay amounts outstanding under the loan obligations secured by the second priority liens, then we, to the extent not repaid from the proceeds of the sale of the collateral, will only have an unsecured claim against the portfolio company’s remaining assets, if any.
The rights we may have with respect to the collateral securing the mezzanine, or subordinated, loans and second lien loans we make to our portfolio companies with senior debt outstanding may also be limited pursuant to the terms of one or more intercreditor agreements that we enter into with the holders of senior debt. Under such an intercreditor agreement, at any time that obligations that have the benefit of the first priority liens are outstanding, any of the following actions that may be taken in respect of the collateral will be at the direction of the holders of the obligations secured by the first priority liens: the ability to cause the commencement of enforcement proceedings against the collateral; the ability to control the conduct of such proceedings; the approval of amendments to collateral documents; releases of liens on the collateral; and waivers of past defaults under collateral documents. We may not have the ability to control or direct such actions, even if our rights are adversely affected.
If the assets securing the loans that we make decrease in value, then we may lack sufficient collateral to cover losses.
We will at times take a security interest in the available assets of these portfolio companies, including the equity interests of their subsidiaries and, in some cases, the equity interests of our portfolio companies held by their stockholders. There is a risk that the collateral securing these types of loans may decrease in value over time, may be difficult to sell in a timely manner, may be difficult to appraise and may fluctuate in value based upon the success of the business and market conditions, including as a result of the inability of a portfolio company to raise additional capital. In some circumstances, our lien could be subordinated to claims of other creditors. Additionally, deterioration in a portfolio company’s financial condition and prospects, including its inability to raise additional capital, may be accompanied by deterioration in the value of the collateral for these types of loans. Moreover, in the case of most of our investments, we do not have a first lien position on the collateral. Consequently, the fact that a loan may be secured does not guarantee that we will receive principal and interest payments according to the loan’s terms, or that we will be able to collect on the loan should we be forced to enforce our remedies.
Economic downturns or recessions could impair the value of the collateral for our loans to our portfolio companies and consequently increase the possibility of an adverse effect on our financial condition and results of operations.
Many of our portfolio companies are susceptible to economic recessions and may be unable to repay our loans during such periods. Therefore, our non-performing assets are likely to increase and the value of our portfolio is likely to decrease during such periods. Adverse economic conditions may also decrease the value of collateral securing some of our loans and the value of our equity investments.
46
Table of Contents
Economic slowdowns or recessions could lead to financial losses in our portfolio and a decrease in revenues, net income and assets. Unfavorable economic conditions also could increase our funding costs, limit our access to the capital markets or result in a decision by lenders not to extend credit to us.
A portfolio company’s failure to satisfy financial or operating covenants imposed by us or other lenders could lead to defaults and, potentially, termination of the portfolio company’s loans and foreclosure on its secured assets, which could trigger cross-defaults under other agreements and jeopardize the portfolio company’s ability to meet its obligations under the debt securities that we hold. We may incur expenses to the extent necessary to seek recovery upon default or to negotiate new terms with a defaulting portfolio company. In addition, if a portfolio company goes bankrupt, even though we may have structured our investment as mezzanine debt, or senior secured debt, depending on the facts and circumstances, including the extent to which we actually provided significant “managerial assistance,” if any, to that portfolio company, a bankruptcy court might re-characterize our debt holding and subordinate all or a portion of our claim to that of other creditors. These events could harm our financial condition and operating results.
We may suffer a loss if a portfolio company defaults on a loan and the underlying collateral is not sufficient.
In the event of a default by a portfolio company on a secured loan, we will only have recourse to the assets collateralizing the loan. If the underlying collateral value is less than the loan amount, we will suffer a loss. In addition, we often make loans that are unsecured, which are subject to the risk that other lenders may be directly secured by the assets of the portfolio company. In the event of a default, those collateralized lenders would have priority over us with respect to the proceeds of a sale of the underlying assets. In cases described above, we may lack control over the underlying asset collateralizing our loan or the underlying assets of the portfolio company prior to a default, and as a result the value of the collateral may be reduced by acts or omissions by owners or managers of the assets.
In the event of bankruptcy of a portfolio company, we may not have full recourse to its assets in order to satisfy our loan, or our loan may be subject to equitable subordination. In addition, certain of our loans are subordinate to other debt of the portfolio company. If a portfolio company defaults on our loan or on debt senior to our loan, or in the event of a portfolio company bankruptcy, our loan will be satisfied only after the senior debt receives payment. Where debt senior to our loan exists, the presence of intercreditor arrangements may limit our ability to amend our loan documents, assign our loans, accept prepayments, exercise our remedies (through “standstill” periods) and control decisions made in bankruptcy proceedings relating to the portfolio company. Bankruptcy and portfolio company litigation can significantly increase collection losses and the time needed for us to acquire the underlying collateral in the event of a default, during which time the collateral may decline in value, causing us to suffer losses.
If the value of collateral underlying our loan declines or interest rates increase during the term of our loan, a portfolio company may not be able to obtain the necessary funds to repay our loan at maturity through refinancing. Decreasing collateral value and/or increasing interest rates may hinder a portfolio company’s ability to refinance our loan because the underlying collateral cannot satisfy the debt service coverage requirements necessary to obtain new financing. If a borrower is unable to repay our loan at maturity, we could suffer a loss which may adversely impact our financial performance.
Our loans could be subject to equitable subordination by a court which would increase our risk of loss with respect to such loans.
Courts may apply the doctrine of equitable subordination to subordinate the claim or lien of a lender against a borrower to claims or liens of other creditors of the borrower, when the lender or its affiliates is found to have engaged in unfair, inequitable or fraudulent conduct. The courts have also applied the doctrine of equitable subordination when a lender or its affiliates is found to have exerted inappropriate control over a client, including
47
Table of Contents
control resulting from the ownership of equity interests in a client. We have made direct equity investments or received warrants in connection with loans representing approximately 0.90% of the aggregate outstanding amortized cost basis of our portfolio as of December 31, 2013. Payments on one or more of our loans, particularly a loan to a client in which we also hold an equity interest, may be subject to claims of equitable subordination. If we were deemed to have the ability to control or otherwise exercise influence over the business and affairs of one or more of our portfolio companies resulting in economic hardship to other creditors of that company, this control or influence may constitute grounds for equitable subordination and a court may treat one or more of our loans as if it were unsecured or common equity in the portfolio company. In that case, if the portfolio company were to liquidate, we would be entitled to repayment of our loan on a pro-rata basis with other unsecured debt or, if the effect of subordination was to place us at the level of common equity, then on an equal basis with other holders of the portfolio company’s common equity only after all of its obligations relating to its debt and preferred securities had been satisfied.
Our failure to make follow-on investments in our portfolio companies could impair the value of our portfolio.
Following an initial investment in a portfolio company, we may make additional investments in that portfolio company as “follow-on” investments in order to: (1) increase or maintain in whole or in part our equity ownership percentage; (2) exercise warrants, options or convertible securities that were acquired in the original or subsequent financing; or (3) attempt to preserve or enhance the value of our initial investment. We have the discretion to make any follow-on investments, subject to the availability of capital resources. We may elect not to make follow-on investments or otherwise lack sufficient funds to make those investments. Our failure to make follow-on investments may, in some circumstances, jeopardize the continued viability of a portfolio company and our initial investment, or may result in a missed opportunity for us to increase our participation in a successful operation. Even if we have sufficient capital to make a desired follow-on investment, we may elect not to make such follow-on investment because we may not want to increase our concentration of risk, because we prefer other opportunities, because we are inhibited by compliance with BDC requirements or because we desire to maintain our tax status.
Our ability to invest in public companies may be limited in certain circumstances.
To maintain our status as a BDC, we are not permitted to acquire any assets other than “qualifying assets” specified in the 1940 Act unless, at the time the acquisition is made, at least 70% of our total assets are qualifying assets (with certain limited exceptions). Subject to certain exceptions for follow-on investments and distressed companies, an investment in an issuer that has outstanding securities listed on a national securities exchange may be treated as a qualifying asset only if such issuer has a market capitalization that is less than $250 million at the time of such investment and meets the other specified requirements.
A failure or the perceived risk of a failure to raise the statutory debt limit of the United States could have a material adverse effect on our business, financial condition and results of operations.
In the future, the federal government may not be able to meet its debt payments unless the federal debt ceiling is raised. In such circumstance, if legislation increasing the debt ceiling is not enacted in a timely manner and the debt ceiling is reached, the federal government may stop or delay making payments on its obligations. A failure by Congress to raise the debt limit would increase the risk of default by the United States on its obligations, as well as the risk of other economic dislocations. In addition, if the U.S. Government fails to complete its budget process or to provide for a continuing resolution before the expiration of a then-in-place continuing resolution, a federal government shutdown may result. Such a failure or the perceived risk of such a failure consequently could have a material adverse effect on the financial markets and economic conditions in the United States and throughout the world. It could also limit our ability and the ability of our portfolio companies to obtain financing, and it could have a material adverse effect on the valuation of our portfolio companies. Consequently, the continued uncertainty in the general economic environment, including the government
48
Table of Contents
shutdown in October 2013 and potential debt ceiling implications, as well in specific economies of several individual geographic markets in which our portfolio companies operate, could adversely affect our business, financial condition and results of operations.
Uncertainty about the financial stability of the United States and of several countries in the European Union (EU) could have a significant adverse effect on our business, results of operations and financial condition.
Due to federal budget deficit concerns, S&P downgraded the federal government’s credit rating from AAA to AA+ for the first time in history on August 5, 2011. Further, Moody’s and Fitch have warned that they may downgrade the federal government’s credit rating. Further downgrades or warnings by S&P or other rating agencies, and the government’s credit and deficit concerns in general, could cause interest rates and borrowing costs to rise, which may negatively impact both the perception of credit risk associated with our debt portfolio and our ability to access the debt markets on favorable terms. In addition, a decreased credit rating could create broader financial turmoil and uncertainty, which may weigh heavily on our financial performance and the value of our common stock.
In 2010, a financial crisis emerged in Europe, triggered by high budget deficits and rising direct and contingent sovereign debt in Greece, Ireland, Italy, Portugal and Spain, which created concerns about the ability of these nations to continue to service their sovereign debt obligations. Risks and ongoing concerns resulting from the debt crisis in Europe could have a detrimental impact on the global economic recovery, sovereign and non-sovereign debt in these countries and the financial condition of European financial institutions. Market and economic disruptions have affected, and may continue to affect, consumer confidence levels and spending, personal bankruptcy rates, levels of incurrence and default on consumer debt and home prices, among other factors. We cannot assure you that the market disruptions in Europe, including the increased cost of funding for certain governments and financial institutions, will not spread, and we cannot assure you that future assistance packages will be available, or if available, sufficient to stabilize the affected countries and markets in Europe or elsewhere. To the extent uncertainty regarding any economic recovery in Europe continues to negatively impact consumer confidence and consumer credit factors, our business and results of operations could be significantly and adversely affected.
On December 18, 2013, the U.S. Federal Reserve announced that it would scale back its bond-buying program, or quantitative easing, which is designed to stimulate the economy and expand the Federal Reserve’s holdings of long-term securities until key economic indicators, such as the unemployment rate, show signs of improvement. The Federal Reserve signaled it would reduce its purchases of long-term Treasury bonds and would scale back on its purchases of mortgage-backed securities. It is unclear what effect, if any, the incremental reduction in the rate of the Federal Reserve’s monthly purchases will have on the value of our investments. However, it is possible that absent continued quantitative easing by the Federal Reserve, these developments, along with the European sovereign debt crisis, could cause interest rates and borrowing costs to rise, which may negatively impact our ability to access the debt markets on favorable terms.
Our investments in foreign securities may involve significant risks in addition to the risks inherent in U.S. investments.
Our investment strategy contemplates that a portion of our investments may be in securities of foreign companies in order to provide diversification or to complement our U.S. investments although we are required generally to invest at least 70% of our assets in companies organized and having their principal place of business within the U.S. and its possessions. Investing in foreign companies may expose us to additional risks not typically associated with investing in U.S. companies. These risks include changes in exchange control regulations, political and social instability, expropriation, imposition of foreign taxes, less liquid markets and less available information than is generally the case in the United States, higher transaction costs, less government supervision of exchanges, brokers and issuers, less developed bankruptcy laws, difficulty in enforcing contractual
49
Table of Contents
obligations, lack of uniform accounting and auditing standards and greater price volatility. These risks many be more pronounced for portfolio companies located or operating primarily in emerging markets, whose economies, markets and legal systems may be less developed.
Although it is anticipated that most of our investments will be denominated in U.S. dollars, our investments that are denominated in a foreign currency will be subject to the risk that the value of a particular currency may change in relation to the U.S. dollar. Among the factors that may affect currency values are trade balances, the level of short-term interest rates, differences in relative values of similar assets in different currencies, long-term opportunities for investment and capital appreciation and political developments. We may employ hedging techniques to minimize these risks, but we can offer no assurance that we will, in fact, hedge currency risk or, that if we do, such strategies will be effective. As a result, a change in currency exchange rates may adversely affect our profitability.
Hedging transactions may expose us to additional risks.
While we may enter into transactions to seek to reduce currency exchange rate and interest rate risks, unanticipated changes in currency exchange rates or interest rates may result in poorer overall investment performance than if we had not engaged in any such hedging transactions. In addition, the degree of correlation between price movements of the instruments used in a hedging strategy and price movements in the portfolio positions being hedged may vary. Moreover, for a variety of reasons, we may not seek or be able to establish a perfect correlation between such hedging instruments and the portfolio holdings being hedged. Any such imperfect correlation may prevent us from achieving the intended hedge and expose us to risk of loss. In addition, it may not be possible to hedge fully or perfectly against currency fluctuations affecting the value of securities denominated in non-U.S. currencies because the value of those securities is likely to fluctuate as a result of factors not related to currency fluctuations. On May 10, 2012, we entered into a five-year interest rate swap agreement, or swap agreement, with ING Capital Markets, LLC in connection with our Term Loan Facility. Under the swap agreement, with a notional value of $50.0 million, we pay a fixed rate of 1.1425% and receive a floating rate based upon the current three-month LIBOR rate. We entered into the swap agreement to manage interest rate risk and not for speculative purposes.
We may incur greater risk with respect to investments we acquire through assignments or participations of interests.
Although we originate a substantial portion of our loans, we may acquire loans through assignments or participations of interests in such loans. The purchaser of an assignment typically succeeds to all the rights and obligations of the assigning institution and becomes a lender under the credit agreement with respect to such debt obligation. However, the purchaser’s rights can be more restricted than those of the assigning institution, and we may not be able to unilaterally enforce all rights and remedies under an assigned debt obligation and with regard to any associated collateral. A participation typically results in a contractual relationship only with the institution participating out the interest and not directly with the borrower. Sellers of participations typically include banks, broker-dealers, other financial institutions and lending institutions. In purchasing participations, we generally will have no right to enforce compliance by the borrower with the terms of the loan agreement against the borrower, and we may not directly benefit from the collateral supporting the debt obligation in which we have purchased the participation. As a result, we will be exposed to the credit risk of both the borrower and the institution selling the participation. Further, in purchasing participations in lending syndicates, we will not be able to conduct the same level of due diligence on a borrower or the quality of the loan with respect to which we are buying a participation as we would conduct if we were investing directly in the loan. This difference may result in us being exposed to greater credit or fraud risk with respect to such loans than we expected when initially purchasing the participation.
50
Table of Contents
RISKS IN THE CURRENT ENVIRONMENT
Capital markets may experience periods of disruption and instability. Such market conditions could materially and adversely affect debt and equity capital markets in the United States and abroad, which could have a negative impact on our business, financial condition and results of operations.
Capital markets may experience periods of disruption and instability. For example, we believe that beginning in 2007, and continuing into 2010, the global capital markets entered into a period of disruption as evidenced by a lack of liquidity in the debt capital markets, significant write-offs in the financial services sector, the re-pricing of credit risk in the broadly syndicated credit market and the failure of certain major financial institutions. Despite actions of the United States federal government and foreign governments, these events contributed to worsening general economic conditions that materially and adversely impacted the broader financial and credit markets and reduced the availability of debt and equity capital for the market as a whole and financial services firms in particular. Such a period of economic disruption and instability could occur again, having a similar or worse impact on the broader financial and credit markets. Such conditions could also continue for a prolonged period of time. If these conditions occur and then persist, we and other companies in the financial services sector may be required to, or may choose to, seek access to alternative markets for debt and equity capital. Equity capital may then be difficult to raise if our board of directors does not approve an offering in which we would issue and sell our common stock at a price below net asset value per share. In addition, the debt capital that would be available, if at all, may be at a higher cost, and on less favorable terms and conditions at such time. Conversely, the portfolio companies in which we may invest may not be able to service or refinance their debt, which could materially and adversely affect our financial condition as we would experience reduced income or even losses. In a period of such adverse conditions, the inability to raise capital and the risk of portfolio company defaults may have a negative effect on our business, financial condition and results of operations.
RISKS RELATED TO OUR OPERATIONS AS A BDC
Our ability to enter into transactions with our affiliates will be restricted.
Because we have elected to be treated as a BDC under the 1940 Act, we are prohibited under the 1940 Act from participating in certain transactions with certain of our affiliates without the prior approval of our independent directors and, in some cases, of the SEC. Any person that owns, directly or indirectly, 5% or more of our outstanding voting securities will be our affiliate for purposes of the 1940 Act and we are generally prohibited from buying or selling any security from or to such affiliate, absent the prior approval of our independent directors. The 1940 Act also prohibits certain “joint” transactions with certain of our affiliates, which could include investments in the same portfolio company (whether at the same or different times), without prior approval of our independent directors and, in some cases, of the SEC. We, THL Credit Advisors and certain of its affiliates have submitted an exemptive application to the SEC to permit us to co-invest with other funds managed by THL Credit Advisors or its affiliates in a manner consistent with our investment objective, positions, policies, strategies and restrictions as well as regulatory requirements and other pertinent factors. There can be no assurance that any such exemptive order will be obtained. We are prohibited from buying or selling any security from or to any person who owns more than 25% of our voting securities or certain of that person’s affiliates, or entering into prohibited joint transactions with such persons, absent the prior approval of the SEC. Similar restrictions limit our ability to transact business with our officers or directors or their affiliates.
Regulations governing our operation as a BDC may limit our ability to, and the way in which we raise additional capital, which could have a material adverse impact on our liquidity, financial condition and results of operations.
Our business may in the future require a substantial amount of capital. We may acquire additional capital from the issuance of senior securities (including debt and preferred stock) or the issuance of additional shares of our common stock. However, we may not be able to raise additional capital in the future on favorable terms or at all. Additionally, we may only issue senior securities up to the maximum amount permitted by the 1940 Act. The
51
Table of Contents
1940 Act permits us to issue senior securities only in amounts such that our asset coverage, as defined in the 1940 Act, equals at least 200% after such issuance or incurrence. If our assets decline in value and we fail to satisfy this test, we may be required to liquidate a portion of our investments and repay a portion of our indebtedness at a time when such sales or repayment may be disadvantageous, which could have a material adverse impact on our liquidity, financial condition and results of operations.
| • | Senior Securities (including debt and preferred stock). As a result of issuing senior securities, we would also be exposed to typical risks associated with leverage, including an increased risk of loss. If we issue preferred securities, such securities would rank “senior” to common stock in our capital structure, resulting in preferred stockholders having separate voting rights, dividend and liquidation rights, and possibly other rights, preferences or privileges more favorable than those granted to holders of our common stock. Furthermore, the issuance of preferred securities could have the effect of delaying, deferring or preventing a transaction or a change of control that might involve a premium price for our common stockholders or otherwise be in your best interest. |
| • | Additional Common Stock. Our board of directors may decide to issue common stock to finance our operations rather than issuing debt or other senior securities. As a BDC, we are generally not able to issue our common stock at a price below net asset value without first obtaining required approvals from our stockholders and our independent directors. At our Annual Meeting of Stockholders on June 10, 2013, our stockholders approved a proposal authorizing us to sell up to 25% of our common stock at a price below the Company’s net asset value per share, subject to approval by our board of directors of the offering. Except in connection with the exercise of warrants or the conversion of convertible securities, in any such case the price at which our securities are to be issued and sold may not be less than a price, that in the determination of our board of directors, closely approximates the market value of such securities at the relevant time. We may also make rights offerings to our stockholders at prices per share less than the net asset value per share, subject to the requirements of the 1940 Act. If we raise additional funds by issuing more common stock or senior securities convertible into, or exchangeable for, our common stock, the percentage ownership of our stockholders at that time would decrease, and such stockholders may experience dilution. |
Additionally, if we do raise additional capital in one or more subsequent financings, until we are able to invest the net proceeds of such any financing in suitable investments, we will invest in temporary investments, such as cash, cash equivalents, U.S. government securities and other high-quality debt investments that mature in one year or less, which we expect will earn yields lower than the interest, dividend or other income that we anticipate receiving in respect of investments in debt and equity securities of our target portfolio companies. As a result, our ability to pay dividends in the years of operation during which we have such net proceeds available to invest will be based on our ability to invest our capital in suitable portfolio companies in a timely manner. Further, the management fee payable to our investment adviser, THL Credit Advisors, will not be reduced while our assets are invested in such temporary investments.
Changes in the laws or regulations governing our business, or changes in the interpretations thereof, and any failure by us to comply with these laws or regulations, could have a material adverse effect on our business, results of operations or financial condition.
Changes in the laws or regulations or the interpretations of the laws and regulations that govern BDCs, RICs or non-depository commercial lenders could significantly affect our operations and our cost of doing business. We are subject to federal, state and local laws and regulations and are subject to judicial and administrative decisions that affect our operations, including our loan originations, maximum interest rates, fees and other charges, disclosures to portfolio companies, the terms of secured transactions, collection and foreclosure procedures and other trade practices. If these laws, regulations or decisions change, or if we expand our business into jurisdictions that have adopted more stringent requirements than those in which we currently conduct business, we may have to incur significant expenses in order to comply, or we might have to restrict our operations. In addition, if we do not comply with applicable laws, regulations and decisions, we may lose licenses needed for the conduct of our business and may be subject to civil fines and criminal penalties.
52
Table of Contents
Pending legislation may allow us to incur additional leverage.
As a BDC, under the 1940 Act generally we are not permitted to incur indebtedness unless immediately after such borrowing we have an asset coverage for total borrowings of at least 200% (i.e., the amount of debt may not exceed 50% of the value of our assets).
Legislation recently was introduced in the U.S. House of Representatives intended to revise certain regulations applicable to BDCs. The legislation provides for (i) modifying the asset coverage ratio from 200% to 150%, (ii) permitting BDCs to file registration statements with the U.S. Securities and Exchange Commission that incorporate information from already-filed reports by reference, (iii) utilizing other streamlined registration processes afforded to operating companies, and (iv) allowing BDCs to own investment adviser subsidiaries. There are no assurances as to when the legislation will be enacted by Congress, if at all, or, if enacted, what final form the legislation would take. As a result, we may be able to incur additional indebtedness in the future and therefore your risk of an investment in us may increase.
If we do not invest a sufficient portion of our assets in qualifying assets, we could fail to qualify as a BDC or be precluded from investing according to our current business strategy, which would have a material adverse effect on our business, financial condition and results of operations.
As a BDC, we may not acquire any assets other than “qualifying assets” unless, at the time of and after giving effect to such acquisition, at least 70% of our total assets are qualifying assets. See “Regulation.” We believe that most of the investments that we may acquire in the future will constitute qualifying assets. However, we may be precluded from investing in what we believe are attractive investments if such investments are not qualifying assets for purposes of the 1940 Act. If we do not invest a sufficient portion of our assets in qualifying assets, we could be found to be in violation of the 1940 Act provisions applicable to BDCs and possibly lose our status as a BDC, which would have a material adverse effect on our business, financial condition and results of operations. Similarly, these rules could prevent us from making follow-on investments in existing portfolio companies (which could result in the dilution of our position) or could require us to dispose of investments at inopportune times in order to come into compliance with the 1940 Act. If we need to dispose of such investments quickly, it may be difficult to dispose of such investments on favorable terms. For example, we may have difficulty in finding a buyer and, even if we do find a buyer, we may have to sell the investments at a substantial loss.
If we are unable to qualify for tax treatment as a RIC, we will be subject to corporate-level income tax, which would have a material adverse effect on our results of operations and financial condition.
We intend to continue to qualify as a RIC under the Code. As a RIC we do not have to pay federal income taxes on our income (including realized gains) that is distributed to our stockholders, provided that we satisfy certain distribution and other requirements. Accordingly, we are not permitted under accounting rules to establish reserves for taxes on our unrealized capital gains. If we fail to qualify for RIC status in any year, to the extent that we had unrealized gains, we would have to establish reserves for taxes, which would reduce our net asset value and the amount potentially available for distribution. In addition, if we, as a RIC, were to decide to make a deemed distribution of net realized capital gains and retain the net realized capital gains, we would have to establish appropriate reserves for taxes that we would have to pay on behalf of stockholders. It is possible that establishing reserves for taxes could have a material adverse effect on the value of our common stock. See “Item 1 – Business – Certain U.S. Federal Income Tax Considerations”.
To maintain our qualification as a RIC under the Code, which is required in order for us to distribute our income without being taxed at the corporate level, we must maintain our status as a BDC and meet certain source of income, asset diversification and annual distribution requirements and including:
| • | The annual distribution requirement for a RIC is satisfied if we distribute to our stockholders at least 90% of our ordinary income and realized net short-term capital gains in excess of realized net long- |
53
Table of Contents
| term capital losses, if any, on an annual basis. Because we use debt financing, we are subject to an asset coverage ratio requirement under the 1940 Act and we may be subject to certain financial covenants under our debt arrangements that could, under certain circumstances, restrict us from making distributions necessary to satisfy the distribution requirement. If we are unable to obtain cash from other sources, we could fail to qualify for RIC tax treatment and, thus, become subject to corporate-level income tax. |
| • | The income source requirement will be satisfied if we obtain at least 90% of our income for each year from dividends, interest, gains from the sale of stock or securities or similar sources. |
| • | The asset diversification requirement will be satisfied if we meet certain asset diversification requirements at the end of each quarter of our taxable year. To satisfy these requirements, at least 50% of the value of our assets must consist of cash, cash equivalents, U.S. government securities, securities of other RICs, and other acceptable securities; and no more than 25% of the value of our assets can be invested in the securities, other than U.S. government securities or securities of other RICs, of one issuer, of two or more issuers that are controlled, as determined under applicable Internal Revenue Code rules, by us and that are engaged in the same or similar or related trades or businesses or of certain “qualified publicly traded partnerships.” Failure to meet these requirements may result in our having to dispose of certain investments quickly in order to prevent the loss of RIC status. Because most of our investments will be in private companies, and, therefore, will be relatively illiquid, any such dispositions could be made at disadvantageous prices and could result in substantial losses. |
Satisfying these requirements may require us to take actions we would not otherwise take, such as selling investments at unattractive prices to satisfy diversification, distribution or source of income requirements. In addition, while we are authorized to borrow funds in order to make distributions, under the 1940 Act we are not permitted to make distributions to stockholders while we have debt obligations or other senior securities outstanding unless certain “asset coverage” tests are met. If we fail to qualify as a RIC for any reason and become or remain subject to corporate-level income tax, the resulting corporate taxes could substantially reduce our net assets, the amount of income available for distribution and the amount of our distributions. Such a failure would have a material adverse effect on our results of operations and financial conditions, and thus, our stockholders.
RISKS RELATED TO AN INVESTMENT IN OUR SECURITIES
Our common stock price may be volatile and may fluctuate substantially.
As with any stock, the price of our common stock will fluctuate with market conditions and other factors. Our common stock is intended for long-term investors and should not be treated as a trading vehicle. Shares of closed-end management investment companies, which are structured similarly to us, frequently trade at a discount from their net asset value. Our shares may trade at a price that is less than the offering price. This risk may be greater for investors who sell their shares in a relatively short period of time after completion of the offering.
The market price and liquidity of the market for our common shares may be significantly affected by numerous factors, some of which are beyond our control and may not be directly related to our operating performance. These factors include:
| • | significant volatility in the market price and trading volume of securities of BDCs or other companies in the sector in which we operate, which are not necessarily related to the operating performance of these companies; |
| • | changes in regulatory policies or tax guidelines, particularly with respect to RICs or BDCs; |
| • | loss of RIC status; |
| • | changes in earnings or variations in operating results; |
54
Table of Contents
| • | changes in the value of our portfolio of investments; |
| • | any shortfall in revenue or net income or any increase in losses from levels expected by investors or securities analysts; |
| • | departure of key personnel from our investment adviser; |
| • | operating performance of companies comparable to us; |
| • | general economic trends and other external factors; and |
| • | loss of a major funding source. |
Certain provisions of the Delaware General Corporation Law and our certificate of incorporation and bylaws could deter takeover attempts and have an adverse impact on the price of our common stock.
The Delaware General Corporation Law, our certificate of incorporation and our bylaws contain provisions that may have the effect of discouraging a third party from making an acquisition proposal for us. We have also adopted measures that may make it difficult for a third party to obtain control of us, including provisions of our articles of incorporation dividing our board of directors into three classes with the term of one class expiring at each annual meeting of stockholders. These anti-takeover provisions may inhibit a change in control in circumstances that could give the holders of our common stock the opportunity to realize a premium over the market price of our common stock.
Our common stock may trade below its net asset value per share, which limits our ability to raise additional equity capital.
If our common stock is trading below its net asset value per share, we will generally not be able to issue additional shares of our common stock at its market price without first obtaining the approval for such issuance from our stockholders and our independent directors. Shares of BDCs, including shares of our common stock, have traded at discounts to their net asset values. As of December 31, 2013, our net asset value per share was $13.36. The last reported sale price of a share of our common stock on the NASDAQ Global Select Market on March 5, 2014 was $15.47. At our Annual Meeting of Stockholders on June 10, 2013, our stockholders approved a proposal authorizing us to sell up to 25% of our common stock at a price below our then-current net asset value per share, subject to approval by our board of directors for the offering. The authorization expires on the earlier of June 10, 2014 and the date of our 2014 Annual Meeting of Stockholders, which is expected to be held in June 2014. Our stockholders also approved a proposal to authorize us to offer and issue debt with warrants or debt convertible into shares of our common stock at an exercise or conversion price that, at the time such warrants or convertible debt are issued, will not be less than the market value per share but may be below our then-current net asset value per share. If our common stock trades below net asset value, the higher the cost of equity capital may result in it being unattractive to raise new equity, which may limit our ability to grow. The risk of trading below net asset value is separate and distinct from the risk that our net asset value per share may decline. We cannot predict whether shares of our common stock will trade above, at or below our net asset value.
The net asset value per share of our common stock may be diluted if we sell shares of our common stock in one or more offerings at prices below the then current net asset value per share of our common stock or securities to subscribe for or convertible into shares of our common stock.
At our Annual Meeting of Stockholders on June 10, 2013, our stockholders approved a proposal authorizing us to sell up to 25% of our common stock at a price below the Company’s net asset value per share, subject to approval by our board of directors of the offering. If we were to issue shares at a price below net asset value, such sales would result in an immediate dilution to existing common stockholders, which would include a reduction in the net asset value per share as a result of the issuance. This dilution would also include a proportionately greater decrease in a stockholder’s interest in our earnings and assets and voting interest in us than the increase in our assets resulting from such issuance.
55
Table of Contents
In addition, at our 2013 Annual Meeting of Stockholders, our stockholders authorized us to offer and issue debt with warrants or debt convertible into shares of our common stock at an exercise or conversion price that, at the time such warrants or convertible debt are issued, will not be less than the market value per share but may be below our then current net asset value. Such authorization expires on the earlier of the one year anniversary of the date of the Annual Meeting and the date of our 2014 Annual Meeting of Stockholders.
Any decision to sell shares of our common stock below its then current net asset value per share or securities to subscribe for or convert into shares of our common stock would be subject to the determination by our board of directors that such issuance is in our and our stockholders’ best interests.
If we were to sell shares of our common stock below its then current net asset value per share, such sales would result in an immediate dilution to the net asset value per share of our common stock. This dilution would occur as a result of the sale of shares at a price below the then current net asset value per share of our common stock and a proportionately greater decrease in the stockholders’ interest in our earnings and assets and their voting interest in us than the increase in our assets resulting from such issuance. Because the number of shares of common stock that could be so issued and the timing of any issuance is not currently known, the actual dilutive effect cannot be predicted.
In addition, if we issue warrants or securities to subscribe for or convert into shares of our common stock, subject to certain limitations, the exercise or conversion price per share could be less than net asset value per share at the time of exercise or conversion (including through the operation of anti-dilution protections). Because we would incur expenses in connection with any issuance of such securities, such issuance could result in a dilution of the net asset value per share at the time of exercise or conversion. This dilution would include reduction in net asset value per share as a result of the proportionately greater decrease in the stockholders’ interest in our earnings and assets and their voting interest than the increase in our assets resulting from such issuance.
Further, if our current stockholders do not purchase any shares to maintain their percentage interest, regardless of whether such offering is above or below the then current net asset value per share, their voting power will be diluted. For example, if we sell an additional 10% of our common shares at a 5% discount from net asset value, a stockholder who does not participate in that offering for its proportionate interest will suffer net asset value dilution of up to 0.5% or $5 per $1000 of net asset value. For additional information and hypothetical examples of these risks, see “Sale of Common Stock Below Net Asset Value” and the prospectus supplement pursuant to which such sale is made.
We incur significant costs as a result of being a publicly traded company.
As a publicly traded company, we incur legal, accounting and other expenses, including costs associated with the periodic reporting requirements applicable to a company whose securities are registered under the Securities Exchange Act of 1934, as amended, or the Exchange Act, as well as additional corporate governance requirements, including requirements under the Sarbanes-Oxley Act of 2002, and other rules implemented by the SEC.
If we issue preferred stock, debt securities or convertible debt securities, the net asset value and market value of our common stock may become more volatile.
We cannot assure you that the issuance of preferred stock and/or debt securities would result in a higher yield or return to the holders of our common stock. The issuance of preferred stock, debt securities or convertible debt would likely cause the net asset value and market value of our common stock to become more volatile. If the dividend rate on the preferred stock, or the interest rate on the debt securities, were to approach the net rate of return on our investment portfolio, the benefit of leverage to the holders of our common stock would be reduced. If the dividend rate on the preferred stock, or the interest rate on the debt securities, were to exceed the net rate of
56
Table of Contents
return on our portfolio, the use of leverage would result in a lower rate of return to the holders of common stock than if we had not issued the preferred stock or debt securities. Any decline in the net asset value of our investment would be borne entirely by the holders of our common stock. Therefore, if the market value of our portfolio were to decline, the leverage would result in a greater decrease in net asset value to the holders of our common stock than if we were not leveraged through the issuance of preferred stock. This decline in net asset value would also tend to cause a greater decline in the market price for our common stock.
There is also a risk that, in the event of a sharp decline in the value of our net assets, we would be in danger of failing to maintain required asset coverage ratios which may be required by the preferred stock, debt securities, convertible debt or units or of a downgrade in the ratings of the preferred stock, debt securities, convertible debt or units or our current investment income might not be sufficient to meet the dividend requirements on the preferred stock or the interest payments on the debt securities. If we do not maintain our required asset coverage ratios, we may not be permitted to declare dividends. In order to counteract such an event, we might need to liquidate investments in order to fund redemption of some or all of the preferred stock, debt securities or convertible debt. In addition, we would pay (and the holders of our common stock would bear) all costs and expenses relating to the issuance and ongoing maintenance of the preferred stock, debt securities, convertible debt or any combination of these securities. Holders of preferred stock, debt securities or convertible debt may have different interests than holders of common stock and may at times have disproportionate influence over our affairs.
| Item 1B. | Unresolved Staff Comments |
None.
| Item 2. | Properties |
We do not own any real estate or other physical properties materially important to our operation. Our headquarters are currently located at 100 Federal Street, 31st Floor, Boston, MA 02110. THL Credit Advisors furnishes us office space and we reimburse it for such costs on an allocated basis.
| Item 3. | Legal proceedings |
As of December 31, 2013, we are not a defendant in any material pending legal proceeding, and no such material proceedings are known to be contemplated. However, from time to time, we may be party to certain legal proceedings incidental to the normal course of our business including the enforcement of our rights under the contracts with our portfolio companies. Third parties may also seek to impose liability on us in connection with the activities of our portfolio companies.
| Item 4. | Mine Safety Disclosures |
Not applicable.
57
Table of Contents
| Item 5. | Market for Registrant’s Common Equity, Related Stockholder Matters and Issuer Purchases of Equity Securities |
Price Range of Common Stock
Our common stock is traded on the NASDAQ Global Select Market under the ticker symbol “TCRD.” We completed our initial public offering of common stock on April 21, 2010 at a price of $13.00 per share. Prior to such date there was no public market for our common stock. The following table sets forth, for the periods indicated, the range of high and low sales prices for our common stock, as reported on The NASDAQ Global Select Market:
| High | Low | |||||||
| Fiscal year ended December 31, 2013 |
||||||||
| First quarter |
$ | 16.08 | $ | 14.49 | ||||
| Second quarter |
$ | 15.77 | $ | 14.00 | ||||
| Third quarter |
$ | 16.17 | $ | 14.75 | ||||
| Fourth quarter |
$ | 17.00 | $ | 15.27 | ||||
| Fiscal year ended December 31, 2012 |
||||||||
| First quarter |
$ | 13.49 | $ | 12.12 | ||||
| Second quarter |
$ | 13.50 | $ | 12.20 | ||||
| Third quarter |
$ | 14.74 | $ | 12.88 | ||||
| Fourth quarter |
$ | 15.07 | $ | 13.03 | ||||
The last reported price for our common stock on March 5, 2014 was $15.47 per share. As of March 5, 2014, we had 4 stockholders of record, which did not include stockholders for whom shares are held in nominee or “street” name.
58
Table of Contents
Stock Performance Graph
This graph compares the return on our common stock with that of the Standard & Poor’s 500 Stock Index and the Russell 2000 Financial Services Index, for the period from April 21, 2010 (initial public offering) through December 31, 2013. The graph assumes that, on April 21, 2010, a person invested $100 in each of our common stock, the S&P 500 Index, and the Russell 2000 Financial Services Index. The graph measures total stockholder return, which takes into account both changes in stock price and dividends. It assumes that dividends paid are invested in like securities.
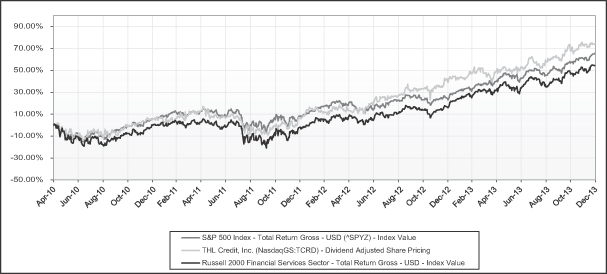
The graph and other information furnished under this Part II Item 5 of this Form 10-K shall not be deemed to be “soliciting material” or to be “filed” with the SEC or subject to Regulation 14A or 14C, or to the liabilities of Section 18 of the 1934 Act. The stock price performance included in the above graph is not necessarily indicative of future stock price performance.
Sales of unregistered securities
We issued a total of 0 shares, 2 shares and 304,093 shares of common stock under our dividend reinvestment plan during the years ended December 31, 2013, 2012 and 2011, respectively. The issuance was not subject to the registration requirements of the Securities Act of 1933. The aggregate price for the shares of common stock issued under the dividend reinvestment plan was $0.00 million, $0.00 million, and $4.05 million for the years ended December 31, 2013, 2012 and 2011, respectively.
Issuer purchases of equity securities
None.
Dividends
We have elected to be taxed as a regulated investment company under Subchapter M of the Code. In order to maintain our status as a regulated investment company, we are required to distribute at least 90% of our investment company taxable income. To avoid a 4% excise tax on undistributed earnings, we are required to distribute each calendar year the sum of (i) 98% of our ordinary income for such calendar year (ii) 98.2% of our net capital gains for the one-year period ending October 31 of that calendar year (iii) any income recognized, but not distributed, in preceding years and on which we paid no federal income tax. We intend to make distributions
59
Table of Contents
to stockholders on a quarterly basis of substantially all of our net investment income. Although we intend to make distributions of net realized capital gains, if any, at least annually, out of assets legally available for such distributions, we may in the future decide to retain such capital gains for investment. In addition, the extent and timing of special dividends, if any, will be determined by our board of directors and will largely be driven by portfolio specific events and tax considerations at the time.
In addition, we may be limited in our ability to make distributions due to the BDC asset coverage test for borrowings applicable to us as a BDC under the 1940 Act.
The following table summarizes our dividends declared and paid or to be paid on all shares:
| Date Declared |
Record Date |
Payment Date |
Amount Per Share | |||
| August 5, 2010 |
September 2, 2010 | September 30, 2010 | $0.05 | |||
| November 4, 2010 |
November 30, 2010 | December 28, 2010 | $0.10 | |||
| December 14, 2010 |
December 31, 2010 | January 28, 2011 | $0.15 | |||
| March 10, 2011 |
March 25, 2011 | March 31, 2011 | $0.23 | |||
| May 5, 2011 |
June 15, 2011 | June 30, 2011 | $0.25 | |||
| July 28, 2011 |
September 15, 2011 | September 30, 2011 | $0.26 | |||
| October 27, 2011 |
December 15, 2011 | December 30, 2011 | $0.28 | |||
| March 6, 2012 |
March 20, 2012 | March 30, 2012 | $0.29 | |||
| March 6, 2012 |
March 20, 2012 | March 30, 2012 | $0.05 | |||
| May 2, 2012 |
June 15, 2012 | June 29, 2012 | $0.30 | |||
| July 26, 2012 |
September 14, 2012 | September 28, 2012 | $0.32 | |||
| November 2, 2012 |
December 14, 2012 | December 28, 2012 | $0.33 | |||
| December 20, 2012 |
December 31, 2012 | January 28, 2013 | $0.05 | |||
| February 27, 2013 |
March 15, 2013 | March 29, 2013 | $0.33 | |||
| May 2, 2013 |
June 14, 2013 | June 28, 2013 | $0.34 | |||
| August 2, 2013 |
September 16, 2013 | September 30, 2013 | $0.34 | |||
| August 2, 2013 |
September 16, 2013 | September 30, 2013 | $0.08 | |||
| October 30, 2013 |
December 16, 2013 | December 31, 2013 | $0.34 | |||
| March 4, 2014 |
March 17, 2014 | March 31, 2014 | $0.34 |
We may not be able to achieve operating results that will allow us to make distributions at a specific level or to increase the amount of these distributions from time to time. If we do not distribute a certain percentage of our income annually, we will suffer adverse tax consequences, including possible loss of our status as a regulated investment company. We cannot assure stockholders that they will receive any distributions at a particular level. We maintain an “opt in” dividend reinvestment plan for our common stockholders. As a result, unless stockholders specifically elect to have their dividends automatically reinvested in additional shares of common stock, stockholders will receive all such dividends in cash. Under the terms of our dividend reinvestment plan, dividends will primarily be paid in newly issued shares of common stock. However, we reserve the right to purchase shares in the open market in connection with the implementation of the plan. This feature of the plan means that, under certain circumstances, we may issue shares of our common stock at a price below net asset value per share, which could cause our stockholders to experience dilution.
Distributions in excess of our current and accumulated profits and earnings would be treated first as a return of capital to the extent of the stockholder’s tax basis, and any remaining distributions would be treated as a capital gain. The determination of the tax attributes of our distributions will be made annually as of the end of our fiscal year based upon our taxable income for the full year and distributions paid for the full year. Therefore, a determination made on a quarterly basis may not be representative of the actual tax attributes of our distributions for a full year. Each year, a statement on Form 1099-DIV identifying the source of the distribution will be sent to our U.S. stockholders. Our board of directors presently intends to declare and pay quarterly dividends. Our ability to pay dividends could be affected by future business performance, liquidity, capital needs, alternative investment opportunities and loan covenants.
60
Table of Contents
The tax character of distributions declared and paid in 2013 represented $43.3 million from ordinary income, $0.1 million from capital gains and $0 from tax return of capital. The tax character of distributions declared and paid in 2012 represented $28.5 million from ordinary income, $0.9 million from capital gains and $0 from tax return of capital. Generally accepted accounting principles require adjustments to certain components of net assets to reflect permanent differences between financial and tax reporting. These adjustments have no affect on net asset value per share. Permanent differences between financial and tax reporting at December 31, 2013 and 2012 were $0.2 million and $0.2 million, respectively.
61
Table of Contents
| Item 6. | Selected Financial Data |
The following selected financial data should be read together with our consolidated financial statements and the related notes and the discussion under “Management’s Discussion and Analysis of Financial Condition and Results of Operations” which is included elsewhere in this annual report on Form 10-K. Financial information is presented for the years ended December 31, 2013, 2012, 2011, 2010 and for the period from May 26, 2009 (inception through December 31, 2009) in thousands, except for per share data. The Statement of Operations, Per share, and the Statement of Assets and Liabilities data for the years ending 2013, 2012, 2011, 2010 and 2009 has been derived from our financial statements that were audited by PricewaterhouseCoopers LLP, our independent registered public accounting firm. See “Management’s Discussion and Analysis of Financial Condition and Results of Operations” below for more information.
| For the years ended | At and for the period from May 26, 2009 (inception) through December 31, 2009 |
|||||||||||||||||||
| 2013 | 2012 | 2011 | 2010 | |||||||||||||||||
| Statement of Operations data: |
||||||||||||||||||||
| Total investment income |
$ | 74,650 | $ | 53,125 | $ | 37,409 | $ | 12,325 | $ | — | ||||||||||
| Incentive fees |
10,682 | 7,017 | 4,790 | — | — | |||||||||||||||
| Base management fees |
7,521 | 4,943 | 4,012 | 2,697 | — | |||||||||||||||
| All other expenses |
14,547 | 10,392 | 7,550 | 3,598 | 172 | |||||||||||||||
| Income tax provision and excise tax |
511 | 581 | 22 | — | — | |||||||||||||||
| Net investment income |
41,389 | 30,192 | 21,035 | 6,030 | (172 | ) | ||||||||||||||
| Interest rate derivative periodic interest payments, net |
(433 | ) | (180 | ) | — | — | — | |||||||||||||
| Net realized gain on investments |
2,604 | 353 | 979 | — | — | |||||||||||||||
| Net change in unrealized appreciation on investments |
309 | (1,241 | ) | 2,121 | 1,760 | — | ||||||||||||||
| Net change in unrealized depreciation on interest rate derivative |
769 | (1,053 | ) | — | — | — | ||||||||||||||
| Provision for taxes on unrealized appreciation on investments |
(1,960 | ) | (454 | ) | — | — | — | |||||||||||||
| Net increase (decrease) in net assets resulting from operations |
42,678 | 27,617 | 24,135 | 7,790 | (172 | ) | ||||||||||||||
| Per share data: |
||||||||||||||||||||
| Net asset value (net deficit) per common share at year end |
$ | 13.36 | $ | 13.20 | $ | 13.24 | $ | 13.06 | $ | (10.61 | ) | |||||||||
| Market price at year end |
16.49 | 14.79 | 12.21 | 13.01 | n/a | |||||||||||||||
| Net investment income (loss) |
1.37 | 1.38 | 1.04 | 0.31 | (25.61 | ) | ||||||||||||||
| Net realized gain on investments |
0.09 | 0.01 | 0.05 | — | — | |||||||||||||||
| Net change in unrealized appreciation on investments |
0.01 | (0.06 | ) | 0.11 | 0.08 | — | ||||||||||||||
| Net change in unrealized depreciation on interest rate derivative |
0.01 | (0.06 | ) | — | — | — | ||||||||||||||
| Provision for taxes on unrealized gain on investments |
(0.07 | ) | (0.02 | ) | — | — | — | |||||||||||||
| Interest rate derivative periodic interest payments, net |
(0.01 | ) | — | — | — | — | ||||||||||||||
| Net increase (decrease) in net assets resulting from operations |
1.41 | 1.26 | 1.20 | 0.39 | (25.61 | ) | ||||||||||||||
| Dividends declared |
1.43 | 1.34 | 1.02 | 0.30 | — | |||||||||||||||
62
Table of Contents
| 3 | For the years ended | At and for the period from May 26, 2009 (inception) through December 31, 2009 |
||||||||||||||||||
| 2013 | 2012 | 2011 | 2010 | |||||||||||||||||
| Statement of Assets and Liabilities data at period end: |
||||||||||||||||||||
| Total investments at fair value |
$ | 648,867 | $ | 394,349 | $ | 266,993 | $ | 153,529 | $ | — | ||||||||||
| Cash and cash equivalents |
7,829 | 4,819 | 5,573 | 110,141 | 101 | |||||||||||||||
| Other assets |
16,195 | 7,090 | 4,583 | 719 | 370 | |||||||||||||||
| Total assets |
672,891 | 406,258 | 277,149 | 264,389 | 471 | |||||||||||||||
| Loans payable |
204,300 | 50,000 | 5,000 | — | — | |||||||||||||||
| Other liabilities |
15,649 | 8,774 | 4,532 | 4,373 | 541 | |||||||||||||||
| Total liabilities |
219,949 | 58,774 | 9,532 | 4,373 | 541 | |||||||||||||||
| Total net assets (deficit) |
452,942 | 347,484 | 267,617 | 260,016 | (70 | ) | ||||||||||||||
| Other data: |
||||||||||||||||||||
| Weighted average annual yield on debt investments |
11.4 | % | 13.7 | % | 13.8 | % | 15.8 | % | — | |||||||||||
| Weighted average annual yield on debt and income-producing equity securities |
11.7 | % | 13.9 | % | 14.0 | % | 16.6 | % | — | |||||||||||
| Number of portfolio investments at year end |
54 | 34 | 24 | 13 | — | |||||||||||||||
| Quarter Ended |
Investment Income |
Net Investment Income |
Net Unrealized Gain (Loss) on Investments |
Net Realized Gain on Investments |
Net
Realized/ Unrealized Gain (Loss) on Interest Rate Derivative |
Provision for taxes/benefit on unrealized gain on investments |
Net Increase In Net Assets From Operations |
|||||||||||||||||||||||||||||||||||||||||||||||||
| Total | Per Share |
Total | Per Share |
Total | Per Share |
Total | Per Share |
Total | Per Share |
Total | Per Share |
Total | Per Share |
|||||||||||||||||||||||||||||||||||||||||||
| December 31, 2013 |
$ | 18,491 | $ | 0.55 | $ | 9,109 | $ | 0.27 | $ | 2,431 | $ | 0.07 | $ | 212 | $ | 0.01 | $ | (83 | ) | $ | 0.00 | $ | (977 | ) | ($ | 0.03 | ) | $ | 10,692 | $ | 0.32 | |||||||||||||||||||||||||
| September 30, 2013 |
19,064 | 0.56 | 11,602 | 0.34 | (3,141 | ) | (0.10 | ) | 707 | 0.02 | (361 | ) | (0.01 | ) | (1,050 | ) | (0.03 | ) | 7,757 | 0.23 | ||||||||||||||||||||||||||||||||||||
| June 30, 2013 |
22,672 | 0.84 | 13,273 | 0.49 | (681 | ) | (0.02 | ) | 1,685 | 0.06 | 742 | 0.03 | 596 | 0.02 | 15,615 | 0.58 | ||||||||||||||||||||||||||||||||||||||||
| March 31, 2013 |
14,423 | 0.55 | 7,405 | 0.28 | 1,700 | 0.06 | — | 0.00 | 38 | — | (529 | ) | (0.02 | ) | 8,614 | 0.33 | ||||||||||||||||||||||||||||||||||||||||
| Quarter Ended |
Investment Income |
Net
Investment Income |
Net Unrealized Gain (Loss) on Investments |
Net Realized Gain on Investments |
Net
Realized/ Unrealized Gain (Loss) on Interest Rate Derivative |
Provision
for taxes on unrealized gain on investments |
Net Increase In Net Assets From Operations |
|||||||||||||||||||||||||||||||||||||||||||||||||
| Total | Per Share |
Total | Per Share |
Total | Per Share |
Total | Per Share |
Total | Per Share |
Total | Per Share |
Total | Per Share |
|||||||||||||||||||||||||||||||||||||||||||
| December 31, 2012 |
$ | 16,379 | $ | 0.62 | $ | 9,028 | $ | 0.34 | $ | 886 | $ | 0.03 | $ | 353 | $ | 0.01 | $ | (38 | ) | $ | 0.00 | $ | (454 | ) | ($ | 0.01 | ) | $ | 9,775 | $ | 0.37 | |||||||||||||||||||||||||
| September 30, 2012 |
14,237 | 0.69 | 8,477 | 0.41 | (1,687 | ) | (0.07 | ) | — | — | (621 | ) | (0.03 | ) | — | — | 6,169 | 0.31 | ||||||||||||||||||||||||||||||||||||||
| June 30, 2012 |
11,759 | 0.58 | 6,515 | 0.32 | 26 | — | — | — | (574 | ) | (0.03 | ) | — | — | 5,967 | 0.29 | ||||||||||||||||||||||||||||||||||||||||
| March 31, 2012 |
10,750 | 0.53 | 6,172 | 0.31 | (466 | ) | (0.03 | ) | — | — | — | — | — | — | 5,706 | 0.28 | ||||||||||||||||||||||||||||||||||||||||
63
Table of Contents
| Item 7. | Management’s Discussion and Analysis of Financial Condition and Results of Operations |
The information contained in this section should be read in conjunction with the consolidated financial statements and notes thereto appearing elsewhere in this report.
CAUTIONARY STATEMENT REGARDING FORWARD-LOOKING STATEMENTS
This report, and other statements that we may make, may contain forward-looking statements with respect to future financial or business performance, strategies or expectations. Forward-looking statements are typically identified by words or phrases such as “trend,” “opportunity,” “pipeline,” “believe,” “comfortable,” “expect,” “anticipate,” “current,” “intention,” “estimate,” “position,” “assume,” “potential,” “outlook,” “continue,” “remain,” “maintain,” “sustain,” “seek,” “achieve” and similar expressions, or future or conditional verbs such as “will,” “would,” “should,” “could,” “may” or similar expressions.
Forward-looking statements are subject to numerous assumptions, risks and uncertainties, which change over time. Forward-looking statements speak only as of the date they are made, and we assume no duty to and do not undertake to update forward-looking statements. Actual results could differ materially from those anticipated in forward-looking statements and future results could differ materially from historical performance.
In addition to factors previously identified elsewhere in this filing, the following factors, among others, could cause actual results to differ materially from forward-looking statements or historical performance:
| • | the introduction, withdrawal, success and timing of business initiatives and strategies; |
| • | changes in political, economic or industry conditions, the interest rate environment or financial and capital markets, which could result in changes in the value of our assets; |
| • | the relative and absolute investment performance and operations of our investment adviser; |
| • | the impact of increased competition; |
| • | the impact of future acquisitions and divestitures; |
| • | the unfavorable resolution of legal proceedings; |
| • | our business prospects and the prospects of our portfolio companies; |
| • | the impact, extent and timing of technological changes and the adequacy of intellectual property protection; |
| • | the impact of legislative and regulatory actions and reforms and regulatory, supervisory or enforcement actions of government agencies relating to us or THL Credit Advisors LLC, the Advisor; |
| • | the ability of the Advisor to identify suitable investments for us and to monitor and administer our investments; |
| • | our contractual arrangements and relationships with third parties; |
| • | any future financings by us; |
| • | the ability of the Advisor to attract and retain highly talented professionals; |
| • | fluctuations in foreign currency exchange rates; and |
| • | the impact of changes to tax legislation and, generally, our tax position. |
Overview
THL Credit, Inc., or the Company, was organized as a Delaware corporation on May 26, 2009 and initially funded on July 23, 2009. We commenced principal operations on April 21, 2010. Our investment objective is to generate both current income and capital appreciation, primarily through investments in privately negotiated investments debt and equity securities of middle market companies.
64
Table of Contents
We are a direct lender to middle market companies and invest in subordinated, or mezzanine, debt and second lien secured debt, which may include an associated equity component such as warrants, preferred stock or other similar securities. We may also selectively invest in first lien secured loans that generally have structures with higher interest rates, which include unitranche investments, or loan structures that combine characteristics of traditional first lien senior secured as well as second lien and subordinated loans. In certain instances we will also make direct equity investments, including equity investments into or through funds, and we may also selectively invest in more broadly syndicated first lien secured loans and direct equity investments in collateralized loan obligations, or CLOs, from time to time. We may also provide advisory services to managed fund.
We are an externally managed, non-diversified, closed-end investment company that has elected to be regulated as a business development company, or BDC, under the Investment Company Act of 1940 Act, as amended, or the 1940 Act. As a BDC, we are required to comply with certain regulatory requirements. For instance, we generally have to invest at least 70% of our total assets in “qualifying assets,” including securities of private or thinly traded public U.S. companies, cash, cash equivalents, U.S. Government securities and high-quality debt investments that mature in one year or less.
As a BDC, we must not acquire any assets other than “qualifying assets” specified in the 1940 Act unless, at the time the acquisition is made, at least 70% of our total assets are qualifying assets (with certain limited exceptions). Qualifying assets include investments in “eligible portfolio companies.” Under the relevant U.S. Securities and Exchange Commission, or SEC rules, the term “eligible portfolio company” includes all private companies, companies whose securities are not listed on a national securities exchange, and certain public companies that have listed their securities on a national securities exchange and have a market capitalization of less than $250 million, in each case organized in the United States.
We are also registered as an investment adviser under the Investment Advisers Act of 1940, as amended, or the Advisers Act.
Since April 2010, after we completed our initial public offering and commenced principal operations, we have been responsible for making, on behalf of ourselves and managed funds, over an aggregate $1,120 million in commitments into 62 separate portfolio companies through a combination of both initial and follow-on investments. Since inception, we received $488 million from paydowns of investments. The Company alone has received $389 million from paydowns of investments.
We have elected to be treated for tax purposes as a regulated investment company, or RIC, under Subchapter M of the Code. To qualify as a RIC, we must, among other things, meet certain source of income and asset diversification requirements. Pursuant to these elections, we generally will not have to pay corporate-level income taxes on any income we distribute to our stockholders.
Portfolio Composition and Investment Activity
Portfolio Composition
As of December 31, 2013, we had $648.9 million of portfolio investments (at fair value), which represents a $254.6 million, or 64.6% increase from the $394.3 million (at fair value) as of December 31, 2012. We also increased our portfolio to fifty-four investments, including THL Credit Greenway Fund LLC, or Greenway, and THL Credit Greenway Fund II LLC, or Greenway II, as of December 31, 2013, from thirty-four portfolio investments, including Greenway, as of December 31, 2012.
At December 31, 2013, our average portfolio company investment, exclusive of Greenway, Greenway II and portfolio investments where we only have an equity investment, at amortized cost and fair value was approximately $14.0 million and $13.9 million, respectively and our largest portfolio company investment by both amortized cost and fair value was approximately $26.6 million. At December 31, 2012, our average
65
Table of Contents
portfolio company investment at both amortized cost and fair value was approximately $11.9 million and our largest portfolio company investment by both amortized cost and fair value was approximately $36.1 million.
At December 31, 2013, 59.1% of our debt investments bore interest based on floating rates (subject to interest rate floors), such as LIBOR, and 40.9% bore interest at fixed rates. At December 31, 2012, 43.3% of our debt investments bore interest based on floating rates (subject to interest rate floors), such as LIBOR, and 56.7% bore interest at fixed rates.
The following table shows the weighted average yield by investment category at their current cost.
| As of | ||||||||
| Description: |
December 31, 2013 | December 31, 2012 | ||||||
| First lien secured debt |
11.0 | % | 11.5 | % | ||||
| Second lien debt |
11.3 | % | 13.3 | % | ||||
| Subordinated debt |
12.1 | % | 15.0 | % | ||||
| Investments in funds (1) |
12.6 | % | 16.3 | % | ||||
| Investment in payment rights(2) |
17.0 | % | 16.4 | % | ||||
| CLO residual interests(2) |
14.0 | % | 15.5 | % | ||||
|
|
|
|
|
|||||
| Debt and income-producing investments |
11.7 | % | 13.9 | % | ||||
| Debt investments |
11.4 | % | 13.7 | % | ||||
| (1) | Includes only our investment in LCP Capital Fund LLC, which is the only investment in funds where we receive regular payments. |
| (2) | Yields from investments in payment rights and CLO residual interest represents the implied internal rate of return “IRR” calculation expected from cash flow streams. |
As of December 31, 2013 and 2012, portfolio investments, in which we have debt investments, had an average EBITDA of approximately $30 million and $24 million, respectively, based on the latest available financial information provided by the portfolio companies for each of these periods. As of December 31, 2013 and 2012, our weighted average attachment point in the capital structure of our portfolio companies is approximately 4.2 times and 3.8 times EBITDA, respectively, for each of these based on our latest available financial information for each of these periods.
As of December 31, 2013, excluding investments in Greenway and Greenway II, 78.8% of our portfolio investments are in sponsored investments and 21.2% of our portfolio investments are in unsponsored investments. Our portfolio investments as of December 31, 2013 have used our capital for change of control transactions (34.6%), acquisitions/growth capital (13.5%), refinancings (13.5%), recapitalizations (21.2%) and other (17.3%). Since inception we have closed portfolio investments with 34 different sponsors.
As of December 31, 2012, excluding investment in Greenway, 75.8% of our portfolio investments are in sponsored investments and 24.2% of our portfolio investments are in unsponsored investments. Our portfolio investments as of December 31, 2012 have used our capital for change of control transactions (45.4%), acquisitions/growth capital (15.2%), refinancings (6.1%), recapitalizations (21.2%) and other (12.1%).
66
Table of Contents
The following table summarizes the amortized cost and fair value of investments as of December 31, 2013 (in millions).
| Description |
Amortized Cost | Percentage of Total |
Fair Value (1) | Percentage of Total |
||||||||||||
| First lien secured debt |
$ | 261.7 | 40.5 | % | $ | 263.1 | 40.6 | % | ||||||||
| Subordinated debt |
162.6 | 25.2 | % | 156.0 | 24.0 | % | ||||||||||
| Second lien debt |
157.2 | 24.3 | % | 157.9 | 24.3 | % | ||||||||||
| CLO residual interests |
37.3 | 5.8 | % | 37.6 | 5.8 | % | ||||||||||
| Investment in payment rights |
12.2 | 1.9 | % | 13.8 | 2.1 | % | ||||||||||
| Investments in funds |
9.4 | 1.4 | % | 9.5 | 1.5 | % | ||||||||||
| Equity investments |
5.5 | 0.9 | % | 11.0 | 1.7 | % | ||||||||||
|
|
|
|
|
|
|
|
|
|||||||||
| Total investments |
$ | 645.9 | 100.0 | % | $ | 648.9 | 100.0 | % | ||||||||
|
|
|
|
|
|
|
|
|
|||||||||
The following table summarizes the amortized cost and fair value of investments as of December 31, 2012 (in millions).
| Description |
Amortized Cost | Percentage of Total |
Fair Value (1) | Percentage of Total |
||||||||||||
| Subordinated debt |
$ | 184.1 | 47.1 | % | $ | 183.3 | 46.4 | % | ||||||||
| First lien secured debt |
101.8 | 26.0 | % | 102.2 | 26.0 | % | ||||||||||
| Second lien debt |
70.6 | 18.0 | % | 70.0 | 17.8 | % | ||||||||||
| Investment in payment rights |
12.3 | 3.1 | % | 12.3 | 3.1 | % | ||||||||||
| Investments in funds |
9.6 | 2.5 | % | 10.3 | 2.6 | % | ||||||||||
| CLO residual interests |
9.4 | 2.4 | % | 9.4 | 2.4 | % | ||||||||||
| Equity investments |
3.9 | 0.9 | % | 6.8 | 1.7 | % | ||||||||||
|
|
|
|
|
|
|
|
|
|||||||||
| Total investments |
$ | 391.7 | 100.0 | % | $ | 394.3 | 100.0 | % | ||||||||
|
|
|
|
|
|
|
|
|
|||||||||
| (1) | All investments are categorized as Level 3 in the fair value hierarchy. |
The following is a summary of the industry classification in which the Company invests as of December 31, 2013 (in millions).
| Industry |
Cost | Fair Value | % of Net Assets |
|||||||||
| IT services |
$ | 100.5 | $ | 101.0 | 22.31 | % | ||||||
| Financial services |
91.2 | 90.7 | 20.02 | % | ||||||||
| Industrials |
79.4 | 79.7 | 17.61 | % | ||||||||
| Food & beverage |
52.8 | 52.3 | 11.55 | % | ||||||||
| Healthcare |
48.8 | 50.5 | 11.14 | % | ||||||||
| Retail & grocery |
53.4 | 50.2 | 11.07 | % | ||||||||
| Business services |
50.9 | 50.0 | 11.05 | % | ||||||||
| Manufacturing |
48.8 | 49.0 | 10.81 | % | ||||||||
| Consumer products |
38.1 | 38.4 | 8.47 | % | ||||||||
| Energy / utilities |
32.4 | 32.8 | 7.25 | % | ||||||||
| Media, entertainment and leisure |
24.6 | 29.1 | 6.42 | % | ||||||||
| Restaurants |
20.8 | 20.8 | 4.60 | % | ||||||||
| Aerospace & defense |
4.2 | 4.4 | 0.96 | % | ||||||||
|
|
|
|
|
|
|
|||||||
| Total Investments |
$ | 645.9 | $ | 648.9 | 143.26 | % | ||||||
|
|
|
|
|
|
|
|||||||
67
Table of Contents
The following is a summary of the industry classification in which the Company invests as of December 31, 2012 (in millions) (1).
| Industry |
Cost | Fair Value | % of Net Assets |
|||||||||
| Healthcare |
$ | 55.0 | $ | 56.5 | 16.27 | % | ||||||
| Consumer products |
50.0 | 50.0 | 14.39 | % | ||||||||
| Food & beverage |
44.1 | 43.5 | 12.54 | % | ||||||||
| Industrials |
43.1 | 43.1 | 12.40 | % | ||||||||
| Manufacturing |
39.0 | 38.1 | 10.98 | % | ||||||||
| IT services |
34.6 | 34.8 | 10.01 | % | ||||||||
| Financial services |
31.2 | 31.9 | 9.19 | % | ||||||||
| Business services |
32.5 | 31.5 | 9.05 | % | ||||||||
| Retail & grocery |
26.5 | 27.0 | 7.76 | % | ||||||||
| Media, entertainment and leisure |
13.7 | 15.7 | 4.51 | % | ||||||||
| Energy / utilities |
9.8 | 9.8 | 2.81 | % | ||||||||
| Restaurants |
8.2 | 8.4 | 2.42 | % | ||||||||
| Aerospace & defense |
4.0 | 4.0 | 1.16 | % | ||||||||
|
|
|
|
|
|
|
|||||||
| Total Investments |
$ | 391.7 | $ | 394.3 | 113.49 | % | ||||||
|
|
|
|
|
|
|
|||||||
| (1) | We have changed the industry classification of certain investments to conform to new industry classifications adopted as of September 30, 2013. |
Investment Activity
The following is a summary of our investment activity, presented on a cost basis, for the years ended December 31, 2013 and 2012 (in millions).
| Years ended December 31, | ||||||||
| 2013 | 2012 | |||||||
| New portfolio investments |
$ | 373.9 | $ | 266.8 | ||||
| Existing portfolio investments |
||||||||
| Follow-on investments |
28.6 | 21.2 | ||||||
| Delayed draw and revolver investments |
3.0 | 7.2 | ||||||
|
|
|
|
|
|||||
| Total existing portfolio investments |
31.6 | 28.4 | ||||||
|
|
|
|
|
|||||
| Total portfolio investment activity |
$ | 405.5 | $ | 295.2 | ||||
|
|
|
|
|
|||||
| Number of new portfolio investments |
24 | 24 | ||||||
| Number of existing portfolio investments |
13 | 7 | ||||||
| First lien secured debt |
$ | 203.5 | $ | 102.8 | ||||
| Second lien debt |
119.6 | 41.5 | ||||||
| Subordinated debt |
49.6 | 127.0 | ||||||
| Investments in funds |
1.1 | 1.2 | ||||||
| Investment in payment rights |
— | 12.5 | ||||||
| Equity investments |
2.2 | 0.8 | ||||||
| CLO residual interests |
29.5 | 9.4 | ||||||
|
|
|
|
|
|||||
| Total portfolio investments |
$ | 405.5 | $ | 295.2 | ||||
|
|
|
|
|
|||||
| Weighted average yield of new debt investments |
11.5 | % | 13.7 | % | ||||
| Weighted average yield, including all new income-producing investments |
11.4 | % | 13.9 | % | ||||
68
Table of Contents
The following is a summary of the proceeds received from prepayments and sales of our investments (in millions).
| Years ended December 31, | ||||||||
| Investment |
2013 | 2012 | ||||||
| 20-20 Technologies Inc. |
$ | 0.4 | $ | — | ||||
| Adirondack Park CLO Ltd. |
0.2 | — | ||||||
| Allen Edmonds Corporation |
10.0 | — | ||||||
| AIM Media Texas Operating, LLC |
10.2 | 0.5 | ||||||
| Charming Charlie, Inc. |
— | 11.6 | ||||||
| Chuy’s Opco, Inc. |
— | 9.2 | ||||||
| Copperweld Bimetallics LLC |
0.3 | — | ||||||
| Connecture, Inc. (d) |
1.0 | — | ||||||
| CRS Reprocessing, LLC |
1.1 | 3.1 | ||||||
| Cydcor LLC (a) |
15.4 | 0.4 | ||||||
| Duff & Phelps Corporation |
0.1 | 0.2 | ||||||
| Embarcadero Technologies, Inc. (d) |
5.1 | — | ||||||
| Firebirds International, LLC |
8.3 | — | ||||||
| Food Processing Holdings, LLC (b) |
15.7 | 12.6 | ||||||
| Gold, Inc. (d) |
19.8 | — | ||||||
| Gryphon Partners 3.5, L.P. |
1.3 | — | ||||||
| Harrison Gypsum, LLC |
1.1 | — | ||||||
| Hart InterCivic, Inc. |
0.9 | 0.9 | ||||||
| HEALTHCAREfirst, Inc. |
0.7 | 14.1 | ||||||
| Hickory Farms, Inc. |
— | 9.5 | ||||||
| Holland Intermediate Acquisition Corp.(d) |
7.1 | — | ||||||
| IMDS Corporation (e) |
13.5 | — | ||||||
| Ingenio Acquisition, LLC (d) |
1.6 | — | ||||||
| JDC Healthcare Management, LLC |
— | 11.2 | ||||||
| LCP Capital Fund LLC |
— | 3.6 | ||||||
| Loadmaster Derrick & Equipment, Inc. |
1.9 | 3.3 | ||||||
| MModal MQ Inc. |
— | 6.9 | ||||||
| Oasis Legal Finance Holding Company LLC |
9.8 | — | ||||||
| Octagon Income Note XIV, Ltd. |
1.0 | — | ||||||
| Pinnacle Operating Corporation |
10.3 | — | ||||||
| Pomeroy IT Solutions, Inc |
— | 18.1 | ||||||
| Purple Communications, Inc. |
— | 11.5 | ||||||
| Sheridan Square CLO, Ltd |
0.7 | — | ||||||
| Surgery Center Holdings, Inc. (c) |
19.8 | — | ||||||
| T&D Solutions, LLC |
— | 15.3 | ||||||
| Texas Honing, Inc. |
— | 14.4 | ||||||
| Tri Starr Management Services, Inc. (d) |
2.4 | — | ||||||
| Wingspan Portfolio Holdings, Inc. (d) |
7.1 | — | ||||||
| YP Equity Investors, LLC (f) |
3.4 | — | ||||||
| YP Intermediate Holdings Corp. |
— | 6.5 | ||||||
| Broadly syndicated loans (g) |
— | 24.2 | ||||||
|
|
|
|
|
|||||
| Total (h) | $ | 170.2 | $ | 177.1 | ||||
|
|
|
|
|
|||||
| (a) | Proceeds include $14.3 million received in connection with the prepayment of our initial first lien secured debt investment as part of a refinancing and subsequently closed on a $14.3 million first lien secured debt investment. |
69
Table of Contents
| (b) | Proceeds include $14.2 million received in connection with the prepayment of our initial first lien secured debt investment as part of a refinancing and subsequently closed on a $21.8 million first lien secured debt investment. |
| (c) | Proceeds include $19.3 million, including a prepayment premium, received in connection with the prepayment of our subordinated debt investment as part of a refinancing. We subsequently closed on a $14.6 million second lien investment. |
| (d) | Proceeds received in connection with the sale of investments to Greenway II and co-investors. |
| (e) | Proceeds include $1.3 million recorded as an escrow receivable. |
| (f) | Excludes dividend income and realized gains, net of tax received in connection with our equity investment in June 2013. Proceeds shown reflect amounts received in connection with the repayment of our debt investment. |
| (g) | Investments in broadly syndicated first lien secured term loans in five companies made for short-term investment purposes. |
| (h) | For the years ended December 31, 2013 and 2012, proceeds included $1.3 million and $2.6 million, respectively, of prepayment premiums. |
The frequency or volume of any prepayments may fluctuate significantly from period to period. The level of prepayment and sales activity stayed relatively consistent between the years ended December 31, 2013 and 2012 as the result of portfolio company refinancings reflecting the tightening interest rate environment.
Our level of investment activity can vary substantially from period to period depending on many factors, including the amount of debt and equity capital available to middle market companies, the level of merger and acquisition activity, the general economic environment and the competitive environment for the types of investments we make.
For the year ended December 31, 2013, we had 5 unsponsored investment transactions compared to only 3 for the year ended December 31, 2012.
Investment Risk
The value of our investments will generally fluctuate with, among other things, changes in prevailing interest rates, federal tax rates, counterparty risk, general economic conditions, the condition of certain financial markets, developments or trends in any particular industry and the financial condition of the issuer. During periods of limited liquidity and higher price volatility, our ability to dispose of investments at a price and time that we deem advantageous may be impaired.
Lower-quality debt securities involve greater risk of default or price changes due to changes in the credit quality of the issuer. The value of lower-quality debt securities often fluctuates in response to company, political, or economic developments and can decline significantly over short periods of time or during periods of general or regional economic difficulty. Lower-quality debt securities can be thinly traded or have restrictions on resale, making them difficult to sell at an acceptable price. The default rate for lower-quality debt securities is likely to be higher during economic recessions or periods of high interest rates.
Managed Funds
The Advisor and its affiliates may also manage other funds in the future that may have investment mandates that are similar, in whole and in part, with ours. For example, the Advisor may serve as investment adviser to one or more private funds or registered closed-end funds, and presently serves as an investment adviser to a collateralized loan obligation (CLO), THL Credit Wind River 2013-2 CLO, Ltd., and a subadviser to a closed-end fund, THL Credit Senior Loan Fund (NYSE: TSLF). In addition, our officers may serve in similar capacities for one or more private funds or registered closed-end funds. The Advisor and its affiliates may determine that an investment is appropriate for us and for one or more of those other funds. In such event, depending on the
70
Table of Contents
availability of such investment and other appropriate factors, the Advisor or its affiliates may determine that we should invest side-by-side with one or more other funds. Any such investments will be made only to the extent permitted by applicable law and interpretive positions of the SEC and its staff, and consistent with the Advisor’s allocation procedures.
We do not have the ability to redeem our investment in funds but distributions are expected to be received as the underlying investments are expected to be liquidated at the dissolution of the funds, which is anticipated to be between 2014 and 2021.
Greenway
On January 14, 2011, THL Credit Greenway Fund LLC, or Greenway, was formed as a Delaware limited liability company. Greenway is a portfolio company of the Company. Greenway is a closed-end investment fund which provides for no liquidity or redemption options and is not readily marketable. Greenway operates under a limited liability agreement dated January 19, 2011, or the Agreement. Greenway will continue in existence until January 14, 2021, subject to earlier termination pursuant to certain terms of the Agreement. The term may also be extended for up to three additional one-year periods pursuant to certain terms of the Agreement. Greenway had a two year investment period. Greenway has $150 million of capital committed by affiliates of a single institutional investor, and is managed by the Company. The Company’s capital commitment to Greenway is $0.02 million. As of December 31, 2013 and December 31, 2012, all of the capital had been called by Greenway. Our nominal investment in Greenway is reflected in the December 31, 2013 and December 31, 2012 Consolidated Schedule of Investments. As of December 31, 2013, distributions representing 85% of the committed capital of the investor have been made from Greenway. Distributions from Greenway to its members from inception through December 31, 2013 totaled $127.4 million.
The Company acts as the investment adviser to Greenway and is entitled to receive certain fees relating to its investment management services provided, including a base management fee, a performance fee and a portion of the closing fees on each investment transaction. As a result, Greenway is classified as an affiliate of the Company. For the years ended December 31, 2013, 2012 and 2011, the Company earned $1.6 million, $2.6 million and $1.8 million in fees related to Greenway, respectively, which are included in other income from non-controlled, affiliated investment in the Consolidated Statements of Operations. As of December 31, 2013 and December 31, 2012, $0.2 million and $0.4 million of fees related to Greenway, respectively, were included in due from affiliate on the Consolidated Statements of Assets and Liabilities.
Greenway invests in securities similar to those of the Company pursuant to investment and allocation guidelines which address, among other things, the size of the borrowers, the types of transactions and the concentration and investment ratio amongst Greenway and the Company. However, the Company has the discretion to invest in other securities.
Greenway II
On January 31, 2013, THL Credit Greenway Fund II, LLC, or Greenway II LLC, was formed as a Delaware limited liability company and is a portfolio company of the Company. Greenway II LLC is a closed-end investment fund which provides for no liquidity or redemption options and is not readily marketable. Greenway II LLC operates under a limited liability agreement dated February 11, 2013, as amended, or the Greenway II LLC Agreement. Greenway II LLC will continue in existence for eight years from the final closing date, subject to earlier termination pursuant to certain terms of the Greenway II LLC Agreement. The term may also be extended for up to three additional one-year periods pursuant to certain terms of the Greenway II LLC Agreement. Greenway II LLC has a two year investment period.
As contemplated in the Greenway II LLC Agreement, we have established a related investment vehicle and entered into an investment management agreement with an account set up by an unaffiliated third party investor
71
Table of Contents
to invest alongside Greenway II LLC pursuant to similar economic terms. The account is also managed by the Company. References to “Greenway II” herein include Greenway II LLC and the account of the related investment vehicle. Greenway II has $186.5 million of commitments primarily from institutional investors. The Company’s capital commitment to Greenway II is $0.005 million. Our nominal investment in Greenway II LLC is reflected in the December 31, 2013 Consolidated Schedule of Investments. Greenway II LLC is managed by the Company. Distributions from Greenway II to its members from inception through December 31, 2013 totaled $3.0 million.
The Company acts as the investment adviser to Greenway II and is entitled to receive certain fees relating to its investment management services provided, including a base management fee, a performance fee and a portion of the closing fees on each investment transaction. As a result, Greenway II is classified as an affiliate of the Company. For the year ended December 31, 2013, we earned $1.3 million in fees related to Greenway II, which are included in other income from non-controlled, affiliated investment in the Consolidated Statements of Operations. As of December 31, 2013, $0.7 million of fees related to Greenway II were included in due from affiliate on the Consolidated Statements of Assets and Liabilities. During the year ended December 31, 2013, the Company sold a portion of its investments in seven portfolio companies at fair value, for total proceeds of $19.5 million, to Greenway II. Fair value was determined in accordance with the Company’s valuation policies.
Other deferred costs consist of placement agent expenses incurred in connection with the offer and sale of partnership interests in Greenway II. These costs are capitalized when commitments close and are recognized as an expense over the period when the Company expects to collect management fees from Greenway II. For the year ended December 31, 2013, we recognized $0.1 million in expenses related to placement agent expenses, which are included in other general and administrative expenses in the Consolidated Statements of Operations. As of December 31, 2013, $0.8 million were included in other deferred costs on the Consolidated Statements of Assets and Liabilities.
Greenway II invests in securities similar to those of the Company pursuant to investment and allocation guidelines which address, among other things, the size of the borrowers, the types of transactions and the concentration and investment ratio amongst Greenway II and the Company. However, the Company has the discretion to invest in other securities.
Investment in Funds
LCP Capital Fund LLC
We have invested in a membership interest of LCP Capital Fund LLC, or LCP, a private investment company that was organized to participate in investment opportunities that arise when a special purpose entity, or SPE, or sponsor thereof, needs to raise capital to achieve ratings, regulatory, accounting, tax, or other objectives. LCP is a closed vehicle which provides for no liquidity or redemption options and is not readily marketable. LCP is managed by an unaffiliated third party. As of December 31, 2013 and December 31, 2012, we had contributed $12.0 million of capital in the form of membership interests in LCP, which is invested in an underlying SPE referred to as Series 2005-01. On May 1, 2012, we received $3.6 million in connection with a reduction in its commitment pursuant to the governing documents, which is related to the notional amount of the underlying credit default swaps. Our exposure is limited to the amount of its remaining contributed capital. As of December 31, 2013 and December 31, 2012, the value of our interest in LCP was $8.4 million, and is reflected in the Consolidated Schedules of Investments.
Our contributed capital in LCP is maintained in a collateral account held by a third-party custodian, who is neither affiliated with us nor with LCP, and acts as collateral on certain credit default swaps for the Series 2005-01 for which LCP receives fixed premium payments throughout the year, adjusted for expenses incurred by LCP. The SPE purchases assets on a non-recourse basis and LCP agrees to reimburse the SPE up to a specified amount for potential losses. LCP holds the contributed cash invested for an SPE transaction in a segregated account that
72
Table of Contents
secures the payment obligation of LCP. We expect to receive distributions from LCP on a quarterly basis. Such distributions are reflected in our Consolidated Statements of Operations as interest income in the period earned. As of December 31, 2013, LCP has a remaining life of 18 years. Regardless of the date of dissolution, LCP has the right to receive amounts held in the collateral account if there is an event of default under LCP’s operative agreements. LCP may have other series which will have investments in other SPEs to which we will not be exposed. We expected that Series 2005-01 would terminate on February 15, 2015 but, on February 3, 2014, LCP was liquidated pursuant to the terms of its governing documents and we received proceeds of $8.4 million, representing the remaining value of our interest.
CLO Residual Interests
As of December 31, 2013, we invested $41.9 million in the CLO residual interests, or subordinated notes, which can also be structured as income notes, of five CLOs. We own between 10.4% and 23.1% of the subordinated notes of these CLOs. These subordinated notes are subordinated to the secured notes issued in connection with each CLO. The secured notes in each structure are collateralized by portfolios consisting primarily of broadly syndicated senior secured bank loans. The first investment was in the income notes of a $625.9 million CLO of Octagon Investment Partners XIV, Ltd. The income notes are part of a class of subordinated notes, which are paid equal with other subordinated notes within this class. The subordinated notes are subordinated to the claims of $569.3 million in secured notes issued by the structure. The second investment was in the income notes of a $724.5 million CLO of Sheridan Square CLO Ltd. The income notes are part of a class of subordinated notes, which are paid equal with other subordinated notes within this class. The subordinated notes are subordinated to the claims of $658.7 million in secured notes issued by the structure. The third investment was in the subordinated notes of the $517.0 million CLO of Adirondack Park CLO Ltd. There is only one class of subordinated notes that are subordinated to the claims of $463.5 million in secured notes issued by the structure. The fourth investment was in the subordinated notes of a $516.4 million CLO of Dryden 30 Senior Loan Fund. The subordinated notes are subordinated to the claims of $473.2 million in secured notes issued by the structure. The fifth investment was in the subordinated notes of a $441.8 million CLO of Flagship VII, Ltd. The subordinated notes are subordinated to the claims of $402.1 million in secured notes issued by the structure.
In each case, the subordinated notes do not have a stated rate of interest, but are entitled to receive distributions on quarterly payment dates subject to the priority of payments to secured note holders in the structures if and to the extent funds are available for such purpose. The payments on the subordinated notes are subordinated not only to the interest and principal claims of all secured notes issued, but to certain administrative expenses, taxes, and the base and subordinated fees paid to the collateral manager. Payments to the subordinated notes may vary significantly quarter to quarter for a variety of reasons and may be subject to 100% loss. Investments in subordinated notes, due to the structure of the CLO, can be significantly impacted by change in the market value of the assets, the distributions on the assets, defaults and recoveries on the assets, capital gains and losses on the assets along with prices, interest rates and other risks associated with the assets.
Investment in Tax Receivable Agreement Payment Rights
In June 2012, we invested in a TRA that entitles us to certain payment rights, or TRA Payment Rights, from Duff & Phelps Corporation, or Duff & Phelps. The TRA transfers the economic value of certain tax deductions, or tax benefits, taken by Duff & Phelps to us and entitles us to a stream of payments to be received. The TRA payment right is, in effect, a subordinated claim on the issuing company which can be valued based on the credit risk of the issuer, which includes projected future earnings, the liquidity of the underlying payment right, risk of tax law changes, the effective tax rate and any other factors which might impact the value of the payment right.
Through the TRA, we are entitled to receive an annual tax benefit payment based upon 85% of the savings from certain deductions along with interest. The payments that we are entitled to receive result from cash savings, if any, in U.S. federal, state or local income tax that Duff & Phelps realizes (i) from the tax savings
73
Table of Contents
derived from the goodwill and other intangibles created in connection with the Duff & Phelps initial public offering and (ii) from other income tax deductions. These tax benefit payments will continue until the relevant deductions are fully utilized, which is projected to be 17 years. Pursuant to the TRA, we maintain the right to enforce Duff & Phelps payment obligations as a transferee of the TRA contract. If Duff & Phelps chooses to pre-pay and terminate the TRA, we will be entitled to the present value of the expected future TRA payments. If Duff & Phelps breaches any material obligation then all obligations are accelerated and calculated as if an early termination occurred. Failure to make a payment is a breach of a material obligation if the failure occurs for more than three months.
The projected annual tax benefit payment is accrued on a quarterly basis and paid annually. The payment is allocated between a reduction in the cost basis of the investment and interest income based upon an amortization schedule. Based upon the characteristics of the investment, we have chosen to categorize the investment in the TRA payment rights as an investment in payment rights.
Asset Quality
We view active portfolio monitoring as a vital part of our investment process. We consider board observation rights, regular dialogue with company management and sponsors, and detailed internally generated monitoring reports to be critical to our performance. We have developed a monitoring template that promotes compliance with these standards and that is used as a tool by the Advisor’s investment committee to assess investment performance relative to plan. In addition, our portfolio companies may rely on us to provide financial and capital market expertise and may view us as a value-added resource.
As part of the monitoring process, the Advisor assesses the risk profile of each of our investments and assigns each investment a score of a 1, 2, 3, 4 or 5
The revised investment performance scores, or IPS, are as follows:
1 – The portfolio company is performing above our underwriting expectations.
2 – The portfolio company is performing as expected at the time of underwriting. All new investments are initially scored a 2.
3 – The portfolio company is operating below our underwriting expectations, and requires closer monitoring. The company may be out of compliance with financial covenants, however, principal or interest payments are generally not past due.
4 – The portfolio company is performing materially below our underwriting expectations and returns on our investment are likely to be impaired. Principal or interest payments may be past due, however, full recovery of principal and interest payments are expected.
5 – The portfolio company is performing substantially below expectations and the risk of the investment has increased substantially. The company is in payment default and the principal and interest payments are not expected to be repaid in full.
For any investment receiving a score of a 3 or lower, our manager increases its level of focus and prepares regular updates for the investment committee summarizing current operating results, material impending events and recommended actions. As of December 31, 2013 we had assigned an investment score of 4 to three portfolio companies.
The Advisor monitors and, when appropriate, changes the investment scores assigned to each investment in our portfolio. In connection with our investment valuation process, the Advisor and board of directors review
74
Table of Contents
these investment scores on a quarterly basis. Our average investment score was 2.13 and 2.12 at December 31, 2013 and December 31, 2012, respectively. The following is a distribution of the investment scores of our portfolio companies at December 31, 2013 and 2012 (in millions):
| December 31, 2013 | December 31, 2012 | |||||||||||||||
| Investment Score |
Fair Value | % of
Total Portfolio |
Fair Value | % of
Total Portfolio |
||||||||||||
|
1(a) |
$ | 58.9 | 9.1 | % | $ | 20.0 | 5.1 | % | ||||||||
|
2(b) |
484.5 | 74.7 | % | 312.4 | 79.2 | % | ||||||||||
|
3(c) |
72.9 | 11.2 | % | 55.5 | 14.1 | % | ||||||||||
|
4(d) |
32.6 | 5.0 | % | 6.4 | 1.6 | % | ||||||||||
| 5 |
— | — | — | — | ||||||||||||
|
|
|
|
|
|
|
|
|
|||||||||
| Total |
$ | 648.9 | 100.00 | % | $ | 394.3 | 100.0 | % | ||||||||
|
|
|
|
|
|
|
|
|
|||||||||
| (a) | As of December 31, 2013, Investment Score “1” included no loans to companies in which we also hold equity securities. As of December 31, 2012, Investment Score “1” included $8.2 million of loans to companies in which we also hold equity securities. |
| (b) | As of December 31, 2013 and December 31, 2012, Investment Score “2” included $62.4 million and $49.4 million, respectively, of loans to companies in which we also hold equity securities. |
| (c) | As of December 31, 2013 and December 31, 2012, Investment Score “3” included $14.5 million and $27.0 million, respectively, of loans to companies in which we also hold equity securities. |
| (d) | As of December 31, 2013, Investment Score “4” included $10.2 million of loans to companies in which we also hold equity securities. As of December 31, 2012, Investment Score “4” included no loans to companies in which we also hold equity securities. |
Loans are placed on non-accrual status when principal or interest payments are past due 30 days or more and/or when it is no longer probable that principal or interest will be collected. However, we may make exceptions to this policy if the loan has sufficient collateral value and is in the process of collection. As of December 31, 2013, we had two loans on non-accrual with an amortized cost basis of $21.0 million and fair value of $16.8 million. As of December 31, 2012, we had no loans on non-accrual.
Results of Operations
The principal measure of our financial performance is net increase (decrease) in net assets resulting from operations, which includes net investment income (loss), net realized gain (loss), net change in unrealized appreciation (depreciation), interest rate derivative periodic interest payments, net, and provisions for income taxes. Net investment income (loss) is the difference between our income from interest, dividends, fees and other investment income and our operating expenses. Net realized gain (loss) on investments is the difference between the proceeds received from dispositions of portfolio investments and their amortized cost. Net change in unrealized appreciation (depreciation) on investments is the net change in the fair value of our investment portfolio. Net change in unrealized appreciation (depreciation) on interest rate derivative is the net change in the fair value of the interest rate derivative agreement. Interest rate derivative periodic interest payments, net are the difference between the proceeds received or the amounts paid on the interest rate derivative.
Comparison of the Years Ended December 31, 2013, 2012 and 2011
Investment Income
We generate revenues primarily in the form of interest on the debt and other income-producing securities we hold. Other income-producing securities include investments in funds, investment in payment rights and notional interest, or equity, of collateralized loan obligation, or CLO, residual interests. Our investments in fixed income instruments generally have an expected maturity of five to seven years, and typically bear interest at a fixed or floating rate. Interest on our debt securities is generally payable quarterly. Payments of principal of our debt
75
Table of Contents
investments may be amortized over the stated term of the investment, deferred for several years or due entirely at maturity. In some cases, our debt instruments and preferred stock investments may defer payments of dividends or pay interest in-kind, or PIK. Any outstanding principal amount of our debt securities and any accrued but unpaid interest will generally become due at the maturity date. The level of interest income we receive is directly related to the balance of interest-bearing investments multiplied by the weighted average yield of our investments. In addition to interest income, we may receive dividends and other distributions related to our equity investments. We may also generate revenue in the form of fees from the management of Greenway and Greenway II, prepayment premiums, commitment, loan origination, structuring or due diligence fees, fees for providing significant managerial assistance and consulting fees.
The following shows the breakdown of investment income for the years ended December 31, 2013, 2012 and 2011 (in millions):
| Years ended December 31, | ||||||||||||
| 2013 | 2012 | 2011 | ||||||||||
| Interest income on debt securities |
||||||||||||
| Cash interest |
$ | 51.7 | $ | 36.7 | $ | 26.9 | ||||||
| Interest earned from bank accounts |
— | — | 0.1 | |||||||||
| PIK interest |
3.2 | 4.1 | 2.6 | |||||||||
| Prepayment premiums |
1.3 | 2.6 | 1.1 | |||||||||
| Accretion of discounts and other fees |
4.1 | 3.6 | 2.1 | |||||||||
|
|
|
|
|
|
|
|||||||
| Total interest on debt securities |
60.3 | 47.0 | 32.8 | |||||||||
| Dividend income |
4.1 | 0.4 | 0.3 | |||||||||
| Interest income on other income-producing securities |
6.5 | 2.8 | 2.1 | |||||||||
| Fees related to Greenway and Greenway II |
3.0 | 2.6 | 1.8 | |||||||||
| Other income |
0.8 | 0.3 | 0.4 | |||||||||
|
|
|
|
|
|
|
|||||||
| Total | $ | 74.7 | $ | 53.1 | $ | 37.4 | ||||||
|
|
|
|
|
|
|
|||||||
The increases in investment income from the respective periods were primarily due to the growth in the overall investment portfolio and dividends received from our equity investments in YP Equity Investors, LLC, or YP, and Surgery Center Holdings, Inc., or Surgery and Greenway II fees.
The following shows a rollforward of PIK income activity for the years ended December 31, 2013, 2012 and 2011 (in millions):
| Accumulated PIK balance at December 31, 2010 |
$ | 0.9 | ||
| PIK income capitalized/receivable |
2.6 | |||
|
|
|
|||
| Accumulated PIK balance at December 31, 2011 |
3.5 | |||
| PIK income capitalized/receivable |
4.1 | |||
| PIK received in cash from repayments |
(1.8 | ) | ||
|
|
|
|||
| Accumulated PIK balance at December 31, 2012 |
5.8 | |||
| PIK income capitalized/receivable |
3.2 | |||
| PIK received in cash from repayments |
(2.9 | ) | ||
|
|
|
|||
| Accumulated PIK balance at December 31, 2013 |
$ | 6.1 | ||
|
|
|
In certain investment transactions, we may provide advisory services. For services that are separately identifiable and external evidence exists to substantiate fair value, income is recognized as earned. We had no income from advisory services related to portfolio companies for the years ended December 31, 2013, 2012 and 2011.
76
Table of Contents
Expenses
Our primary operating expenses include the payment of base management fees, an incentive fee, and expenses reimbursable under the investment management agreement and the allocable portion of overhead under the administration and investment management agreements (“administrator expenses”). The base management fee compensates the Advisor for work in identifying, evaluating, negotiating, closing and monitoring our investments. Our investment management agreement and administration agreement provides that we will reimburse the Advisor for costs and expenses incurred by the Advisor for facilities, office equipment and utilities allocable to the performance by the Advisor of its duties under the agreements, as well as any costs and expenses incurred by the Advisor relating to any administrative or operating services provided by the Advisor to us. We bear all other costs and expenses of our operations and transactions.
The following shows the breakdown of expenses for the years ended December 31, 2013, 2012 and 2011 (in millions):
| Years ended December 31, | ||||||||||||
| 2013 | 2012 | 2011 | ||||||||||
| Expenses |
||||||||||||
| Incentive fees(a) |
$ | 10.7 | $ | 7.0 | $ | 4.8 | ||||||
| Base management fees |
7.5 | 4.9 | 4.0 | |||||||||
| Administrator expenses |
3.6 | 3.2 | 2.9 | |||||||||
| Credit facility interest and fees |
7.1 | 4.1 | 1.7 | |||||||||
| Other expenses |
3.9 | 3.1 | 3.0 | |||||||||
|
|
|
|
|
|
|
|||||||
| Total expenses before taxes |
32.8 | 22.3 | 16.4 | |||||||||
| Income tax provision and excise tax |
0.5 | 0.6 | — | |||||||||
|
|
|
|
|
|
|
|||||||
| Total expenses after taxes |
$ | 33.3 | $ | 22.9 | $ | 16.4 | ||||||
|
|
|
|
|
|
|
|||||||
| (a) | For the years ended December 31, 2013, 2012 and 2011, incentive fees include the effect of the GAAP incentive fee amounts of $0.3 million, ($0.5) million and $0.8 million, respectively. There can be no assurance that such change in unrealized appreciation (depreciation) will be realized in the future. |
The increase in operating expenses for the respective periods was due primarily to the increase in base management fees and incentive fees, which was the result of growing the size of our portfolio and resultant performance and credit facility expenses, which was a result of an increase in the credit facility commitments and usage.
We expect certain of our operating expenses, including administrator expenses, professional fees and other general and administrative expenses to decline as a percentage of our total assets during periods of growth and increase as a percentage of our total assets during periods of asset declines.
Net Investment Income
Net investment income was $41.4 million, or $1.37 per common share based on a weighted average of 30,286,955 common shares outstanding for the year ended December 31, 2013, as compared to $30.2 million, or $1.38 per common share based on a weighted average of 21,852,197 common shares outstanding for the year ended December 31, 2012 and $21.0 million, or $1.04 per common share based on a weighted average of 20,167,092 common shares outstanding for the year ended December 31, 2011.
The increase in net investment income is primarily attributable to the growth in the portfolio, increase in fees related to our managed funds, and dividend income received from our equity investments in YP.
77
Table of Contents
Net Realized Gains and Losses on Investments
We measure realized gains or losses by the difference between the net proceeds from the repayment or sale and the amortized cost basis of the investment, using the specific identification method, without regard to unrealized appreciation or depreciation previously recognized.
We recognized net realized gains on our portfolio investments of $2.6 million during the year ended December 31, 2013, related primarily to the proceeds received from YP and Surgery.
We recognized realized gains on our portfolio investments during years ended December 31, 2012 and 2011 of $0.4 million, primarily related to the sale of investments in broadly secured first lien term loans, and $1.0 million related to the sale of our equity ownership in one investment, respectively.
Net Change in Unrealized Appreciation of Investments
Net change in unrealized appreciation primarily reflects the change in portfolio investment values during the reporting period, including the reversal of previously recorded appreciation or depreciation when gains or losses are realized.
The following shows the breakdown in the changes in unrealized appreciation of investments for the years ended December 31, 2013, 2012 and 2011 (in millions):
| Years ended December 31, | ||||||||||||
| 2013 | 2012 | 2011 | ||||||||||
| Gross unrealized appreciation on investments |
$ | 9.1 | $ | 4.5 | $ | 5.1 | ||||||
| Gross unrealized depreciation on investments |
(8.8 | ) | (2.8 | ) | (1.2 | ) | ||||||
| Reversal of prior period net unrealized appreciation upon a realization |
— | (2.9 | ) | (1.8 | ) | |||||||
|
|
|
|
|
|
|
|||||||
| Total |
$ | 0.3 | $ | (1.2 | ) | $ | 2.1 | |||||
|
|
|
|
|
|
|
|||||||
The change in unrealized appreciation on our investments was driven primarily by changes in the capital market conditions, financial performance of certain portfolio companies, and the reversal of unrealized appreciation of investments repaid or recapitalized.
Provision for Taxes on Unrealized Appreciation on Investments
Certain consolidated subsidiaries of ours are subject to U.S. federal and state income taxes. These taxable entities are not consolidated with the Company for income tax purposes and may generate income tax liabilities or assets from temporary differences in the recognition of items for financial reporting and income tax purposes at the subsidiaries. For the years ended December 31, 2013 and 2012, the Company recognized a provision for tax on unrealized gain of $2.0 million and $0.5 million for consolidated subsidiaries, respectively. For the years ended December 31, 2011, the Company did not recognize a provision for tax on unrealized gain. As of December 31, 2013 and December 31, 2012, $2.4 million and $0.5 million, respectively, were included in deferred tax liability on the Consolidated Statements of Assets and Liabilities relating to deferred tax on unrealized gain on investments. The increase in provision for tax on unrealized gain relates primarily to the tax characteristics of the proceeds received from YP in June 2013 as well as changes to the unrealized appreciation (depreciation) of the investments held in these taxable consolidated subsidiaries.
Realized and Unrealized Appreciation (Depreciation) of Interest Rate Derivative
The interest rate derivative was entered into on May 10, 2012. Unrealized depreciation reflects the value of the interest rate derivative agreement at the end of the reporting period. For the years ended December 31, 2013
78
Table of Contents
and 2012, the net change of unrealized depreciation on interest rate derivative totaled $0.8 million and ($1.1) million, respectively, which is listed under net change in unrealized depreciation on interest rate derivatives in the Consolidated Statement of Operations. The changes were due to capital market changes impacting swap rates.
We measure realized gains or losses on the interest rate derivative based upon the difference between the proceeds received or the amount paid on the interest rate derivative. For the years ended December 31, 2013 and 2012, we realized a loss of $0.4 million and $0.2 million, respectively, as interest rate derivative periodic interest payments, net on the Consolidated Statement of Operations.
Net Increase in Net Assets Resulting from Operations
Net increase in net assets resulting from operations totaled $42.7 million, or $1.41 per common share based on a weighted average of 30,286,955 common shares for the year ended December 31, 2013, as compared to $27.6 million, or $1.26 per common share based on a weighted average of 21,852,197 common shares outstanding for the year ended December 31, 2012 and $24.1 million, or $1.20 per common share based on a weighted average of 20,167,092 common shares outstanding for the year ended December 31, 2011.
The increase in net assets resulting from operations is due to the continued growth in net investment income, which is a result of growing our portfolio, dividends and realized gains from Surgery and YP, provision for taxes on unrealized gain on investments as well as changes in the unrealized value of our interest rate derivative.
Financial condition, liquidity and capital resources
Cash Flows from Operating and Financing Activities
Our liquidity and capital resources are derived from our credit facilities, equity raises and cash flows from operations, including investment sales and repayments, and income earned. Our primary use of funds from operations includes investments in portfolio companies, payment of dividends to the holders of our common stock and payments of fees and other operating expenses we incur. We have used, and expect to continue to use, our borrowings and the proceeds from the turnover in our portfolio and from public and private offerings of securities to finance our investment objectives, to the extent permitted by the 1940 Act.
We may raise additional equity or debt capital through both registered offerings off our shelf registration statement and private offerings of securities, by securitizing a portion of our investments or borrowings. To the extent we determine to raise additional equity through an offering of our common stock at a price below net asset value, existing investors will experience dilution. During our 2013 Annual Stockholder Meeting held on June 10, 2013, our stockholders authorized us, with the approval of our Board of Directors, to sell up to 25% of our outstanding common stock at a price below our then current net asset value per share and to offer and issue debt with warrants or debt convertible into shares of our common stock at an exercise or conversion price that will not be less than the fair market value per share but may be below the then current net asset value per share. There can be no assurance that these capital resources will be available.
On June 24, 2013, we received $106.2 million in proceeds, net of offering fees and underwriting discount, from our public equity offering of common stock and used $92.3 million to pay down outstanding amounts on our Revolving Facility.
We borrowed $410.7 million under our Revolving Facility and $43.0 million under our Term Loan Facility for the year ended December 31, 2013 and repaid $299.4 million on our Revolving Facility from proceeds received from the equity offering, term loan and investment income. We borrowed $139.9 million under our Revolving Facility and $50.0 million under our Term Loan Facility for the year ended December 31, 2012 and repaid $144.9 million on our Revolving Facility from proceeds received from the Term Loan Facility and investment income.
79
Table of Contents
Our operating activities used cash of $210.5 million and $95.4 million for the years ended December 31, 2013 and 2012, respectively, primarily in connection with the purchase of portfolio investments. For the year ended December 31, 2013, our financing activities provided cash of $265.3 million from our common stock offering and net borrowings and used cash of $44.7 million for distributions to stockholders and $7.0 million for the payment of financing and offering costs. For the year ended December 31, 2012, our financing activities provided cash of $130.9 million from our common stock offering and net borrowings and used cash of $29.4 million for distributions to stockholders and $6.8 million for the payment of financing and offering costs. For the year ended December 31, 2011, our financing activities provided cash of $5.0 million from net borrowings and used cash of $19.5 million for distributions to stockholders and $2.9 million for the payment of financing and offering costs.
As of December 31, 2013 and December 31, 2012, we had cash of $7.8 million and $4.8 million, respectively. We had no cash equivalents as of December 31, 2013 and December 31, 2012.
We believe cash balances, our Revolving Facility capacity and any proceeds generated from the sale or pay down of investments provides us with ample liquidity to acquit our pipeline for the coming quarters.
Credit Facility
There is $232.0 million available to borrow under our revolving credit agreement, or Revolving Facility, and $93.0 million available to borrow under our term loan agreement, or Term Loan Facility.
The Revolving Facility has a maturity date of May 2017 (with a one year term out period beginning in May 2016). The one year term out period is the one year anniversary between the revolver termination date, or the end of the availability period, and the maturity date. During this time, we are required to make mandatory prepayments on our loans from the proceeds we receive from the sale of assets, extraordinary receipts, returns of capital or the issuances of equity or debt. The Revolving Facility has an the interest rate of (i) when the facility is more than or equal to 35% drawn and the step-down condition is satisfied, LIBOR plus 2.75%, (ii) when the facility is more than or equal to 35% drawn and the step-down condition is not satisfied, LIBOR plus 3.00%, (iii) when the facility is less than 35% drawn and the step-down condition is satisfied, LIBOR plus 2.75%, and (iv) when the facility is less than 35% drawn and the step-down condition is not satisfied, LIBOR plus 3.25%. The non-use fee is 1.00% annually if we use 35% or less of the Revolving Facility and 0.50% annually if we use more than 35% of the Revolving Facility. We elect the LIBOR rate on the loans outstanding on our Revolving Facility, which can have a maturity date that is one, two, three or six months.
The Term Loan Facility has a maturity date of May 2018. The Term Loan bears interest at LIBOR plus 4.00% (with no LIBOR Floor) and has substantially similar terms to our existing Revolving Facility. We elect the LIBOR rate on our Term Loan, which can have a maturity date that is one, two, three or six months. The LIBOR rate on our Term Loan currently has a one month maturity.
Each of the Facilities includes an accordion feature permitting us to expand the Facilities, if certain conditions are satisfied; provided, however, that the aggregate amount of the Facilities, collectively, is capped at $400.0 million. The Facilities generally require payment of interest on a quarterly basis for ABR loans (commonly based on the Prime Rate or the Federal Funds Rate), and at the end of the applicable interest period for Eurocurrency loans bearing interest at LIBOR, the interest rate benchmark used to determine the variable rates paid on the Facilities. LIBOR maturities can range between one and six months at the election of the Company. All outstanding principal is due upon each maturity date. The Facilities also require a mandatory prepayment of interest and principal upon certain customary triggering events (including, without limitation, the disposition of assets or the issuance of certain securities).
Borrowings under the Facilities are subject to, among other things, a minimum borrowing/collateral base. The Facilities have certain collateral requirements and/or financial covenants, including covenants related to: (a) limitations on the incurrence of additional indebtedness and liens, (b) limitations on certain investments,
80
Table of Contents
(c) limitations on certain restricted payments, (d) limitations on the creation or existence of agreements that prohibit liens on certain properties of ours and our subsidiaries, and (e) compliance with certain financial maintenance standards including (i) minimum stockholders’ equity, (ii) a ratio of total assets (less total liabilities not represented by senior securities) to the aggregate amount of senior securities representing indebtedness, of us and our subsidiaries, of not less than 2.25:1.0, (iii) minimum liquidity, (iv) minimum net worth, and (v) a consolidated interest coverage ratio. In addition to the financial maintenance standards, described in the preceding sentence, borrowings under the Facilities (and the incurrence of certain other permitted debt) are subject to compliance with a borrowing base that applies different advance rates to different types of assets in our portfolio.
The Facilities’ documents also include default provisions such as the failure to make timely payments under the Facilities, the occurrence of a change in control, and the failure by us to materially perform under the operative agreements governing the Facilities, which, if not complied with, could, at the option of the lenders under the Facilities, accelerate repayment under the Facilities, thereby materially and adversely affecting our liquidity, financial condition and results of operations. Each loan originated under the Revolving Facility is subject to the satisfaction of certain conditions. We cannot be assured that we will be able to borrow funds under the Revolving Facility at any particular time or at all. We are currently in compliance with all financial covenants under the Facilities.
For the year ended December 31, 2013, we borrowed $453.7 million and repaid $299.4 million under the Facilities. For the year ended December 31, 2012, we borrowed $189.9 million and repaid $144.9 million under the Facilities. For the year ended December 31, 2011, the Company borrowed $28.5 million and repaid $23.5 million under the Facilities.
The following shows a summary of our Revolving Facility and Term Loan Facility as of December 31, 2013 and 2012 (in millions):
| As of December 31, 2013 | ||||||||||||
| Facility |
Commitments | Borrowings Outstanding |
Weighted Average Interest Rate |
|||||||||
| Revolving Facility |
$ | 232.0 | $ | 111.3 | 3.19 | % | ||||||
| Term Loan Facility |
93.0 | 93.0 | 4.17 | % | ||||||||
|
|
|
|
|
|
|
|||||||
| Total |
$ | 325.0 | $ | 204.3 | 3.63 | % | ||||||
|
|
|
|
|
|
|
|||||||
| As of December 31, 2012 |
||||||||||||
| Facility |
Commitments | Borrowings Outstanding |
Weighted Average Interest Rate |
|||||||||
| Revolving Facility |
$ | 140.0 | $ | — | — | |||||||
| Term Loan Facility |
50.0 | 50.0 | 4.21 | % | ||||||||
|
|
|
|
|
|
|
|||||||
| Total |
$ | 190.0 | $ | 50.0 | 4.21 | % | ||||||
|
|
|
|
|
|
|
|||||||
The fair values of our Facilities are determined in accordance with ASC 820, which defines fair value in terms of the price that would be paid to transfer a liability in an orderly transaction between market participants at the measurement date under current market conditions. The fair value of our Facilities are estimated based upon market interest rates and entities with similar credit risk. As of December 31, 2013 and December 31, 2012, the Facilities would be deemed to be level 3 of the fair value hierarchy.
Interest expense and related fees, excluding amortization of deferred financing costs, of $5.6 million and $3.1 million were incurred in connection with the Facilities during the years ended December 31, 2013 and 2012, respectively.
81
Table of Contents
In accordance with the 1940 Act, with certain exceptions, the Company is only allowed to borrow amounts such that its asset coverage, as defined in the 1940 Act, is at least 200% after such borrowing. The asset coverage as of December 31, 2013 is in excess of 200%.
Interest Rate Derivative
On May 10, 2012, we entered into a five-year interest rate swap agreement, or swap agreement, with ING Capital Markets, LLC in connection with its Term Loan Facility. Under the swap agreement, with a notional value of $50 million, we pay a fixed rate of 1.1425% and receive a floating rate based upon the current three-month LIBOR rate. We entered into the swap agreement to manage interest rate risk and not for speculative purposes.
We record the change in valuation of the swap agreement in unrealized appreciation (depreciation) as of each measurement period. When the quarterly swap amounts are paid or received under the swap agreement, the amounts are recorded as a realized gain (loss) as interest rate derivative periodic interest payments, net on the Consolidated Statement of Operations.
For the years ended December 31, 2013 and 2012, we recognized $0.4 million and $0.2 million, respectively, of realized loss from the swap agreement, which is reflected as interest rate derivative periodic interest payments, net in the Consolidated Statements of Operations.
For the years ended December 31, 2013 and 2012, we recognized $0.8 million and $(1.1) million of net change in unrealized depreciation from the swap agreement, respectively, which is listed under net change in unrealized depreciation on interest rate derivative in the Consolidated Statements of Operations. As of December 31, 2013 and December 31, 2012, our fair value of the swap agreement is $(0.3) million and $(1.1) million, respectively, which is listed as an interest rate derivative liability on the Consolidated Statements of Assets and Liabilities.
Commitments and Contingencies
From time to time, we, or the Advisor, may become party to legal proceedings in the ordinary course of business, including proceedings related to the enforcement of our rights under contracts with our portfolio companies. Neither we, nor the Advisor, are currently subject to any material legal proceedings.
Unfunded commitments to provide funds to portfolio companies are not reflected in our Consolidated Statements of Assets and Liabilities. Our unfunded commitments may be significant from time to time. These commitments will be subject to the same underwriting and ongoing portfolio maintenance as are the on-balance sheet financial instruments that we hold. Since these commitments may expire without being drawn upon, the total commitment amount does not necessarily represent future cash requirements. We intend to use cash flow from normal and early principal repayments and proceeds from borrowings and offerings to fund these commitments.
As of December 31, 2013 and December 31, 2012, we have the following unfunded commitments to portfolio companies (in millions):
| As of | ||||||||
| December 31, 2013 | December 31, 2012 | |||||||
| Unfunded revolving commitments |
$ | 9.2 | $ | 10.9 | ||||
| Unfunded delayed draw and capital expenditure facilities |
9.5 | 12.0 | ||||||
| Unfunded commitments to investments in funds |
4.0 | 4.0 | ||||||
|
|
|
|
|
|||||
| Total unfunded commitments |
$ | 22.7 | $ | 26.9 | ||||
|
|
|
|
|
|||||
82
Table of Contents
Dividends
We have elected to be taxed as a regulated investment company under Subchapter M of the Code. In order to maintain our status as a regulated investment company, we are required to distribute at least 90% of our investment company taxable income. To avoid a 4% excise tax on undistributed earnings, we are required to distribute each calendar year the sum of (i) 98% of our ordinary income for such calendar year (ii) 98.2% of our net capital gains for the one-year period ending October 31 of that calendar year (iii) any income recognized, but not distributed, in preceding years and on which we paid no federal income tax. We intend to make distributions to stockholders on a quarterly basis of substantially all of our net investment income. Although we intend to make distributions of net realized capital gains, if any, at least annually, out of assets legally available for such distributions, we may in the future decide to retain such capital gains for investment. In addition, the extent and timing of special dividends, if any, will be determined by our board of directors and will largely be driven by portfolio specific events and tax considerations at the time.
In addition, we may be limited in our ability to make distributions due to the BDC asset coverage test for borrowings applicable to us as a BDC under the 1940 Act.
The following table summarizes our dividends declared and paid or to be paid on all shares:
| Date Declared |
Record Date |
Payment Date |
Amount Per Share | |||
| August 5, 2010 |
September 2, 2010 | September 30, 2010 | $0.05 | |||
| November 4, 2010 |
November 30, 2010 | December 28, 2010 | $0.10 | |||
| December 14, 2010 |
December 31, 2010 | January 28, 2011 | $0.15 | |||
| March 10, 2011 |
March 25, 2011 | March 31, 2011 | $0.23 | |||
| May 5, 2011 |
June 15, 2011 | June 30, 2011 | $0.25 | |||
| July 28, 2011 |
September 15, 2011 | September 30, 2011 | $0.26 | |||
| October 27, 2011 |
December 15, 2011 | December 30, 2011 | $0.28 | |||
| March 6, 2012 |
March 20, 2012 | March 30, 2012 | $0.29 | |||
| March 6, 2012 |
March 20, 2012 | March 30, 2012 | $0.05 | |||
| May 2, 2012 |
June 15, 2012 | June 29, 2012 | $0.30 | |||
| July 26, 2012 |
September 14, 2012 | September 28, 2012 | $0.32 | |||
| November 2, 2012 |
December 14, 2012 | December 28, 2012 | $0.33 | |||
| December 20, 2012 |
December 31, 2012 | January 28, 2013 | $0.05 | |||
| February 27, 2013 |
March 15, 2013 | March 29, 2013 | $0.33 | |||
| May 2, 2013 |
June 14, 2013 | June 28, 2013 | $0.34 | |||
| August 2, 2013 |
September 16, 2013 | September 30, 2013 | $0.34 | |||
| August 2, 2013 |
September 16, 2013 | September 30, 2013 | $0.08 | |||
| October 30, 2013 |
December 16, 2013 | December 31, 2013 | $0.34 | |||
| March 4, 2014 |
March 17, 2014 | March 31, 2014 | $0.34 |
We may not be able to achieve operating results that will allow us to make distributions at a specific level or to increase the amount of these distributions from time to time. If we do not distribute a certain percentage of our income annually, we will suffer adverse tax consequences, including possible loss of our status as a regulated investment company. We cannot assure stockholders that they will receive any distributions at a particular level. We maintain an “opt in” dividend reinvestment plan for our common stockholders. As a result, unless stockholders specifically elect to have their dividends automatically reinvested in additional shares of common stock, stockholders will receive all such dividends in cash. Under the terms of our dividend reinvestment plan, dividends will primarily be paid in newly issued shares of common stock. However, we reserve the right to purchase shares in the open market in connection with the implementation of the plan. This feature of the plan means that, under certain circumstances, we may issue shares of our common stock at a price below net asset value per share, which could cause our stockholders to experience dilution.
83
Table of Contents
Distributions in excess of our current and accumulated profits and earnings would be treated first as a return of capital to the extent of the stockholder’s tax basis, and any remaining distributions would be treated as a capital gain. The determination of the tax attributes of our distributions will be made annually as of the end of our fiscal year based upon our taxable income for the full year and distributions paid for the full year. Therefore, a determination made on a quarterly basis may not be representative of the actual tax attributes of our distributions for a full year. Each year, a statement on Form 1099-DIV identifying the source of the distribution will be mailed to our stockholders.
The tax character of distributions declared and paid in 2013 represented $43.3 million from ordinary income, $0.01 million from capital gains and $0 from tax return of capital. Generally accepted accounting principles require adjustments to certain components of net assets to reflect permanent differences between financial and tax reporting. These adjustments have no affect on net asset value per share. Permanent differences between financial and tax reporting at December 31, 2013 and 2012 were $0.2 and $0.2 million.
Contractual obligations
We have entered into a contract with the Advisor to provide investment advisory services. Payments for investment advisory services under the investment management agreement in future periods will be equal to (a) an annual base management fee of 1.5% of our gross assets and (b) an incentive fee based on our performance. In addition, under our administration agreement, the Advisor will be reimbursed for administrative services incurred on our behalf. See description below under Related Party Transactions.
The following table shows our contractual obligations as of December 31, 2013 (in millions):
| Payments due by period | ||||||||||||||||||||
| Contractual Obligations(1) |
Total | Less than 1 year |
1 – 3years | 3 – 5 years | After 5 years |
|||||||||||||||
| Term Loan Facility |
$ | 93.0 | — | — | $ | 93.0 | — | |||||||||||||
| (1) | Excludes commitments to extend credit to our portfolio companies. |
We entered into an interest rate derivative to manage interest rate risk. We record the change in valuation of the swap agreement in unrealized appreciation (depreciation) as of each measurement period. When the quarterly interest rate swap amounts are paid or received under the swap agreement, the amounts are recorded as a realized gain (loss). Further discussion of the interest rate derivative is included in Note 1 “Significant Accounting Policies” and Note 7 “Interest Rate Derivative” in the “Notes to Consolidated Financial Statements”.
Off-Balance sheet arrangements
We currently have no off-balance sheet arrangements, including any risk management of commodity pricing or other hedging practices.
Related Party Transactions
Investment Management Agreement
On March 4, 2014, our investment management agreement with the Advisor was re-approved by our Board of Directors. Under the investment management agreement, the Advisor, subject to the overall supervision of our board of directors, manages the day-to-day operations of, and provides investment advisory services to us.
The Advisor receives a fee for investment advisory and management services consisting of a base management fee and a two-part incentive fee.
84
Table of Contents
The base management fee is calculated at an annual rate of 1.5% of our gross assets payable quarterly in arrears on a calendar quarter basis. For purposes of calculating the base management fee, “gross assets” is determined as the value of our assets without deduction for any liabilities. The base management fee is calculated based on the value of our gross assets at the end of the most recently completed calendar quarter, and appropriately adjusted for any share issuances or repurchases during the current calendar quarter.
For the years ended December 31, 2013, 2012 and 2011, we incurred base management fees payable to the Advisor of $7.5 million, $4.9 million and $4.0 million, respectively. As of December 31, 2013 and December 31, 2012, $2.2 million and $1.5 million, respectively, was payable to the Advisor.
The incentive fee has two components, ordinary income and capital gains, as follows:
The ordinary income component is calculated, and payable, quarterly in arrears based on our preincentive fee net investment income for the immediately preceding calendar quarter, subject to a cumulative total return requirement and to deferral of non-cash amounts. The preincentive fee net investment income, which is expressed as a rate of return on the value of our net assets attributable to our common stock, for the immediately preceding calendar quarter, will have a 2.0% (which is 8.0% annualized) hurdle rate (also referred to as “minimum income level”). Preincentive fee net investment income means interest income, dividend income and any other income (including any other fees, such as commitment, origination, structuring, diligence, managerial assistance and consulting fees or other fees that we receive from portfolio companies) accrued during the calendar quarter, minus our operating expenses for the quarter (including the base management fee, expenses payable under our administration agreement (discussed below), and any interest expense and any dividends paid on any issued and outstanding preferred stock, but excluding the incentive fee and any offering expenses and other expenses not charged to operations but excluding certain reversals to the extent such reversals have the effect of reducing previously accrued incentive fees based on the deferral of non-cash interest. Preincentive fee net investment income includes, in the case of investments with a deferred interest feature (such as original issue discount, debt instruments with PIK interest and zero coupon securities), accrued income that we have not yet received in cash. The Advisor receives no incentive fee for any calendar quarter in which our preincentive fee net investment income does not exceed the minimum income level. Subject to the cumulative total return requirement described below, the Advisor receives 100% of our preincentive fee net investment income for any calendar quarter with respect to that portion of the preincentive net investment income for such quarter, if any, that exceeds the minimum income level but is less than 2.5% (which is 10.0% annualized) of net assets (also referred to as the “catch-up” provision) and 20.0% of our preincentive fee net investment income for such calendar quarter, if any, greater than 2.5% (10.0% annualized) of net assets. The foregoing incentive fee is subject to a total return requirement, which provides that no incentive fee in respect of our preincentive fee net investment income is payable except to the extent 20.0% of the cumulative net increase in net assets resulting from operations over the then current and 11 preceding calendar quarters exceeds the cumulative incentive fees accrued and/or paid for the 11 preceding quarters. In other words, any ordinary income incentive fee that is payable in a calendar quarter is limited to the lesser of (i) 20% of the amount by which our preincentive fee net investment income for such calendar quarter exceeds the 2.0% hurdle, subject to the “catch-up” provision, and (ii) (x) 20% of the cumulative net increase in net assets resulting from operations for the then current and 11 preceding quarters minus (y) the cumulative incentive fees accrued and/or paid for the 11 preceding calendar quarters. For the foregoing purpose, the “cumulative net increase in net assets resulting from operations” is the amount, if positive, of the sum of our preincentive fee net investment income, base management fees, realized gains and losses and unrealized appreciation and depreciation for the then current and 11 preceding calendar quarters. In addition, the Advisor is not paid the portion of such incentive fee that is attributable to deferred interest until we actually receive such interest in cash.
For the years ended December 31, 2013, 2012 and 2011, we incurred $10.4 million, $7.4 million and $3.8 million, respectively, of incentive fees related to ordinary income. As of December 31, 2013 and December 31, 2012, $2.1 million and $2.3 million, respectively, of such incentive fees are currently payable to the Advisor. As of December 31, 2013 and 2012, $1.3 million and $0.6 million, respectively of incentive fees incurred by us were generated from deferred interest (i.e. PIK, certain discount accretion and deferred interest) and are not payable until such amounts are received in cash.
85
Table of Contents
GAAP requires that the incentive fee accrual considers the cumulative aggregate realized gains and losses and unrealized capital appreciation or depreciation of investments or other financial instruments, such as an interest rate derivative, in the calculation, as an incentive fee would be payable if such realized gains and losses or unrealized capital appreciation or depreciation were realized, even though such realized gains and losses and unrealized capital appreciation or depreciation is not permitted to be considered in calculating the fee actually payable under the investment management agreement (“GAAP Incentive Fee”). There can be no assurance that such unrealized appreciation or depreciation will be realized in the future. Accordingly, such fee, as calculated and accrued, would not necessarily be payable under the investment management agreement, and may never be paid based upon the computation of incentive fees in subsequent periods. For the years ended December 31, 2013, 2012, and 2011, we incurred $0.3 million, $(0.5) million and $0.8 million, respectively, of incentive fees related to the GAAP incentive fee. As of December 31, 2013 and 2012, $0.1 million and $0.4 million, respectively, of GAAP incentive fees incurred by us are not currently payable until the hurdle is met as described below.
The second component of the incentive fee (capital gains incentive fee) is determined and payable in arrears as of the end of each calendar year (or upon termination of the investment management agreement, as of the termination date). This component is equal to 20.0% of our cumulative aggregate realized capital gains from inception through the end of that calendar year, computed net of the cumulative aggregate realized capital losses and cumulative aggregate unrealized capital depreciation through the end of such year. The aggregate amount of any previously paid capital gains incentive fees is subtracted from such capital gains incentive fee calculated. The capital gains incentive fee payable to our Advisor under the investment management agreement as of December 31, 2013 and December 31, 2012 was $0 and $0, respectively.
Administration Agreement
We have also entered into an administration agreement with the Advisor under which the Advisor will provide administrative services to us. Under the administration agreement, the Advisor performs, or oversees the performance of administrative services necessary for our operation, which include, among other things, being responsible for the financial records which we are required to maintain and preparing reports to our stockholders and reports filed with the SEC. In addition, the Advisor assists in determining and publishing our net asset value, oversees the preparation and filing of our tax returns and the printing and dissemination of reports to our stockholders, and generally oversees the payment of our expenses and the performance of administrative and professional services rendered to us by others. We will reimburse the Advisor for our allocable portion of the costs and expenses incurred by the Advisor for overhead in performance by the Advisor of its duties under the administration agreement and the investment management agreement, including facilities, office equipment and our allocable portion of cost of compensation and related expenses of our chief financial officer and chief compliance officer and their respective staffs, as well as any costs and expenses incurred by the Advisor relating to any administrative or operating services provided to us by the Advisor. Such costs are reflected as Administrator expenses in the accompanying Consolidated Statements of Operations. Under the administration agreement, the Advisor provides, on our behalf, managerial assistance to those portfolio companies to which the Company is required to provide such assistance. To the extent that our Advisor outsources any of its functions, the Company pays the fees associated with such functions on a direct basis without profit to the Advisor.
For the years ended December 31, 2013, 2012 and 2011, we incurred administrator expenses of $3.6 million, $3.2 million and $2.9 million, respectively. As of December 31, 2013 and December 31, 2012, $0.2 million and $0.3 million, respectively, was payable to the Advisor.
License Agreement
We and the Advisor have entered into a license agreement with THL Partners under which THL Partners has granted to us and the Advisor a non-exclusive, personal, revocable worldwide non-transferable license to use the trade name and service mark THL, which is a proprietary mark of THL Partners, for specified purposes in connection with our respective businesses. This license agreement is royalty-free, which means we are not
86
Table of Contents
charged a fee for our use of the trade name and service mark THL. The license agreement is terminable either in its entirety or with respect to us or the Advisor by THL Partners at any time in its sole discretion upon 60 days prior written notice, and is also terminable with respect to either us or the Advisor by THL Partners in the case of certain events of non-compliance. After the expiration of its first one year term, the entire license agreement is terminable by either us or the Advisor at our or its sole discretion upon 60 days prior written notice. Upon termination of the license agreement, we and the Advisor must cease to use the name and mark THL, including any use in our respective legal names, filings, listings and other uses that may require us to withdraw or replace our names and marks. Other than with respect to the limited rights contained in the license agreement, we and the Advisor have no right to use, or other rights in respect of, the THL name and mark. We are an entity operated independently from THL Partners, and third parties who deal with us have no recourse against THL Partners.
Due to and from Affiliates
The Advisor paid certain other general and administrative expenses on our behalf. As of December 31, 2013, $0.01 million of expenses were included in due to affiliate on the Consolidated Statements of Assets and Liabilities. There were no amounts due to affiliate as of December 31, 2012.
We act as the investment adviser to Greenway and Greenway II and are entitled to receive certain fees. As a result, Greenway and Greenway II are classified as an affiliate. As of December 31, 2013 and 2012, $1.0 million and $0.4 million of fees related to Greenway and Greenway II, respectively, were included in due from affiliate on the Consolidated Statements of Assets and Liabilities. As of December 31, 2013 and 2012, $0.5 million and $0 was included in due to affiliate on the Consolidated Statements of Assets and Liabilities related to the portion of the escrow receivable, due to THL Corporate Finance, Inc., as the administrative agent, to Greenway.
Managed Funds
Greenway
On January 14, 2011, Greenway was formed as a Delaware limited liability company. Greenway is a portfolio company of the Company. Greenway is a closed-end investment fund which provides for no liquidity or redemption options and is not readily marketable. Greenway operates under a limited liability agreement dated January 19, 2011. Greenway will continue in existence until January 14, 2021, subject to earlier termination pursuant to certain terms of the Agreement. The term may also be extended for up to three additional one-year periods pursuant to certain terms of the Agreement. Greenway had a two year investment period.
Greenway has $150.0 million of capital committed by affiliates of a single institutional investor, and is managed by the Company. The Company’s capital commitment to Greenway is $0.02 million. As of December 31, 2013 and December 31, 2012, all of the capital had been called by Greenway. The Company’s nominal investment in Greenway LLC is reflected in the December 31, 2013 and December 31, 2012 Consolidated Schedule of Investments.
The Company acts as the investment adviser to Greenway and is entitled to receive certain fees relating to its investment management services provided, including a base management fee, a performance fee and a portion of the closing fees on each investment transaction. As a result, Greenway is classified as an affiliate of the Company. For the years ended December 31, 2013, 2012 and 2011, we earned $1.7 million, $2.6 million and $1.8 million in fees related to Greenway, respectively, which are included in other income from non-controlled, affiliated investment in the Consolidated Statements of Operations. As of December 31, 2013 and December 31, 2012, $0.2 million and $0.4 million, respectively, of fees related to Greenway were included in due from affiliate on the Consolidated Statements of Assets and Liabilities. Distributions from Greenway to its members from inception through December 31, 2013 totaled $127.4 million.
Greenway invests in securities similar to those of ours pursuant to investment and allocation guidelines which address, among other things, the size of the borrowers, the types of transactions and the concentration and investment ratio amongst Greenway and us. However, we have the discretion to invest in other securities.
87
Table of Contents
Greenway II
On January 31, 2013, Greenway II LLC was formed as a Delaware limited liability company and is a portfolio company of the Company. Greenway II LLC is a closed-end investment fund which provides for no liquidity or redemption options and is not readily marketable. Greenway II operates under a limited liability agreement dated February 11, 2013, as amended, or the Greenway II Agreement. Greenway II LLC will continue in existence for eight years from the final closing date, subject to earlier termination pursuant to certain terms of the Greenway II LLC Agreement. The term may also be extended for up to three additional one-year periods pursuant to certain terms of the Greenway II LLC Agreement. Greenway II LLC has a two year investment period.
As contemplated in the Greenway II LLC Agreement, the Company has established a related investment vehicle and entered into an investment management agreement with an account set up by an unaffiliated third party investor to invest alongside Greenway II LLC pursuant to similar economic terms. The account is also managed by the Company. References to “Greenway II” herein include Greenway II LLC and the account of the related investment vehicle. Greenway II has $186.5 million of commitments primarily from institutional investors. The Company’s capital commitment to Greenway II is $0.005 million. The Company’s nominal investment in Greenway II LLC is reflected in the December 31, 2013 Consolidated Schedule of Investments. Greenway II LLC is managed by the Company. Greenway II LLC is managed by the Company. Distributions from Greenway II to its members from inception through December 31, 2013 totaled $3.0 million.
The Company acts as the investment adviser to Greenway II and is entitled to receive certain fees relating to its investment management services provided, including a base management fee, a performance fee and a portion of the closing fees on each investment transaction. As a result, Greenway II is classified as an affiliate of the Company. For the year ended December 31, 2013, the Company earned $1.3 million in fees related to Greenway II, which are included in other income from non-controlled, affiliated investment in the Consolidated Statements of Operations. As of December 31, 2013, $0.7 million of fees related to Greenway II were included in due from affiliate on the Consolidated Statements of Assets and Liabilities. During the year ended December 31, 2013, the Company sold a portion of its investments in seven portfolio companies at fair value, for total proceeds of $19.5 million, to Greenway II determined in accordance with the normal valuation policies.
Other deferred costs consist of placement agent expenses incurred in connection with the offer and sale of partnership interests in Greenway II. These costs are capitalized when the partner signs the Greenway II subscription agreement and are recognized as an expense over the period when the Company expects to collect management fees from Greenway II. For the year ended December 31, 2013, the Company recognized $0.1 million in expenses related to placement agent expenses, which are included in other general and administrative expenses in the Consolidated Statements of Operations. As of December 31, 2013, $0.8 million were included in other deferred costs on the Consolidated Statements of Assets and Liabilities.
Greenway II invests in securities similar to those of the Company pursuant to investment and allocation guidelines which address, among other things, the size of the borrowers, the types of transactions and the concentration and investment ratio amongst Greenway II and the Company. However, the Company has the discretion to invest in other securities.
Critical accounting policies
Our discussion and analysis of our financial condition and results of operations are based upon our consolidated financial statements, which have been prepared in accordance with GAAP. The preparation of these consolidated financial statements requires management to make estimates and assumptions that affect the reported amounts of assets, liabilities, revenues and expenses. Changes in the economic environment, financial markets and any other parameters used in determining such estimates could cause actual results to differ. In addition to the discussion below, the Company’s significant accounting policies are further described in the notes to the consolidated financial statements.
88
Table of Contents
Valuation of Portfolio Investments
As a BDC, we generally invest in illiquid securities including debt and equity investments of middle market companies. Investments for which market quotations are readily available are valued using market quotations, which are generally obtained from an independent pricing service or one or more broker-dealers or market makers. Debt and equity securities for which market quotations are not readily available or are not considered to be the best estimate of fair value are valued at fair value as determined in good faith by our board of directors. Because we expect that there will not be a readily available market value for many of the investments in our portfolio, it is expected that many of our portfolio investments’ values will be determined in good faith by our board of directors in accordance with a documented valuation policy that has been reviewed and approved by our board of directors in accordance with GAAP. Due to the inherent uncertainty of determining the fair value of investments that do not have a readily available market value, the fair value of our investments may differ significantly from the values that would have been used had a readily available market value existed for such investments, and the differences could be material.
With respect to investments for which market quotations are not readily available, our board of directors undertakes a multi-step valuation process each quarter, as described below:
| • | our quarterly valuation process begins with each portfolio company or investment being initially valued by the investment professionals responsible for the portfolio investment; |
| • | preliminary valuation conclusions are then documented and discussed with senior management of the Advisor; |
| • | to the extent determined by the audit committee of our board of directors, independent valuation firm engaged by us conduct independent appraisals and review the Advisor’s preliminary valuations in light of their own independent assessment; |
| • | the audit committee of our board of directors reviews the preliminary valuations of the Advisor and independent valuation firm and, if necessary, responds and supplements the valuation recommendation of the independent valuation firm to reflect any comments; and |
| • | our board of directors discusses valuations and determines the fair value of each investment in our portfolio in good faith based on the input of the Advisor, the respective independent valuation firm and the audit committee. |
The types of factors that we may take into account in fair value pricing our investments include, as relevant, the nature and realizable value of any collateral, the portfolio company’s ability to make payments and its earnings and discounted cash flows, the markets in which the portfolio company does business, comparison to publicly traded securities and other relevant factors. We utilize an income approach to value our debt investments and a combination of income and market approaches to value our equity investments. With respect to unquoted securities, the Advisor and our board of directors, in consultation with our independent third party valuation firm, values each investment considering, among other measures, discounted cash flow models, comparisons of financial ratios of peer companies that are public and other factors, which valuation is then approved by our board of directors. For debt investments, we determine the fair value primarily using an income, or yield, approach that analyzes the discounted cash flows of interest and principal for the debt security, as set forth in the associated loan agreements, as well as the financial position and credit risk of each portfolio investments. Our estimate of the expected repayment date is generally the legal maturity date of the instrument. The yield analysis considers changes in leverage levels, credit quality, portfolio company performance and other factors.
We value our interest rate derivative agreement using an income approach that analyzes the discounted cash flows associated with the interest rate derivative agreement. Significant inputs to the discounted cash flows methodology include the forward interest rate yield curves in effect as of the end of the measurement period and an evaluation of the counterparty’s credit risk.
89
Table of Contents
We value our residual interest investments in collateralized loan obligations using an income approach that analyzes the discounted cash flows of our residual interest. The discounted cash flows model utilizes prepayment, re-investment and loss assumptions based on historical experience and projected performance, economic factors, the characteristics of the underlying cash flow, and comparable yields for similar collateralized loan obligation fund subordinated notes or equity, when available. Specifically, we use Intex cash flow models, or an appropriate substitute to form the basis for the valuation of our residual interest. The models use a set of assumptions including projected default rates, recovery rates, reinvestment rate and prepayment rates in order to arrive at estimated cash flows. The assumptions are based on available market data and projections provided by third parties as well as management estimates.
We value our investment in payment rights using an income approach that analyzes the discounted projected future cash flow streams assuming an appropriate discount rate, which will among other things consider other transactions in the market, the current credit environment, performance of the underlying portfolio company and the length of the remaining payment stream.
The market approach uses prices and other relevant information generated by market transactions involving identical or comparable assets or liabilities (including a business). The income approach uses valuation techniques to convert future cash flows or earnings to a single present amount (discounted). The measurement is based on the value indicated by current market expectations about those future amounts. In following these approaches, the types of factors that we may take into account in fair value pricing our investments include, as relevant: available current market data, including relevant and applicable market trading and transaction comparables, applicable market yields and multiples, the current investment performance rating, security covenants, call protection provisions, information rights, the nature and realizable value of any collateral, the portfolio company’s ability to make payments, its earnings and discounted cash flows, the markets in which the portfolio company does business, comparisons of financial ratios of peer companies that are public, transaction comparables, our principal market as the reporting entity and enterprise values, among other factors.
In accordance with the authoritative guidance on fair value measurements and disclosures under GAAP, we disclose the fair value of our investments in a hierarchy that prioritizes the inputs to valuation techniques used to measure fair value. The hierarchy gives the highest priority to unadjusted quoted prices in active markets for identical assets or liabilities (Level 1 measurements) and the lowest priority to unobservable inputs (Level 3 measurements). The guidance establishes three levels of the fair value hierarchy as follows:
Level 1 – Unadjusted quoted prices in active markets that are accessible at the measurement date for identical, unrestricted assets or liabilities;
Level 2 – Quoted prices in markets that are not considered to be active or financial instruments for which significant inputs are observable, either directly or indirectly;
Level 3 – Prices or valuations that require inputs that are both significant to the fair value measurement and unobservable.
The level of an asset or liability within the fair value hierarchy is based on the lowest level of any input that is significant to the fair value measurement. However, the determination of what constitutes “observable” requires significant judgment by management.
We consider whether the volume and level of activity for the asset or liability have significantly decreased and identifies transactions that are not orderly in determining fair value. Accordingly, if we determine that either the volume and/or level of activity for an asset or liability has significantly decreased (from normal conditions for that asset or liability) or price quotations or observable inputs are not associated with orderly transactions, increased analysis and management judgment will be required to estimate fair value. Valuation techniques such as an income approach might be appropriate to supplement or replace a market approach in those circumstances.
90
Table of Contents
We have adopted the authoritative guidance under GAAP for estimating the fair value of investments in investment companies that have calculated net asset value per share in accordance with the specialized accounting guidance for Investment Companies. Accordingly, in circumstances in which net asset value per share of an investment is determinative of fair value, we estimate the fair value of an investment in an investment company using the net asset value per share of the investment (or its equivalent) without further adjustment, if the net asset value per share of the investment is determined in accordance with the specialized accounting guidance for investment companies as of the reporting entity’s measurement date.
Revenue Recognition
We record interest income, adjusted for amortization of premium and accretion of discount, on an accrual basis to the extent that we expect to collect such amounts. Dividend income is recognized on the ex-dividend date. Original issue discount, principally representing the estimated fair value of detachable equity or warrants obtained in conjunction with the acquisition of debt securities, and market discount or premium are capitalized and accreted or amortized into interest income over the life of the respective security using the effective yield method. The amortized cost of investments represents the original cost adjusted for the accretion/amortization of discounts and premiums and upfront loan origination fees.
Loans are placed on non-accrual status when principal or interest payments are past due 30 days or more and/or when it is no longer probable that principal or interest will be collected. However, we may make exceptions to this policy if the loan has sufficient collateral value and is in the process of collection.
We have investments in our portfolio which contain a contractual paid-in-kind, or PIK, interest provision. PIK interest is computed at the contractual rate specified in each investment agreement, is added to the principal balance of the investment, and is recorded as income. We will cease accruing PIK interest if there is insufficient value to support the accrual or if it does not expect amounts to be collectible. To maintain our status as a RIC, PIK interest income, which is considered investment company taxable income, must be paid out to stockholders in the form of dividends even though we have not yet collected the cash. Amounts necessary to pay these dividends may come from available cash.
We capitalize and amortize upfront loan origination fees received in connection with the closing of investments. The unearned income from such fees is accreted into interest income over the contractual life of the loan based on the effective interest method. Upon prepayment of a loan or debt security, any prepayment premiums, unamortized upfront loan origination fees, and unamortized discounts are recorded as interest income.
Interest income from our investment in TRA and CLO residual interest investments are recorded based upon an estimation of an effective yield to expected maturity using anticipated cash flows with any remaining amount recorded to the cost basis of the investment. We monitor the anticipated cash flows from our TRA and CLO residual interest investments and will adjust our effective yield periodically as needed.
Other income includes commitment fees, fees related to the management of Greenway and Greenway II, structuring fees, amendment fees and unused commitment fees associated with investments in portfolio companies. These fees are recognized as income when earned by us in accordance with the terms of the applicable management or credit agreement.
Net Realized Gains or Losses and Net Change in Unrealized Appreciation or Depreciation
We measure realized gains or losses by the difference between the net proceeds from the repayment or sale and the amortized cost basis of the investment, using the specific identification method, without regard to unrealized appreciation or depreciation previously recognized. We measure realized gains or losses on the interest rate derivative based upon the difference between the proceeds received or the amounts paid on the interest rate derivative. Net change in unrealized appreciation or depreciation reflects the change in portfolio
91
Table of Contents
investment values or value of the interest rate derivative during the reporting period, including any reversal of previously recorded unrealized appreciation or depreciation, when gains or losses are realized.
Federal Income Taxes, including excise tax
We operate so as to maintain our status as a RIC under Subchapter M of the Code and intend to continue to do so. Accordingly, we are not subject to federal income tax on the portion of our taxable income and gains distributed to stockholders. In order to qualify for favorable tax treatment as a RIC, we are required to distribute annually to our stockholders at least 90% of our investment company taxable income, as defined by the Code. To avoid a 4% federal excise tax, we must distribute each calendar year the sum of (i) 98% of our ordinary income for each such calendar year (ii) 98.2% of our net capital gains for the one-year period ending October 31 of that calendar year, and (iii) any income recognized, but not distributed, in preceding years and on which we paid no federal income tax. We may choose not to distribute all of our taxable income for the calendar year and pay a non-deductible 4% excise tax on this income. If we choose to do so, all other things being equal, this would increase expenses and reduce the amount available to be distributed to stockholders. To the extent that the Company determines that its estimated current year annual taxable income will be in excess of estimated current year dividend distributions from such taxable income, the Company accrues excise taxes on estimated excess taxable income as taxable income is earned using an annual effective excise tax rate. We will accrue excise tax on undistributed taxable income as required. Please refer to “Dividends” above for a summary of the distributions. For the years ended December 31, 2013, 2012 and 2011, we incurred excise tax expense of $0.1 million, $0.1 million and $0, respectively.
Certain consolidated subsidiaries are subject to U.S. federal and state income taxes. These taxable entities are not consolidated for income tax purposes and may generate income tax liabilities or assets from permanent and temporary differences in the recognition of items for financial reporting and income tax purposes at the subsidiaries.
For the years ended December 31, 2013 and 2012, we recognized a current income tax provision of $0.4 million and $0.5 million, respectively, which is shown as income tax provision in the Consolidated Statements of Operations. These income taxes relate primarily to the proceeds received from our equity investment in YP into one of our wholly owned tax blocker corporations and may be subject to further change once tax information is finalized for the year. We did not recognize a current tax expense for the year ended December 31, 2011. As of December 31, 2013, $0.4 million of income tax receivable was included in prepaid expenses and other assets and $0.1 million was included as income taxes payable on the Consolidated Statements of Assets and Liabilities relating to dividend income and other projected earnings of tax blocker corporations. As of December 31, 2012, there were no income taxes receivable or payable.
For the years ended December 31, 2013 and 2012, we recognized a provision for tax on unrealized gain on investments of $2.0 million and $0.5 million, respectively, for consolidated subsidiaries in the Consolidated Statements of Operations. We did not recognize a benefit or provision for tax on unrealized gain on investments for the year ended December 31, 2011. As of December 31, 2013 and December 31, 2012, $2.4 million and $0.5 million, respectively, were included in deferred tax liability on the Consolidated Statements of Assets and Liabilities relating to deferred tax on unrealized gain on investments held in tax blocker corporations.
Because federal income tax regulations differ from GAAP, distributions in accordance with tax regulations may differ from net investment income and realized gains recognized for financial reporting purposes. Differences may be permanent or temporary. Permanent differences are reclassified among capital accounts in the consolidated financial statements to reflect their tax character. Temporary differences arise when certain items of income, expense, gain or loss are recognized at some time in the future. Differences in classification may also result from the treatment of short-term gains as ordinary income for tax purposes.
92
Table of Contents
Recent Developments
From January 1, 2014 through March 7, 2014, we settled five new investments of $39.9 million in the transportation, energy and utilities, food and beverage and financial services industries. Of the $39.9 million of new investments 43.7% were first lien senior secured debt, 50.1% were second lien debt, 4.1% were equity investments and 2.1% were investments in funds. All of the new debt investments were floating rate and had a weighted average yield based upon cost at the time of the investment of 10.2%. One of the new debt investments had a remaining unfunded commitment of $4.6 million.
From January 1, 2014 through March 7, 2014, THL Credit received proceeds of $28.8 million from prepayments or sales of investments in eight companies in the IT services, financial services, healthcare and manufacturing industries, including prepayment premiums of $0.3 million. Of the aggregate principal amount of investments prepaid or sold, 5.8% were first lien senior secured debt, 57.9% were subordinated debt, 29.3% were investment in funds, 3.7% were CLO residual interests and 3.3% was an equity investment. Of the debt investments prepaid, 9.1% were floating rate and 90.9% were fixed rate with a PIK election.
From January 1, 2014 through March 7, 2014, we received proceeds of $2.8 million as part of dividend recapitalization from our equity investments in YP and Surgery. The character of these proceeds as dividends or capital gains will be determined in connection with the closing of the first quarter of 2014.
On March 4, 2014, the Company’s investment management agreement was re-approved by its board of directors.
On March 4, 2014, our board of directors declared a dividend of $0.34 per share payable on March 31, 2014 to stockholders of record at the close of business on March 17, 2014.
93
Table of Contents
| Item 7A. | Quantitative and Qualitative Disclosures About Market Risk |
We are subject to financial market risks, including changes in interest rates. As of December 31, 2013, 38.9%, or twenty-one, of the debt investments in our portfolio bore interest at fixed rates. Twenty-four of the debt investments in our portfolio have interest rate floors, which have effectively converted the debt investments to fixed rate loans in the current interest rate environment. In the future, we expect other debt investments in our portfolio will have floating rates. Our borrowings as well as the amount we receive under the interest rate derivative agreement are based upon floating rates.
Based on our December 31, 2013 Consolidated Statement of Assets and Liabilities, the following table shows the annual impact on net income of changes in interest rates, which assumes no changes in our investments and borrowings (in millions):
| Change in Basis Points |
Interest Income | Interest Expense | Net Income | |||||||||
| Up 300 basis points |
$ | 6.9 | $ | 5.0 | $ | 1.9 | ||||||
| Up 200 basis points |
$ | 3.5 | $ | 3.5 | $ | — | ||||||
| Up 100 basis points |
$ | 0.4 | $ | 1.9 | $ | (1.5 | ) | |||||
| Down 300 basis points |
$ | — | $ | — | $ | — | ||||||
| Down 200 basis points |
$ | — | $ | — | $ | — | ||||||
| Down 100 basis points |
$ | — | $ | — | $ | — | ||||||
Based upon the current three month LIBOR rate, a hypothetical decrease in LIBOR would not affect our net income, due to the aforementioned floors in place on our debt investments. We currently hedge against interest rate fluctuations by using an interest rate swap whereby we pay a fixed rate of 1.1425% and receive three-month LIBOR on a notional amount of $50 million related to our Term Loan. In the future, we may use other standard hedging instruments such as futures, options and forward contacts subject to the requirements of the 1940 Act. While hedging activities may insulate us against adverse changes in interest rates, they may also limit our ability to participate in the benefits of lower interest rates with respect to our portfolio of investments.
Although we believe that this measure is indicative of our sensitivity to interest rate changes, it does not adjust for potential changes in credit quality, size and composition of the assets on the balance sheet and other business developments that could affect net increase in net assets resulting from operations, or net income.
94
Table of Contents
| Item 8. | Financial Statements and Supplementary Data |
Index to Financial Statements
95
Table of Contents
Report of Independent Registered Public Accounting Firm
To The Board of Directors and Stockholders of
THL Credit, Inc.:
In our opinion, the accompanying consolidated statements of assets and liabilities, including the consolidated schedule of investments, and the related consolidated statements of operations, of changes in net assets, and of cash flows present fairly, in all material respects, the financial position of THL Credit, Inc. and its subsidiaries (together the “Company”) at December 31, 2013 and 2012, and the results of their operations, their changes in net assets, and their cash flows for each of the three years in the period ended December 31, 2013 in conformity with accounting principles generally accepted in the United States of America. Also in our opinion, the Company maintained, in all material respects, effective internal control over financial reporting as of December 31, 2013, based on criteria established in Internal Control - Integrated Framework (1992) issued by the Committee of Sponsoring Organizations of the Treadway Commission (COSO). The Company’s management is responsible for these financial statements, for maintaining effective internal control over financial reporting and for its assessment of the effectiveness of internal control over financial reporting, included in the accompanying Management’s Report on Internal Control over Financial Reporting appearing under Item 9A(b) of the annual report to stockholders. Our responsibility is to express opinions on these financial statements and on the Company’s internal control over financial reporting based on our integrated audits. We conducted our audits in accordance with the standards of the Public Company Accounting Oversight Board (United States). Those standards require that we plan and perform the audits to obtain reasonable assurance about whether the financial statements are free of material misstatement and whether effective internal control over financial reporting was maintained in all material respects. Our audits of the financial statements included examining, on a test basis, evidence supporting the amounts and disclosures in the financial statements, assessing the accounting principles used and significant estimates made by management, and evaluating the overall financial statement presentation. Our audit of internal control over financial reporting included obtaining an understanding of internal control over financial reporting, assessing the risk that a material weakness exists, and testing and evaluating the design and operating effectiveness of internal control based on the assessed risk. Our audits also included performing such other procedures as we considered necessary in the circumstances. Our procedures included confirmation of securities at December 31, 2013 by correspondence with the issuers or custodian, and where replies were not received, we performed other auditing procedures. We believe that our audits provide a reasonable basis for our opinions.
A company’s internal control over financial reporting is a process designed to provide reasonable assurance regarding the reliability of financial reporting and the preparation of financial statements for external purposes in accordance with generally accepted accounting principles. A company’s internal control over financial reporting includes those policies and procedures that (i) pertain to the maintenance of records that, in reasonable detail, accurately and fairly reflect the transactions and dispositions of the assets of the company; (ii) provide reasonable assurance that transactions are recorded as necessary to permit preparation of financial statements in accordance with generally accepted accounting principles, and that receipts and expenditures of the company are being made only in accordance with authorizations of management and directors of the company; and (iii) provide reasonable assurance regarding prevention or timely detection of unauthorized acquisition, use, or disposition of the company’s assets that could have a material effect on the financial statements.
Because of its inherent limitations, internal control over financial reporting may not prevent or detect misstatements. Also, projections of any evaluation of effectiveness to future periods are subject to the risk that controls may become inadequate because of changes in conditions, or that the degree of compliance with the policies or procedures may deteriorate.
/s/ PricewaterhouseCoopers LLP
Boston, Massachusetts
March 7, 2014
96
Table of Contents
THL Credit, Inc. and Subsidiaries
Consolidated Statements of Assets and Liabilities
(in thousands, except per share data)
| December 31, 2013 |
December 31, 2012 |
|||||||
| Assets: |
||||||||
| Investments at fair value: |
||||||||
| Non-controlled, non-affiliated investments (cost of $645,911 and $391,699, respectively) |
$ | 648,860 | $ | 394,339 | ||||
| Non-controlled, affiliated investments (cost of $7 and $10, respectively) |
7 | 10 | ||||||
|
|
|
|
|
|||||
| Total investments at fair value (cost of $645,918 and $391,709, respectively) |
$ | 648,867 | 394,349 | |||||
| Cash |
7,829 | 4,819 | ||||||
| Deferred financing costs |
4,604 | 3,817 | ||||||
| Interest receivable |
7,225 | 2,594 | ||||||
| Escrow receivable |
1,800 | — | ||||||
| Due from affiliate |
1,025 | 420 | ||||||
| Other deferred costs |
825 | — | ||||||
| Prepaid expenses and other assets |
441 | 134 | ||||||
| Receivable for paydown of investments |
275 | 125 | ||||||
|
|
|
|
|
|||||
| Total assets |
$ | 672,891 | $ | 406,258 | ||||
|
|
|
|
|
|||||
| Liabilities: |
||||||||
| Loans payable |
$ | 204,300 | $ | 50,000 | ||||
| Payable for investment purchased |
4,400 | — | ||||||
| Accrued incentive fees |
3,421 | 3,279 | ||||||
| Base management fees payable |
2,243 | 1,514 | ||||||
| Accrued expenses |
1,617 | 739 | ||||||
| Deferred tax liability |
2,414 | 454 | ||||||
| Accrued credit facility fees and interest |
567 | 115 | ||||||
| Due to affiliate |
474 | — | ||||||
| Interest rate derivative |
284 | 1,053 | ||||||
| Accrued administrator expenses |
158 | 304 | ||||||
| Income taxes payable |
71 | — | ||||||
| Dividends payable |
— | 1,316 | ||||||
|
|
|
|
|
|||||
| Total liabilities |
219,949 | 58,774 | ||||||
| Commitments and contingencies (Note 8) |
||||||||
| Net Assets: |
||||||||
| Preferred stock, par value $.001 per share, 100,000 preferred shares authorized, no preferred shares issued and outstanding |
— | — | ||||||
| Common stock, par value $.001 per share, 100,000 common shares authorized, 33,905 and 26,315 shares issued and outstanding at December 31, 2013 and December 31, 2012, respectively |
34 | 26 | ||||||
| Paid-in capital in excess of par |
450,043 | 343,723 | ||||||
| Net unrealized appreciation on investments, net of provision for taxes of $2,414 and $454, respectively |
535 | 2,187 | ||||||
| Net unrealized depreciation on interest rate derivative |
(284 | ) | (1,053 | ) | ||||
| Interest rate derivative periodic interest payments, net |
(613 | ) | (180 | ) | ||||
| Accumulated undistributed net realized gains |
2,023 | 348 | ||||||
| Accumulated undistributed net investment income |
1,204 | 2,433 | ||||||
|
|
|
|
|
|||||
| Total net assets |
452,942 | 347,484 | ||||||
|
|
|
|
|
|||||
| Total liabilities and net assets |
$ | 672,891 | $ | 406,258 | ||||
|
|
|
|
|
|||||
| Net asset value per share |
$ | 13.36 | $ | 13.20 | ||||
|
|
|
|
|
|||||
See accompanying notes to these consolidated financial statements.
97
Table of Contents
THL Credit, Inc. and Subsidiaries
Consolidated Statements of Operations
(in thousands, except per share data)
| For the years ended December 31, | ||||||||||||
| 2013 | 2012 | 2011 | ||||||||||
| Investment Income: |
||||||||||||
| From non-controlled, non-affiliated investments: |
||||||||||||
| Interest income |
$ | 66,787 | $ | 49,808 | $ | 34,903 | ||||||
| Dividend income |
4,074 | 456 | 280 | |||||||||
| Other income |
790 | 269 | 416 | |||||||||
| From non-controlled, affiliated investment: |
||||||||||||
| Other income |
2,999 | 2,592 | 1,810 | |||||||||
|
|
|
|
|
|
|
|||||||
| Total investment income |
74,650 | 53,125 | 37,409 | |||||||||
| Expenses: |
||||||||||||
| Incentive fees |
10,682 | 7,017 | 4,790 | |||||||||
| Base management fees |
7,521 | 4,943 | 4,012 | |||||||||
| Credit facility interest and fees |
5,623 | 3,138 | 1,043 | |||||||||
| Administrator expenses |
3,608 | 3,225 | 2,872 | |||||||||
| Other general and administrative expenses |
1,977 | 1,344 | 1,321 | |||||||||
| Amortization of debt issuance costs |
1,470 | 968 | 687 | |||||||||
| Professional fees |
1,288 | 1,200 | 1,092 | |||||||||
| Directors’ fees |
581 | 517 | 535 | |||||||||
|
|
|
|
|
|
|
|||||||
| Total expenses |
32,750 | 22,352 | 16,352 | |||||||||
| Income tax provision and excise tax |
511 | 581 | 22 | |||||||||
|
|
|
|
|
|
|
|||||||
| Net investment income |
41,389 | 30,192 | 21,035 | |||||||||
| Realized and Unrealized Gain on Investments: |
||||||||||||
| Net realized gain on non-controlled, non-affiliated investments |
2,604 | 353 | 979 | |||||||||
| Net change in unrealized appreciation on investments: |
||||||||||||
| Non-controlled, non-affiliated investments |
309 | (1,240 | ) | 2,120 | ||||||||
| Non-controlled, affiliated investments |
— | (1 | ) | 1 | ||||||||
|
|
|
|
|
|
|
|||||||
| Net change in unrealized appreciation on investments |
309 | (1,241 | ) | 2,121 | ||||||||
|
|
|
|
|
|
|
|||||||
| Net realized and unrealized (loss) gain from investments |
2,913 | (888 | ) | 3,100 | ||||||||
| Provision for taxes on unrealized gain on investments |
(1,960 | ) | (454 | ) | — | |||||||
| Interest rate derivative periodic interest payments, net |
(433 | ) | (180 | ) | ||||||||
| Net change in unrealized depreciation on interest rate derivative |
769 | (1,053 | ) | — | ||||||||
|
|
|
|
|
|
|
|||||||
| Net increase in net assets resulting from operations |
$ | 42,678 | $ | 27,617 | $ | 24,135 | ||||||
|
|
|
|
|
|
|
|||||||
| Net investment income per common share: |
||||||||||||
| Basic and diluted |
$ | 1.37 | $ | 1.38 | $ | 1.04 | ||||||
| Net increase in net assets resulting from operations per common share: |
||||||||||||
| Basic and diluted |
$ | 1.41 | $ | 1.26 | $ | 1.20 | ||||||
| Weighted average shares of common stock outstanding: |
||||||||||||
| Basic and diluted |
30,287 | 21,852 | 20,167 | |||||||||
See accompanying notes to these consolidated financial statements.
98
Table of Contents
THL Credit, Inc. and Subsidiaries
Consolidated Statements of Changes in Net Assets
(in thousands, except per share data)
| For the years ended December 31, | ||||||||||||
| 2013 | 2012 | 2011 | ||||||||||
| Increase in net assets from operations: |
||||||||||||
| Net investment income |
$ | 41,389 | $ | 30,192 | $ | 21,035 | ||||||
| Interest rate derivative periodic interest payments, net |
(433 | ) | (180 | ) | — | |||||||
| Net realized gain on investments |
2,604 | 353 | 979 | |||||||||
| Net change in unrealized appreciation on investments |
309 | (1,241 | ) | 2,121 | ||||||||
| Provision for taxes on unrealized appreciation on investments |
(1,960 | ) | (454 | ) | — | |||||||
| Net change in unrealized appreciation on interest rate derivative |
769 | (1,053 | ) | — | ||||||||
|
|
|
|
|
|
|
|||||||
| Net increase in net assets resulting from operations |
42,678 | 27,617 | 24,135 | |||||||||
| Distributions to stockholders |
||||||||||||
| Distributions to stockholders from net investment income |
(42,999 | ) | (28,493 | ) | (20,583 | ) | ||||||
| Distributions to stockholders from net realized gains |
(400 | ) | (918 | ) | — | |||||||
|
|
|
|
|
|
|
|||||||
| Total distributions to stockholders |
(43,399 | ) | (29,411 | ) | (20,583 | ) | ||||||
| Capital share transactions: |
||||||||||||
| Issuance of common stock |
110,966 | 85,879 | — | |||||||||
| Less offering costs |
(4,787 | ) | (4,218 | ) | — | |||||||
| Reinvestment of dividends |
— | — | 4,049 | |||||||||
|
|
|
|
|
|
|
|||||||
| Net increase in net assets from capital share transactions |
106,179 | 81,661 | 4,049 | |||||||||
|
|
|
|
|
|
|
|||||||
| Total increase in net assets |
105,458 | 79,867 | 7,601 | |||||||||
| Net assets at beginning of period |
347,484 | 267,617 | 260,016 | |||||||||
|
|
|
|
|
|
|
|||||||
| Net assets at end of period |
$ | 452,942 | $ | 347,484 | $ | 267,617 | ||||||
|
|
|
|
|
|
|
|||||||
| Common shares outstanding at end of period |
33,905 | 26,315 | 20,220 | |||||||||
|
|
|
|
|
|
|
|||||||
| Capital share activity: |
||||||||||||
| Shares sold |
7,590 | 6,095 | — | |||||||||
| Shares issued from reinvestment of dividends |
— | — | 304 | |||||||||
|
|
|
|
|
|
|
|||||||
| Net increase in capital activity |
7,590 | 6,095 | 304 | |||||||||
|
|
|
|
|
|
|
|||||||
See accompanying notes to these consolidated financial statements
99
Table of Contents
THL Credit, Inc. and Subsidiaries
Consolidated Statements of Cash Flows
(in thousands)
| For the years ended December 31, | ||||||||||||
| 2013 | 2012 | 2011 | ||||||||||
| Cash flows from operating activities |
||||||||||||
| Net increase in net assets resulting from operations |
$ | 42,678 | $ | 27,617 | $ | 24,135 | ||||||
| Adjustments to reconcile net increase in net assets resulting from operations to net cash used for operating activities: |
||||||||||||
| Net change in unrealized appreciation on investments |
(309 | ) | 1,241 | (2,121 | ) | |||||||
| Unrealized (appreciation) depreciation on interest rate derivative |
(769 | ) | 1,053 | — | ||||||||
| Purchases of investments |
(411,135 | ) | (298,493 | ) | (141,818 | ) | ||||||
| Proceeds from sale and paydown of investments |
168,824 | 177,671 | 34,892 | |||||||||
| Increase in investments due to PIK |
(3,250 | ) | (4,027 | ) | (2,550 | ) | ||||||
| Amortization of deferred financing costs |
1,470 | 968 | 687 | |||||||||
| Accretion of discounts on investments and other fees |
(4,397 | ) | (3,615 | ) | (2,124 | ) | ||||||
| Increase in interest receivable |
(4,631 | ) | (1,154 | ) | (808 | ) | ||||||
| Increase in escrow receivable |
(1,800 | ) | — | — | ||||||||
| (Increase) decrease in due from affiliate |
(605 | ) | 91 | (512 | ) | |||||||
| Increase in other deferred costs |
(825 | ) | — | — | ||||||||
| (Increase) decrease in prepaid expenses and other assets |
(307 | ) | 108 | (98 | ) | |||||||
| Increase in accrued expenses |
878 | 216 | 240 | |||||||||
| Increase in accrued credit facility fees and interest |
452 | 110 | 5 | |||||||||
| Increase in income taxes payable |
71 | — | — | |||||||||
| Increase in deferred tax liability |
1,960 | 454 | — | |||||||||
| Increase in base management fees payable |
729 | 501 | 34 | |||||||||
| (Decrease) increase in accrued administrator expenses |
(146 | ) | (34 | ) | 172 | |||||||
| Increase in incentive fees payable |
142 | 589 | 2,689 | |||||||||
| Increase in dividends payable |
— | 1,316 | — | |||||||||
| Increase (decrease) in due to affiliate |
474 | (21 | ) | 6 | ||||||||
|
|
|
|
|
|
|
|||||||
| Net cash used in operating activities |
(210,496 | ) | (95,409 | ) | (87,171 | ) | ||||||
| Cash flows from financing activities |
||||||||||||
| Borrowings under credit facility |
453,700 | 189,900 | 28,500 | |||||||||
| Repayments under credit facility |
(299,400 | ) | (144,900 | ) | (23,500 | ) | ||||||
| Issuance of shares of common stock |
110,966 | 85,879 | — | |||||||||
| Distributions paid to stockholders |
(44,715 | ) | (29,411 | ) | (19,522 | ) | ||||||
| Financing and offering costs paid |
(7,045 | ) | (6,813 | ) | (2,875 | ) | ||||||
|
|
|
|
|
|
|
|||||||
| Net cash provided by, (used for) financing activities |
213,506 | 94,655 | (17,397 | ) | ||||||||
|
|
|
|
|
|
|
|||||||
| Net increase (decrease) in cash and cash equivalents |
3,010 | (754 | ) | (104,568 | ) | |||||||
| Cash and cash equivalents, beginning of year |
4,819 | 5,573 | 110,141 | |||||||||
|
|
|
|
|
|
|
|||||||
| Cash and cash equivalents, end of year |
$ | 7,829 | $ | 4,819 | $ | 5,573 | ||||||
|
|
|
|
|
|
|
|||||||
| Supplemental Disclosure of Cash Flow Information: |
||||||||||||
| Cash interest paid |
$ | 3,770 | $ | 1,499 | $ | 21 | ||||||
| Income taxes paid |
$ | 646 | $ | 457 | $ | — | ||||||
Non-cash financing activities:
For the years ended December 31, 2013, 2012 and 2011, 0 shares, 2 shares and 304,093 shares, respectively, of common stock were issued in connection with dividend reinvestments of $0, $0 and $4,049, respectively.
See accompanying notes to these consolidated financial statements
100
Table of Contents
THL Credit, Inc. and Subsidiaries
Consolidated Schedule of Investments
December 31, 2013
(dollar amounts in thousands)
| Portfolio company/Type of |
Industry | Interest Rate(2) | Initial Acquisition Date |
Maturity/ Dissolution Date |
Principal(3) No. of Shares / No. of Units |
Amortized Cost |
Fair Value | |||||||||||||
| Non-controlled/non-affiliated investments —143.26% of net asset value |
||||||||||||||||||||
| 20-20 Technologies Inc. |
||||||||||||||||||||
| Senior Secured Term Loan(4) |
IT services | 13.6%(5) | 09/12/12 | 09/12/17 | $ | 13,650 | $ | 13,378 | $ | 13,582 | ||||||||||
|
|
|
|
|
|||||||||||||||||
| 13,378 | 13,582 | |||||||||||||||||||
| Adirondack Park CLO Ltd. |
||||||||||||||||||||
| Subordinated Notes, Residual Interest(4) |
Financial services |
13.7%(12) | 03/27/13 | 04/15/24 | — | $ | 9,171 | $ | 9,110 | |||||||||||
|
|
|
|
|
|||||||||||||||||
| 9,171 | 9,110 | |||||||||||||||||||
| AIM Media Texas Operating, LLC |
||||||||||||||||||||
| Member interest(7)(8) |
Media, entertainment and leisure |
06/21/12 | — | 0.763636 | $ | 764 | $ | 1,000 | ||||||||||||
|
|
|
|
|
|||||||||||||||||
| 764 | 1,000 | |||||||||||||||||||
| Airborne Tactical Advantage Company, LLC |
||||||||||||||||||||
| Senior Secured Note |
Aerospace & defense |
11.0% | 09/07/11 | 03/07/16 | $ | 4,000 | $ | 3,894 | $ | 3,970 | ||||||||||
| Class A Warrants(9) |
09/07/11 | — | 512 | 113 | 135 | |||||||||||||||
| Series A Preferred Stock(9) |
09/17/13 | — | 225 | 169 | 255 | |||||||||||||||
|
|
|
|
|
|||||||||||||||||
| 4,176 | 4,360 | |||||||||||||||||||
| Allen Edmonds Corporation |
||||||||||||||||||||
| Second Lien Term Loan |
Consumer products |
10% (LIBOR + 9.0%) |
11/26/13 | 05/27/19 | $ | 7,333 | $ | 7,189 | $ | 7,189 | ||||||||||
|
|
|
|
|
|||||||||||||||||
| 7,189 | 7,189 | |||||||||||||||||||
| Blue Coat Systems, Inc. |
||||||||||||||||||||
| Second Lien Term Loan |
IT services | 9.5% (LIBOR + 8.5%) |
06/27/13 | 06/27/20 | $ | 15,000 | $ | 14,860 | $ | 15,150 | ||||||||||
|
|
|
|
|
|||||||||||||||||
| 14,860 | 15,150 | |||||||||||||||||||
| C&K Market, Inc. |
||||||||||||||||||||
| Senior Subordinated Note |
Retail & grocery |
18.0%(18) | 11/3/2010 | 11/3/2015 | $ | 13,650 | $ | 13,303 | $ | 10,237 | ||||||||||
| Warrant for Class B |
11/3/2010 | — | 156,552 | 349 | — | |||||||||||||||
|
|
|
|
|
|||||||||||||||||
| 13,652 | 10,237 | |||||||||||||||||||
| Charming Charlie, LLC. |
||||||||||||||||||||
| Senior Secured Term Loan |
Retail & grocery |
9.0% (LIBOR + 8.0%) |
12/18/13 | 12/31/19 | $ | 27,000 | $ | 26,595 | $ | 26,595 | ||||||||||
|
|
|
|
|
|||||||||||||||||
| 26,595 | 26,595 | |||||||||||||||||||
| Connecture, Inc. |
||||||||||||||||||||
| Second Lien Term Loan |
Healthcare | 10.0% (LIBOR + 9.0%) |
03/18/13 | 07/15/18 | $ | 7,000 | $ | 6,875 | $ | 7,000 | ||||||||||
|
|
|
|
|
|||||||||||||||||
| 6,875 | 7,000 | |||||||||||||||||||
| Copperweld Bimetallics LLC |
||||||||||||||||||||
| Senior Secured Term Loan |
Industrials | 12.0% | 12/11/13 | 12/11/18 | $ | 21,725 | $ | 20,863 | $ | 20,863 | ||||||||||
|
|
|
|
|
|||||||||||||||||
| 20,863 | 20,863 | |||||||||||||||||||
| Country Pure Foods, LLC |
||||||||||||||||||||
| Subordinated Term Loan |
Food & beverage |
13.0% | 08/13/10 | 02/13/17 | $ | 16,181 | $ | 16,181 | $ | 16,060 | ||||||||||
|
|
|
|
|
|||||||||||||||||
| 16,181 | 16,060 | |||||||||||||||||||
| CRS Reprocessing, LLC |
||||||||||||||||||||
| Senior Secured Term Loan |
Manufacturing | 10.5% (LIBOR + 9.5%) |
06/16/11 | 06/16/15 | $ | 17,647 | $ | 17,588 | $ | 17,647 | ||||||||||
|
|
|
|
|
|||||||||||||||||
| 17,588 | 17,647 | |||||||||||||||||||
| Cydcor LLC |
||||||||||||||||||||
| Senior Secured Term Loan (20) |
Business services |
9.8% (LIBOR +7.3%) |
06/17/13 | 06/12/17 | $ | 13,442 | $ | 13,442 | $ | 13,442 | ||||||||||
|
|
|
|
|
|||||||||||||||||
| 13,442 | 13,442 | |||||||||||||||||||
(Continued on next page)
See accompanying notes to these consolidated financial statements
101
Table of Contents
THL Credit, Inc. and Subsidiaries
Consolidated Schedule of Investments—(Continued)
December 31, 2013
(dollar amounts in thousands)
| Portfolio company/Type of Investment (1) |
Industry | Interest Rate(2) | Initial Acquisition Date |
Maturity/ Dissolution Date |
Principal(3) No. of Shares / No. of Units |
Amortized Cost |
Fair Value | |||||||||||||
| Dr. Fresh, LLC |
||||||||||||||||||||
| Subordinated Term Loan |
Consumer products |
14.0%(6) (12.0% Cash and 2.0% PIK) |
05/15/12 | 11/15/17 | $ | 14,447 | $ | 14,223 | $ | 14,375 | ||||||||||
|
|
|
|
|
|||||||||||||||||
| 14,223 | 14,375 | |||||||||||||||||||
| Dryden CLO, Ltd. |
||||||||||||||||||||
| Subordinated Notes, Residual Interest(4) |
Financial services |
13.6%(12) | 09/12/13 | 11/15/25 | — | $ | 9,128 | $ | 9,300 | |||||||||||
|
|
|
|
|
|||||||||||||||||
| 9,128 | 9,300 | |||||||||||||||||||
| Duff & Phelps Corporation |
||||||||||||||||||||
| Tax Receivable Agreement Payment Rights(11) |
Financial services |
16.2%(12) |
06/01/12 | 12/31/29 | — | $ | 12,163 | $ | 13,844 | |||||||||||
| Senior Secured Term Loan(11) |
4.5% (LIBOR + 3.5%) |
05/15/13 | 04/23/20 | $ | 249 | 252 | 249 | |||||||||||||
|
|
|
|
|
|||||||||||||||||
| 12,415 | 14,093 | |||||||||||||||||||
| Embarcadero Technologies, Inc. |
||||||||||||||||||||
| Senior Secured Term Loan |
IT services | 10.7% (5) | 02/15/13 | 12/28/17 | $ | 9,817 | $ | 9,692 | $ | 9,743 | ||||||||||
|
|
|
|
|
|||||||||||||||||
| 9,692 | 9,743 | |||||||||||||||||||
| Expert Global Solutions, Inc. |
||||||||||||||||||||
| Second Lien Term Loan |
Business services |
12.5% (6) (LIBOR + 10.2% and 0.8% PIK) |
06/21/13 | 10/03/18 | $ | 18,727 | $ | 18,988 | $ | 18,821 | ||||||||||
|
|
|
|
|
|||||||||||||||||
| 18,988 | 18,821 | |||||||||||||||||||
| Express Courier International, Inc. |
||||||||||||||||||||
| Secured Subordinated Term Loan |
Business services |
15.0% (13) (PIK) | 01/17/12 | 07/17/16 | $ | 8,595 | $ | 7,652 | $ | 6,601 | ||||||||||
|
|
|
|
|
|||||||||||||||||
| 7,652 | 6,601 | |||||||||||||||||||
| Firebirds International, LLC |
||||||||||||||||||||
| Common stock(9) |
Restaurants | 05/17/11 | 1,906 | $ | 191 | $ | 257 | |||||||||||||
|
|
|
|
|
|||||||||||||||||
| 191 | 257 | |||||||||||||||||||
| Flagship VII, Ltd. |
||||||||||||||||||||
| Subordinated Notes, Residual Interest (4) |
Financial services |
13.9% (12) | 12/18/13 | 01/20/26 | — | $ | 4,400 | $ | 4,400 | |||||||||||
|
|
|
|
|
|||||||||||||||||
| 4,400 | 4,400 | |||||||||||||||||||
| Food Processing Holdings, LLC |
||||||||||||||||||||
| Senior Secured Term Loan (14) |
Food & beverage |
10.5% (LIBOR +9.5%) |
10/31/13 | 10/31/18 | $ | 22,202 | $ | 21,770 | $ | 21,770 | ||||||||||
| Senior Secured Delayed Draw Loan(10) |
10.5% (LIBOR +9.5%) |
10/31/13 | 10/31/18 | — | — | — | ||||||||||||||
| Class A Units(9) |
04/20/10 | 162.44 | 163 | 202 | ||||||||||||||||
| Class B Units(9) |
04/20/10 | 406.09 | 408 | 150 | ||||||||||||||||
|
|
|
|
|
|||||||||||||||||
| 22,341 | 22,122 | |||||||||||||||||||
| Freeport Financial SBIC Fund LP |
||||||||||||||||||||
| Member interest(16) |
Financial services |
06/14/13 | — | $ | 801 | $ | 801 | |||||||||||||
|
|
|
|
|
|||||||||||||||||
| 801 | 801 | |||||||||||||||||||
| Gold, Inc. |
||||||||||||||||||||
| Subordinated Term Loan |
Consumer products |
11.0% | 12/31/12 | 06/30/19 | $ | 16,788 | $ | 16,788 | $ | 16,788 | ||||||||||
|
|
|
|
|
|||||||||||||||||
| 16,788 | 16,788 | |||||||||||||||||||
| Gryphon Partners 3.5, L.P. |
||||||||||||||||||||
| Partnership interest (16) |
Financial services |
11/20/12 | 12/21/18 | — | $ | 199 | $ | 384 | ||||||||||||
|
|
|
|
|
|||||||||||||||||
| 199 | 384 | |||||||||||||||||||
(Continued on next page)
See accompanying notes to these consolidated financial statements
102
Table of Contents
THL Credit, Inc. and Subsidiaries
Consolidated Schedule of Investments—(Continued)
December 31, 2013
(dollar amounts in thousands)
| Portfolio company/Type of Investment (1) |
Industry | Interest Rate(2) | Initial Acquisition Date |
Maturity/ Dissolution Date |
Principal(3) No. of Shares / No. of Units |
Amortized Cost |
Fair Value | |||||||||||||
| Harrison Gypsum, LLC |
||||||||||||||||||||
| Senior Secured Term Loan |
Industrials | 10.5%(6) (LIBOR + 8.5% and 0.5% PIK) |
12/21/12 | 12/21/17 | $ | 24,369 | $ | 24,065 | $ | 24,247 | ||||||||||
|
|
|
|
|
|||||||||||||||||
| 24,065 | 24,247 | |||||||||||||||||||
| Hart InterCivic, Inc. |
||||||||||||||||||||
| Senior Secured Term Loan |
IT services | 11.5% (LIBOR + 9.0% and 1% PIK)(6) |
07/01/11 | 07/01/16 | $ | 8,696 | $ | 8,597 | $ | 8,522 | ||||||||||
| Senior Secured Revolving Loan(10) |
10.5% (LIBOR + 9.0%) |
07/01/11 | 07/01/16 | $ | 800 | 770 | 800 | |||||||||||||
|
|
|
|
|
|||||||||||||||||
| 9,367 | 9,322 | |||||||||||||||||||
| HEALTHCAREfirst, Inc. |
||||||||||||||||||||
| Senior Secured Term Loan |
Healthcare | 11.9%(5) | 08/31/12 | 08/30/17 | $ | 9,175 | $ | 8,958 | $ | 8,624 | ||||||||||
|
|
|
|
|
|||||||||||||||||
| 8,958 | 8,624 | |||||||||||||||||||
| Holland Intermediate Acquisition Corp. |
||||||||||||||||||||
| Senior Secured Term Loan |
Energy / Utilities |
10.0% (LIBOR + 9.0%) 10.0% (LIBOR + 9.0%) |
05/29/13 | 05/29/18 | $ | 24,227 | $ | 23,751 | $ | 24,227 | ||||||||||
| Senior Secured Revolving Loan(10) |
05/29/13 | 05/29/18 | — | — | — | |||||||||||||||
|
|
|
|
|
|||||||||||||||||
| 23,751 | 24,227 | |||||||||||||||||||
| Hostway Corporation |
||||||||||||||||||||
| Senior Secured Term Loan |
IT services | 6.0% (LIBOR + 4.8%) 10.0% (LIBOR + 8.8%) |
12/27/13 | 12/13/19 | $ | 10,000 | $ | 9,900 | $ | 9,900 | ||||||||||
| Second Lien Term Loan |
12/27/13 | 12/13/20 | $ | 12,000 | 11,760 | 11,760 | ||||||||||||||
| Class A Common Equity (9) |
12/27/13 | — | 20 | 200 | 200 | |||||||||||||||
| Class A Preferred Equity (9) |
12/27/13 | — | 2 | 1,800 | 1,800 | |||||||||||||||
|
|
|
|
|
|||||||||||||||||
| 23,660 | 23,660 | |||||||||||||||||||
| Ingenio Acquisition, LLC |
||||||||||||||||||||
| Senior Secured Term Loan |
Media, entertainment and leisure |
12.8% (6) (11.3% Cash and 1.5% PIK) |
05/09/13 | 05/09/18 | $ | 9,606 | $ | 9,433 | $ | 9,558 | ||||||||||
|
|
|
|
|
|||||||||||||||||
| 9,433 | 9,558 | |||||||||||||||||||
| Jefferson Management Holdings, LLC |
||||||||||||||||||||
| Member interest(7)(8) |
Healthcare | 04/20/10 | 1,393 | $ | 1,393 | $ | 938 | |||||||||||||
|
|
|
|
|
|||||||||||||||||
| 1,393 | 938 | |||||||||||||||||||
| Key Brand Entertainment, Inc. |
||||||||||||||||||||
| Senior Secured Term Loan |
Media, entertainment and leisure |
9.8% (LIBOR + 8.5%) 9.8% (LIBOR + 8.5%) |
08/08/13 | 08/08/18 | $ | 13,178 | $ | 12,931 | $ | 12,947 | ||||||||||
| Senior Secured Revolving Loan(10) |
08/08/13 | 08/08/18 | $ | 1,478 | 1,451 | 1,478 | ||||||||||||||
|
|
|
|
|
|||||||||||||||||
| 14,382 | 14,425 | |||||||||||||||||||
| LCP Capital Fund LLC |
||||||||||||||||||||
| Member interest(8)(15)(16) |
Financial services |
12.6%(12) | 04/20/10 | 02/15/15 | $ | 8,354 | $ | 8,354 | $ | 8,354 | ||||||||||
|
|
|
|
|
|||||||||||||||||
| 8,354 | 8,354 | |||||||||||||||||||
(Continued on next page)
See accompanying notes to these consolidated financial statements
103
Table of Contents
THL Credit, Inc. and Subsidiaries
Consolidated Schedule of Investments—(Continued)
December 31, 2013
(dollar amounts in thousands)
| Portfolio company/Type of Investment (1) |
Industry | Interest Rate(2) | Initial Acquisition Date |
Maturity/ Dissolution Date |
Principal(3) No. of Shares / No. of Units |
Amortized Cost |
Fair Value | |||||||||||||
| Loadmaster Derrick & Equipment, Inc. |
||||||||||||||||||||
| Senior Secured Term Loan |
Energy / Utilities |
9.3% (LIBOR + 8.3%) 9.3%
(LIBOR 9.3% (LIBOR |
09/28/12 | 09/28/17 | $ | 8,828 | $ | 8,642 | $ | 8,608 | ||||||||||
| Senior Secured Revolving Loan(10) |
09/28/12 | 09/28/17 | — | — | — | |||||||||||||||
| Senior Secured Delayed Draw Term Loans(10) |
09/28/12 | 09/28/17 | — | — | — | |||||||||||||||
|
|
|
|
|
|||||||||||||||||
| 8,642 | 8,608 | |||||||||||||||||||
| Martex Fiber Southern Corp. |
||||||||||||||||||||
| Subordinated Term Loan |
Industrials | 13.5%(6) (12.0% Cash and 1.5% PIK) |
04/30/12 | 10/31/19 | $ | 8,890 | $ | 8,778 | $ | 8,445 | ||||||||||
|
|
|
|
|
|||||||||||||||||
| 8,778 | 8,445 | |||||||||||||||||||
| NCM Group Holdings, LLC |
||||||||||||||||||||
| Senior Secured Term Loan |
Industrials | 12.5% (LIBOR + 11.5%) |
08/29/13 | 08/29/18 | $ | 26,727 | $ | 25,711 | $ | 26,193 | ||||||||||
|
|
|
|
|
|||||||||||||||||
| 25,711 | 26,193 | |||||||||||||||||||
| Oasis Legal Finance Holding Company LLC |
||||||||||||||||||||
| Second Lien Term Loan |
Financial services |
10.5% | 09/30/13 | 09/30/18 | $ | 13,943 | $ | 13,676 | $ | 13,676 | ||||||||||
|
|
|
|
|
|||||||||||||||||
| 13,676 | 13,676 | |||||||||||||||||||
| Octagon Income Note XIV, Ltd. |
||||||||||||||||||||
| Income Notes, Residual Interest(4) |
Financial services |
15.5%(12) | 12/19/12 | 01/15/24 | — | $ | 8,579 | $ | 8,656 | |||||||||||
|
|
|
|
|
|||||||||||||||||
| 8,579 | 8,656 | |||||||||||||||||||
| OEM Group, Inc. |
||||||||||||||||||||
| Senior Secured Note |
Manufacturing | 15.0%(6) (12.5% Cash and 2.5% PIK) |
10/07/10 | 10/07/15 | $ | 15,162 | $ | 14,974 | $ | 14,480 | ||||||||||
| Warrant for Common |
10/07/10 | — | — | — | — | |||||||||||||||
|
|
|
|
|
|||||||||||||||||
| 14,974 | 14,480 | |||||||||||||||||||
| SeaStar Solutions (f.k.a. Marine Acquisition Corp) |
||||||||||||||||||||
| Senior Subordinated Note |
Manufacturing | 13.5%(6) (11.5% Cash and 2.0% PIK) |
09/18/12 | 05/18/17 | $ | 16,500 | $ | 16,209 | $ | 16,830 | ||||||||||
|
|
|
|
|
|||||||||||||||||
| 16,209 | 16,830 | |||||||||||||||||||
| Sheplers, Inc. |
||||||||||||||||||||
| Senior Secured Second Lien Term Loan |
Retail & grocery |
13.2% (LIBOR + 11.7%) |
12/20/11 | 12/20/16 | $ | 11,426 | $ | 11,233 | $ | 11,426 | ||||||||||
| Subordinated Term Loan |
17.0%(17) (10.0% Cash and 7.0% PIK) |
12/20/11 | 12/20/17 | $ | 1,904 | 1,879 | 1,904 | |||||||||||||
|
|
|
|
|
|||||||||||||||||
| 13,112 | 13,330 | |||||||||||||||||||
| Sheridan Square CLO, Ltd |
||||||||||||||||||||
| Income Notes, Residual Interest(4) |
Financial services |
13.2% (12) | 03/12/13 | 04/15/25 | — | $ | 6,064 | $ | 6,152 | |||||||||||
|
|
|
|
|
|||||||||||||||||
| 6,064 | 6,152 | |||||||||||||||||||
(Continued on next page)
See accompanying notes to these consolidated financial statements
104
Table of Contents
THL Credit, Inc. and Subsidiaries
Consolidated Schedule of Investments—(Continued)
December 31, 2013
(dollar amounts in thousands)
| Portfolio company/Type of Investment (1) |
Industry | Interest Rate(2) | Initial Acquisition Date |
Maturity/ Dissolution Date |
Principal(3) No. of Shares / No. of Units |
Amortized Cost |
Fair Value | |||||||||||||
| Specialty Brands Holdings, LLC |
||||||||||||||||||||
| Second Lien Term Loan |
Restaurants | 11.3% (LIBOR + 9.8%) |
07/16/13 | 07/16/18 | $ | 20,977 | $ | 20,587 | $ | 20,587 | ||||||||||
|
|
|
|
|
|||||||||||||||||
| 20,587 | 20,587 | |||||||||||||||||||
| The Studer Group, L.L.C. |
||||||||||||||||||||
| Senior Subordinated Note |
Healthcare | 12.0% | 09/29/11 | 01/31/19 | $ | 16,910 | $ | 16,910 | $ | 16,910 | ||||||||||
|
|
|
|
|
|||||||||||||||||
| 16,910 | 16,910 | |||||||||||||||||||
| Surgery Center Holdings, Inc. |
||||||||||||||||||||
| Second Lien Term Loan |
Healthcare | 9.8% (LIBOR + 8.5%) |
04/19/13 | 04/11/20 | $ | 15,000 | $ | 14,652 | $ | 15,000 | ||||||||||
| Member interest(8)(9) |
04/20/10 | 469,673 | — | 2,000 | ||||||||||||||||
|
|
|
|
|
|||||||||||||||||
| 14,652 | 17,000 | |||||||||||||||||||
| Tri Starr Management Services, Inc. |
||||||||||||||||||||
| Senior Subordinated Note |
IT services | 15.8%(6) (12.5% Cash and 3.3% PIK) |
03/04/13 | 03/04/19 | $ | 18,307 | $ | 17,981 | $ | 17,941 | ||||||||||
|
|
|
|
|
|||||||||||||||||
| 17,981 | 17,941 | |||||||||||||||||||
| Trinity Services Group, Inc. |
||||||||||||||||||||
| Senior Subordinated Note |
Food & beverage |
14.5%(6) (12.0% Cash and 2.5% PIK) |
03/29/12 | 09/29/17 | $ | 14,411 | $ | 14,252 | $ | 14,122 | ||||||||||
|
|
|
|
|
|||||||||||||||||
| 14,252 | 14,122 | |||||||||||||||||||
| Vision Solutions, Inc. |
||||||||||||||||||||
| Second Lien Term Loan |
IT services | 9.5% (LIBOR + 8.0%) |
03/31/11 | 07/23/17 | $ | 11,625 | $ | 11,561 | $ | 11,625 | ||||||||||
|
|
|
|
|
|||||||||||||||||
| 11,561 | 11,625 | |||||||||||||||||||
| Washington Inventory Service |
||||||||||||||||||||
| Senior Secured Term Loan |
Business services |
10.3% (LIBOR + 9.0%) |
12/27/12 | 06/20/19 | $ | 11,000 | $ | 10,861 | $ | 11,165 | ||||||||||
|
|
|
|
|
|||||||||||||||||
| 10,861 | 11,165 | |||||||||||||||||||
| Wingspan Portfolio Holdings, Inc. |
||||||||||||||||||||
| Subordinated Term Loan |
Financial services |
15.5% (19) | 05/21/13 | 11/21/16 | $ | 18,768 | $ | 18,447 | $ | 15,765 | ||||||||||
|
|
|
|
|
|||||||||||||||||
| 18,447 | 15,765 | |||||||||||||||||||
| YP Equity Investors, LLC |
||||||||||||||||||||
| Member interest(7)(8) |
Media, entertainment and leisure |
05/08/12 | — | — | $ | — | $ | 4,100 | ||||||||||||
|
|
|
|
|
|||||||||||||||||
| — | 4,100 | |||||||||||||||||||
|
|
|
|
|
|||||||||||||||||
| Non-controlled/non- |
$ | 645,911 | $ | 648,860 | ||||||||||||||||
|
|
|
|
|
|||||||||||||||||
(Continued on next page)
See accompanying notes to these consolidated financial statements
105
Table of Contents
THL Credit, Inc. and Subsidiaries
Consolidated Schedule of Investments—(Continued)
December 31, 2013
(dollar amounts in thousands)
| Portfolio company/Type of Investment (1) |
Industry | Interest Rate(2) | Initial Acquisition Date |
Maturity/ Dissolution Date |
Principal(3) No. of Shares / No. of Units |
Amortized Cost |
Fair Value | |||||||||||||
| Non-controlled/affiliated investments —0.00% of net asset value |
||||||||||||||||||||
| THL Credit Greenway Fund LLC |
||||||||||||||||||||
| Member interest(8)(16) |
Financial services |
01/27/11 | 1/14/2021 | — | $ | 5 | $ | 5 | ||||||||||||
|
|
|
|
|
|||||||||||||||||
| 5 | 5 | |||||||||||||||||||
| THL Credit Greenway Fund II LLC |
||||||||||||||||||||
| Member interest(8)(16) |
Financial services |
03/01/13 | 10/10/2021 | — | $ | 2 | $ | 2 | ||||||||||||
|
|
|
|
|
|||||||||||||||||
| 2 | 2 | |||||||||||||||||||
|
|
|
|
|
|||||||||||||||||
| Total investments—143.26% of net asset value |
$ | 645,918 | $ | 648,867 | ||||||||||||||||
|
|
|
|
|
|||||||||||||||||
| Derivative Instruments |
||||||||||||||||||||
| Counterparty |
Instrument | Interest Rate | Expiration Date |
# of Contracts |
Notional | Cost | Fair Value |
|||||||||||||
| ING Capital Markets, LLC |
Interest Rate Swap – Pay Fixed/Receive |
1.1425%/LIBOR | 5/10/2017 | 1 | $ | 50,000 | $ | — | $ | (284 | ) | |||||||||
|
|
|
|
|
|||||||||||||||||
| Total derivative instruments— |
$ | — | $ | (284 | ) | |||||||||||||||
|
|
|
|
|
|||||||||||||||||
| (1) | All debt investments are income-producing. Equity and member interests are non-income-producing unless otherwise noted. |
| (2) | Variable interest rate investments bear interest in reference to LIBOR or ABR, which are effective as of December 31, 2013. These variable rates reset monthly or quarterly, subject to interest rate floors. |
| (3) | Principal includes accumulated PIK, or paid-in-kind, interest and is net of repayments. |
| (4) | Foreign company at the time of investment and, as a result, is not a qualifying asset under Section 55(a) of the Investment Company Act of 1940. |
| (5) | Unitranche investment; interest rate reflected represents the implied interest rate earned on the investment for the most recent quarter. |
| (6) | At the option of the issuer, interest can be paid in cash or cash and PIK. The percentage of PIK shown is the maximum PIK that can be elected by the company. |
| (7) | Interest held by a wholly owned subsidiary of THL Credit, Inc. |
| (8) | Member interests of limited liability companies are the equity equivalents of the stock of corporations. |
| (9) | Equity ownership may be held in shares or units of companies related to the portfolio company. |
| (10) | Issuer pays 0.50% unfunded commitment fee on revolving loan facility. |
| (11) | Publicly-traded company with a market capitalization in excess of $250 million at the time of investment and, as a result, is not a qualifying asset under Section 55(a) of the Investment Company Act of 1940. |
| (12) | Income-producing security with no stated coupon; interest rate reflects an estimation of the effective yield to expected maturity as of December 31, 2013. |
See accompanying notes to these consolidated financial statements
106
Table of Contents
THL Credit, Inc. and Subsidiaries
Consolidated Schedule of Investments—(Continued)
December 31, 2013
(dollar amounts in thousands)
| (13) | Loan was on non-accrual status as of December 31, 2013. Issuer’s contractual rate is 15.0% PIK until December 31, 2013 and then for each of the quarters ending March 31, 2014 and June 30, 2014, the lesser of excess cash flow for the quarter or 12% paid in cash with the remainder amount paid in PIK up to a total rate of 15%. |
| (14) | Debt investment interest held in companies related to the portfolio company. |
| (15) | The Company’s investment in LCP Capital Fund LLC is in the form of membership interests and its contributed capital is for the most recent quarter maintained in a collateral account held by a custodian and acts as collateral for certain credit default swaps for the Series 2005-1 equity interest. See Note 2 in the Notes to the Consolidated Financial Statements. |
| (16) | Non-registered investment company at the time of investment and, as a result, is not a qualifying asset under Section 55(a) of the Investment Company Act of 1940. |
| (17) | Issuer has the option to increase its aggregate interest rate to 18.5% all PIK for a period of time under certain conditions in the credit agreement. |
| (18) | C&K Market, Inc. filed for bankruptcy in November 2013. Loan was on non-accrual status as of December 31, 2013. Contractual default rate of interest is 18.0%. |
| (19) | Contractual default rate of interest is 15.5%. Certain interest payments have been deferred until April 15, 2014. |
| (20) | Of the $13,442 senior secured term loans outstanding, $11,981 is based in the United States and $1,461 is based in Canada. |
See accompanying notes to these consolidated financial statements
107
Table of Contents
THL Credit, Inc. and Subsidiaries
Consolidated Schedule of Investments
December 31, 2012
(dollar amounts in thousands)
| Portfolio company/Type
of |
Industry | Interest Rate(2) | Initial Acquisition Date |
Maturity/ Dissolution Date |
Principal(3) No. of Shares / No. of Units |
Cost | Fair Value |
|||||||||||||
| Non-controlled/non-affiliated investments—113.49% of net asset value |
||||||||||||||||||||
| 20-20 Technologies Inc. |
||||||||||||||||||||
| Senior Secured Term Loan(4) |
IT Services | 13.2%(5) (LIBOR + 11.0%) |
09/12/12 | 09/12/17 | $ | 14,000 | $ | 13,666 | $ | 13,666 | ||||||||||
|
|
|
|
|
|||||||||||||||||
| 13,666 | 13,666 | |||||||||||||||||||
| AIM Media Texas Operating, LLC |
||||||||||||||||||||
| Second Lien Loan |
Media, entertainment |
16.0% | 06/21/12 | 06/21/17 | $ | 9,976 | 9,743 | 9,775 | ||||||||||||
| Member interest(7)(8) |
06/21/12 | — | 0.763636 | 764 | 764 | |||||||||||||||
|
|
|
|
|
|||||||||||||||||
| 10,507 | 10,539 | |||||||||||||||||||
| Airborne Tactical Advantage Company, LLC |
||||||||||||||||||||
| Senior Secured Note |
Aerospace & defense |
11.0% | 09/07/11 | 03/07/16 | $ | 4,000 | 3,854 | 3,900 | ||||||||||||
| Class A Warrants(9) |
09/07/11 | — | 511,812 | 113 | 120 | |||||||||||||||
| Senior Secured Delayed Draw Term Loans(10) |
11.0% | 09/07/11 | 03/07/16 | — | — | — | ||||||||||||||
|
|
|
|
|
|||||||||||||||||
| 3,967 | 4,020 | |||||||||||||||||||
| C&K Market, Inc. |
||||||||||||||||||||
| Senior Subordinated Note |
Retail & grocery |
16.0% (14.0% Cash and 2.0% PIK) |
11/03/10 | 11/03/15 | $ | 13,582 | 13,176 | 13,480 | ||||||||||||
| Warrant for Class B |
11/03/10 | — | 156,552 | 349 | 350 | |||||||||||||||
|
|
|
|
|
|||||||||||||||||
| 13,525 | 13,830 | |||||||||||||||||||
| Country Pure Foods, LLC |
||||||||||||||||||||
| Subordinated Term Loan |
Food & beverage |
15% (12.5% Cash and 2.5% PIK) |
08/13/10 | 02/13/16 | $ | 16,079 | 15,871 | 15,758 | ||||||||||||
|
|
|
|
|
|||||||||||||||||
| 15,871 | 15,758 | |||||||||||||||||||
| CRS Reprocessing, LLC |
||||||||||||||||||||
| Senior Secured Term Loan |
Manufacturing | 10.3% (LIBOR + 9.3%) |
06/16/11 | 06/16/15 | $ | 8,438 | 8,327 | 8,375 | ||||||||||||
|
|
|
|
|
|||||||||||||||||
| 8,327 | 8,375 | |||||||||||||||||||
| Cydcor LLC |
||||||||||||||||||||
| Senior Secured Term Loan |
Business services |
12.3% (LIBOR +9.8%) |
09/18/12 | 09/17/16 | $ | 14,649 | 14,270 | 14,270 | ||||||||||||
|
|
|
|
|
|||||||||||||||||
| 14,270 | 14,270 | |||||||||||||||||||
| Dr. Fresh, LLC |
||||||||||||||||||||
| Subordinated Term Loan |
Consumer products |
14.0%(6) (12.0% Cash and 2.0% PIK) |
05/15/12 | 11/15/17 | $ | 14,158 | 13,893 | 13,946 | ||||||||||||
|
|
|
|
|
|||||||||||||||||
| 13,893 | 13,946 | |||||||||||||||||||
| Duff & Phelps Corporation |
||||||||||||||||||||
| Tax Receivable Agreement Payment Rights |
Financial services |
16.4%(12) | 06/01/12 | 12/31/29 | — | 12,262 | 12,262 | |||||||||||||
|
|
|
|
|
|||||||||||||||||
| 12,262 | 12,262 | |||||||||||||||||||
(Continued on next page)
See accompanying notes to these consolidated financial statements
108
Table of Contents
THL Credit, Inc. and Subsidiaries
Consolidated Schedule of Investments—(Continued)
December 31, 2012
(dollar amounts in thousands)
| Portfolio company/Type
of |
Industry | Interest Rate(2) | Initial Acquisition Date |
Maturity/ Dissolution Date |
Principal(3) No. of Shares / No. of Units |
Cost | Fair Value |
|||||||||||||||
| Express Courier International, Inc. |
||||||||||||||||||||||
| Secured Subordinated Term Loan |
Business services |
15.0% (13) (PIK) | 01/17/12 | 07/17/16 | $ | 7,479 | 7,358 | 6,357 | ||||||||||||||
|
|
|
|
|
|||||||||||||||||||
| 7,358 | 6,357 | |||||||||||||||||||||
| Firebirds International, LLC |
||||||||||||||||||||||
| Senior Secured Term Loan |
Restaurants | 10.5% | 05/17/11 | 05/17/16 | $ | 8,200 | 8,080 | 8,200 | ||||||||||||||
| Senior Secured Revolving Loan(14)(15) |
(LIBOR + 9.0) | 05/17/11 | 05/17/16 | — | (67) | — | ||||||||||||||||
| Common stock(9) |
10.5% (LIBOR + 9.0) |
05/17/11 | — | 1,906 | 191 | 215 | ||||||||||||||||
|
|
|
|
|
|||||||||||||||||||
| 8,204 | 8,415 | |||||||||||||||||||||
| Food Processing Holdings, LLC |
||||||||||||||||||||||
| Senior Subordinated Note (16) |
Food & beverage |
15.0%(6) (12.0% Cash and 3.0% PIK) |
02/28/12 | 08/28/17 | $ | 13,847 | 13,727 | 13,397 | ||||||||||||||
| Class A Units(9) |
04/20/10 | — | 162.44 | 163 | 181 | |||||||||||||||||
| Class B Units(9) |
04/20/10 | — | 406.09 | 408 | 150 | |||||||||||||||||
|
|
|
|
|
|||||||||||||||||||
| 14,298 | 13,728 | |||||||||||||||||||||
| Gold, Inc. |
||||||||||||||||||||||
| Subordinated Term Loan |
Consumer products |
15.0%(6) (13.0% Cash and 2.0% PIK) |
12/31/12 | 12/31/17 | $ | 36,800 | 36,064 | 36,064 | ||||||||||||||
|
|
|
|
|
|||||||||||||||||||
| 36,064 | 36,064 | |||||||||||||||||||||
| Gryphon Partners 3.5, L.P. |
||||||||||||||||||||||
| Partnership interest |
Financial services |
11/20/12 | 12/21/18 | — | 1,195 | 1,895 | ||||||||||||||||
|
|
|
|
|
|||||||||||||||||||
| 1,195 | 1,895 | |||||||||||||||||||||
| Harrison Gypsum, LLC |
||||||||||||||||||||||
| Senior Secured Term Loan |
Industrials | 10.5%(6) (LIBOR + 8.5% |
12/21/12 | 12/21/17 | $ | 25,380 | 25,001 | 25,001 | ||||||||||||||
|
|
|
|
|
|||||||||||||||||||
| 25,001 | 25,001 | |||||||||||||||||||||
| Hart InterCivic, Inc. |
||||||||||||||||||||||
| Senior Secured Term Loan |
IT Services | 10.5% (LIBOR + 9.0%) |
07/01/11 | 07/01/16 | $ | 9,595 | 9,450 | 9,499 | ||||||||||||||
| Senior Secured Revolving Loan(10)(15) |
10.5% (LIBOR + 9.0%) |
07/01/11 | 07/01/16 | $ | — | (42) | — | |||||||||||||||
|
|
|
|
|
|||||||||||||||||||
| 9,408 | 9,499 | |||||||||||||||||||||
| HEALTHCAREfirst, Inc. |
||||||||||||||||||||||
| Senior Secured Term Loan |
Healthcare | 11.5%(5) (LIBOR + 10.0%) |
08/31/12 | 08/30/17 | $ | 9,875 | 9,594 | 9,594 | ||||||||||||||
|
|
|
|
|
|||||||||||||||||||
| 9,594 | 9,594 | |||||||||||||||||||||
| IMDS Corporation |
||||||||||||||||||||||
| Subordinated Term Loan |
Healthcare | 15.5%(6) (12.5% Cash and 3.0% PIK) |
05/02/12 | 11/02/17 | $ | 13,266 | 12,967 | 12,404 | ||||||||||||||
|
|
|
|
|
|||||||||||||||||||
| 12,967 | 12,404 | |||||||||||||||||||||
(Continued on next page)
See accompanying notes to these consolidated financial statements
109
Table of Contents
THL Credit, Inc. and Subsidiaries
Consolidated Schedule of Investments—(Continued)
December 31, 2012
(dollar amounts in thousands)
| Portfolio company/Type
of |
Industry | Interest Rate(2) | Initial Acquisition Date |
Maturity/ Dissolution Date |
Principal(3) No. of Shares / No. of Units |
Cost | Fair Value |
|||||||||||||
| Jefferson Management Holdings, LLC |
||||||||||||||||||||
| Member interest(7)(8) |
Healthcare | N/A | 04/20/10 | — | 1,393 | 1,393 | 1,388 | |||||||||||||
|
|
|
|
|
|||||||||||||||||
| 1,393 | 1,388 | |||||||||||||||||||
| LCP Capital Fund LLC |
||||||||||||||||||||
| Member interest(8)(17)(18) |
Financial services |
16.2%(19) | 04/20/10 | 02/15/15 | $ | 8,354 | 8,354 | 8,354 | ||||||||||||
|
|
|
|
|
|||||||||||||||||
| 8,354 | 8,354 | |||||||||||||||||||
| Loadmaster Derrick & Equipment, Inc. |
||||||||||||||||||||
| Senior Secured Term Loan |
Energy / Utilities |
9.3% (LIBOR +8.3%) |
09/28/12 | 09/28/17 | $ | 9,709 | 9,462 | 9,462 | ||||||||||||
| Senior Secured Revolving Loan(10) |
9.3% (LIBOR +8.3%) |
09/28/12 | 09/28/17 | $ | 290 | 290 | 290 | |||||||||||||
| Senior Secured Delayed Draw Term Loans |
9.3% (LIBOR +8.3%) |
09/28/12 | 09/28/17 | $ | — | — | — | |||||||||||||
|
|
|
|
|
|||||||||||||||||
| 9,752 | 9,752 | |||||||||||||||||||
| Marine Acquisition Corp . (Teleflex Marine) |
||||||||||||||||||||
| Senior Subordinated Note |
Manufacturing | 13.5%(6) | 09/18/12 | 05/18/17 | $ | 16,500 | 16,146 | 16,170 | ||||||||||||
|
|
|
|
|
|||||||||||||||||
| 16,146 | 16,170 | |||||||||||||||||||
| Martex Fiber Southern Corp . |
||||||||||||||||||||
| Subordinated Term Loan |
Industrials | 13.5%(6) (12.0% Cash and 1.5% PIK) |
04/30/12 | 10/31/19 | $ | 8,756 | 8,632 | 8,580 | ||||||||||||
|
|
|
|
|
|||||||||||||||||
| 8,632 | 8,580 | |||||||||||||||||||
| Octagon Income Note XIV, Ltd. |
||||||||||||||||||||
| Income Notes, Residual Interest(4) |
Financial services |
15.5%(20) | 12/19/12 | 01/15/24 | $ | 10,000 | 9,400 | 9,400 | ||||||||||||
|
|
|
|
|
|||||||||||||||||
| 9,400 | 9,400 | |||||||||||||||||||
| OEM Group, Inc. |
||||||||||||||||||||
| Senior Secured Note |
Manufacturing | 15.0%(6) (12.5% Cash and 2.5% PIK) |
10/07/10 | 10/07/15 | $ | 14,784 | 14,510 | 13,601 | ||||||||||||
| Warrant for Common |
— | — | — | — | — | |||||||||||||||
|
|
|
|
|
|||||||||||||||||
| 14,510 | 13,601 | |||||||||||||||||||
| Pinnacle Operating Corporation |
||||||||||||||||||||
| Senior Secured Term Loan |
Industrials | 11.5% (LIBOR + 10.3%) |
11/26/12 | 05/15/19 | $ | 10,000 | 9,508 | 9,508 | ||||||||||||
|
|
|
|
|
|||||||||||||||||
| 9,508 | 9,508 | |||||||||||||||||||
| Sheplers, Inc. |
||||||||||||||||||||
| Second Lien Term Loan(7) |
Retail & grocery |
13.2% (LIBOR + 11.7%) |
12/20/11 | 12/20/16 | $ | 11,426 | 11,182 | 11,369 | ||||||||||||
| Mezzanine Loan(7) |
17.0%(21) (10.0% Cash and 7.0% PIK) |
12/20/11 | 12/20/17 | $ | 1,776 | 1,747 | 1,768 | |||||||||||||
|
|
|
|
|
|||||||||||||||||
| 12,929 | 13,137 | |||||||||||||||||||
(Continued on next page)
See accompanying notes to these consolidated financial statements
110
Table of Contents
THL Credit, Inc. and Subsidiaries
Consolidated Schedule of Investments—(Continued)
December 31, 2012
(dollar amounts in thousands)
| Portfolio company/Type
of |
Industry | Interest Rate(2) | Initial Acquisition Date |
Maturity/ Dissolution Date |
Principal(3) No. of Shares / No. of Units |
Cost | Fair Value |
|||||||||||||
| The Studer Group, L.L.C. |
||||||||||||||||||||
| Senior Subordinated Note |
Healthcare | 14.0% (12.0% Cash and 2.0% PIK) |
09/29/11 | 03/29/17 | $ | 12,454 | 12,251 | 12,361 | ||||||||||||
|
|
|
|
|
|||||||||||||||||
| 12,251 | 12,361 | |||||||||||||||||||
| Surgery Center Holdings, Inc. |
||||||||||||||||||||
| Senior Subordinated Note |
Healthcare | 15.0% | 04/20/10 | 08/04/17 | $ | 18,773 | 18,405 | 18,960 | ||||||||||||
| Member interest(8)(9) |
— | — | 469,673 | 470 | 1,850 | |||||||||||||||
|
|
|
|
|
|||||||||||||||||
| 18,875 | 20,810 | |||||||||||||||||||
| Trinity Services Group, Inc. |
||||||||||||||||||||
| Senior Subordinated Note |
Food & beverage |
13.5%(6) (12.0% Cash and 1.5% PIK) |
03/29/12 | 09/29/17 | $ | 14,143 | 13,954 | 14,073 | ||||||||||||
|
|
|
|
|
|||||||||||||||||
| 13,954 | 14,073 | |||||||||||||||||||
| Vision Solutions, Inc. |
||||||||||||||||||||
| Second Lien Term Loan |
IT Services | 9.5% (LIBOR + 8.0%) |
03/31/11 | 07/23/17 | $ | 11,625 | 11,547 | 11,625 | ||||||||||||
|
|
|
|
|
|||||||||||||||||
| 11,547 | 11,625 | |||||||||||||||||||
| Washington Inventory Service |
||||||||||||||||||||
| Senior Secured Term Loan |
Business services |
10.3% (LIBOR + 9.0%) |
12/27/12 | 06/20/19 | $ | 11,000 | 10,835 | 10,835 | ||||||||||||
|
|
|
|
|
|||||||||||||||||
| 10,835 | 10,835 | |||||||||||||||||||
| YP Equity Investors, LLC |
||||||||||||||||||||
| Senior Secured Term Loan |
Media, entertainment and leisure |
15.0% (12.0% Cash and 3.0% PIK) |
05/08/12 | 05/08/17 | $ | 3,322 | 3,236 | 3,322 | ||||||||||||
| Member interest(7)(8) |
05/08/12 | 05/08/17 | — | — | 1,800 | |||||||||||||||
|
|
|
|
|
|||||||||||||||||
| 3,236 | 5,122 | |||||||||||||||||||
|
|
|
|
|
|||||||||||||||||
| Non-controlled/non-affiliated investments—113.49% of net asset value |
$ | 391,699 | $ | 394,339 | ||||||||||||||||
|
|
|
|
|
|||||||||||||||||
| Non-controlled/affiliated investments—0.00% of net asset value |
||||||||||||||||||||
| THL Credit Greenway Fund LLC |
||||||||||||||||||||
| Member interest |
Financial services |
01/27/11 | 1/14/2021 | — | 10 | 10 | ||||||||||||||
|
|
|
|
|
|||||||||||||||||
| 10 | 10 | |||||||||||||||||||
|
|
|
|
|
|||||||||||||||||
| Total investments—113.49% of net asset value |
$ | 391,709 | $ | 394,349 | ||||||||||||||||
|
|
|
|
|
|||||||||||||||||
(Continued on next page)
See accompanying notes to these consolidated financial statements
111
Table of Contents
THL Credit, Inc. and Subsidiaries
Consolidated Schedule of Investments—(Continued)
December 31, 2012
(dollar amounts in thousands)
| Derivative Instruments |
||||||||||||||||||||
| Counterparty |
Instrument | Interest Rate | Expiration Date |
# of Contracts |
Notional | Cost | Fair Value |
|||||||||||||
| ING Capital Markets, LLC |
Interest Rate Swap – Pay Fixed/ Receive Floating |
1.1425%/LIBOR | 5/10/2017 | 1 | $ | 50,000 | $ | — | $ | (1,053) | ||||||||||
|
|
|
|
|
|||||||||||||||||
| Total derivative instruments—(0.30)% of net asset value |
$ | — | $ | (1,053) | ||||||||||||||||
|
|
|
|
|
|||||||||||||||||
| (1) | All debt investments are income-producing. Equity and member interests are non-income-producing unless otherwise noted. |
| (2) | Variable interest rate investments bear interest in reference to LIBOR or ABR, which reset monthly or quarterly, subject to interest rate floors. Unless otherwise noted, for each debt investment we have provided the interest rate in effect as of December 31, 2012. |
| (3) | Principal includes accumulated PIK, or paid-in-kind, interest and is net of repayments. |
| (4) | Foreign company at the time of investment and, as a result, is not a qualifying asset under Section 55(a) of the Investment Company Act of 1940. |
| (5) | Unitranche investment; yield reflected represents the effective yield earned on the investment. |
| (6) | At the option of the issuer, interest can be paid in cash or cash and PIK. The percentage of PIK shown is the maximum PIK that can be elected by the company. |
| (7) | Interest held by a wholly owned subsidiary of THL Credit, Inc. |
| (8) | Member interests of limited liability companies are the equity equivalents of the stock of corporations. |
| (9) | Equity ownership may be held in shares or units of companies related to the portfolio company. |
| (10) | Issuer pays 0.5% unfunded commitment fee on facility. |
| (11) | Publicly-traded company with a market capitalization in excess of $250 million at the time of investment and, as a result, is not a qualifying asset under Section 55(a) of the Investment Company Act of 1940. |
| (12) | Income-producing security with no stated coupon; yield from initial investment through December 31, 2012 was approximately 16.4%. |
| (13) | Issuer will pay 15% PIK until April 1, 2013, 13.0% cash interest thereafter. |
| (14) | Issuer pays 0.25% unfunded commitment fee on revolving loan quarterly. |
| (15) | The negative cost is the result of the capitalized discount being greater than the principal amount outstanding on the loan. |
| (16) | Interest held in companies related to the portfolio company. |
| (17) | The Company’s investment in LCP Capital Fund LLC is in the form of membership interests and its contributed capital is maintained in a collateral account held by a custodian and acts as collateral for certain credit default swaps for the Series 2005-1 equity interest. See Note 2 in the Notes to the Consolidated Financial Statements. |
| (18) | Non-registered investment company at the time of investment and, as a result, is not a qualifying asset under Section 55(a) of the Investment Company Act of 1940. |
| (19) | Income producing security with no stated coupon; cash yield for the three months ended December 31, 2012 was approximately 16.2%. |
| (20) | Income producing security with no stated coupon; cash yield for the three months ended December 31, 2012 was approximately 15.5%. |
| (21) | Issuer has the option to increase its aggregate interest rate to 18.5% all PIK for a period of time under certain conditions in the credit agreement. |
See accompanying notes to these consolidated financial statements
112
Table of Contents
THL Credit, Inc. and Subsidiaries
Notes to Consolidated Financial Statements
December 31, 2013
(in thousands, except per share data)
1. Organization
THL Credit, Inc., or the Company, was organized as a Delaware corporation on May 26, 2009. The Company has elected to be regulated as a business development company, or BDC, under the Investment Company Act of 1940, as amended, or 1940 Act. The Company has elected to be treated for tax purposes as a regulated investment company, or RIC, under the Internal Revenue Code of 1986, or the Code, as amended. In 2009, the Company was treated for tax purposes as a corporation. The Company’s investment objective is to generate both current income and capital appreciation, primarily through privately negotiated investments in debt and equity securities of middle market companies.
On April 20, 2010, in anticipation of completing an initial public offering and formally commencing principal operations, the Company entered into a purchase and sale agreement with THL Credit Opportunities, L.P. and THL Credit Partners BDC Holdings, L.P., or BDC Holdings, an affiliate of the Company, to effectuate the sale by THL Credit Opportunities, L.P. to the Company of certain securities valued at $62,107, as determined by the Company’s board of directors, and on the same day issued 4,140 shares of common stock to BDC Holdings valued at $15.00 per share, pursuant to such agreement, in exchange for the aforementioned securities. Subsequently, the Company filed an election to be regulated as a BDC.
On April 21, 2010, the Company completed its initial public offering, formally commencing principal operations, and sold 9,000 shares of its common stock through a group of underwriters at a price of $13.00 per share, less an underwriting discount and commissions totaling $0.8125 per share. Concurrently, the Company sold 6,308 shares of its common stock to BDC Holdings at $13.00 per share, the sale of which was not subject to an underwriting discount and commission. On April 27, 2010, the Company closed the sale of the aforementioned 15,308 shares and received $190,684 of net proceeds, which includes an underwriting discount and offering expenses.
On May 26, 2010, the underwriters exercised their over-allotment option under the underwriting agreement and elected to purchase an additional 337 shares of common stock at $13.00 per share resulting in additional net proceeds of $3,892, which includes an underwriting discount and offering expenses.
On September 25, 2012, the Company closed a public equity offering selling 6,095 shares of its common stock through a group of underwriters at a price of $14.09 per share, less an underwriting discount and offering expenses, and received $81,657 in net proceeds.
On June 24, 2013, the Company closed a public equity offering selling 7,590 shares of its common stock through a group of underwriters at a price of $14.62 per share, less an underwriting discount and offering expenses, and received $106,179 in net proceeds.
The Company has established wholly owned subsidiaries, THL Credit AIM Media Holdings Inc., THL Credit Holdings, Inc. and THL Credit YP Holdings Inc, which are structured as Delaware entities, or tax blockers, to hold equity or equity-like investments in portfolio companies organized as limited liability companies, or LLCs (or other forms of pass-through entities). Tax blockers are not consolidated for income tax purposes and may incur income tax expense as a result of their ownership of portfolio companies.
The Company has a wholly owned subsidiary, THL Corporate Finance, Inc. and THL Corporate Finance, LLC, its wholly owned subsidiary, serves as the administrative agent on certain investment transactions.
THL Credit SBIC, LP, or SBIC LP, and its general partner, THL Credit SBIC GP, LLC, or SBIC GP, were organized in Delaware on August 25, 2011 as a limited partnership and limited liability company, respectively. On January 16, 2013, the Company withdrew its application with the Investment Division of
113
Table of Contents
the U.S. Small Business Administration, or SBA, to license a small business investment company, or SBIC. Both the SBIC LP and SBIC GP remain consolidated wholly owned subsidiaries of the Company.
2. Significant Accounting Policies
Basis of Presentation
The consolidated financial statements include the accounts of the Company and its subsidiaries. All inter-company accounts and transactions have been eliminated in consolidation. In accordance with Article 6 of Regulation S-X under the Securities Act of 1933, as amended, and the Securities and Exchange Act of 1934, as amended, the Company generally will not consolidate its interest in any company other than in investment company subsidiaries and controlled operating companies substantially all of whose business consists of providing services to the Company.
The accompanying consolidated financial statements of the Company have been presented in accordance with accounting principles generally accepted in the United States of America (“GAAP”) and pursuant to the requirements for reporting on Form 10-K and Regulation S-X. The financial results of our portfolio companies are not consolidated in the financial statements. The accounting records of the Company are maintained in U.S. dollars.
Use of Estimates
The preparation of financial statements in conformity with GAAP requires management to make estimates and assumptions that may affect the reported amounts and disclosures in the financial statements. Changes in the economic environment, financial markets, credit worthiness of our portfolio companies and any other parameters used in determining these estimates could cause actual results to differ and these differences could be material.
Cash
Cash consists of funds held in demand deposit accounts at several financial institutions and, at certain times, balances may exceed the Federal Deposit Insurance Corporation insured limit and is therefore subject to credit risk. There were no cash equivalents as of December 31, 2013 and December 31, 2012.
Deferred Financing Costs
Deferred financing costs consist of fees and expenses paid in connection with the closing of credit facilities and are capitalized at the time of payment. Deferred financing costs are amortized using the straight line method over the term of the credit facilities.
Deferred Offering Costs
Deferred offering costs consist of fees and expenses incurred in connection with the offer and sale of the Company’s common stock, including legal, accounting, printing fees and other related expenses, as well as costs incurred in connection with the filing of a shelf registration statement. These costs are capitalized when incurred and recognized as a reduction of offering proceeds when the offering becomes effective.
Escrow Receivable
Escrow receivable represents the Company’s claims to amounts set aside for indemnification claims or purchase price adjustments from the sale of certain investments. Escrow receivable is presented at net realizable value on the Consolidated Statements of Assets and Liabilities. There is a risk that some or all of the escrow amounts might not be ultimately collected by the Company. A current claim against the escrow in excess of the company’s reserve against the receivable will be arbitrated.
114
Table of Contents
Interest Rate Derivative
The Company recognizes derivatives as either interest rate derivative assets or liabilities at fair value on its Consolidated Statements of Assets and Liabilities with valuation changes and interest rate payments recorded as net change in unrealized appreciation (depreciation) on interest rate derivative and interest rate derivative periodic interest payments, net, respectively, on the Consolidated Statements of Operations. See also the disclosure in Note 7, Interest Rate Derivative.
Partial Loan Sales
The Company follows the guidance in ASC Topic 860 when accounting for loan participations and other partial loan sales. Such guidance requires a participation or other partial loan sale to meet the definition of a “participating interest”, as defined in the guidance, in order for sale treatment to be allowed. Participations or other partial loan sales which do not meet the definition of a participating interest remain on the Company’s consolidated statements of asset and liabilities and the proceeds are recorded as a secured borrowing until the definition is met.
Fair Value of Financial Instruments
The carrying amounts of the Company’s financial instruments, including cash, accounts payable and accrued expenses, approximate fair value due to their short-term nature. The carrying amounts and fair values of the Company’s long-term obligations are disclosed in Note 6, Credit Facility.
Valuation of Investments
Investments, for which market quotations are readily available, are valued using market quotations, which are generally obtained from an independent pricing service or broker-dealers or market makers. Debt and equity securities, for which market quotations are not readily available or are not considered to be the best estimate of fair value, are valued at fair value as determined in good faith by the Company’s board of directors. Because the Company expects that there will not be a readily available market value for many of the investments in the Company’s portfolio, it is expected that many of the Company’s portfolio investments’ values will be determined in good faith by the Company’s board of directors in accordance with a documented valuation policy that has been reviewed and approved by our board of directors in accordance with GAAP. Due to the inherent uncertainty of determining the fair value of investments that do not have a readily available market value, the fair value of our investments may differ significantly from the values that would have been used had a readily available market value existed for such investments, and the differences could be material.
With respect to investments for which market quotations are not readily available, the Company’s board of directors undertakes a multi-step valuation process each quarter, as described below:
| • | the Company’s quarterly valuation process begins with each portfolio company or investment being initially valued by the investment professionals responsible for the portfolio investment; |
| • | preliminary valuation conclusions are then documented and discussed with senior management of the Advisor; |
| • | to the extent determined by the audit committee of the Company’s board of directors, independent valuation firms engaged by the Company conduct independent appraisals and review the Advisor’s preliminary valuations in light of their own independent assessment; |
| • | the audit committee of the Company’s board of directors reviews the preliminary valuations of the Advisor and independent valuation firms and, if necessary, responds and supplements the valuation recommendation of the independent valuation firm to reflect any comments; and |
115
Table of Contents
| • | the Company’s board of directors discusses valuations and determines the fair value of each investment in the Company’s portfolio in good faith based on the input of the Advisor and the respective independent valuation firms. |
The types of factors that the Company may take into account in fair value pricing our investments include, as relevant, the nature and realizable value of any collateral, the portfolio company’s ability to make payments and its earnings and discounted cash flows, the markets in which the portfolio company does business, comparison to publicly traded securities and other relevant factors. The Company utilizes an income approach to value its debt investments and a combination of income and market approaches to value its equity investments. With respect to unquoted securities, the Advisor and the Company’s board of directors, in consultation with the Company’s independent third party valuation firm, values each investment considering, among other measures, discounted cash flow models, comparisons of financial ratios of peer companies that are public and other factors, which valuation is then approved by the board of directors. For debt investments, the Company determines the fair value primarily using an income, or yield, approach that analyzes the discounted cash flows of interest and principal for the debt security, as set forth in the associated loan agreements, as well as the financial position and credit risk of each portfolio investments. The Company’s estimate of the expected repayment date is generally the legal maturity date of the instrument. The yield analysis considers changes in leverage levels, credit quality, portfolio company performance and other factors.
The Company values its interest rate derivative agreement using an income approach that analyzes the discounted cash flows associated with the interest rate derivative agreement. Significant inputs to the discounted cash flows methodology include the forward interest rate yield curves in effect as of the end of the measurement period and an evaluation of the counterparty’s credit risk.
The Company values its residual interest investments in collateralized loan obligations using an income approach that analyzes the discounted cash flows of our residual interest. The discounted cash flows model utilizes prepayment, re-investment and loss assumptions based on historical experience and projected performance, economic factors, the characteristics of the underlying cash flow, and comparable yields for similar collateralized loan obligation fund subordinated notes or equity, when available. Specifically, the Company uses Intex cash flow models, or an appropriate substitute to form the basis for the valuation of the Company’s residual interest. The models use a set of assumptions including projected default rates, recovery rates, reinvestment rates and prepayment rates in order to arrive at estimated cash flows. The assumptions are based on available market data and projections provided by third parties as well as management estimates.
The Company values its investment in payment rights using an income approach that analyzes the discounted projected future cash flow streams assuming an appropriate discount rate, which will among other things consider other transactions in the market, the current credit environment, performance of the underlying portfolio company and the length of the remaining payment stream.
The market approach uses prices and other relevant information generated by market transactions involving identical or comparable assets or liabilities (including a business). The income approach uses valuation techniques to convert future cash flows or earnings to a single present amount (discounted). The measurement is based on the value indicated by current market expectations about those future amounts. In following these approaches, the types of factors that the Company may take into account in fair value pricing the Company’s investments include, as relevant: available current market data, including relevant and applicable market trading and transaction comparables, applicable market yields and multiples, the current investment performance rating, security covenants, call protection provisions, information rights, the nature and realizable value of any collateral, the portfolio company’s ability to make payments, its earnings and discounted cash flows, the markets in which the portfolio company does business, comparisons of financial ratios of peer companies that are public, transaction comparables, our principal market as the reporting entity and enterprise values, among other factors.
116
Table of Contents
In accordance with the authoritative guidance on fair value measurements and disclosures under GAAP, the Company discloses the fair value of its investments in a hierarchy that prioritizes the inputs to valuation techniques used to measure fair value. The hierarchy gives the highest priority to unadjusted quoted prices in active markets for identical assets or liabilities (Level 1 measurements) and the lowest priority to unobservable inputs (Level 3 measurements). The guidance establishes three levels of the fair value hierarchy as follows:
Level 1—Unadjusted quoted prices in active markets that are accessible at the measurement date for identical, unrestricted assets or liabilities;
Level 2—Quoted prices in markets that are not considered to be active or financial instruments for which significant inputs are observable, either directly or indirectly;
Level 3—Prices or valuations that require inputs that are both significant to the fair value measurement and unobservable.
The level of an asset or liability within the fair value hierarchy is based on the lowest level of any input that is significant to the fair value measurement. However, the determination of what constitutes “observable” requires significant judgment by management.
The Company considers whether the volume and level of activity for the asset or liability have significantly decreased and identifies transactions that are not orderly in determining fair value. Accordingly, if the Company determines that either the volume and/or level of activity for an asset or liability has significantly decreased (from normal conditions for that asset or liability) or price quotations or observable inputs are not associated with orderly transactions, increased analysis and management judgment will be required to estimate fair value. Valuation techniques such as an income approach might be appropriate to supplement or replace a market approach in those circumstances.
The Company has adopted the authoritative guidance under GAAP for estimating the fair value of investments in investment companies that have calculated net asset value per share in accordance with the specialized accounting guidance for Investment Companies. Accordingly, in circumstances in which net asset value per share of an investment is determinative of fair value, the Company estimates the fair value of an investment in an investment company using the net asset value per share of the investment (or its equivalent) without further adjustment, if the net asset value per share of the investment is determined in accordance with the specialized accounting guidance for investment companies as of the reporting entity’s measurement date.
Investment Risk
The value of investments will generally fluctuate with, among other things, changes in prevailing interest rates, federal tax rates, counterparty risk, general economic conditions, the condition of certain financial markets, developments or trends in any particular industry and the financial condition of the issuer. During periods of limited liquidity and higher price volatility, the Company’s ability to dispose of investments at a price and time that the Company deems advantageous may be impaired. The extent of this exposure is reflected in the carrying value of these financial assets and recorded in the Consolidated Statements of Assets and Liabilities.
Lower-quality debt securities involve greater risk of default or price changes due to changes in the credit quality of the issuer. The value of lower-quality debt securities often fluctuates in response to company, political, or economic developments and can decline significantly over short periods of time or during periods of general or regional economic difficulty. Lower-quality debt securities can be thinly traded or have restrictions on resale, making them difficult to sell at an acceptable price. The default rate for lower-quality debt securities is likely to be higher during economic recessions or periods of high interest rates.
As of December 31, 2013, the Company had two loans on non-accrual with an amortized cost basis of $20,954 and fair value of $16,838. As of December 31, 2012, the Company had no loans on non-accrual.
117
Table of Contents
Security Transactions, Payment-in-Kind, Income Recognition, Realized/Unrealized Gains or Losses
Security transactions are recorded on a trade-date basis. The Company measures realized gains or losses by the difference between the net proceeds from the repayment or sale and the amortized cost basis of the investment, using the specific identification method. The Company reports changes in fair value of investments that are measured at fair value as a component of net change in unrealized appreciation on investments in the Consolidated Statements of Operations. The Company reports changes in fair value of the interest rate derivative that is measured at fair value as a component of net change in unrealized appreciation or depreciation on interest rate derivative in the Consolidated Statements of Operations.
Interest income, adjusted for amortization of premium and accretion of discount, is recorded on an accrual basis to the extent that the Company expects to collect such amounts. Dividend income is recognized on the ex-dividend date. Original issue discount, principally representing the estimated fair value of detachable equity or warrants obtained in conjunction with the acquisition of debt securities, and market discount or premium are capitalized and accreted or amortized into interest income over the life of the respective security using the effective yield method. The amortized cost of investments represents the original cost adjusted for the accretion/amortization of discounts and premiums and upfront loan origination fees.
Loans are placed on non-accrual status when principal or interest payments are past due 30 days or more and/or when it is no longer probable that principal or interest will be collected. However, the Company may make exceptions to this policy if the loan has sufficient collateral value and is in the process of collection.
The Company has investments in its portfolio which contain a contractual paid-in-kind, or PIK, interest provision. PIK interest is computed at the contractual rate specified in each investment agreement, is added to the principal balance of the investment, and is recorded as income. The Company will cease accruing PIK interest if there is insufficient value to support the accrual or if it does not expect amounts to be collectible. To maintain the Company’s status as a RIC, PIK interest income, which is considered investment company taxable income, must be paid out to stockholders in the form of dividends even though the Company has not yet collected the cash. Amounts necessary to pay these dividends may come from available cash.
The following shows a rollforward of PIK income activity for the years ended December 31, 2013, 2012, and 2011:
| Accumulated PIK balance at December 31, 2010 |
$ | 935 | ||
| PIK income capitalized/receivable |
2,553 | |||
|
|
|
|||
| Accumulated PIK balance at December 31, 2011 |
3,488 | |||
| PIK income capitalized/receivable |
4,124 | |||
| PIK received in cash from repayments |
(1,805 | ) | ||
|
|
|
|||
| Accumulated PIK balance at December 31, 2012 |
5,807 | |||
| PIK income capitalized/receivable |
3,179 | |||
| PIK received in cash from repayments |
(2,922 | ) | ||
|
|
|
|||
| Accumulated PIK balance at December 31, 2013 |
$ | 6,064 | ||
|
|
|
Interest income from the Company’s TRA and CLO residual interests is recorded based upon an estimation of an effective yield to expected maturity using anticipated cash flows. Amounts in excess of income recognized are recorded as a reduction to the cost basis of the investment. The Company monitors the anticipated cash flows from its TRA and CLO residual interests and will adjust its effective yield periodically as needed.
The Company capitalizes and amortizes upfront loan origination fees received in connection with the closing of investments. The unearned income from such fees is accreted into interest income over the contractual life of the loan based on the effective interest method. Upon prepayment of a loan or debt security, any prepayment premiums, unamortized upfront loan origination fees, and unamortized discounts are recorded as interest income.
118
Table of Contents
In certain investment transactions, the Company may provide advisory services. For services that are separately identifiable and external evidence exists to substantiate fair value, income is recognized as earned. The Company had no income from advisory services related to portfolio companies for the years ended December 31, 2013, 2012 and 2011.
Other income includes commitment fees, fees related to the management of Greenway and Greenway II, structuring fees, amendment fees and unused commitment fees associated with investments in portfolio companies. These fees are recognized as income when earned by the Company per the terms of the applicable management or credit agreements.
The following is a summary of the levels within the fair value hierarchy in which the Company invests as of December 31, 2013:
| Description |
Fair Value | Level 1 | Level 2 | Level 3 | ||||||||||||
| First lien secured debt |
$ | 262,965 | $ | — | $ | — | $ | 262,965 | ||||||||
| Subordinated debt |
155,979 | — | — | 155,979 | ||||||||||||
| Second lien debt |
157,878 | — | — | 157,878 | ||||||||||||
| CLO residual interests |
37,618 | — | — | 37,618 | ||||||||||||
| Investment in payment rights |
13,844 | — | — | 13,844 | ||||||||||||
| Investments in funds |
9,546 | — | — | 9,546 | ||||||||||||
| Equity investments |
11,037 | — | — | 11,037 | ||||||||||||
|
|
|
|
|
|
|
|
|
|||||||||
| Total investments |
$ | 648,867 | $ | — | $ | — | $ | 648,867 | ||||||||
|
|
|
|
|
|
|
|
|
|||||||||
| Interest rate derivative |
(284 | ) | — | (284 | ) | — | ||||||||||
|
|
|
|
|
|
|
|
|
|||||||||
| Total liability at fair value |
$ | (284 | ) | $ | — | $ | (284 | ) | $ | — | ||||||
|
|
|
|
|
|
|
|
|
|||||||||
The following is a summary of the levels within the fair value hierarchy in which the Company invests as of December 31, 2012:
| Description |
Fair Value | Level 1 | Level 2 | Level 3 | ||||||||||||
| Subordinated debt |
$ | 183,319 | $ | — | $ | — | $ | 183,319 | ||||||||
| First lien secured debt |
102,256 | — | — | 102,256 | ||||||||||||
| Second lien debt |
70,035 | — | — | 70,035 | ||||||||||||
| Investments in payment rights |
12,262 | — | — | 12,262 | ||||||||||||
| Investments in funds |
10,259 | — | — | 10,259 | ||||||||||||
| CLO residual interest |
9,400 | — | — | 9,400 | ||||||||||||
| Equity investments |
6,818 | — | — | 6,818 | ||||||||||||
|
|
|
|
|
|
|
|
|
|||||||||
| Total investments |
$ | 394,349 | $ | — | $ | — | $ | 394,349 | ||||||||
|
|
|
|
|
|
|
|
|
|||||||||
| Interest rate derivative |
(1,053 | ) | — | (1,053 | ) | — | ||||||||||
|
|
|
|
|
|
|
|
|
|||||||||
| Total liability at fair value |
$ | (1,053 | ) | $ | — | $ | (1,053 | ) | $ | — | ||||||
|
|
|
|
|
|
|
|
|
|||||||||
119
Table of Contents
The following is a summary of the industry classification in which the Company invests as of December 31, 2013:
| Industry |
Cost | Fair Value | % of Net Assets |
|||||||||
| IT services |
100,501 | 101,023 | 22.31 | % | ||||||||
| Financial services |
91,242 | 90,698 | 20.02 | % | ||||||||
| Industrials |
79,418 | 79,748 | 17.61 | % | ||||||||
| Food & beverage |
52,774 | 52,304 | 11.55 | % | ||||||||
| Healthcare |
48,790 | 50,472 | 11.14 | % | ||||||||
| Retail & grocery |
53,358 | 50,163 | 11.07 | % | ||||||||
| Business services |
50,941 | 50,029 | 11.05 | % | ||||||||
| Manufacturing |
48,770 | 48,956 | 10.81 | % | ||||||||
| Consumer products |
38,200 | 38,352 | 8.47 | % | ||||||||
| Energy / utilities |
32,393 | 32,835 | 7.25 | % | ||||||||
| Media, entertainment and leisure |
24,578 | 29,083 | 6.42 | % | ||||||||
| Restaurants |
20,778 | 20,844 | 4.60 | % | ||||||||
| Aerospace & defense |
4,175 | 4,360 | 0.96 | % | ||||||||
|
|
|
|
|
|
|
|||||||
| Total Investments |
$ | 645,918 | $ | 648,867 | 143.26 | % | ||||||
|
|
|
|
|
|
|
|||||||
The following is a summary of the geographical concentration of our investment portfolio as of December 31, 2013:
| Region |
Cost | Fair Value | % of Net Assets |
|||||||||
| Northeast |
$ | 138,835 | $ | 140,292 | 30.97 | % | ||||||
| West |
126,770 | 128,423 | 28.35 | % | ||||||||
| Midwest |
124,248 | 124,817 | 27.56 | % | ||||||||
| Southwest |
119,357 | 116,573 | 25.74 | % | ||||||||
| Southeast |
109,679 | 114,943 | 25.38 | % | ||||||||
| International |
13,378 | 13,582 | 3.00 | % | ||||||||
| Northwest |
13,651 | 10,237 | 2.26 | % | ||||||||
|
|
|
|
|
|
|
|||||||
| Total Investments |
$ | 645,918 | $ | 648,867 | 143.26 | % | ||||||
|
|
|
|
|
|
|
|||||||
The following is a summary of the industry classification in which the Company invests as of December 31, 2012 (1):
| Industry |
Cost | Fair Value | % of Net Assets |
|||||||||
| Healthcare |
$ | 55,080 | $ | 56,558 | 16.27 | % | ||||||
| Consumer Products |
49,957 | 50,010 | 14.39 | % | ||||||||
| Food & beverage |
44,124 | 43,559 | 12.54 | % | ||||||||
| Industrials |
43,142 | 43,089 | 12.40 | % | ||||||||
| Manufacturing |
38,982 | 38,145 | 10.98 | % | ||||||||
| IT services |
34,621 | 34,790 | 10.01 | % | ||||||||
| Financial services |
31,221 | 31,921 | 9.19 | % | ||||||||
| Business services |
32,464 | 31,462 | 9.05 | % | ||||||||
| Retail & grocery |
26,455 | 26,967 | 7.76 | % | ||||||||
| Media, entertainment and leisure |
13,742 | 15,661 | 4.51 | % | ||||||||
| Energy / Utilities |
9,752 | 9,752 | 2.81 | % | ||||||||
| Restaurants |
8,203 | 8,415 | 2.42 | % | ||||||||
| Aerospace & defense |
3,966 | 4,020 | 1.16 | % | ||||||||
|
|
|
|
|
|
|
|||||||
| $ | 391,709 | $ | 394,349 | 113.49 | % | |||||||
|
|
|
|
|
|
|
|||||||
120
Table of Contents
| (1) | The Company has changed the industry classification of certain investments to conform to new industry classifications adopted as of September 30, 2013. |
The following is a summary of the geographical concentration of our investment portfolio as of December 31, 2012:
| Region |
Cost | Fair Value | % of Net Assets |
|||||||||
| Southeast |
$ | 101,401 | $ | 104,146 | 29.98 | % | ||||||
| West |
87,804 | 88,635 | 25.51 | % | ||||||||
| Northeast |
38,659 | 38,607 | 11.11 | % | ||||||||
| Southwest |
73,786 | 72,432 | 20.84 | % | ||||||||
| Midwest |
62,867 | 63,033 | 18.14 | % | ||||||||
| International |
13,666 | 13,666 | 3.93 | % | ||||||||
| Northwest |
13,526 | 13,830 | 3.98 | % | ||||||||
|
|
|
|
|
|
|
|||||||
| Total Investments |
$ | 391,709 | $ | 394,349 | 113.49 | % | ||||||
|
|
|
|
|
|
|
|||||||
The following table rolls forward the changes in fair value during the year ended December 31, 2013 for investments classified within Level 3:
| First lien secured debt |
Second lien debt |
Subordinated debt |
Investments in funds |
Equity investments |
Investment in payment rights |
CLO residual interests |
Totals | |||||||||||||||||||||||||
| Beginning balance, January 1 2013 |
$ | 102,256 | $ | 70,035 | $ | 183,319 | $ | 10,259 | $ | 6,818 | $ | 12,262 | $ | 9,400 | $ | 394,349 | ||||||||||||||||
| Purchases |
203,789 | 129,343 | 49,645 | 1,076 | 2,169 | — | 29,514 | 415,536 | ||||||||||||||||||||||||
| Sales and repayments |
(45,377 | ) | (44,167 | ) | (75,754 | ) | (1,273 | ) | (469 | ) | (100 | ) | (1,834 | ) | (168,974 | ) | ||||||||||||||||
| Unrealized appreciation (depreciation)(1) |
909 | 1,188 | (5,748 | ) | (516 | ) | 2,519 | 1,682 | 275 | 309 | ||||||||||||||||||||||
| Net amortization of premiums, discounts and fees |
1,235 | 1,062 | 1,837 | — | — | — | 263 | 4,397 | ||||||||||||||||||||||||
| PIK |
153 | 417 | 2,680 | — | — | — | — | 3,250 | ||||||||||||||||||||||||
|
|
|
|
|
|
|
|
|
|
|
|
|
|
|
|
|
|||||||||||||||||
| Ending balance, December 31, 2013 |
$ | 262,965 | $ | 157,878 | $ | 155,979 | $ | 9,546 | $ | 11,037 | $ | 13,844 | $ | 37,618 | $ | 648,867 | ||||||||||||||||
|
|
|
|
|
|
|
|
|
|
|
|
|
|
|
|
|
|||||||||||||||||
| Net change in unrealized appreciation from investments still held as of the reporting date(1) |
$ | 1,098 | $ | 1,304 | $ | (6,086 | ) | $ | (515 | ) | $ | 2,519 | $ | 1,682 | $ | 275 | $ | 277 | ||||||||||||||
|
|
|
|
|
|
|
|
|
|
|
|
|
|
|
|
|
|||||||||||||||||
| (1) | All unrealized appreciation (depreciation) in the table above is reflected in the accompanying Consolidated Statements of Operations. |
121
Table of Contents
The following table rolls forward the changes in fair value during the year ended December 31, 2012 for investments classified within Level 3:
| First lien secured debt |
Second lien debt |
Subordinated debt |
Investments in funds |
Equity investments |
Investment in payment rights |
CLO Residual interest |
Totals | |||||||||||||||||||||||||
| Beginning balance, January 1, 2012 |
$ | 89,488 | $ | 60,125 | $ | 101,842 | $ | 12,011 | $ | 3,527 | $ | — | $ | — | $ | 266,993 | ||||||||||||||||
| Purchases |
102,786 | 41,531 | 130,313 | 1,199 | 764 | 12,500 | 9,400 | 298,493 | ||||||||||||||||||||||||
| Sales and repayments |
(90,775 | ) | (32,045 | ) | (50,830 | ) | (3,650 | ) | — | (238 | ) | (177,538 | ) | |||||||||||||||||||
| Unrealized appreciation (depreciation)(1) |
(593 | ) | (1,043 | ) | (2,831 | ) | 699 | 2,527 | — | — | (1,241 | ) | ||||||||||||||||||||
| Net amortization of premiums, discounts and fees |
1,183 | 836 | 1,596 | — | — | — | — | 3,615 | ||||||||||||||||||||||||
| PIK |
167 | 631 | 3,229 | — | — | — | — | 4,027 | ||||||||||||||||||||||||
|
|
|
|
|
|
|
|
|
|
|
|
|
|
|
|
|
|||||||||||||||||
| Ending balance, December 31, 2012 |
$ | 102,256 | $ | 70,035 | $ | 183,319 | $ | 10,259 | $ | 6,818 | $ | 12,262 | $ | 9,400 | $ | 394,349 | ||||||||||||||||
|
|
|
|
|
|
|
|
|
|
|
|
|
|
|
|
|
|||||||||||||||||
| Net change in unrealized appreciation from investments still held as of the reporting date(1) |
$ | 477 | $ | (295 | ) | $ | (1,196 | ) | $ | 699 | $ | 2,527 | $ | — | $ | — | $ | 2,212 | ||||||||||||||
|
|
|
|
|
|
|
|
|
|
|
|
|
|
|
|
|
|||||||||||||||||
| (1) | All unrealized appreciation (depreciation) in the table above is reflected in the accompanying Consolidated Statements of Operations. |
The following provides quantitative information about Level 3 fair value measurements as of December 31, 2013:
| Description: |
Fair Value | Valuation Technique |
Unobservable |
Range (Average) (1) | ||||||
| First lien secured debt |
$ | 262,965 | Discounted cash flows (income approach) | Weighted average cost of capital (WACC) |
11% - 13% (12%) | |||||
| Second lien debt |
157,878 | Discounted cash flows (income approach) | Weighted average cost of capital (WACC) |
12% - 14% (13%) | ||||||
| Subordinated debt |
155,979 | Discounted cash flows (income approach) | Weighted average cost of capital (WACC) |
14% - 17% (15%) | ||||||
| Investments in funds |
8,361 | Discounted cash flows (income approach) | Weighted average cost of capital (WACC) |
13% | ||||||
| 1,185 | Net asset value, as a practical expedient | Net asset value | N/A | |||||||
| Equity investments |
10,100 | Market comparable companies (market approach) | EBITDA multiple | 6.7x - 7.4x (7.1x) | ||||||
| 937 | Recent transaction | Sale price | N/A | |||||||
| Investment in payment rights(2) |
13,844 | Discounted cash flows (income approach) | Weighted average Federal tax rates |
14% - 15% (15%)
35% - 40% (38%) | ||||||
| CLO residual interests |
37,618 | Discounted cash flows (income approach) | Weighted average cost of capital (WACC) |
14% | ||||||
|
|
|
|||||||||
| Total investments |
$ | 648,867 | ||||||||
|
|
|
|||||||||
| (1) | Ranges were determined using a weighted average based upon the fair value of the investments in each investment category. |
| (2) | Investment in a tax receivable agreement, or TRA, payment rights |
122
Table of Contents
The following provides quantitative information about Level 3 fair value measurements as of December 31, 2012:
| Description: |
Fair Value | Valuation Technique |
Unobservable |
Range (Average) (1) | ||||||
| First lien secured debt |
$ | 102,256 | Discounted cash flows (income approach) | Weighted average cost of capital (WACC) |
12% - 13% (12%) | |||||
| Second lien debt |
70,035 | Discounted cash flows (income approach) | Weighted average cost of capital (WACC) |
14% - 16% (15%) | ||||||
| Subordinated debt |
183,319 | Discounted cash flows (income approach) | Weighted average cost of capital (WACC) |
15% - 17% (16%) | ||||||
| Investments in funds |
|
8,364 1,895 |
|
Discounted cash flows (income approach) Net asset value, as a practical expedient |
Weighted average Net asset value |
14% - 18% (16%) N/A | ||||
| Equity investments |
6,818 | Market comparable companies (market approach) | EBITDA multiple | 5.0 - 5.7 (5.3) | ||||||
| Investment in payment rights(2) |
12,262 | Discounted cash flows (income approach) | Weighted average cost of capital (WACC) and federal tax rates | 14% - 18% (16%) | ||||||
| CLO residual interest |
9,400 | Discounted cash flows (income approach) | Weighted average cost of capital (WACC) | 15% - 16% (16%) | ||||||
|
|
|
|||||||||
| Total investments |
$ | 394,349 | ||||||||
|
|
|
|||||||||
| (1) | Ranges were determined using a weighted average based upon the fair value of the investments in each investment category. |
| (2) | Investment in a tax receivable agreement, or TRA, payment rights |
The primary significant unobservable input used in the fair value measurement of the Company’s debt securities (first lien secured debt, second lien debt and subordinated debt), including income-producing investments in funds, payment rights and CLO residual interests is the weighted average cost of capital, or WACC. Significant increases (decreases) in the WACC in isolation would result in a significantly lower (higher) fair value measurement. In determining the WACC, for the income, or yield, approach, the Company considers current market yields and multiples, portfolio company performance, leverage levels, credit quality, among other factors, including federal tax rates, in its analysis. In the case of CLO residual interests, the Company considers prepayment, re-investment and loss assumptions based upon historical and projected performance as well as comparable yields for other similar CLOs. In the case of the TRA, the Company considers the risks associated with changes in tax rates, the performance of the portfolio company and the expected term of the investment. Changes in one or more of these factors can have a similar directional change on other factors in determining the appropriate WACC to use in the income approach.
The primary significant unobservable input used in the fair value measurement of the Company’s equity investments is the EBITDA multiple adjusted by management for differences between the investment and referenced comparables, or the Multiple. Significant increases (decreases) in the Multiple in isolation would result in a significantly higher (lower) fair value measurement. To determine the Multiple for the market approach, the Company considers current market trading and/or transaction multiples, portfolio company performance (financial ratios) relative to public and private peer companies and leverage levels, among other factors. Changes in one or more of these factors can have a similar directional change on other factors in determining the appropriate Multiple to use in the market approach.
123
Table of Contents
Investment in Tax Receivable Agreement Payment Rights
In June 2012, the Company invested in a TRA that entitles it to certain payment rights, or TRA Payment Rights, from Duff & Phelps Corporation, or Duff & Phelps. The TRA transfers the economic value of certain tax deductions, or tax benefits, taken by Duff & Phelps to the Company and entitles the Company to a stream of payments to be received. The TRA payment right is, in effect, a subordinated claim on the issuing company which can be valued based on the credit risk of the issuer, which includes projected future earnings, the liquidity of the underlying payment right, risk of tax law changes, the effective tax rate and any other factors which might impact the value of the payment right.
Through the TRA, the Company is entitled to receive an annual tax benefit payment based upon 85% of the savings from certain deductions along with interest. The payments that the Company is entitled to receive result from cash savings, if any, in U.S. federal, state or local income tax that Duff & Phelps realizes (i) from the tax savings derived from the goodwill and other intangibles created in connection with the Duff & Phelps initial public offering and (ii) from other income tax deductions. These tax benefit payments will continue until the relevant deductions are fully utilized, which is projected to be 17 years. Pursuant to the TRA, the Company maintains the right to enforce Duff & Phelps payment obligations as a transferee of the TRA contract. If Duff & Phelps chooses to pre-pay and terminate the TRA, the Company will be entitled to the present value of the expected future TRA payments. If Duff & Phelps breaches any material obligation than all obligations are accelerated and calculated as if an early termination occurred. Failure to make a payment is a breach of a material obligation if the failure occurs for more than.
The projected annual tax benefit payment will be accrued on a quarterly basis and paid annually. The payment will be allocated between a reduction in the cost basis of the investment and interest income based upon an amortization schedule. Based upon the characteristics of the investment, the Company has chosen to categorize the investment in the TRA payment rights as investment in payment rights in the fair value hierarchy.
Managed Funds
The Advisor and its affiliates may also manage other funds in the future that may have investment mandates that are similar, in whole and in part, with ours. For example, the Advisor may serve as investment adviser to one or more registered closed-end funds. In addition, our officers may serve in similar capacities for one or more registered closed-end funds. The Advisor and its affiliates may determine that an investment is appropriate for us and for one or more of those other funds. In such event, depending on the availability of such investment and other appropriate factors, the Advisor or its affiliates may determine that we should invest side-by-side with one or more other funds. Any such investments will be made only to the extent permitted by applicable law and interpretive positions of the SEC and its staff, and consistent with the Advisor’s allocation procedures.
The Company does not have the ability to redeem its investment in funds but distributions are expected to be received until the dissolution of the funds, which is anticipated to be between 2014 and 2021, as the underlying investments are expected to be liquidated.
Greenway
On January 14, 2011, THL Credit Greenway Fund LLC, or Greenway, was formed as a Delaware limited liability company. Greenway is a portfolio company of the Company. Greenway is a closed-end investment fund which provides for no liquidity or redemption options and is not readily marketable. Greenway operates under a limited liability agreement dated January 19, 2011, or the Agreement. Greenway will continue in existence until January 14, 2021, subject to earlier termination pursuant to certain terms of the Agreement. The term may also be extended for up to three additional one-year periods pursuant to certain terms of the Agreement. Greenway had a two year investment period.
124
Table of Contents
Greenway has $150,000 of capital committed by affiliates of a single institutional investor and is managed by the Company. The Company’s capital commitment to Greenway is $15. As of December 31, 2013, and December 31, 2012, all of the capital had been called by Greenway. The Company’s nominal investment in Greenway is reflected in the December 31, 2013 and December 31, 2012 Consolidated Schedule of Investments.
The Company acts as the investment adviser to Greenway and is entitled to receive certain fees relating to its investment management services provided, including a base management fee, a performance fee and a portion of the closing fees on each investment transaction. As a result, Greenway is classified as an affiliate of the Company. For the years ended December 31, 2013, 2012 and 2011 the Company earned $1,692, $2,592 and $1,809, respectively, in fees related to Greenway, respectively, which are included in other income from non-controlled, affiliated investment in the Consolidated Statements of Operations. As of December 31, 2013 and December 31, 2012, $240 and $402 of fees related to Greenway, respectively, were included in due from affiliate on the Consolidated Statements of Assets and Liabilities.
Greenway invests in securities similar to those of the Company pursuant to investment and allocation guidelines which address, among other things, the size of the borrowers, the types of transactions and the concentration and investment ratio amongst Greenway and the Company. However, the Company has the discretion to invest in other securities.
Greenway II
On January 31, 2013, THL Credit Greenway Fund II, LLC, or Greenway II LLC, was formed as a Delaware limited liability company and is a portfolio company of the Company. Greenway II LLC is a closed-end investment fund which provides for no liquidity or redemption options and is not readily marketable. Greenway II LLC operates under a limited liability agreement dated February 11, 2013, as amended, or the Greenway II LLC Agreement. Greenway II LLC will continue in existence for eight years from the final closing date, subject to earlier termination pursuant to certain terms of the Greenway II LLC Agreement. The term may also be extended for up to three additional one-year periods pursuant to certain terms of the Greenway II LLC Agreement. Greenway II LLC has a two year investment period.
As contemplated in the Greenway II LLC Agreement, the Company has established a related investment vehicle and entered into an investment management agreement with an account set up by an unaffiliated third party investor to invest alongside Greenway II LLC pursuant to similar economic terms. The account is also managed by the Company. References to “Greenway II” herein include Greenway II LLC and the account of the related investment vehicle. Greenway II has $186,505 of commitments primarily from institutional investors. The Company’s capital commitment to Greenway II is $5. The Company’s nominal investment in Greenway II LLC is reflected in the December 31, 2013 Consolidated Schedule of Investments. Greenway II LLC is managed by the Company.
The Company acts as the investment adviser to Greenway II and is entitled to receive certain fees relating to its investment management services provided, including a base management fee, a performance fee and a portion of the closing fees on each investment transaction. As a result, Greenway II is classified as an affiliate of the Company. For the year ended December 31, 2013, the Company earned $1,307 in fees related to Greenway II, which are included in other income from non-controlled, affiliated investment in the Consolidated Statements of Operations. As of December 31, 2013, $760 of fees related to Greenway II were included in due from affiliate on the Consolidated Statements of Assets and Liabilities. During the year ended December 31, 2013, the Company sold a portion of its investments in seven portfolio companies at fair value, for total proceeds of $19,533, to Greenway II determined in accordance with the normal valuation policies.
Other deferred costs consist of placement agent expenses incurred in connection with the offer and sale of partnership interests in Greenway II. These costs are capitalized when the partner signs the Greenway II subscription agreement and are recognized as an expense over the period when the Company expects to
125
Table of Contents
collect management fees from Greenway II. For the year ended December 31, 2013, the Company recognized $75 in expenses related to placement agent expenses, which are included in other general and administrative expenses in the Consolidated Statements of Operations. As of December 31, 2013, $825 was included in other deferred costs on the Consolidated Statements of Assets and Liabilities.
Greenway II invests in securities similar to those of the Company pursuant to investment and allocation guidelines which address, among other things, the size of the borrowers, the types of transactions and the concentration and investment ratio amongst Greenway II and the Company. However, the Company has the discretion to invest in other securities.
Investment in Funds
LCP Capital Fund LLC
The Company has invested in a membership interest of LCP Capital Fund LLC, or LCP, a private investment company that was organized to participate in investment opportunities that arise when a special purpose entity, or SPE, or sponsor thereof, needs to raise capital to achieve ratings, regulatory, accounting, tax, or other objectives. LCP is a closed investment vehicle which provides for no liquidity or redemption options and is not readily marketable. LCP is managed by an unaffiliated third party. As of December 31, 2013 and 2012, the Company has contributed $12,000 of capital in the form of membership interests in LCP, which is invested in an underlying SPE referred to as Series 2005-01. On May 1, 2012, the Company received $3,646 in connection with a reduction in its commitment pursuant to the governing documents, which is related to the notional amount of the underlying credit default swaps. The Company’s exposure is limited to the amount of its remaining contributed capital. As of December 31, 2013 and 2012, the value of the Company’s interest in LCP was $8,354, and is reflected in the Consolidated Schedules of Investments.
The Company’s contributed capital in LCP is maintained in a collateral account held by a third-party custodian, who is neither affiliated with the Company nor with LCP, and acts as collateral on certain credit default swaps for the Series 2005-01 for which LCP receives fixed premium payments throughout the year, adjusted for expenses incurred by LCP. The SPE purchases assets on a non-recourse basis and LCP agrees to reimburse the SPE up to a specified amount for potential losses. LCP holds the contributed cash invested for an SPE transaction in a segregated account that secures the payment obligation of LCP. The Company expects to receive distributions from LCP on a quarterly basis. Such distributions are reflected in the Company’s Consolidated Statements of Operations as interest income in the period earned. As of December 31, 2013, LCP has a remaining life of 18 years. Regardless of the date of dissolution, LCP has the right to receive amounts held in the collateral account if there is an event of default under LCP’s operative agreements. LCP may have other series which will have investments in other SPEs to which we will not be exposed. The Company expected that Series 2005-01 would terminate on February 15, 2015; however, on February 3, 2014, LCP was liquidated and the Company received proceeds of $8,354, which is the remaining value of the Company’s interest.
CLO Residual Interests
The Company invested $41,851 in the CLO residual interests, or the subordinated notes, which can also be structured as income notes, of five CLOs. The Company owns between 10.4% and 23.1% of the subordinated notes of these CLOs. The subordinated notes are subordinated to the secured notes issued in connection with each CLO. The secured notes in each structure are collateralized by portfolios consisting primarily of broadly syndicated senior secured bank loans. The first investment was in the income notes of a $625,900 CLO of Octagon Investment Partners XIV, Ltd. The income notes are part of a class of subordinated notes, which are paid equal with other subordinated notes within this class. The subordinated notes are subordinated to the claims of $569,250 in secured notes issued by the structure. The second investment was in the income notes of a $724,534 CLO of Sheridan Square CLO Ltd. The income notes are part of a class of subordinated notes, which are paid equal with other subordinated notes within this class.
126
Table of Contents
The subordinated notes are subordinated to the claims of $658,700 in secured notes issued by the structure. The third investment was in the subordinated notes of the $517,000 CLO of Adirondack Park CLO Ltd. There is only one class of subordinated notes that are subordinated to the claims of $463,500 in secured notes issued by the structure. The fourth investment was in the subordinated notes of a $516,400 CLO of Dryden 30 Senior Loan Fund. The subordinated notes are subordinated to the claims of $473,150 in secured notes issued by the structure. The fifth investment was in the subordinated notes of a $441,810 CLO of Flagship VII, Ltd. The subordinated notes are subordinated to the claims of $402,100 in secured notes issued by the structure.
In each case, the subordinated notes do not have a stated rate of interest, but are entitled to receive distributions on quarterly payment dates subject to the priority of payments to secured note holders in the structures if and to the extent funds are available for such purpose. The payments on the subordinated notes are subordinated not only to the interest and principal claims of all secured notes issued, but to certain administrative expenses, taxes, and the base and subordinated fees paid to the collateral manager. Payments to the subordinated notes may vary significantly quarter to quarter for a variety of reasons and may be subject to 100% loss. Investments in subordinated notes, due to the structure of the CLO, can be significantly impacted by change in the market value of the assets, the distributions on the assets, defaults and recoveries on the assets, capital gains and losses on the assets along with prices, interest rates and other risks associated with the assets.
Revolving and Unfunded Delayed Draw Loans
For the Company’s investments in revolving and delayed draw loans, the cost basis of the investments purchased is adjusted for the cash received for the discount on the total balance committed. The fair value is also adjusted for price appreciation or depreciation on the unfunded portion. As a result, the purchase of commitments not completely funded may result in a negative value until it is offset by the future amounts called and funded.
Income Taxes, Including Excise Tax
The Company has elected to be taxed as a RIC under Subchapter M of the Code and currently qualifies, and intends to continue to qualify each year, as a RIC under the Code. Accordingly, the Company is not subject to federal income tax on the portion of its taxable income and gains distributed to stockholders.
In order to qualify for favorable tax treatment as a RIC, the Company is required to distribute annually to its stockholders at least 90% of its investment company taxable income, as defined by the Code. To avoid a 4% federal excise tax on undistributed earnings, the Company is required to distribute each calendar year the sum of (i) 98% of its ordinary income for such calendar year (ii) 98.2% of its net capital gains for the one-year period ending October 31 of that calendar year (iii) any income recognized, but not distributed, in preceding years and on which the Company paid no federal income tax. The Company, at its discretion, may choose not to distribute all of its taxable income for the calendar year and pay a non-deductible 4% excise tax on this income. If the Company chooses to do so, all other things being equal, this would increase expenses and reduce the amount available to be distributed to stockholders. To the extent that the Company determines that its estimated current year annual taxable income will be in excess of estimated current year dividend distributions from such taxable income, the Company accrues excise taxes on estimated excess taxable income as taxable income is earned using an annual effective excise tax rate. The annual effective excise tax rate is determined by dividing the estimated annual excise tax by the estimated annual taxable income. See also the disclosure in Note 10, Dividends, for a summary of the dividends paid. For the years ended December 31, 2013, 2012 and 2011, the Company incurred excise tax expense of $175, $125 and $22, respectively.
Certain consolidated subsidiaries of the Company are subject to U.S. federal and state income taxes. These taxable entities are not consolidated for income tax purposes and may generate income tax liabilities or assets from permanent and temporary differences in the recognition of items for financial reporting and income tax purposes at the subsidiaries.
127
Table of Contents
For the years ended December 31, 2013 and 2012, the Company recognized a current income tax provision of $336 and $456, respectively, which is shown as income tax (benefit) provision in the Consolidated Statements of Operations. These income taxes relate primarily related to the proceeds received in June 2013 from its equity investment in YP Equity Investors, LLC into one of the Company’s wholly owned tax blocker corporations and may be subject to further change once tax information is finalized for the year. The Company did not recognize current tax expense for the year ended December 31, 2011. As of December 31, 2013, $381 of income tax receivable was included in prepaid expenses and other assets and $71 was included as income taxes payable on the Consolidated Statements of Assets and Liabilities relating to dividend income and other projected earnings of tax blocker corporations. As of December 31, 2012, there were no income taxes receivable or payable.
For the years ended December 31, 2013 and 2012, the Company recognized a provision for tax on unrealized gain on investments of $1,960 and $454, respectively, for consolidated subsidiaries in the Consolidated Statements of Operations. The Company did not recognize a benefit or provision for tax on unrealized gain on investments during the year ended December 31, 2011. As of December 31, 2013 and December 31, 2012, $2,414 and $454, respectively, were included in deferred tax liability on the Consolidated Statements of Assets and Liabilities relating to deferred tax on unrealized gain on investments held in tax blocker corporations.
The Company follows the provisions under the authoritative guidance on accounting for and disclosure of uncertainty in tax positions. The provisions require management to determine whether a tax position of the Company is more likely than not to be sustained upon examination, including resolution of any related appeals or litigation processes, based on the technical merits of the position. For tax positions not meeting the more likely than not threshold, the tax amount recognized in the consolidated financial statements is reduced by the largest benefit that has a greater than fifty percent likelihood of being realized upon ultimate settlement with the relevant taxing authority. There are no unrecognized tax benefits or obligations in the accompanying consolidated financial statements. Although the Company files federal and state tax returns, the Company’s major tax jurisdiction is federal. The Company’s inception-to-date federal tax years remain subject to examination by taxing authorities.
Dividends
Dividends and distributions to stockholders are recorded on the applicable record date. The amount to be paid out as a dividend is determined by the Company’s board of directors on a quarterly basis. Net realized capital gains, if any, are generally distributed at least annually out of assets legally available for such distributions, although the Company may decide to retain such capital gains for investment.
Capital transactions in connection with the Company’s dividend reinvestment plan are recorded when shares are issued.
Recent Accounting Pronouncements
In June 2013, the FASB issued ASU 2013-08, “Financial Services – Investment Companies (Topic 946): Amendments to the Scope, Measurement, and Disclosure Requirements,” which amends the criteria that define an investment company and clarifies the measurement guidance and requires new disclosures for investment companies. Under ASU 2013-08, an entity already regulated under the 1940 Act will be automatically deemed an investment company under the new GAAP definition. As such, the Company anticipates no impact from adopting this standard on the Company’s consolidated financial results. The Company is currently assessing the additional disclosure requirements. ASU 2013-08 will be effective for interim and annual reporting periods in fiscal years that begin after December 15, 2013.
128
Table of Contents
3. Related Party Transactions
Investment Management Agreement
On March 4, 2014, the Company’s investment management agreement was re-approved by its board of directors, including a majority of our directors who are not interested persons of the Company. Under the investment management agreement, the Advisor, subject to the overall supervision of the Company’s board of directors, manages the day-to-day operations of, and provides investment advisory services to the Company.
The Advisor receives a fee for investment advisory and management services consisting of a base management fee and a two-part incentive fee.
The base management fee is calculated at an annual rate of 1.5% of the Company’s gross assets payable quarterly in arrears on a calendar quarter basis. For purposes of calculating the base management fee, “gross assets” is determined as the value of the Company’s assets without deduction for any liabilities. The base management fee is calculated based on the value of the Company’s gross assets at the end of the most recently completed calendar quarter, and appropriately adjusted for any share issuances or repurchases during the current calendar quarter.
For the years ended December 31, 2013, 2012 and 2011 the Company incurred base management fees of $7,521, $4,943, and $4,012, respectively. As of December 31, 2013 and December 31, 2012, $2,243 and $1,514, respectively, was payable to the Advisor.
The incentive fee has two components, ordinary income and capital gains, as follows:
The ordinary income component is calculated, and payable, quarterly in arrears based on the Company’s preincentive fee net investment income for the immediately preceding calendar quarter, subject to a cumulative total return requirement and to deferral of non-cash amounts. The preincentive fee net investment income, which is expressed as a rate of return on the value of the Company’s net assets attributable to the Company’s common stock, for the immediately preceding calendar quarter, will have a 2.0% (which is 8.0% annualized) hurdle rate (also referred to as “minimum income level”). Preincentive fee net investment income means interest income, dividend income and any other income (including any other fees, such as commitment, origination, structuring, diligence, managerial assistance and consulting fees or other fees that the Company receives from portfolio companies) accrued during the calendar quarter, minus the Company’s operating expenses for the quarter (including the base management fee, expenses payable under the Company’s administration agreement (discussed below), and any interest expense and any dividends paid on any issued and outstanding preferred stock, but excluding the incentive fee and any offering expenses and other expenses not charged to operations but excluding certain reversals to the extent such reversals have the effect of reducing previously accrued incentive fees based on the deferral of non-cash interest. Preincentive fee net investment income includes, in the case of investments with a deferred interest feature (such as original issue discount, debt instruments with PIK interest and zero coupon securities), accrued income that the Company has not yet received in cash. The Advisor receives no incentive fee for any calendar quarter in which the Company’s preincentive fee net investment income does not exceed the minimum income level. Subject to the cumulative total return requirement described below, the Advisor receives 100% of the Company’s preincentive fee net investment income for any calendar quarter with respect to that portion of the preincentive net investment income for such quarter, if any, that exceeds the minimum income level but is less than 2.5% (which is 10.0% annualized) of net assets (also referred to as the “catch-up” provision) and 20.0% of the Company’s preincentive fee net investment income for such calendar quarter, if any, greater than 2.5% (10.0% annualized) of net assets. The foregoing incentive fee is subject to a total return requirement, which provides that no incentive fee in respect of the Company’s preincentive fee net investment income is payable except to the extent 20.0% of the cumulative net increase in net assets resulting from operations over the then current and 11 preceding calendar quarters exceeds the cumulative incentive fees accrued and/or paid for the 11 preceding quarters. In other words, any ordinary income incentive fee that is payable in a calendar quarter is limited to the lesser of (i) 20% of the
129
Table of Contents
amount by which the Company’s preincentive fee net investment income for such calendar quarter exceeds the 2.0% hurdle, subject to the “catch-up” provision, and (ii) (x) 20% of the cumulative net increase in net assets resulting from operations for the then current and 11 preceding quarters minus (y) the cumulative incentive fees accrued and/or paid for the 11 preceding calendar quarters. For the foregoing purpose, the “cumulative net increase in net assets resulting from operations” is the amount, if positive, of the sum of preincentive fee net investment income, base management fees, realized gains and losses and unrealized appreciation and depreciation of the Company for the then current and 11 preceding calendar quarters. In addition, the Advisor is not paid the portion of such incentive fee that is attributable to deferred interest until the Company actually receives such interest in cash.
For the years ended December 31, 2013, 2012 and 2011, the Company incurred $10,414, $7,442 and $3,818, respectively, of incentive fees related to ordinary income. As of December 31, 2013 and December 31, 2012, $2,074 and $2,296, respectively, of such incentive fees are currently payable to the Advisor. As of December 31, 2013 and 2012, $1,277 and $630, respectively, of incentive fees incurred by the Company were generated from deferred interest (i.e. PIK, certain discount accretion and deferred interest) and are not payable until such amounts are received in cash.
GAAP requires that the incentive fee accrual considers the cumulative aggregate realized gains and losses and unrealized capital appreciation or depreciation of investments or other financial instruments, such as an interest rate derivative, in the calculation, as an incentive fee would be payable if such realized gains and losses and unrealized capital appreciation or depreciation were realized, even though such realized gains and losses and unrealized capital appreciation or depreciation is not permitted to be considered in calculating the fee actually payable under the investment management agreement (“GAAP incentive fee”). There can be no assurance that unrealized appreciation or depreciation will be realized in the future. Accordingly, such fee, as calculated and accrued, would not necessarily be payable under the investment management agreement, and may never be paid based upon the computation of incentive fees in subsequent periods.
For the years ended December 31, 2013, 2012, and 2011, we incurred $268, $(459), and $776, respectively, of incentive fees related to the GAAP incentive fee. As of December 31, 2013 and 2012, $70 and $353, respectively, of GAAP incentive fees incurred by the Company are not currently payable until the hurdle is met as described below.
The second component of the incentive fee (capital gains incentive fee) is determined and payable in arrears as of the end of each calendar year (or upon termination of the investment management agreement, as of the termination date). This component is equal to 20.0% of the Company’s cumulative aggregate realized capital gains from inception through the end of that calendar year, computed net of the cumulative aggregate realized capital losses and cumulative aggregate unrealized capital depreciation through the end of such year. The aggregate amount of any previously paid capital gains incentive fees is subtracted from such capital gains incentive fee calculated. The capital gains incentive fee payable to our Advisor under the investment management agreement as of December 31, 2013 and 2012 was $0 and $35, respectively.
Administration Agreement
The Company has also entered into an administration agreement with the Advisor under which the Advisor will provide administrative services to the Company. Under the administration agreement, the Advisor performs, or oversees the performance of administrative services necessary for the operation of the Company, which include, among other things, being responsible for the financial records which the Company is required to maintain and preparing reports to the Company’s stockholders and reports filed with the SEC. In addition, the Advisor assists in determining and publishing the Company’s net asset value, oversees the preparation and filing of the Company’s tax returns and the printing and dissemination of reports to the Company’s stockholders, and generally oversees the payment of the Company’s expenses and the performance of administrative and professional services rendered to the Company by others. The Company will reimburse the Advisor for its allocable portion of the costs and expenses incurred by the Advisor for overhead in performance by the Advisor of its duties under the administration agreement and
130
Table of Contents
the investment management agreement, including facilities, office equipment and our allocable portion of cost of compensation and related expenses of our chief financial officer and chief compliance officer and their respective staffs, as well as any costs and expenses incurred by the Advisor relating to any administrative or operating services provided by the Advisor to the Company. Such costs are reflected as administrator expenses in the accompanying Consolidated Statements of Operations. Under the administration agreement, the Advisor provides, on behalf of the Company, managerial assistance to those portfolio companies to which the Company is required to provide such assistance. To the extent that our Advisor outsources any of its functions, the Company pays the fees associated with such functions on a direct basis without profit to the Advisor.
For the years ended December 31, 2013, 2012 and 2011, the Company incurred administrator expenses of $3,608, $3,225 and $2,872, respectively. As of December 31, 2013 and December 31, 2012, $158 and $304, respectively, was payable to the Advisor.
The Company and the Advisor have entered into a license agreement with THL Partners, L.P., or THL Partners, under which THL Partners has granted to the Company and the Advisor a non-exclusive, personal, revocable, worldwide, non-transferable license to use the trade name and service mark THL, which is a proprietary mark of THL Partners, for specified purposes in connection with the Company’s and the Advisor’s respective businesses. This license agreement is royalty-free, which means the Company is not charged a fee for its use of the trade name and service mark THL. The license agreement is terminable either in its entirety or with respect to the Company or the Advisor by THL Partners at any time in its sole discretion upon 60 days prior written notice, and is also terminable with respect to either the Company or the Advisor by THL Partners in the case of certain events of non-compliance. After the expiration of its first one year term, the entire license agreement is terminable by either the Company or the Advisor at the Company or its sole discretion upon 60 days prior written notice. Upon termination of the license agreement, the Company and the Advisor must cease to use the name and mark THL, including any use in the Company’s respective legal names, filings, listings and other uses that may require the Company to withdraw or replace the Company’s names and marks. Other than with respect to the limited rights contained in the license agreement, the Company and the Advisor have no right to use, or other rights in respect of, the THL name and mark. The Company is an entity operated independently from THL Partners, and third parties who deal with the Company have no recourse against THL Partners.
Due To and From Affiliates
The Advisor paid certain other general and administrative expenses on behalf of the Company. As of December 31, 2013 and December 31, 2012, $14 and $0, respectively, of expenses were included in due to affiliate on the Consolidated Statements of Assets and Liabilities.
The Company acts as the investment adviser to Greenway and Greenway II and is entitled to receive certain fees. As a result, Greenway and Greenway II are classified as affiliates of the Company. As of December 31, 2013 and December 31, 2012, $1,011 and $411 of total fees related to Greenway and Greenway II, respectively, were included in due from affiliate on the Consolidated Statements of Assets and Liabilities. As of December 31, 2013 and 2012, $463 and $0 was included in due to affiliate on the Consolidated Statements of Assets and Liabilities related to the portion of the escrow receivable, due to THL Corporate Finance, Inc., as the administrative agent, to Greenway.
4. Realized Gains and Losses on Investments
The Company recognized net realized gains on its portfolio investments of $2,604 during the year ended December 31, 2013 related primarily to distributions from equity investments. The Company recognized realized gains on its portfolio investments during the years ended December 31, 2012 and 2011 of $353 and $979, respectively.
131
Table of Contents
5. Net Increase in Net Assets Per Share Resulting from Operations
The following information sets forth the computation of basic and diluted net increase in net assets per share resulting from operations:
| For the ended December 31, | ||||||||||||
| 2013 | 2012 | 2011 | ||||||||||
| Numerator—net increase in net assets resulting from operations: |
$ | 42,678 | $ | 27,617 | $ | 24,135 | ||||||
| Denominator—basic and diluted weighted average common shares: |
30,287 | 21,852 | 20,167 | |||||||||
| Basic and diluted net increase in net assets per common share resulting from operations: |
$ | 1.41 | $ | 1.26 | $ | 1.20 | ||||||
Diluted net increase in net assets per share resulting from operations equals basic net increase in net assets per share resulting from operations for each period because there were no common stock equivalents outstanding during the above periods.
6. Credit Facility
There is $232,000 available to borrow under the Company’s revolving credit agreement, or Revolving Facility, and $93,000 million available to borrow under the Company’s term loan agreement, or Term Loan Facility.
The Revolving Facility has a maturity date of May 2017 (with a one year term out period beginning in May 2016). The one year term out period is the one year anniversary between the revolver termination date, or the end of the availability period, and the maturity date. During this time, the Company is required to make mandatory prepayments on its loans from the proceeds it receive from the sale of assets, extraordinary receipts, returns of capital or the issuances of equity or debt. The Revolving Facility has an interest rate of (i) when the facility is more than or equal to 35% drawn and the step-down condition is satisfied, LIBOR plus 2.75%, (ii) when the facility is more than or equal to 35% drawn and the step-down condition is not satisfied, LIBOR plus 3.00%, (iii) when the facility is less than 35% drawn and the step-down condition is satisfied, LIBOR plus 2.75%, and (iv) when the facility is less than 35% drawn and the step-down condition is not satisfied, LIBOR plus 3.25%. The non-use fee is 1.00% annually if the Company uses 35% or less of the Revolving Facility and 0.50% annually if the Company uses more than 35% of the Revolving Facility. The Company elects the LIBOR rate on the loans outstanding on our Revolving Facility, which can have a maturity date that is one, two, three or six months. The LIBOR rate on the borrowings outstanding on its Revolving Facility currently has a one month maturity.
The Term Loan Facility has a maturity date of May 2018. The Term Loan bears interest at LIBOR plus 4.00% (with no LIBOR Floor) and has substantially similar terms to our existing Revolving Facility (as amended by the Amendment). The Company elects the LIBOR rate on our Term Loan, which can have a maturity date that is one, two, three or six months. The LIBOR rate on its Term Loan currently has a one month maturity.
Each of the Facilities includes an accordion feature permitting the Company to expand the Facilities, if certain conditions are satisfied; provided, however, that the aggregate amount of the Facilities, collectively, is capped at $400,000.
The Facilities generally require payment of interest on a quarterly basis for ABR loans (commonly based on the Prime Rate or the Federal Funds Rate), and at the end of the applicable interest period for Eurocurrency loans bearing interest at LIBOR, the interest rate benchmark used to determine the variable rates paid on the Facilities. LIBOR maturities can range between one and six months at the election of the Company. All outstanding principal is due upon each maturity date. The Facilities also require a mandatory prepayment of interest and principal upon certain customary triggering events (including, without limitation, the disposition of assets or the issuance of certain securities).
132
Table of Contents
Borrowings under the Facilities are subject to, among other things, a minimum borrowing/collateral base. The Facilities have certain collateral requirements and/or financial covenants, including covenants related to: (a) limitations on the incurrence of additional indebtedness and liens, (b) limitations on certain investments, (c) limitations on certain restricted payments, (d) limitations on the creation or existence of agreements that prohibit liens on certain properties of the Company and its subsidiaries, and (e) compliance with certain financial maintenance standards including (i) minimum stockholders’ equity, (ii) a ratio of total assets (less total liabilities not represented by senior securities) to the aggregate amount of senior securities representing indebtedness, of the Company and its subsidiaries, of not less than 2.25:1.0, (iii) minimum liquidity, (iv) minimum net worth, and (v) a consolidated interest coverage ratio. In addition to the financial maintenance standards, described in the preceding sentence, borrowings under the Facilities (and the incurrence of certain other permitted debt) are subject to compliance with a borrowing base that applies different advance rates to different types of assets in the Company’s portfolio.
The Facilities’ documents also include default provisions such as the failure to make timely payments under the Facilities, the occurrence of a change in control, and the failure by the Company to materially perform under the operative agreements governing the Facilities, which, if not complied with, could, at the option of the lenders under the Facilities, accelerate repayment under the Facilities, thereby materially and adversely affecting the Company’s liquidity, financial condition and results of operations. Each loan originated under the Revolving Facility is subject to the satisfaction of certain conditions. The Company cannot be assured that it will be able to borrow funds under the Revolving Facility at any particular time or at all. The Company is currently in compliance with all financial covenants under the Facilities.
For the year ended December 31, 2013, the Company borrowed $453,700 and repaid $299,400 under the Facilities. For the year ended December 31, 2012, the Company borrowed $189,900 and repaid $144,900 under the Facilities. For the year ended December 31, 2011, the Company borrowed $28,500 and repaid $23,500 under the Facilities.
The following shows a summary of our Revolving Facility and Term Loan Facility as of December 31, 2013 and 2012:
| As of December 31, 2013 |
|
|||||||||||
| Facility |
Commitments | Borrowings Outstanding |
Weighted Average Interest Rate |
|||||||||
| Revolving Facility |
$ | 232,000 | $ | 111,300 | 3.19 | % | ||||||
| Term Loan Facility |
93,000 | 93,000 | 4.17 | % | ||||||||
|
|
|
|
|
|
|
|||||||
| Total |
$ | 325,000 | $ | 204,300 | 3.63 | % | ||||||
|
|
|
|
|
|
|
|||||||
| As of December 31, 2012 |
||||||||||||
| Facility |
Commitments | Borrowings Outstanding |
Weighted Average Interest Rate |
|||||||||
| Revolving Facility |
$ | 140,000 | $ | — | — | |||||||
| Term Loan Facility |
50,000 | 50,000 | 4.21 | % | ||||||||
|
|
|
|
|
|
|
|||||||
| Total |
$ | 190,000 | $ | 50,000 | 4.21 | % | ||||||
|
|
|
|
|
|
|
|||||||
As of December 31, 2013 and December 31, 2012, the carrying amount of the Company’s outstanding Facilities approximated fair value. The fair values of the Company’s Facilities are determined in accordance with ASC 820, which defines fair value in terms of the price that would be paid to transfer a liability in an orderly transaction between market participants at the measurement date under current market conditions. The fair value of the Company’s Facilities are estimated based upon market interest rates and entities with similar credit risk. As of December 31, 2013 and December 31, 2012, the Facilities would be deemed to be level 3 of the fair value hierarchy.
133
Table of Contents
Interest expense and related fees, excluding amortization of deferred financing costs, of $5,623, $3,138 and $1,043 were incurred in connection with the Facilities during the years ended December 31, 2013, 2012 and 2011, respectively.
In accordance with the 1940 Act, with certain exceptions, the Company is only allowed to borrow amounts such that its asset coverage, as defined in the 1940 Act, is at least 200% after such borrowing. The asset coverage as of December 31, 2013 is in excess of 200%.
7. Interest Rate Derivative
On May 10, 2012, the Company entered into a five-year interest rate swap agreement, or swap agreement, with ING Capital Markets, LLC in connection with its Term Loan Facility. Under the swap agreement, with a notional value of $50,000, the Company pays a fixed rate of 1.1425% and receives a floating rate based upon the current three-month LIBOR rate. The Company entered into the swap agreement to manage interest rate risk and not for speculative purposes.
The Company records the change in valuation of the swap agreement in unrealized appreciation (depreciation) as of each measurement period. When the quarterly interest rate swap amounts are paid or received under the swap agreement, the amounts are recorded as a realized gain (loss) through interest rate derivative periodic interest payments, net on the Consolidated Statement of Operations.
The Company recognized a realized loss for years ended December 31, 2013 and 2012 of $433 and $180, respectively, which is reflected as interest rate derivative periodic interest payments, net on the Consolidated Statements of Operations.
For the years ended December 31, 2013 and 2012, the Company recognized $769 and $(1,053), respectively, of net change in unrealized depreciation from the swap agreement, which is listed under net change in unrealized depreciation on interest rate derivative in the Consolidated Statements of Operations. As of December 31, 2013 and December 31, 2012, the Company’s fair value of its swap agreement is ($284) and ($1,053), respectively, which is listed as an interest rate derivative liability on the Consolidated Statements of Assets and Liabilities.
8. Commitments and Contingencies
From time to time, the Company, or the Advisor, may become party to legal proceedings in the ordinary course of business, including proceedings related to the enforcement of our rights under contracts with our portfolio companies. Neither the Company, nor the Advisor, is currently subject to any material legal proceedings. A claim against the escrow receivable is proceeding to arbitration. There is a risk that some or all of the $1.8 million escrow receivable as of December 31, 2013 might not ultimately be collectible.
Unfunded commitments to provide funds to portfolio companies are not reflected on the Company’s Consolidated Statements of Assets and Liabilities. The Company’s unfunded commitments may be significant from time to time. These commitments will be subject to the same underwriting and ongoing portfolio maintenance as are the on-balance sheet financial instruments that the Company holds. Since these commitments may expire without being drawn upon, the total commitment amount does not necessarily represent future cash requirements. The Company intends to use cash flow from normal and early principal repayments and proceeds from borrowings and offerings to fund these commitments.
As of December 31, 2013 and December 31, 2012, the Company has the following unfunded commitments to portfolio companies:
| As of | ||||||||
| December 31, 2013 | December 31, 2012 | |||||||
| Unfunded revolving commitments |
$ | 9,200 | $ |
10,910 |
| |||
| Unfunded delayed draw and capital expenditure facilities |
9,500 | 12,000 | ||||||
| Unfunded commitments to investments in funds |
3,970 | 3,980 | ||||||
|
|
|
|
|
|||||
| Total unfunded commitments |
$ | 22,670 | $ | 26,890 | ||||
|
|
|
|
|
|||||
134
Table of Contents
9. Distributable Taxable Income
The following reconciles net increase in net assets resulting from operations to taxable income:
| For the years ended December 31, | ||||||||
| 2013 | 2012 | |||||||
| Net increase in net assets resulting from operations |
$ | 42,678 | $ | 27,617 | ||||
| Net change in unrealized appreciation on investments |
(309 | ) | 1,241 | |||||
| Provision for taxes on unrealized gain on investments |
1, 960 | 454 | ||||||
| Net change in unrealized depreciation on interest rate derivative |
(769 | ) | 1,053 | |||||
| Expenses not currently deductible and income not currently includable |
704 | 814 | ||||||
| Non-deductible expenses and income not includable |
150 | 69 | ||||||
|
|
|
|
|
|||||
| Taxable income before deductions for dividends paid or deemed paid |
$ | 44,414 | $ | 31,248 | ||||
|
|
|
|
|
|||||
The above amount of 2013 taxable income before deductions for dividends is an estimate. Taxable income will be finalized before the Company files its Federal tax return by September 2014.
The tax character of distributions declared and paid in 2013 represented $43,347 from ordinary income, $52 from capital gains and $0 from tax return of capital. The tax character of distributions declared and paid in 2012 represented $28,493 from ordinary income, $918 from capital gains and $0 from tax return of capital. Generally accepted accounting principles require adjustments to certain components of net assets to reflect permanent differences between financial and tax reporting. These adjustments have no affect on net asset value per share. Permanent differences between financial and tax reporting at December 31, 2013, 2012, and 2011 were $150, $223, and $69, respectively.
For the years ended December 31, 2013 and 2012, the Company recorded the following adjustments for permanent book to tax differences to reflect their tax characteristics. The adjustments only change the classification in net assets in the Consolidated Statements of Assets and Liabilities.
| Years ended December 31, | ||||||||
| 2013 | 2012 | |||||||
| Accumulated undistributed net realized gains |
$ | (529 | ) | $ | (5 | ) | ||
| Accumulated undistributed net investment income |
$ | 379 | $ | 228 | ||||
| Paid-in capital in excess of par |
$ | (150 | ) | $ | (223 | ) | ||
At December 31, 2013 and 2012, the cost of investments for tax purposes was $647,021 and $391,797, respectively, resulting in net unrealized appreciation of $1,846 and $2,552, respectively. There was no unrealized depreciation in the Company’s investments at December 31, 2013 and 2012. At December 31, 2013 and 2012, the Company had no net capital loss carry forwards.
10. Dividends
The Company has elected to be taxed as a RIC under Subchapter M of the Code. In order to maintain its status as a RIC, it is required to distribute annually to its stockholders at least 90% of its investment company taxable income, as defined by the Code. To avoid a 4% excise tax on undistributed earnings, the Company is required to distribute each calendar year the sum of (i) 98% of its ordinary income for such calendar year (ii) 98.2% of its net capital gains for the one-year period ending October 31 of that calendar year (iii) any income recognized, but not distributed, in preceding years and on which the Company paid no federal income tax. The Company intends to make distributions to stockholders on a quarterly basis of substantially all of its net investment income. In addition, although the Company intends to make distributions of net realized capital gains, if any, at least annually, out of assets legally available for such distributions, it may in the future decide to retain such capital gains for investment.
135
Table of Contents
In addition, the Company may be limited in its ability to make distributions due to the BDC asset coverage test for borrowings applicable to the Company as a BDC under the 1940 Act.
The following table summarizes the Company’s dividends declared and paid or to be paid on all shares:
| Date Declared | Record Date | Payment Date | Amount Per Share | |||
| August 5, 2010 |
September 2, 2010 | September 30, 2010 | $0.05 | |||
| November 4, 2010 |
November 30, 2010 | December 28, 2010 | $0.10 | |||
| December 14, 2010 |
December 31, 2010 | January 28, 2011 | $0.15 | |||
| March 10, 2011 |
March 25, 2011 | March 31, 2011 | $0.23 | |||
| May 5, 2011 |
June 15, 2011 | June 30, 2011 | $0.25 | |||
| July 28, 2011 |
September 15, 2011 | September 30, 2011 | $0.26 | |||
| October 27, 2011 |
December 15, 2011 | December 30, 2011 | $0.28 | |||
| March 6, 2012 |
March 20, 2012 | March 30, 2012 | $0.29 | |||
| March 6, 2012 |
March 20, 2012 | March 30, 2012 | $0.05 | |||
| May 2, 2012 |
June 15, 2012 | June 29, 2012 | $0.30 | |||
| July 26, 2012 |
September 14, 2012 | September 28, 2012 | $0.32 | |||
| November 2, 2012 |
December 14, 2012 | December 28, 2012 | $0.33 | |||
| December 20, 2012 |
December 31, 2012 | January 28, 2013 | $0.05 | |||
| February 27, 2013 |
March 15, 2013 | March 29, 2013 | $0.33 | |||
| May 2, 2013 |
June 14, 2013 | June 28, 2013 | $0.34 | |||
| August 2, 2013 |
September 16, 2013 | September 30, 2013 | $0.34 | |||
| August 2, 2013 |
September 16, 2013 | September 30, 2013 | $ 0.08 | |||
| October 30, 2013 |
December 16, 2013 | December 31, 2013 | $0.34 | |||
| March 4, 2014 |
March 17, 2014 | March 31, 2014 | $0.34 |
The Company may not be able to achieve operating results that will allow it to make distributions at a specific level or to increase the amount of these distributions from time to time. If the Company does not distribute a certain percentage of its income annually, it will suffer adverse tax consequences, including possible loss of its status as a regulated investment company. The Company cannot assure stockholders that they will receive any distributions at a particular level.
The Company maintains an “opt in” dividend reinvestment plan for our common stockholders. As a result, unless stockholders specifically elect to have their dividends automatically reinvested in additional shares of common stock, stockholders will receive all such dividends in cash. There were no dividends reinvested for the year ended December 31, 2013 under the dividend reinvestment plan. With respect to our dividends and distributions paid to stockholders during the years ended December 31, 2012, and 2011 dividends reinvested pursuant to our dividend reinvestment plan totaled $26 and $4,048,597, respectively.
Under the terms of our dividend reinvestment plan, dividends will primarily be paid in newly issued shares of common stock. However, the Company reserves the right to purchase shares in the open market in connection with the implementation of the plan. This feature of the plan means that, under certain circumstances, the Company may issue shares of our common stock at a price below net asset value per share, which could cause our stockholders to experience dilution.
Distributions in excess of our current and accumulated profits and earnings would be treated first as a return of capital to the extent of the stockholder’s tax basis, and any remaining distributions would be treated as a capital gain. The determination of the tax attributes of our distributions will be made annually as of the end of our fiscal year based upon our taxable income for the full year and distributions paid for the full year. Therefore, a determination made on a quarterly basis may not be representative of the actual tax attributes of our distributions for a full year. Each year, a statement on Form 1099-DIV identifying the source of the distribution will be mailed to our stockholders.
136
Table of Contents
11. Financial Highlights
| For the years ended December 31, | ||||||||||||||||
| 2013 | 2012 | 2011 | 2010 | |||||||||||||
| Per Share Data:(5) |
||||||||||||||||
| Net asset value, beginning of period |
$ | 13.20 | $ | 13.24 | $ | 13.06 | $ | 12.99 | ||||||||
| Net investment income, after taxes(1) |
1.37 | 1.38 | 1.04 | 0.31 | ||||||||||||
| Net realized (loss) gains on investments(1) |
0.09 | 0.01 | 0.05 | — | ||||||||||||
| Net change in unrealized appreciation on investments(1) (2) |
0.01 | (0.06 | ) | 0.11 | 0.06 | |||||||||||
| Provision for taxes on unrealized appreciation on investments(1)(3) |
(0.07 | ) | (0.02 | ) | — | — | ||||||||||
| Net change in unrealized (depreciation) appreciation of interest rate derivative(1)(3) |
0.02 | (0.06 | ) | — | — | |||||||||||
| Interest rate derivative periodic interest payments, net(1) |
(0.01 | ) | — | — | — | |||||||||||
|
|
|
|
|
|
|
|
|
|||||||||
| Net increase in net assets resulting from operations(3) |
1.41 | 1.25 | 1.20 | 0.37 | ||||||||||||
| Accretive effect of share issuance |
0.18 | 0.05 | — | — | ||||||||||||
| Distributions to stockholders from net investment income |
(1.42 | ) | (1.29 | ) | (1.02 | ) | (0.30 | ) | ||||||||
| Distributions to stockholders from net realized gains |
(0.01 | ) | (0.05 | ) | — | — | ||||||||||
|
|
|
|
|
|
|
|
|
|||||||||
| Net asset value, end of period |
$ | 13.36 | $ | 13.20 | $ | 13.24 | $ | 13.06 | ||||||||
|
|
|
|
|
|
|
|
|
|||||||||
| Per share market value at end of period(5) |
$ | 16.49 | $ | 14.79 | $ | 12.21 | $ | 13.01 | ||||||||
| Total return(4)(5) |
22.10 | % | 33.43 | % | 1.87 | % | 2.38 | % | ||||||||
| Shares outstanding at end of period(5) |
33,905 | 26,315 | 20,220 | 19,916 | ||||||||||||
| Ratio/Supplemental Data(5): |
||||||||||||||||
| Net assets at end of period |
$ | 452,942 | $ | 347,484 | $ | 267,617 | $ | 260,016 | ||||||||
| Ratio of operating expenses to average net assets |
8.24 | % | 8.08 | % | 6.18 | % | 3.44 | % | ||||||||
| Ratio of net investment income to average net assets |
10.25 | % | 10.39 | % | 7.94 | % | 3.39 | % | ||||||||
| Portfolio turnover |
33.09 | % | 53.95 | % | 15.43 | % | 8.63 | % | ||||||||
| (1) | Calculated based on weighted average common shares outstanding. |
| (2) | Net change in unrealized appreciation of investments includes the effect of rounding on a per share basis. |
| (3) | Includes the cumulative effect of rounding. |
| (4) | Total return is based on the change in market price per share during the period. Total return takes into account dividends and distributions, if any, reinvested in accordance with the Company’s dividend reinvestment plan. The Company has revised the previously reported total return of 27.10% to 33.43% for the year ended December 31, 2012 to correct for an error related to the exclusion of assumed dividend reinvestments in periods during which there were no actual reinvestments. This change was determined not to be material to the financial statements taken as a whole. |
| (5) | Financial highlights for the period from May 26, 2009 (inception) through December 31, 2009 are not presented as the Company’s operations were limited to organization and offering activities only. |
12. Subsequent Events
From January 1, 2014 through March 7, 2014, the Company settled five new investments for a total of $39,909 in the transportation, energy and utilities, food and beverage and financial services industries. Of the $39,909 of new investments 43.7% were first lien senior secured debt, 50.1% were second lien debt, 4.1% were equity investments and 2.1% were investments in funds. All of the new debt investments were floating rate and had a weighted average yield based upon cost at the time of the investment of 10.2%. One of the new investments had a remaining unfunded commitment of $4,588.
From January 1, 2014 through March 7, 2014, THL Credit received proceeds of $28.8 million from prepayments or sales of investments in eight companies in the IT services, financial services, healthcare and
137
Table of Contents
manufacturing industries, including prepayment premiums of $0.3 million. Of the aggregate principal amount of investments prepaid or sold, 5.8% were first lien senior secured debt, 57.9% were subordinated debt, 29.3% were investment in funds, 3.7% were CLO residual interests and 3.3% was an equity investment. Of the debt investments prepaid, 9.1% were floating rate and 90.9% were fixed rate with a PIK election.
From January 1, 2014 through March 7, 2014, the Company received proceeds of $2.8 million from its equity investments in YP and Surgery. The character of these proceeds as dividends or capital gains will be determined in connection with closing of the first quarter of 2014.
On March 4, 2014, the Company’s investment management agreement was re-approved by its board of directors.
On March 4, 2014, the Company’s board of directors declared a dividend of $0.34 per share payable on March 31, 2014 to stockholders of record at the close of business on March 17, 2014.
138
Table of Contents
| Item 9. | Changes in and Disagreements with Accountants on Accounting and Financial Disclosure |
None.
| Item 9A. | Controls and Procedures |
(a) Evaluation of Disclosure Controls and Procedures
Our Chief Executive Officer and Chief Financial Officer, under the supervision and with the participation of our management, conducted an evaluation of our disclosure controls and procedures, as defined in Rule 13a-15(e) and 15d-15(e) of the Securities Exchange Act of 1934. As of the end of the period covered by this annual report on Form 10-K, our Chief Executive Officer and Chief Financial Officer have concluded that our disclosure controls and procedures were effective to ensure that information required to be disclosed by us in reports that we file or submit under the Securities Exchange Act of 1934 is recorded, processed, summarized, and reported within the time periods specified in the SEC’s rules and forms, and that information required to be disclosed by us in the reports that we file or submit under the Securities Exchange Act of 1934 is accumulated and communicated to our management, including our Chief Executive Officer and Chief Financial Officer, as appropriate to allow timely decisions regarding required disclosure.
(b) Management’s Report on Internal Control Over Financial Reporting
The management of THL Credit, Inc. and its Subsidiaries (except where the context suggests otherwise, the terms “we,” “us,” “our,” and “THL Credit” refer to THL Credit, Inc. and its Subsidiaries) is responsible for establishing and maintaining adequate internal control over financial reporting as such term is defined in Exchange Act Rule 13a-15(f), and for performing an assessment of the effectiveness of internal control over financial reporting as of December 31, 2013. Internal control over financial reporting is a process designed by, or under the supervision of, our principal executive and principal financial officers, or persons performing similar functions, and effected by our board of directors, management and other personnel, to provide reasonable assurance regarding the reliability of financial reporting and the preparation of financial statements for external purposes in accordance with generally accepted accounting principles. Our internal control over financial reporting includes those policies and procedures that (i) pertain to the maintenance of records that in reasonable detail accurately and fairly reflect the transactions and dispositions of assets of the company; (ii) provide reasonable assurance that transactions are recorded as necessary to permit preparation of financial statements in accordance with generally accepted accounting principles, and that receipts and expenditures are being made only in accordance with authorizations; and (iii) provide reasonable assurance regarding prevention or timely detection of unauthorized acquisition, use, or disposition of our assets that could have a material effect on the financial statements.
Because of its inherent limitations, internal control over financial reporting may not prevent or detect misstatements. Therefore, even those systems determined to be effective can provide only reasonable assurance with respect to financial statement preparation and presentation.
Management performed an assessment of the effectiveness of our internal control over financial reporting as of December 31, 2013 based upon the criteria set forth in Internal Control — Integrated Framework (1992) issued by the Committee of Sponsoring Organizations of the Treadway Commission (“COSO”). Based on our assessment, management determined that our internal control over financial reporting was effective as of December 31, 2013.
(c) Report of the Independent Registered Public Accounting Firm
The effectiveness of our internal control over financial reporting as of December 31, 2013 has been audited by PricewaterhouseCoopers LLP, an independent registered public accounting firm, as stated in their report which appears herein.
139
Table of Contents
(d) Changes in Internal Control Over Financial Reporting
There have been no changes in our internal control over financial reporting, as defined in Rules 13a-15(f) and 15d-15(f) of the Securities Exchange Act of 1934 that occurred during our most recently completed fiscal quarter that have materially affected, or are reasonably likely to materially affect, our internal control over financial reporting.
| Item 9B. | Other Information |
Effective March 4, 2014, Christopher J. Flynn, Managing Directors, assumed the position of Co-President and will serve alongside our current Co-Presidents, W. Hunter Stropp and Sam W. Tillinghast. Prior to his appointment as Co-President, Mr. Flynn, 41, served as a Managing Director at THL Credit and THL Credit Advisors. Prior to joining THL Credit in 2007, Mr. Flynn was previously a Vice President at AIG in the Leveraged Capital Group. Mr. Flynn joined AIG in February 2005 after working for Black Diamond Capital Management, a hedge fund with offices in Illinois and Connecticut. Mr. Flynn was a Senior Financial Analyst at Black Diamond where he was responsible for underwriting new debt investment opportunities as well as monitoring a portfolio of leveraged loans. From 2000 to 2003, Mr. Flynn worked in a variety of roles at GE Capital, lastly as an Assistant Vice President within the Capital Markets Syndication Group. Prior to joining GE Capital, Mr. Flynn worked at BNP Paribas as a financial analyst and at Bank One as a commercial banker. Mr. Flynn earned his MBA with a concentration in finance and strategy from Northwestern University’s Kellogg Graduate School of Business and his BA in Finance from DePaul University.
There is no arrangement or understanding between Mr. Flynn and any other person pursuant to which he was appointed as Co-President, nor is there any family relationship between Mr. Flynn and any of our directors or other executive officers. There are no transactions since the beginning of our last fiscal year, or any currently proposed transaction, in which we are a participant, the amount involved exceeds $120,000, and in which Mr. Flynn had, or will have, a direct or indirect material interest.
Effective March 4, 2014, Stephanie Paré Sullivan, our General Counsel, assumed the position of Chief Legal Officer and General Counsel. Prior to her appointment as Chief Legal Officer and General Counsel, Ms. Sullivan, 41, served as the General Counsel and Chief Compliance Officer of THL Credit and THL Credit Advisors and the General Counsel of THL Credit SLS. Prior to joining THL Credit in early 2010, Ms. Sullivan was a partner in the law firm of Goodwin Procter LLP, where she worked from 1997 to 2010, primarily focusing on mergers and acquisitions, private equity transactions and the representation of early- and later-stage growth companies. Ms. Sullivan received her BA from Williams College and her JD from New York University School of Law.
There is no arrangement or understanding between Ms. Sullivan and any other person pursuant to which she was appointed as Chief Legal Officer and General Counsel, nor is there any family relationship between Ms. Sullivan and any of our directors or other executive officers. There are no transactions since the beginning of our last fiscal year, or any currently proposed transaction, in which we are a participant, the amount involved exceeds $120,000, and in which Ms. Sullivan had, or will have, a direct or indirect material interest.
140
Table of Contents
We will file a definitive Proxy Statement for our 2014 Annual Meeting of Stockholders with the Securities and Exchange Commission pursuant to Regulation 14A, not later than 120 days after the end of our fiscal year. Accordingly, certain information required by Part III has been omitted under General Instruction G(3) to Form 10-K. Only those sections of our definitive Proxy Statement that specifically address the items set forth herein are incorporated by reference.
| Item 10. | Directors, Executive Officers and Corporate Governance |
The information required by Item 10 is hereby incorporated by reference from our definitive Proxy Statement relating to our 2014 Annual Meeting of Stockholders, to be filed with the Securities and Exchange Commission within 120 days following the end of our fiscal year.
| Item 11. | Executive Compensation |
The information required by Item 11 is hereby incorporated by reference from our definitive Proxy Statement relating to our 2014 Annual Meeting of Stockholders, to be filed with the Securities and Exchange Commission within 120 days following the end of our fiscal year.
| Item 12. | Security Ownership of Certain Beneficial Owners and Management and Related Stockholder Matters |
The information required by Item 12 is hereby incorporated by reference from our definitive Proxy Statement relating to our 2014 Annual Meeting of Stockholders, to be filed with the Securities and Exchange Commission within 120 days following the end of our fiscal year.
| Item 13. | Certain Relationships and Related Transactions, and Director Independence. |
The information required by Item 13 is hereby incorporated by reference from our definitive Proxy Statement relating to our 2014 Annual Meeting of Stockholders, to be filed with the Securities and Exchange Commission within 120 days following the end of our fiscal year.
| Item 14. | Principal Accountant Fees and Services |
The information required by Item 14 is hereby incorporated by reference from our definitive Proxy Statement relating to our 2014 Annual Meeting of Stockholders, to be filed with the Securities and Exchange Commission within 120 days following the end of our fiscal year.
141
Table of Contents
| Item 15. | Exhibits and Financial Statement Schedules |
The following documents are filed or incorporated by reference as part of this Annual Report:
1. Consolidated Financial Statements
2. Financial Statement Schedule
None.
3. Exhibits required to be filed by Item 601 of Regulation S-K
Please note that the agreements included as exhibits to this Form 10-K are included to provide information regarding their terms and are not intended to provide any other factual or disclosure information about us or the other parties to the agreements. The agreements contain representations and warranties by each of the parties to the applicable agreement that have been made solely for the benefit of the other parties to the applicable agreement and may not describe the actual state of affairs as of the date they were made or at any other time.
The following exhibits are filed as part of this report or hereby incorporated by reference to exhibits previously filed with the SEC:
| 3.1 |
Amended and Restated Certificate of Incorporation (Incorporated by reference from the Registrant’s pre-effective Amendment No. 4 to the Registration Statement under the Securities Act of 1933, as amended, on Form N-2, filed on April 20, 2010) | |
| 3.2 | Amended and Restated Certificate of Incorporation (Incorporated by reference from the Registrant’s Certificate of Amendment filed on June 7, 2012) | |
| 3.3 | Bylaws (Incorporated by reference from the Registrant’s pre-effective Amendment No. 1 to the Registration Statement under the Securities Act of 1933, as amended, on Form N-2, filed on July 15, 2009) | |
| 4 | Form of Specimen Certificate (Incorporated by reference from the Registrant’s pre-effective Amendment No. 4 to the Registration Statement under the Securities Act of 1933, as amended, on Form N-2, filed on April 20, 2010) | |
| 10.1 | Dividend Reinvestment Plan (Incorporated by reference from the Registrant’s Quarterly Report on Form 10-Q, filed on August 9, 2010) | |
| 10.2 | Investment Management Agreement (Incorporated by reference from the Registrant’s pre-effective Amendment No. 4 to the Registration Statement under the Securities Act of 1933, as amended, on Form N-2, filed on April 20, 2010) | |
142
Table of Contents
| 10.3 | Purchase Agreement (Incorporated by reference from the Registrant’s Quarterly Report on Form 10-Q, filed on August 9, 2010) | |
| 10.4 | Custodian Agreement (Incorporated by reference from the Registrant’s Quarterly Report on Form 10-Q, filed on August 9, 2010) | |
| 10.5 | Administration Agreement (Incorporated by reference from the Registrant’s pre-effective Amendment No. 4 to the Registration Statement under the Securities Act of 1933, as amended, on Form N-2, filed on April 20, 2010) | |
| 10.6 | Sub-Administration Agreement (Incorporated by reference from the Registrant’s Quarterly Report on Form 10-Q, filed on August 9, 2010) | |
| 10.7 | Purchase and Sale Agreement (Incorporated by reference from the Registrant’s pre-effective Amendment No. 4 to the Registration Statement under the Securities Act of 1933, as amended, on Form N-2, filed on April 20, 2010) | |
| 10.8 | License Agreement (Incorporated by reference from the Registrant’s pre-effective Amendment No. 4 to the Registration Statement under the Securities Act of 1933, as amended, on Form N-2, filed on April 20, 2010) | |
| 10.9 | Subscription Agreement—THL Credit Opportunities, L.P. (Incorporated by reference from the Registrant’s pre-effective Amendment No. 4 to the Registration Statement under the Securities Act of 1933, as amended, on Form N-2, filed on April 20, 2010) | |
| 10.10 | Subscription Agreement—THL Credit Partners BDC Holdings, L.P. (Incorporated by reference from the Registrant’s Quarterly Report on Form 10-Q, filed on August 9, 2010) | |
| 10.11 | Senior Secured Revolving Credit Agreement between THL Credit and ING Capital LLC, dated March 11, 2011 (Incorporated by reference from the Registrant’s Current Report on Form 8-K filed on March 15, 2011) | |
| 10.12 | Amendment No. 1 to Senior Secured Revolving Credit Agreement between THL Credit and ING Capital LLC, dated May 10, 2012 (Incorporated by reference from the Registrant’s Current Report on Form 8-K, filed on May 15, 2012) | |
| 10.13* | Amendment No. 2 to Senior Secured Revolving Credit Agreement between THL Credit and ING Capital LLC, dated February 13, 2013 | |
| 10.14 | Amendment No. 3 to Senior Secured Revolving Credit Agreement between THL Credit and ING Capital LLC, dated March 15, 2013 (Incorporated by reference from the Registrant’s Current Report on Form 8-K, filed on March 20, 2013) | |
| 10.15* | Amendment No. 4 to Senior Secured Revolving Credit Agreement between THL Credit and ING Capital LLC, dated October 9, 2013 | |
| 10.16 | Senior Secured Term Loan Credit Agreement between THL Credit and ING Capital LLC, dated May 10, 2012 (Incorporated by reference from the Registrant’s Current Report on Form 8-K, filed on May 15, 2012) | |
| 10.17* | Amendment No. 1 to Senior Secured Term Loan Agreement between THL Credit and ING Capital LLC, dated February 13, 2013 | |
| 10.18 | Amendment No. 2 to Senior Secured Term Loan Agreement between THL Credit and ING Capital LLC, dated March 15, 2013 (Incorporated by reference from the Registrant’s Current Report on Form 8-K, filed on March 20, 2013) | |
| 10.19* | Amendment No. 3 to Senior Secured Term Loan Agreement between THL Credit and ING Capital LLC, dated October 9, 2013 | |
143
Table of Contents
| 11 | Computation of Per Share Earnings (included in the notes to the financial statements contained in this report). | |
| 14 | Code of Ethics (Incorporated by reference from the Registrant’s pre-effective Amendment No. 4 to the Registration Statement under the Securities Act of 1933, as amended, on Form N-2, filed on April 20, 2010) | |
| 21 | Subsidiaries of the Registrant THL Credit Holdings, Inc.—Delaware THL Corporate Finance, Inc.—Delaware THL Credit SBIC, L.P. —Delaware THL Credit SBIC GP, LLC—Delaware THL Credit AIM Media Holdings, Inc.—Delaware THL Credit YP Holdings, Inc.—Delaware | |
| 31.1 | Certification of Chief Executive Officer Pursuant to Rule 13a-14(a) under the Securities Exchange Act of 1934.* | |
| 31.2 | Certification of Chief Financial Officer Pursuant to Rule 13a-14(a) under the Securities Exchange Act of 1934.* | |
| 32.1 | Certification of Chief Executive Officer Pursuant to 18 U.S.C. Section 1350, as Adopted Pursuant to Section 906 of the Sarbanes-Oxley Act of 2002 (18 U.S.C. 1350).* | |
| 32.2 | Certification of Chief Financial Officer Pursuant to 18 U.S.C. Section 1350, as Adopted Pursuant to Section 906 of the Sarbanes-Oxley Act of 2002 (18 U.S.C. 1350).* | |
| (*) | Filed herewith |
144
Table of Contents
Pursuant to the requirements of Section 13 or 15(d) of the Securities Exchange Act of 1934, the registrant has duly caused this report to be signed on its behalf by the undersigned thereunto duly authorized.
| THL CREDIT, INC. | ||||
| Date: March 7, 2014 | By: |
/S/ JAMES K. HUNT James K. Hunt Chief Executive Officer | ||
Pursuant to the requirements of the Securities Exchange Act of 1934, this report has been signed below by the following persons on behalf of the registrant and in the capacities and on the dates indicated.
| Date: March 7, 2014 |
By: | /S/ JAMES K. HUNT James K. Hunt Chairman of the Board of Directors and Chief Executive Officer (Principal Executive Officer) | ||
| Date: March 7, 2014 |
By: | /S/ TERRENCE W. OLSON Terrence W. Olson Chief Financial Officer (Principal Financial and Accounting Officer) | ||
| Date: March 7, 2014 |
By: | /S/ DAVID K. DOWNES David K. Downes Director | ||
| Date: March 7, 2014 |
By: | /S/ NANCY HAWTHORNE Nancy Hawthorne Director | ||
| Date: March 7, 2014 |
By: | /S/ KEITH W. HUGHES Keith W. Hughes Director | ||
| Date: March 7, 2014 |
By: | /S/ JOHN A. SOMMERS John A. Sommers Director | ||
| Date: March 7, 2014 |
By: | /S/ DAVID P. SOUTHWELL David P. Southwell Director | ||
145