Attached files
| file | filename |
|---|---|
| 8-K - FORM 8-K - First Internet Bancorp | v370765_8k.htm |
NASDAQ: INBK
This presentation may contain forward - looking statements with respect to the financial condition, results of operations, plans, objectives, future performance or business of the company. Forward - looking statements are generally identifiable by the use of words such as “believe,” “expect,” “anticipate,” “plan,” “intend,” “estimate,” “may,” “will,” “would,” “could,” “should” or other similar expressions. Forward - looking statements are not a guarantee of future performance or results, are based on information available at the time the statements are made and involve known and unknown risks, uncertainties and other factors that could cause actual results to differ materially from the information in the forward - looking statements. Factors that may cause such differences include: failures of or interruptions in the communications and information systems on which we rely to conduct our business; our plans to grow our commercial real estate and commercial and industrial loan portfolios; competition with national, regional and community financial institutions; the loss of any key members of senior management; fluctuations in interest rates; general economic conditions; risks relating to the regulation of financial institutions; and other factors identified in reports we file with the SEC. All statements in this presentation, including forward - looking statements, speak only as of the date they are made, and the Company undertakes no obligation to update any statement in light of new information or future events. Safe Harbor Note : This presentation contains, non - GAAP financial measures, including tangible common equity, tangible assets and tangible book v alue per common shares. Reconciliations of these financial measures to the most directly comparable GAAP financial measures are included in the Appen dix of this presentation 1
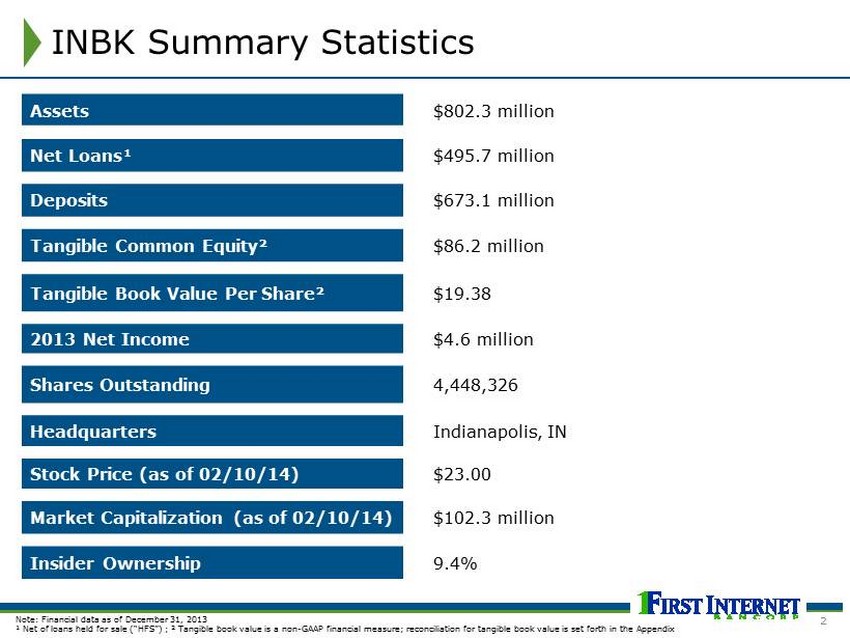
INBK Summary Statistics Assets $802.3 million Net Loans¹ $495.7 million Deposits $673.1 million Tangible Common Equity² $86.2 million Tangible Book Value Per Share² $19.38 2013 Net Income $4.6 million Shares Outstanding 4,448,326 Headquarters Indianapolis, IN Stock Price (as of 02/10/14) $23.00 Market Capitalization (as of 02/10/14) $102.3 million Insider Ownership 9.4% Note : Financial data as of December 31, 2013 ¹ Net of loans held for sale (“HFS”) ; ² Tangible book value is a non - GAAP financial measure; reconciliation for tangible book value is set forth in the Appendix 2
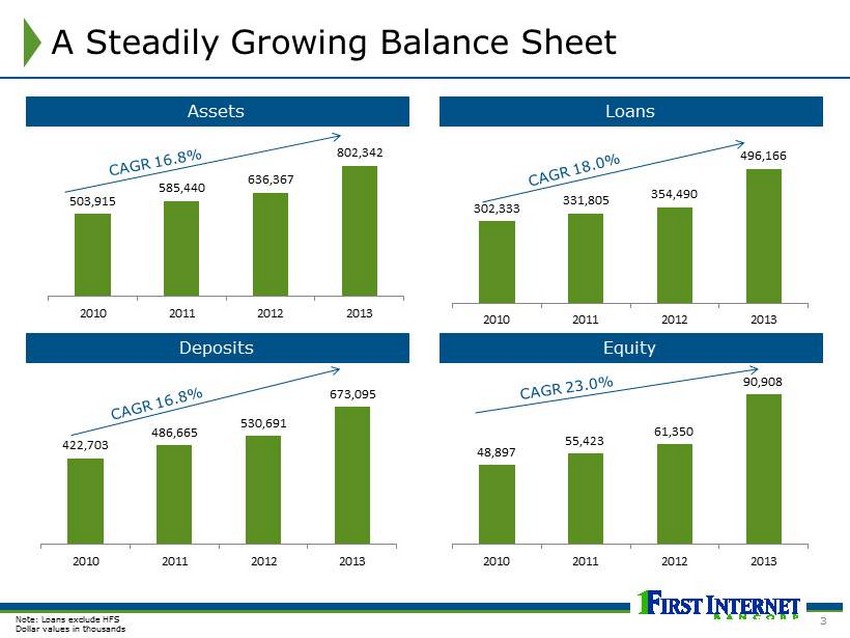
48,897 55,423 61,350 90,908 2010 2011 2012 2013 503,915 585,440 636,367 802,342 2010 2011 2012 2013 422,703 486,665 530,691 673,095 2010 2011 2012 2013 302,333 331,805 354,490 496,166 2010 2011 2012 2013 A Steadily Growing Balance Sheet Assets Loans Deposits Equity Note: L oans exclude HFS Dollar values in thousands 3
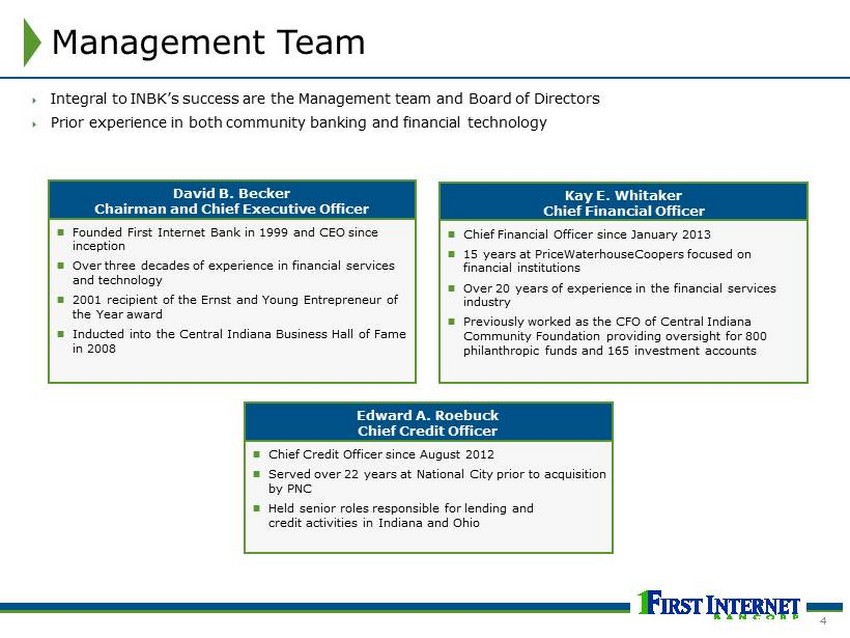
Management Team ; Integral to INBK’s success are the Management team and Board of Directors ; Prior experience in both community banking and financial technology ; Founded First Internet Bank in 1999 and CEO since inception ; Over three decades of experience in financial services and technology ; 2001 recipient of the Ernst and Young Entrepreneur of the Year award ; Inducted into the Central Indiana Business Hall of Fame in 2008 David B. Becker Chairman and Chief Executive Officer ; Chief Financial Officer since January 2013 ; 15 years at PriceWaterhouseCoopers focused on financial institutions ; Over 20 years of experience in the financial services industry ; Previously worked as the CFO of Central Indiana Community Foundation providing oversight for 800 philanthropic funds and 165 investment accounts Kay E. Whitaker Chief Financial Officer ; Chief Credit Officer since August 2012 ; Served over 22 years at National City prior to acquisition by PNC ; Held senior roles responsible for lending and credit activities in Indiana and Ohio Edward A. Roebuck Chief Credit Officer 4
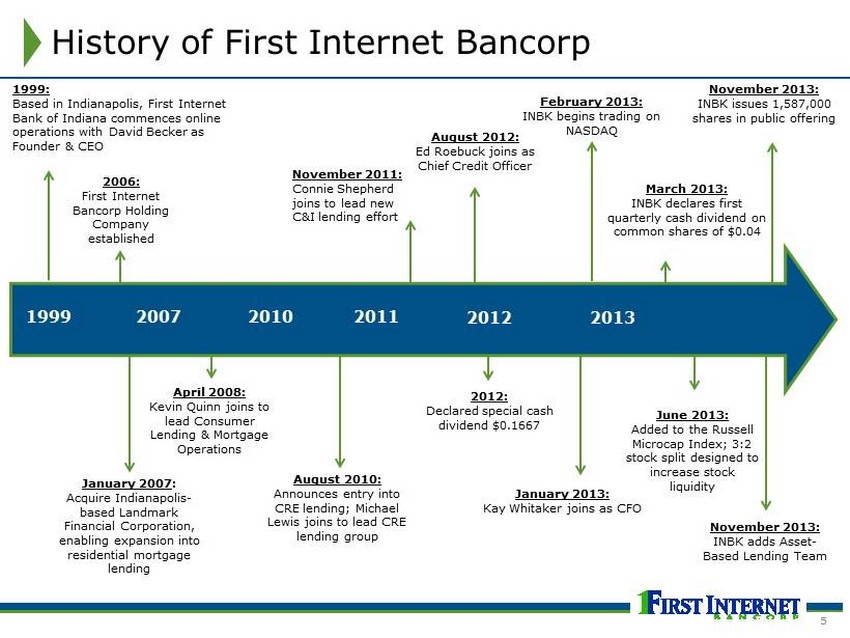
History of First Internet Bancorp 1999 2013 1999: Based in Indianapolis, First Internet Bank of Indiana commences online operations with David Becker as Founder & CEO January 2007 : Acquire Indianapolis - based Landmark Financial Corporation, enabling expansion into residential mortgage lending 2007 2010 2012 August 2010: Announces entry into CRE lending; Michael Lewis joins to lead CRE lending group 2011 November 2011: Connie Shepherd joins to lead new C&I lending effort March 2013: INBK declares first quarterly cash dividend on common shares of $0.04 February 2013: INBK begins trading on NASDAQ 2006: First Internet Bancorp Holding Company established January 2013: Kay Whitaker joins as CFO 2012: Declared special cash dividend $0.1667 June 2013: Added to the Russell Microcap Index; 3:2 stock split designed to increase stock liquidity August 2012: Ed Roebuck joins as Chief Credit Officer April 2008: Kevin Quinn joins to lead Consumer Lending & Mortgage Operations November 2013: INBK adds Asset - Based Lending Team November 2013: INBK issues 1,587,000 shares in public offering 5
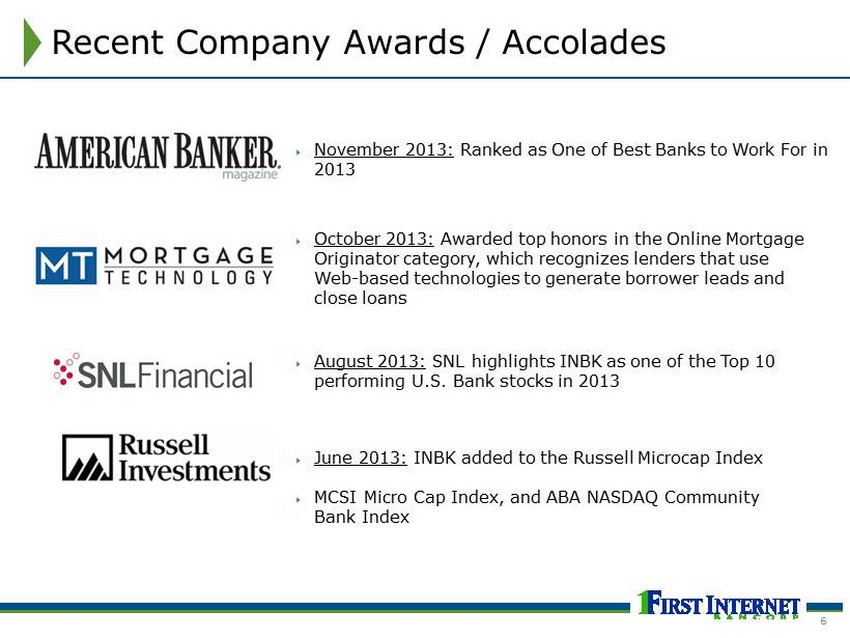
; October 2013: Awarded top honors in the Online Mortgage Originator category, which recognizes lenders that use Web - based technologies to generate borrower leads and close loans ; August 2013: SNL highlights INBK as one of the Top 10 performing U.S. Bank stocks in 2013 Recent Company Awards / Accolades ; June 2013: INBK added to the Russell Microcap Index ; MCSI Micro Cap Index, and ABA NASDAQ Community Bank Index ; November 2013: Ranked as One of Best Banks to Work For in 2013 6
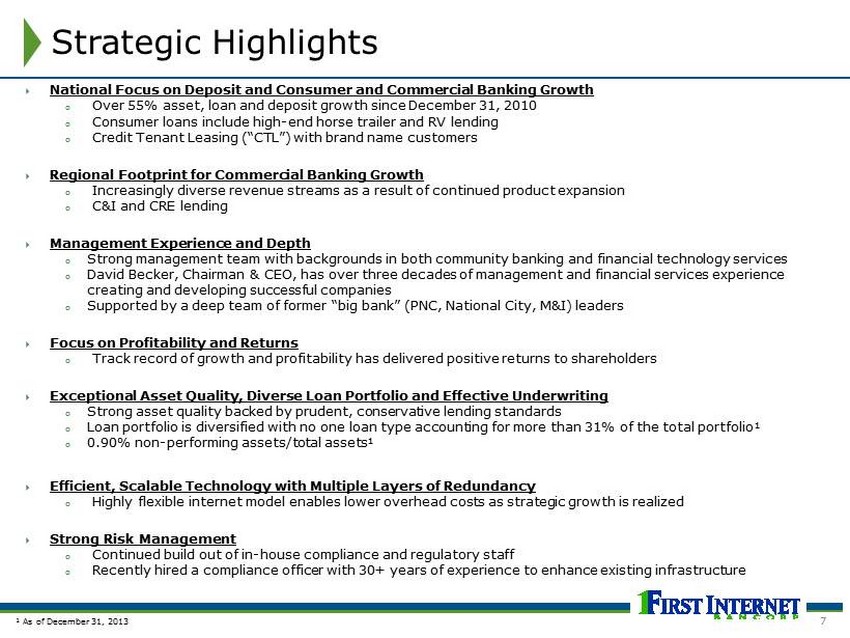
; National Focus on Deposit and Consumer and Commercial Banking Growth o Over 55% asset, loan and deposit growth since December 31, 2010 o Consumer loans include high - end horse trailer and RV lending o Credit Tenant Leasing (“CTL”) with brand name customers ; Regional Footprint for Commercial Banking Growth o Increasingly diverse revenue streams as a result of continued product expansion o C&I and CRE lending ; Management Experience and Depth o Strong management team with backgrounds in both community banking and financial technology services o David Becker, Chairman & CEO, has over three decades of management and financial services experience creating and developing successful companies o Supported by a deep team of former “big bank” (PNC, National City, M&I) leaders ; Focus on Profitability and Returns o Track record of growth and profitability has delivered positive returns to shareholders ; Exceptional Asset Quality, Diverse Loan Portfolio and Effective Underwriting o Strong asset quality backed by prudent, conservative lending standards o Loan portfolio is diversified with no one loan type accounting for more than 31% of the total portfolio¹ o 0.90% non - performing assets/total assets¹ ; Efficient, Scalable Technology with Multiple Layers of Redundancy o Highly flexible internet model enables lower overhead costs as strategic growth is realized ; Strong Risk Management o Continued build out of in - house compliance and regulatory staff o Recently hired a compliance officer with 30+ years of experience to enhance existing infrastructure Strategic Highlights ¹ As of December 31, 2013 7
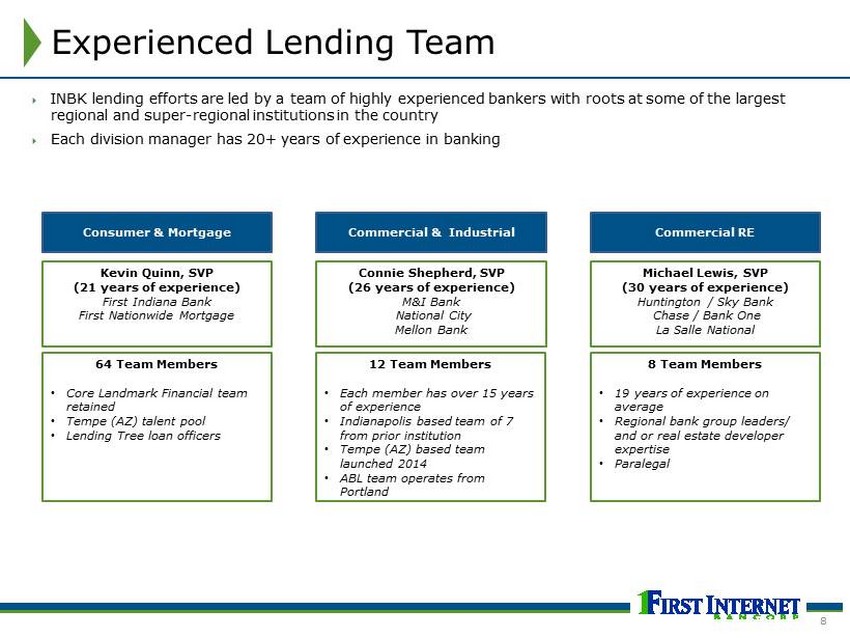
Experienced Lending Team ; INBK lending efforts are led by a team of highly experienced bankers with roots at some of the largest regional and super - regional institutions in the country ; Each division manager has 20+ years of experience in banking Connie Shepherd, SVP (26 years of experience) M&I Bank National City Mellon Bank Michael Lewis, SVP (30 years of experience) Huntington / Sky Bank Chase / Bank One La Salle National Kevin Quinn, SVP (21 years of experience) First Indiana Bank First Nationwide Mortgage Commercial & Industrial Commercial RE Consumer & Mortgage 64 Team Members • Core Landmark Financial team retained • Tempe (AZ) talent pool • Lending Tree loan officers 12 Team Members • Each member has over 15 years of experience • Indianapolis based team of 7 from prior institution • Tempe (AZ) based team launched 2014 • ABL team operates from Portland 8 Team Members • 19 years of experience on average • Regional bank group leaders/ and or real estate developer expertise • Paralegal 8
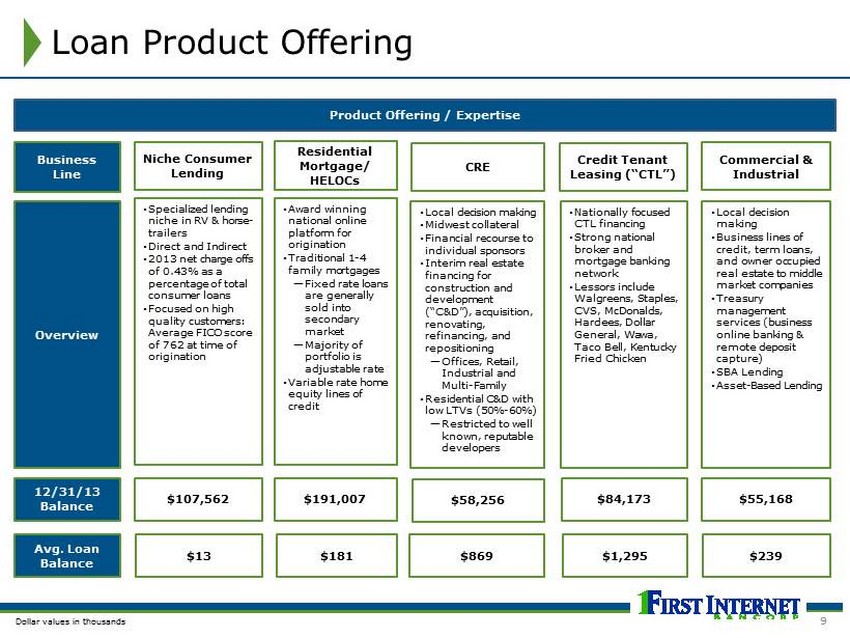
Loan Product Offering Product Offering / Expertise Avg. Loan Balance Business Line 12/31/13 Balance Overview CRE Niche Consumer Lending Residential Mortgage/ HELOCs • Specialized lending niche in RV & horse - trailers • Direct and Indirect • 2013 net charge offs of 0.43% as a percentage of total consumer loans • Focused on high quality customers : Average FICO score of 762 at time of origination • Award winning national online platform for origination • Traditional 1 - 4 family mortgages — Fixed rate loans are generally sold into secondary market — Majority of portfolio is adjustable rate • Variable rate home equity lines of credit $58,256 $107,562 $191,007 $869 $13 $181 • Local decision making • Midwest collateral • Financial r ecourse to individual sponsors • Interim real estate financing for construction and development (“C&D”), acquisition, renovating, refinancing, and repositioning — Offices , Retail, Industrial and Multi - Family • Residential C&D with low LTVs (50% - 60%) — Restricted to well known, reputable developers Dollar values in thousands Credit Tenant Leasing (“CTL”) • Nationally focused CTL financing • Strong national broker and mortgage banking network • Lessors include Walgreens , Staples, CVS, McDonalds, Hardees, Dollar General, Wawa, Taco Bell, Kentucky Fried Chicken $84,173 $1,295 • Local decision making • Business lines of credit, term loans, and owner occupied real estate to middle market companies • Treasury management services (business online banking & remote deposit capture) • SBA Lending • Asset - Based Lending Commercial & Industrial $55,168 $239 9
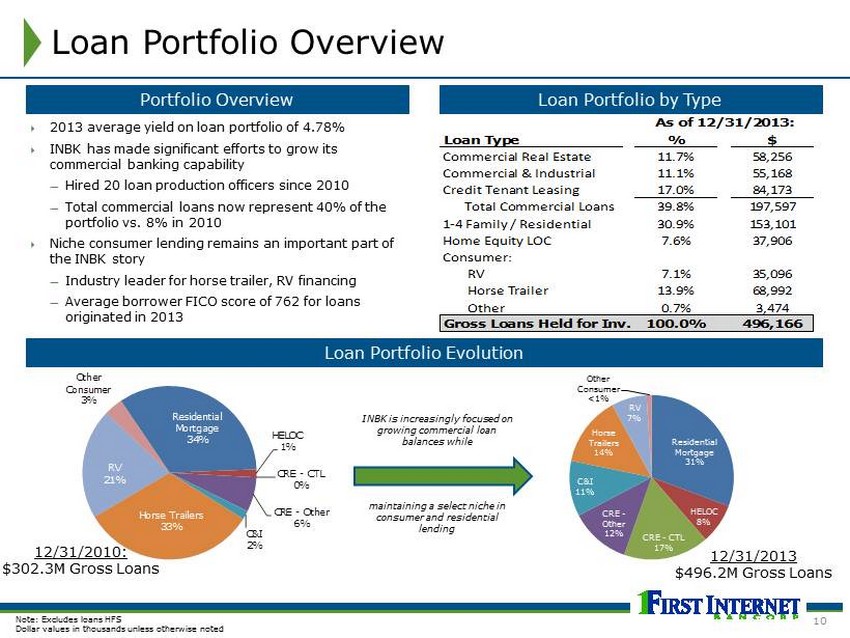
Residential Mortgage 31% HELOC 8% CRE - CTL 17% CRE - Other 12% C&I 11% Horse Trailers 14% RV 7% Other Consumer <1 % INBK is increasingly focused on growing commercial loan balances while maintaining a select niche in consumer and residential lending Loan Portfolio Overview Portfolio Overview Loan Portfolio by Type Loan Portfolio Evolution ; 2013 average yield on loan portfolio of 4.78% ; INBK has made significant efforts to grow its commercial banking capability — Hired 20 loan production officers since 2010 — Total commercial loans now represent 40% of the portfolio vs. 8% in 2010 ; Niche consumer lending remains an important part of the INBK story — Industry leader for horse trailer, RV financing — Average borrower FICO score of 762 for loans originated in 2013 12/31/2010: $302.3M Gross Loans 12/31/2013 $496.2M Gross Loans Note: Excludes loans HFS Dollar values in thousands unless otherwise noted Residential Mortgage 34% HELOC 1% CRE - CTL 0% CRE - Other 6% C&I 2% Horse Trailers 33% RV 21% Other Consumer 3% Loan Type % $ Commercial Real Estate 11.7% 58,256 Commercial & Industrial 11.1% 55,168 Credit Tenant Leasing 17.0% 84,173 Total Commercial Loans 39.8% 197,597 1-4 Family / Residential 30.9% 153,101 Home Equity LOC 7.6% 37,906 Consumer: RV 7.1% 35,096 Horse Trailer 13.9% 68,992 Other 0.7% 3,474 Gross Loans Held for Inv. 100.0% 496,166 As of 12/31/2013: 10
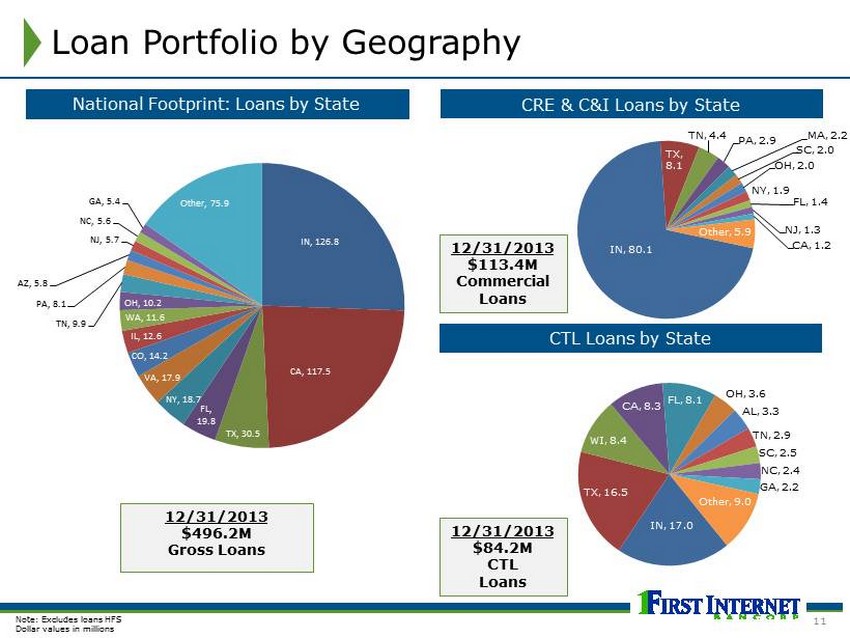
Loan Portfolio by Geography Note: Excludes loans HFS D ollar values in millions National Footprint: Loans by State CRE & C&I Loans by State 12/31/2013 $496.2M Gross Loans CTL Loans by State 12/31/2013 $84.2M CTL Loans 12/31/2013 $113.4M Commercial Loans IN, 126.8 CA, 117.5 TX, 30.5 FL, 19.8 NY, 18.7 VA, 17.9 CO, 14.2 IL, 12.6 WA, 11.6 OH, 10.2 TN, 9.9 PA, 8.1 AZ, 5.8 NJ, 5.7 NC, 5.6 GA, 5.4 Other, 75.9 IN, 17.0 TX, 16.5 WI, 8.4 CA, 8.3 FL, 8.1 OH, 3.6 AL, 3.3 TN, 2.9 SC, 2.5 NC, 2.4 GA, 2.2 Other, 9.0 IN, 80.1 TX, 8.1 TN, 4.4 PA, 2.9 MA, 2.2 SC, 2.0 OH, 2.0 NY, 1.9 FL, 1.4 NJ , 1.3 CA, 1.2 Other, 5.9 11
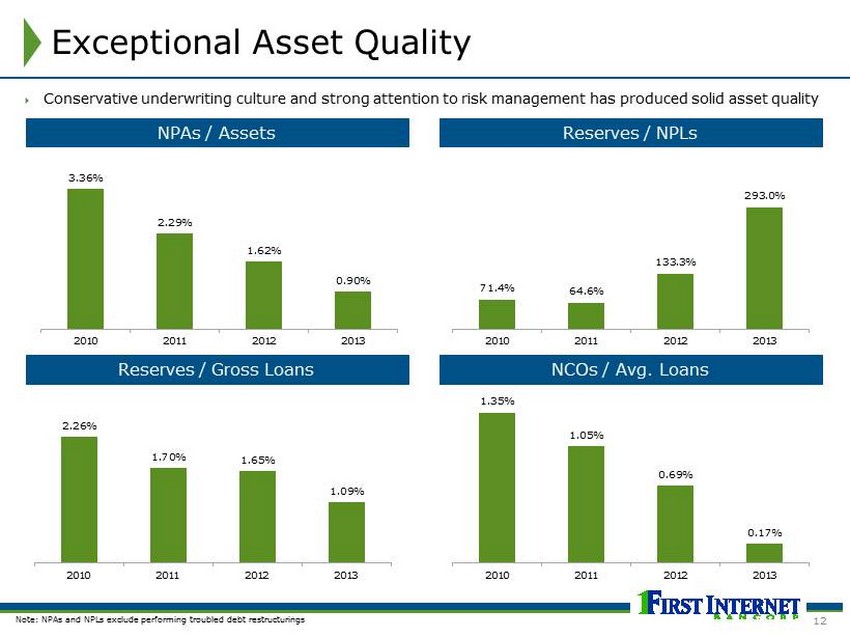
Exceptional Asset Quality NPAs / Assets Reserves / NPLs Reserves / Gross Loans NCOs / Avg. Loans Note: NPAs and NPLs exclude performing troubled debt restructurings ; Conservative underwriting culture and strong attention to risk management has produced solid asset quality 3.36% 2.29% 1.62% 0.90% 2010 2011 2012 2013 71.4% 64.6% 133.3% 293.0% 2010 2011 2012 2013 2.26% 1.70% 1.65% 1.09% 2010 2011 2012 2013 1.35% 1.05% 0.69% 0.17% 2010 2011 2012 2013 12
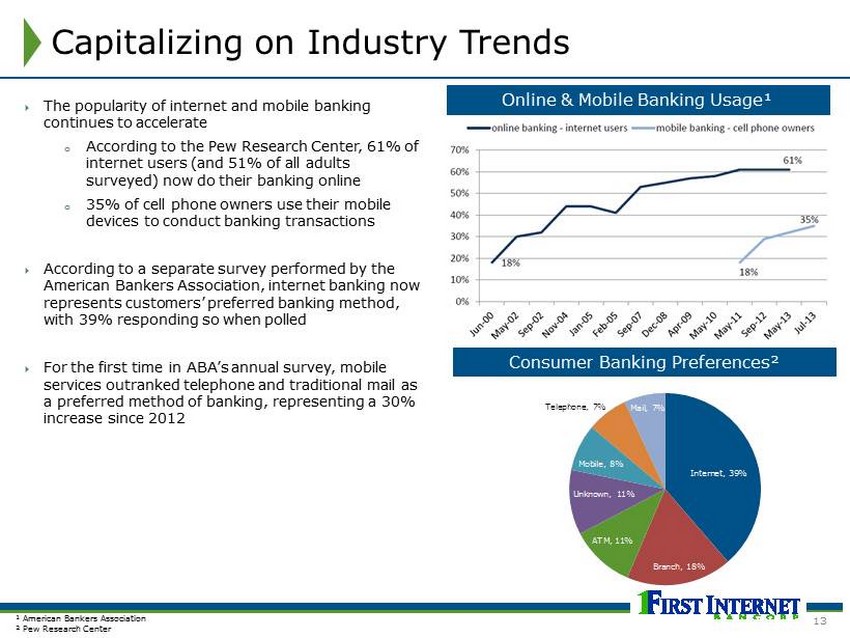
Capitalizing on Industry Trends Internet, 39% Branch, 18% ATM, 11% Unknown, 11% Mobile, 8% Telephone, 7% Mail, 7% ; The popularity of internet and mobile banking continues to accelerate o According to the Pew Research Center, 61% of internet users (and 51% of all adults surveyed) now do their banking online o 35% of cell phone owners use their mobile devices to conduct banking transactions ; According to a separate survey performed by the American Bankers Association, internet banking now represents customers’ preferred banking method, with 39% responding so when polled ; For the first time in ABA’s annual survey, mobile services outranked telephone and traditional mail as a preferred method of banking, representing a 30% increase since 2012 Consumer Banking Preferences² ¹ American Bankers Association ² Pew Research Center Online & Mobile Banking Usage¹ 13
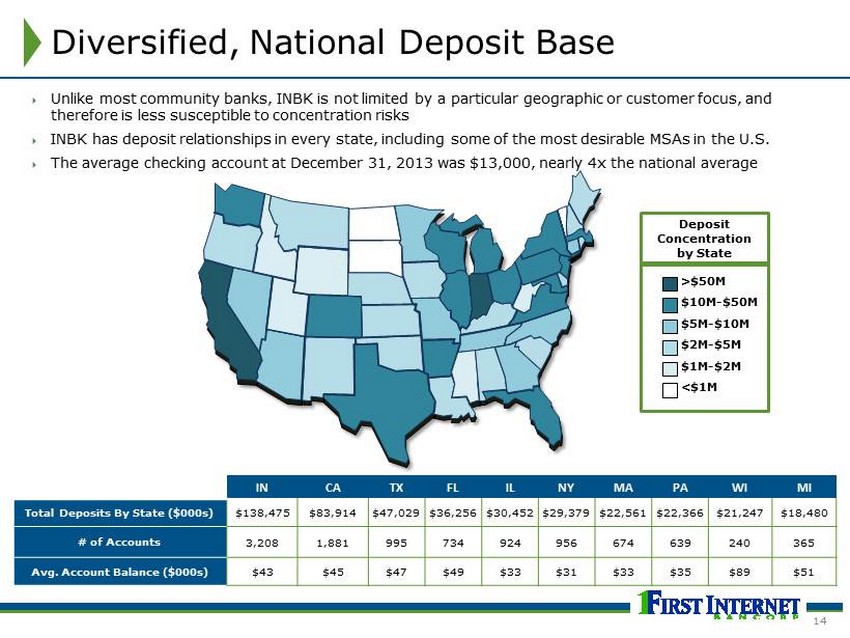
Diversified, National Deposit Base ; Unlike most community banks, INBK is not limited by a particular geographic or customer focus, and therefore is less susceptible to concentration risks ; INBK has deposit relationships in every state, including some of the most desirable MSAs in the U.S. ; The average checking account at December 31, 2013 was $13,000, nearly 4x the national average IN CA TX FL IL NY MA PA WI MI Total Deposits By State ($000s) $138,475 $83,914 $ 47,029 $36,256 $30,452 $29,379 $ 22,561 $ 22,366 $21,247 $18,480 # of Accounts 3,208 1,881 995 734 924 956 674 639 240 365 Avg. Account Balance ($000s) $43 $45 $47 $49 $33 $31 $33 $35 $89 $51 >$50M $10M - $50M $ 5M - $10M $2M - $5M $1M - $2M <$1M Deposit Concentration by State 14
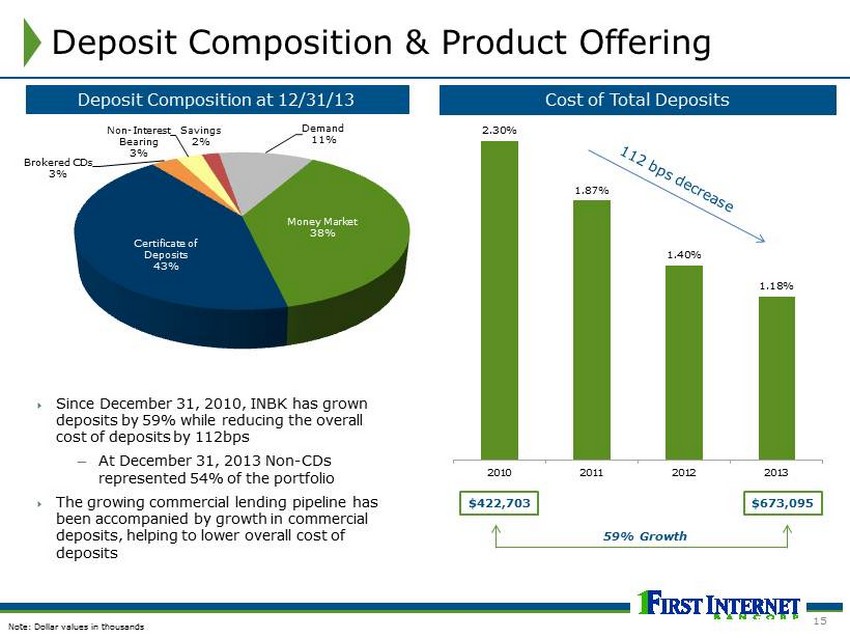
$422,703 $673,095 Deposit Composition & Product Offering Deposit Composition at 12/31/13 ; Since December 31, 2010, INBK has grown deposits by 59% while reducing the overall cost of deposits by 112bps — At December 31, 2013 Non - CDs represented 54% of the portfolio ; The growing commercial lending pipeline has been accompanied by growth in commercial deposits, helping to lower overall cost of deposits Cost of Total Deposits 59% Growth Note: Dollar values in thousands 2.30% 1.87% 1.40% 1.18% 2010 2011 2012 2013 Money Market 38% Certificate of Deposits 43% Brokered CDs 3% Non - Interest Bearing 3% Savings 2% Demand 11% 15
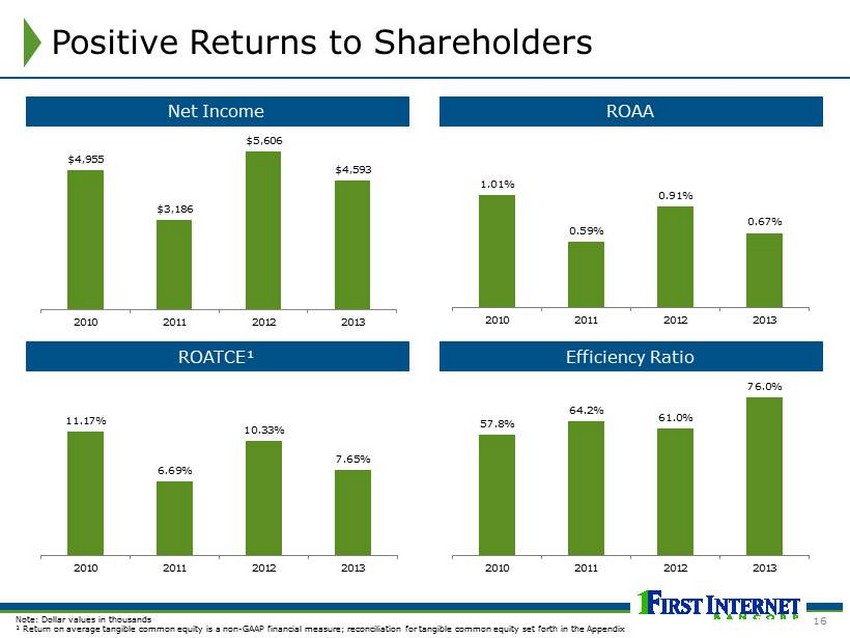
Positive Returns to Shareholders Net Income ROAA ROATCE¹ Efficiency Ratio Note: Dollar values in thousands ¹ Return on average tangible common equity is a non - GAAP financial measure; reconciliation for tangible common equity set forth in the Appendix $4,955 $3,186 $5,606 $4,593 2010 2011 2012 2013 1.01% 0.59% 0.91% 0.67% 2010 2011 2012 2013 11.17% 6.69% 10.33% 7.65% 2010 2011 2012 2013 57.8% 64.2% 61.0% 76.0% 2010 2011 2012 2013 16
Looking Forward ; FOCUS: ; Organic growth ; Additional revenue channels, i.e. Asset - Based Lending, SBA Lending ; Management lift - outs ; Remain opportunistic on acquisitions ; LEVERAGE: ; Infrastructure already in place ; Technology ; Management depth 17
Appendix

Non - GAAP Financial Measures Tangible common equity, tangible assets and tangible book value per common share are financial measures not recognized in generally accepted accounting principles ("GAAP"). Our management, banking regulators, many financial analysts and other investors use these non - GAAP financial measures to compare the capital adequacy of banking organizations with significant amounts of preferred equity and/or goodwill or other intangible assets, which typically stem from the use of the purchase accounting method of accounting for mergers and acquisitions. Tangible common equity, tangible assets, tangible book value per share or related measures should not be considered as a substitute for total shareholders' equity, total assets, book value per share or any other measure calculated in accordance with GAAP. Moreover , the manner in which we calculate these measures may differ from those of other companies reporting measures with similar names. The following table reconciles these non - GAAP performance measures and a capital ratio using such measures to the most directly comparable GAAP measure or ratio. Note : Dollar values in thousands, except per share amounts For the Year Ended December 31, 2010 2011 2012 2013 Total equity - GAAP 48,897 55,423 61,350 90,908 Adjustments - - - - Goodwill (4,687) (4,687) (4,687) (4,687) Tangible common equity 44,210 50,736 56,663 86,221 Total assets - GAAP 503,915 585,440 636,367 802,342 Adjustments - - - - Goodwill (4,687) (4,687) (4,687) (4,687) Tangible Assets 499,228 580,753 631,680 797,655 Total common shares 2,807,385 2,807,385 2,815,094 4,448,326 Book Value Per Share 17.42 19.74 21.79 20.44 Effect of adjustment (1.67) (1.67) (1.66) (1.06) Tangible Book Value Per Share 15.75 18.07 20.13 19.38 Total shareholders' equity to assets 9.70% 9.47% 9.64% 11.33% Effect of adjustment (0.84%) (0.73%) (0.67%) (0.52%) Tangible common equity to tangible assets 8.86% 8.74% 8.97% 10.81% 18
David B. Becker First Internet Bancorp Chairman and CEO 317 - 633 - 0910 dbecker@firstib.com Investor Relations www.firstinternetbancorp.com investors@firstib.com Contact Information 19