Attached files
| file | filename |
|---|---|
| 8-K - FORM 8-K - EASTON-BELL SPORTS, INC. | esbi-8k_20140305.htm |
 Transaction Summary
On
February
13,
2014,
Easton-Bell
Sports,
Inc.
reached
an
agreement
to
sell
the
assets
of
its
Easton
Baseball
/
Softball business to Bauer Performance Sports (“Bauer”) for $330MM
–
Closing expected in March / April 2014
Easton-Bell Sports, Inc. also announced that it is working towards an agreement
with a third party for the sale of its Easton Hockey business
–
Easton Hockey will be an Unrestricted Subsidiary until it is sold
Proceeds from the sale will be used in conjunction with a new financing to retire
the existing Easton-Bell Sports, Inc. 2016 Senior Secured Notes, the EB
Sports Corp. HoldCo Facility, and pay transaction fees and expenses
–
$46MM of proceeds earmarked as unrestricted HoldCo cash to fund acquisitions or
capital structure changes The contemplated new financing includes the
following: –
$150MM 5-year ABL (undrawn at closing)
–
$215MM 7-year 1
st
Lien Term Loan
–
$110MM 8-year 2
nd
Lien Term Loan
The
contemplated
new
financing
represents,
on
a
pro
forma
basis,
Total
Debt
/
Adj.
EBITDA
of
5.2x,
and
Net
Debt / Adj. EBITDA of 4.9x
Upon completion of these transactions, Easton-Bell Sports, Inc. will be renamed
BRG Sports, Inc. Exhibit 99.1 |
 Transaction Overview: Financing of BRG
Sources & Uses
Sources
Amount ($MM)
%
New ABL Revolver
0
0
New 1st Lien Term Loan
215
32
New 2nd Lien Term Loan
110
17
Net Proceeds from Asset Sale
337
51
Total Sources
662
100
Uses
Amount ($MM)
%
Retire ABL Facility
23
3
Retire Senior Notes
350
53
Retire HoldCo Facility
145
22
HoldCo Unrestricted Cash Allocation
46
7
Bond Breakage Costs
17
3
CIP / Transaction Costs
47
7
Illustrative Financing Fees & OID
10
2
Cash for Capitalizing Hockey
15
2
Cash for Restructuring Post-Transaction
9
1
Total Uses
662
100
PF Capitalization | Credit Statistics
Pro Forma ($MM)
12/31/2013
Cash on Balance Sheet
19
New ABL Revolver
0
New Term Loan (1st Lien)
215
New Term Loan (2nd Lien)
110
Total Debt
325
PF 2013E Adj. EBITDA
62
1st Lien Debt / PF Adj. EBITDA
3.5x
2nd Lien Debt / PF Adj. EBITDA
1.8x
Bank Debt / PF Adj. EBITDA
5.2x
Total Debt / PF Adj. EBITDA
5.2x
Net Debt / PF Adj. EBITDA
4.9x
2 |
 A
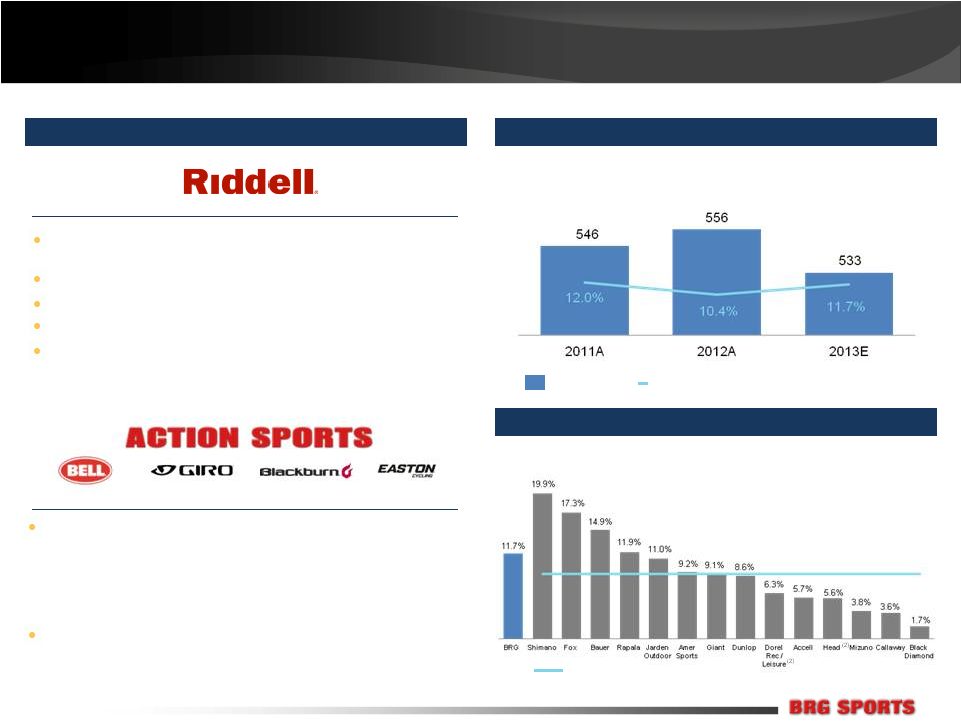
Top-Tier Sporting Goods Company The leading brands across helmets,
accessories, components, footwear and apparel for cycling, snowsports and
powersports –
42% share in global specialty cycling helmets
–
41% share in US snow helmets
–
56% share in US mass cycling accessories
CY2013E, %
BRG Revenue
BRG PF Adj. EBITDA Margin %
BRG Sports
(1)
Financial Performance
EBITDA Margins Above Most of Industry
Notes
1.Contribution based on 2013E Net Sales. Other brands contribute immaterial amount
2.LTM as of 9/30/2013
(39% of Net Sales)
(36% of Net Sales)
(18% of Net Sales)
(4% of Net Sales)
$MM
Industry Median = 8.9%
Sources:
Company Information, Management Estimates
(2)
(2)
Sources:
Thomson Estimates from Capital IQ as of 2/19/2014; Company Filings
(~3% of Net Sales)
Developer, manufacturer and reconditioner of football equipment,
uniforms, and accessories
A well-recognized brand at the forefront of head protection research 56% market share in
football helmets
A cash flow generator with a differentiated selling model Set all-time
record revenue performance for 4 years running
Global appeal for its
brands
3 |
 BRG
Sports: Change in Management Team, Return to the Past Two
Differentiated
Businesses
with Market-
Leading
Positions
Strong brand portfolio supported by storied histories, established reputations for
innovation, and globally recognized brand names
Riddell, founded in 1929, is one of the most well-known brands in sports
Bell and Giro own the leading positions in cycling, snow, and other action
sports Bell is building a fast-growing business in powersports
Opportunity to
Further Refine
Culture and Add
Value
Encourage
a
flat,
entrepreneurial
environment;
transition
from
EBS’
“corporate”
culture
Further emphasize and reward product innovation
Foster increased collaboration among divisions through revised management
structure Swift and efficient change since Terry Lee’s return to the
company he helped build and Tim Mayhew’s shift from long-time
Board member to management Operational
Improvements
to Drive
Margins and
Cash Flow
Continue right-sizing operating expenses as a % of sales (run-rate
>$10MM costs already taken out)
Maintain prudent capital expenditures by managing as a ratio
Better leverage available from economies of scale
4 |
 Attractive Market Dynamics
Resiliency Across All Key Sporting Goods Markets
2009-2012 CAGR
Sources:
SFIA,
Company
Analysis
$79.2Bn
Market
Size
$3.6Bn
$498MM
$516MM
Notes:
1.
U.S. Sporting Goods Wholesale Sales
2.
U.S. Independent Bike Dealer Sales
3.
U.S. Ski and Snowboard Equipment Wholesale Sales
4.
U.S. Football Equipment Wholesale Sales
3.4%
7.5%
4.1%
1.3%
U.S. Sporting Goods
(1)
U.S. Cycling
(2)
U.S. Snow Sports
(3)
Football Equipment
(4)
5 |
 Strong, Diversified Portfolio Across Categories and Sports…
Premium brand image,
evolving cross-category
lifestyle offering
Category leader in U.S.
ski / snow helmets and
goggles (crossover
from specialty cycling
strength)
Storied heritage as an
authentic moto helmet
Strong current
momentum (40%
CAGR)
Recently acquired
global distribution rights
to expand growth
Unparalleled brand
recognition and market
position
Cutting-edge helmet
technology
The top choice of elite
athletes
250 person direct sales
organization
Football
(39% of Net Sales)
Global market leader in
specialty cycling
helmets (particularly
strong in U.S.)
Unique multi-channel,
multi-brand strategy
Helmet of champions
$533MM 2013E Net Sales, $62MM 2013E PF. Adj. EBITDA
Cycling
(51% of Net Sales)
Snow
(6% of Net Sales)
Powersports
(4% of Net Sales)
6 |
 Multiple sports with diversity of products within each
Seasonal variety
Wide range of price points
Products sold in 69 countries through numerous
distribution outlets
Unique direct institutional sales force
–
Close to 20,000 institutional customers
Network of in-house and independent sales
representatives
BRG’s top customer (mass merchant) comprises 14.6%
of sales; next largest customer drops down to 2.6%
Product Diversification
Channel Diversification
2013E Net Sales, %
2013E Net Sales, %
Notes
1.Includes Easton cycling wheels / components
2.Includes distributor and OEM sales
Football
Equipment and
Reconditioning
Services
34%
Cycling
Accessories &
Softgoods
(1)
26%
Cycling
Helmets
25%
Snowsports
6%
Football
Licensed
Products
5%
Powersports
4%
Other Products
Specialty / Big
Box Retail
(2)
44%
Institutional
31%
Mass
25%
Diversification by Product, Channel and Customer Enhances Stability 7
|
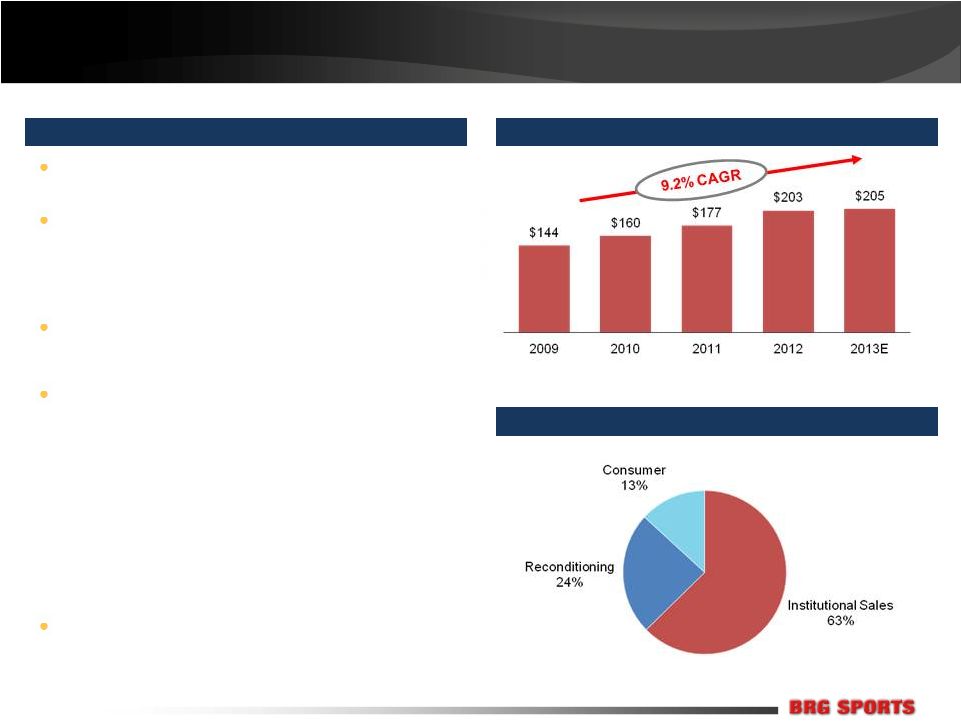 Riddell: The Football Specialty Company
A Leader in Football Equipment
Impressive and Continuous Growth
Broad Customer Base With Little Concentration
Revenue, $MM
Premier developer, manufacturer and reconditioner
of football equipment, uniforms, and accessories
Leading market positions in each category
–
56% market share by sales in helmets
–
Meaningful share increases over the past five
years
–
Majority of players wear Riddell helmets
Record revenue and EBITDA performance
–
Share-driven unit growth and consistent ASP
increases
–
High gross margins with improvement through
innovation and reconditioning relocation
–
SG&A leverage despite R&D and marketing
investments
–
Strong free cash flow profile
Industry highly concentrated, only a few key players
–
Riddell, Schutt, and Rawlings
Note:
2013E Net Sales, %
A favorite among NFL professionals
1.
Principally includes Riddell helmet and shoulder pad parts and accessories sold to
other reconditioning shops 8 |
 2013E Net Sales, %
(2)
Action Sports: Global Cycling, Snow, and Powersports Leader
Growth Resuming Following Difficult 2012
A combination of two market-leading brands in Bell
and Giro
–
Helmets, accessories, footwear and apparel for
cycling, snowsports, and powersports
Segment also includes:
–
Blackburn cycling accessories
–
Easton cycling wheels and components
Recent performance impacted by:
–
Self-inflicted errors
–
Exit from non-core Mass Fitness / Football
categories, Easton wheels quality issues
–
Unfavorable 2012/2013 seasonal weather
Improvement plan in place with results starting to
show
A Winning Combination
Core
Revenue
($MM)
(1)
Notes
1.Reflects
core
operations
–
excludes
Mass
Fitness/Football
and
Easton
Cycling
2.Certain items with immaterial contribution not reflected in graph
Diversified by Both Brand and Category
Giro
Bell
Blackburn
Easton
Mass Accessories
24%
Mass Helmets
9%
Mass Juvenile Licensed
9%
Bell Cycling
9%
Powersports
7%
Giro Cycling Helmets
14%
Giro
Snow
Helmets
8%
Footwear
4%
Other Giro
4%
Easton
6%
Blackburn
6%
$291
$301
$310
$300
$306
2009
2010
2011
2012
2013E
30%
6%
6%
58%
•
•
•
•
9 |
 Giro: An Evolving
Outdoor Adventure Brand Global market leader in cycling and snowsports helmets sold
through specialty retailers
–
Premium, high-quality image
–
Reputation for innovation, performance, and design
From Helmets to Lifestyle
Giro Bike
Giro Snow
Giro Air Attack
Giro Amare Women’s
Giro Combyn
Giro Blok
New Road Apparel
Waterproof jacket
Republic Shoes
% of Total Giro-Branded Net Sales
Increasing Non-Helmet Contribution
Leading U.S. Ski and Snow helmet player
Brand authenticity has allowed Giro to successfully extend
into snow, and now cycling softgoods and accessories
–
2009 launch of snow goggles and cycling gloves
–
2010 / 2011 launch of cycling footwear (fastest-growing
–
2013 / 2014 category expansion with New Road apparel
–
Little innovation in the current cycling apparel category
brand, now #4 in the market)
10 |
 Strong Global Distribution Platform
…Utilizing Numerous Channels
Broad-Based Distribution Model…
Diverse customer base across mass and specialty
–
~120 North American sales representatives (14
mass, 80 specialty, 23 powersports)
–
130 international distributors
Specialty channel accounts for majority of sales
–
Ranges from big box to cycling / ski independents
–
Giro in ~12,000 specialty cycling doors and ~5,000
snowsports doors globally
–
Bell in ~8,000 specialty doors globally
–
Specialized and Trek key specialty cycling peers
–
Powersports business quickly growing doors
–
Includes mass merchandisers such as Walmart,
Target, and Costco
–
Bell in ~10,000 doors globally
–
Key mass cycling competitor is Dorel Industries
(Schwinn, Mongoose, and GT)
–
Bell’s position fortified by Disney license
2013E Net Sales, %
(1)
Note
1.Distributor and OEM sales are included in specialty channels as appropriate
Mass
41%
Specialty -
Other
16%
Specialty
US IBD
16%
Specialty -
Europe IBD
15%
Specialty -
US National
8%
Specialty -
US Powersports
4%
Mass channel: lower price point, slightly lower
margins / opex
-
11 |
 Bell and Giro are the leading brands across nearly all of their product
categories –
The two brands have a combined ~42% global market share in specialty cycling
helmets Continued Market Leadership in Attractive and Growing Markets
Estimated Market Rank
Product Category
US Mass Cycling Helmets
NA
US Mass Cycling Accessories
NA
Global Specialty Cycling Helmets
Global Snow Helmets
NA
US Powersports Helmets
NA
US Specialty Cycling Footwear
NA
US Specialty Cycling Gloves
NA
Source: Leisure Trends and management estimates
Note: Product categories above exclude Easton Cycling wheels
A Formidable Presence
#1
#3
#1
#1
#4
#4
#2
#1
12 |
 Improvement Plan in Motion
Exited / exiting non-core categories
Fitness accessories
Enhanced focus on mass channel in cycling after
several years of de-emphasis
Bell is now a Joint Business Planning partner to both
Walmart and Target
Re-hired top-notch head of sales
Keystone dealer margin program
“Freedom to Choose”
Stopped selling to Amazon to prevent discounting of
current-year models
Results
apparent
–
as
of
early
February,
Giro
Cycling
order book up double-digits from prior year
Recent Actions
Dealer Margins Increasing, Precursor to
Regaining Share Growth
Regained Snow Helmet Share to Solidify #1 Spot
Giro
Closest Competitor
Specialty Dollar Share, %
Source:
Leisure Trends (December season to date)
“I've been speaking with a lot of other dealers around the
country and everyone has noticed the changes EBS has
made over the past number of months, and we're throwing
more of our business your way because of that.”
Source:
Leisure
Trends
(Current
Period
–
December)
Notes
1.Weighted average peer margin based on December 2013 dollar sales
2.Weighted
average
(based
on
dollar
sales)
of
Bell
/
Giro
December
2012
margins
3.Weighted
average
(based
on
dollar
sales)
of
Bell
/
Giro
December
2013
margins
Dealer Margin, %
(1)
(2)
(3)
-
Chris Holmes, Bicycle World & Fitness
13 |
 Stable Financial Performance
$MM
$MM, Margins in %
Action Sports
Riddell
Total BRG Margin
$MM, Margins in %
$MM, Margins in %
Total BRG
Notes
1.Please refer to page 41 for a reconciliation of PF Adjusted EBITDA
2.Figures may not add due to rounding
3.Capex adjusted for costs related to new distribution center (2012: $0.4MM; 2013E:
$3.6MM) and excess corporate project costs (2011: $6.4MM; 2012: $7.6MM; 2013E: $8.0MM)
BRG PF Adjustments
(2)
2011
2012
2013E
369
353
327
177
203
205
546
556
533
Net Sales
Gross Profit and Margin
193
202
195
35.3%
36.3%
36.6%
2011
2012
2013E
PF
Adj.
EBITDA
(1)
and
Margin
Capital
Expenditures
(3)
59
4
65
58
62
12.0%
10.4%
11.7%
2011
2012
2013E
12
12
13
2.2%
2.1%
2.4%
2011
2012
2013E
14 |
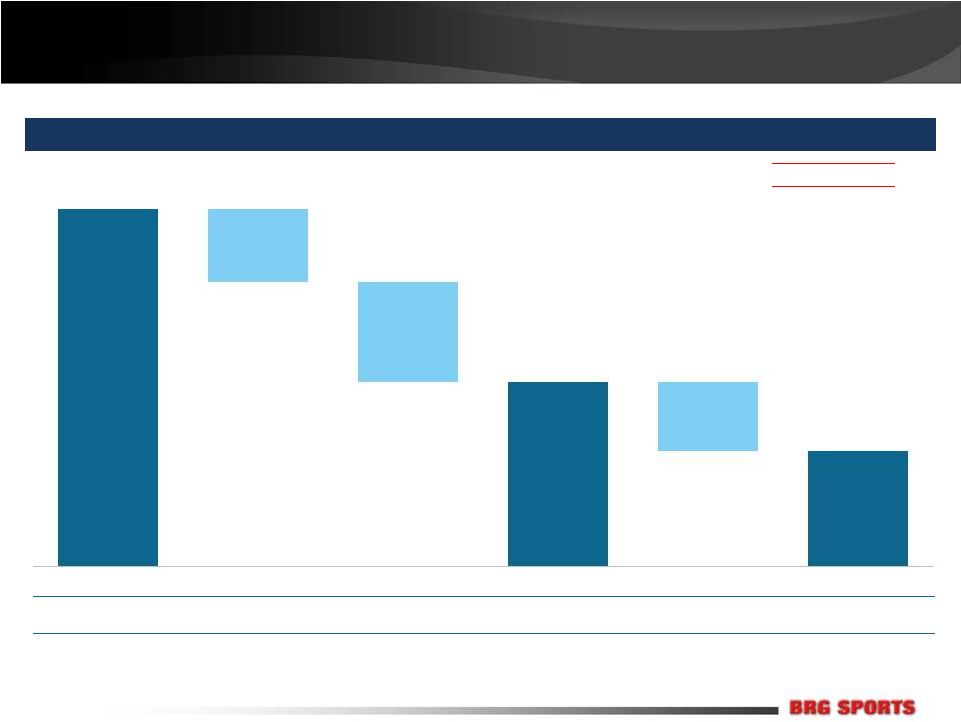 Strong Cash Flow Generation
$MM
Conversion:
51.8%
32.2%
Run-Rate
Free
Cash
Flow
Bridge
(1)(2)
Notes
1.Illustratively based on 2013E PF Adj. EBITDA
2.Assumed 45% tax rate for estimated taxes and tax-adjusted interest. Estimated
taxes calculated based on PF Adj. EBIT and pre-interest tax shield 3.Based
on 2013E capex, net of costs related to new distribution center ($3.6MM) and excess corporate project costs ($8.0MM)
(2)
(2)
(3)
ILLUSTRATIVE
62
13
17
32
12
20
PF Adj. EBITDA
Maintenance Capex
Est. Taxes
Unlevered FCF
Tax-Adj. Interest
Levered FCF
15 |
  Net
Working Capital Dynamics Historical Monthly Net Working Capital
2013
2012
2011
$
Cycles reflect selling seasons
Riddell sales increase through
1
half of year with A/R
collected once high school
football season begins
Cycling category builds
inventory in Q1 for Spring
sales push
Snow category inventory
builds through Summer with
bulk of sales booked from Aug-
Oct with fill-in orders thereafter
Preliminary
($MM, unless otherwise noted)
2011A
2012A
2013E
LTM Avg. Days of Sales Outstanding
95
95
92
LTM Avg. Inventory Turns
4.6x
4.3x
4.2x
LTM Avg. Days Payable Outstanding
49
51
50
LTM Avg. Working Capital ($)
(1)
$137
$143
$132
LTM Avg. Working Capital % of Sales
25.1%
25.8%
24.8%
Actual
Total BRG
Action Sports
Riddell
Note
1.
Excludes tax related accounts, cash, and indebtedness
Jan
Mar
May
Jul
Sep
Nov
Jan
Mar
May
Jul
Sep
Nov
Jan
Mar
May
Jul
Sep
Nov
st
16 |
 Product Liability Defense / Insurance
An Emphasis Within BRG
Product liability defense is a core competency of BRG Sports
–
We make great products; we fight frivolous cases and we win
“Ordinary course”
product liability suits are at an all-time low (Bell, Giro, and Riddell)
–
2014 policy recently renewed with exact coverage as prior year
–
We maintain 50+ years of substantial insurance coverage
–
>80% of our defense costs are reimbursed by insurance (no cap applies)
–
This
process
is
a
distraction
and
will
take
time
to
play
out
but
we
will
fight
and
expect
to
win
We believe NFL-related concussion suits are without merit as they pertain to
Riddell Helmet-related suits at Action Sports continue to decline,
accessories contributed bulk of new suits in 2012 and 2013
BRG Sports maintains significant insurance for helmet product liability
17 |
 Pro
Forma Adjusted EBITDA Reconciliation Notes
1.
Per the audited financials (for 2012) and the preliminary unaudited financials (for
2013) of Bell Sports and Riddell Sports 2.
Revenues and expenses related to baseball/softball products sold through mass
merchandisers were historically booked through BRG Sports. This product line is being divested as part of the Easton operations being sold to Bauer Performance Sports.
3.
Revenues and expenses related to Easton cycling wheels and components were
historically booked through Easton Sports. The accounting for this was changed to be included within BRG Sports in 2013.
4.
Represents corporate costs allocated to Easton Sports subsidiary as part of the
audit that are stranded post-divestiture and will remain with BRG Sports.
5.
Represents actual expenses historically permitted to be excluded pursuant to the
Company’s Senior Secured Credit Facilities. Such amount represents: (i) charges related to the issuance of capital stock or debt, (ii) unrealized (gains)/losses relating to
hedging activities, (iii) expenses paid in connection with employee severance,
retention, relocation and contract termination, consolidation of facilities and other non-recurring expenses and charges and (iv) expense reimbursements to our financial
sponsors. In addition these amounts include other quality of earnings adjustments
made in conjunction with Ernst & Young. 6.
Excludes depreciation and amortization previously allocated from Easton-Bell
Corp. to Easton Sports 7.
Includes full-year impact of cost reductions already taken place and anticipated
cost reduction initiatives upon separation of the Easton businesses and the refinancing.
$MM
2012
2013
Preliminary GAAP Operating Income
(1)
$38.4
$26.7
Less: Inclusion / (Removal) of Profits for Certain Baseball/Softball Business
Lines (2)
(2.4)
(2.4)
Plus: Inclusion of Profits for Certain Action Sports Business Lines
(3)
5.0
–
Less: Overhead Absorption of Divested / Non Borrower Businesses
(4)
(9.1)
(5.9)
Plus: Non-Cash Stock Compensation
3.3
6.5
Plus: Non-Recurring and Extraordinary Charges, Gains and Losses
(5)
1.8
12.8
Preliminary Adjusted Operating Income
$37.0
$37.7
Plus: Depreciation and Amortization
(6)
20.7
20.9
Preliminary Adjusted EBITDA
$57.7
$58.5
Pro Forma Adjustment
(7)
3.8
Pro Forma Adjusted EBITDA
$62.3
18 |