Attached files
| file | filename |
|---|---|
| 8-K - 8-K - VWR Funding, Inc. | d687053d8k.htm |
Exhibit 99.1

Goldman Sachs Leveraged Finance Healthcare Conference
Manuel Brocke-Benz & Greg Cowan
Safe Harbor / Non-GAAP Measures
Any statements made in this presentation about future operating results or other future events are forward-looking statements under the Safe Harbor Provisions of the Private Securities Litigation Reform Act of 1995. Actual results may differ materially from such forward-looking statements. A discussion of factors that could cause actual results or events to vary is contained in the Appendix to this presentation and in the SEC filings of VWR International’s parent company, VWR Funding, Inc.
During this presentation, we will be referring to certain financial measures not prepared in accordance with accounting principles generally accepted in the United States of America (“GAAP”), including Adjusted EBITDA and Net Debt. Reconciliations of these non-GAAP financial measures to the most closely comparable GAAP presentation are contained in the Appendix to this presentation.
2
VWR at a Glance
VWR Overview Net Sales by Segment*
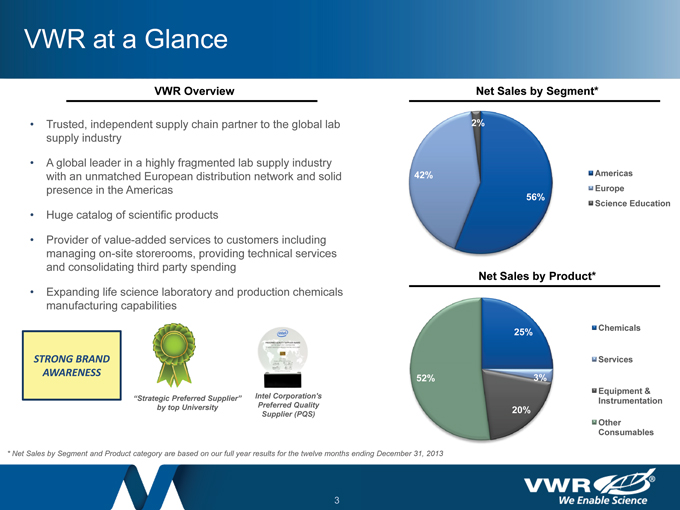
Trusted, independent supply chain partner to the global lab 2%
supply industry
A global leader in a highly fragmented lab supply industry
with an unmatched European distribution network and solid 42% Americas
presence in the Americas Europe
56%
Science Education
Huge catalog of scientific products
Provider of value-added services to customers including managing on-site storerooms, providing technical services and consolidating third party spending
Net Sales by Product*
Expanding life science laboratory and production chemicals manufacturing capabilities
25% Chemicals
STRONG BRAND Services
52%
AWARENESS 3%
Equipment &
“Strategic Preferred Supplier” Intel Preferred Corporation’s Quality Instrumentation
by top University 20%
Supplier (PQS)
Other
Consumables
Net Sales by Segment and Product category are based on our full year results for the twelve months ending December 31, 2013
3
VWR’s Customers:
Strong Collaborative Relationships Across Customer Segments
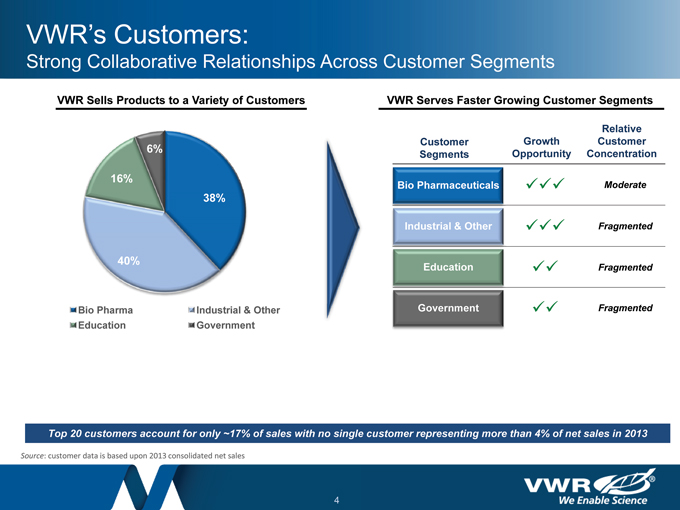
VWR Sells Products to a Variety of Customers VWR Serves Faster Growing Customer Segments
Relative
Customer Growth Customer
6% Segments Opportunity Concentration
16% Bio Pharmaceuticals Moderate
38%
Industrial & Other Fragmented
40% Education Fragmented
Bio Pharma Industrial & Other Government Fragmented
Education Government
Top 20 customers account for only ~17% of sales with no single customer representing more than 4% of net sales in 2013
Source: customer data is based upon 2013 consolidated net sales
4
Market Opportunity
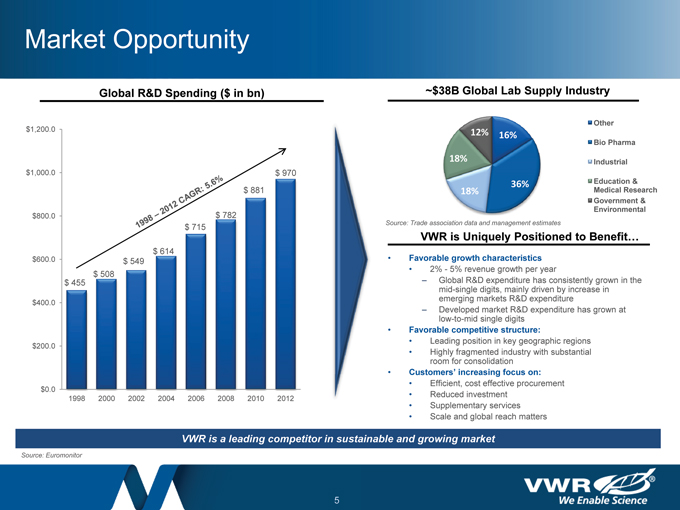
Global R&D Spending ($ in bn)
$1,200.0
$1,000.0 $ 970
$ 881
$800.0 $ 782
$ 715
$ 614
$600.0 $ 549
$ 508
$ 455
$400.0
$200.0
$0.0
1998 2000 2002 2004 2006 2008 2010 2012
~$38B Global Lab Supply Industry
Other
12% 16%
Bio Pharma
18% Industrial
36% Education &
18% Medical Research
Government &
Environmental
Source: Trade association data and management estimates
VWR is Uniquely Positioned to Benefit…
Favorable growth characteristics
2%—5% revenue growth per year
Global R&D expenditure has consistently grown in the mid-single digits, mainly driven by increase in emerging markets R&D expenditure
Developed market R&D expenditure has grown at low-to-mid single digits
Favorable competitive structure:
Leading position in key geographic regions
Highly fragmented industry with substantial room for consolidation
Customers’ increasing focus on:
Efficient, cost effective procurement
Reduced investment
Supplementary services
Scale and global reach matters
VWR is a leading competitor in sustainable and growing market
Source: Euromonitor
5
VWR’s Suppliers:
Strong Global Relationships
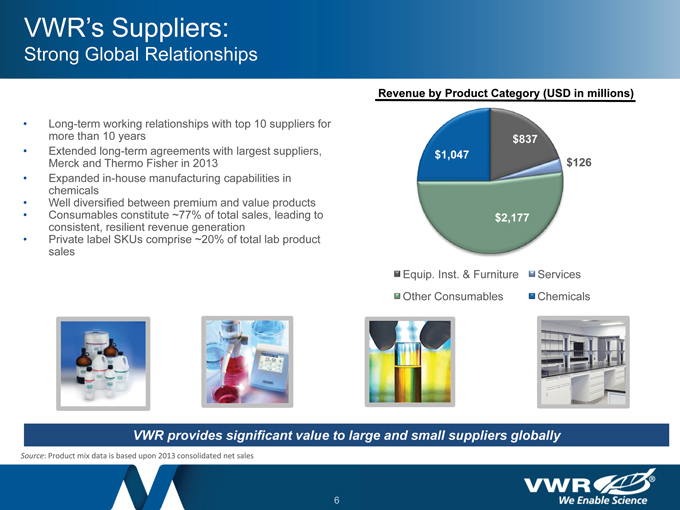
Revenue by Product Category (USD in millions)
Long-term working relationships with top 10 suppliers for
more than 10 years $837
Extended long-term agreements with largest suppliers, $1,047
Merck and Thermo Fisher in 2013 $126
Expanded in-house manufacturing capabilities in
chemicals
• Well diversified between premium and value products
• Consumables constitute ~77% of total sales, leading to $2,177
consistent, resilient revenue generation
• Private label SKUs comprise ~20% of total lab product
sales
Equip. Inst. & Furniture Services
Other Consumables Chemicals
VWR provides significant value to large and small suppliers globally
Source: Product mix data is based upon 2013 consolidated net sales
6
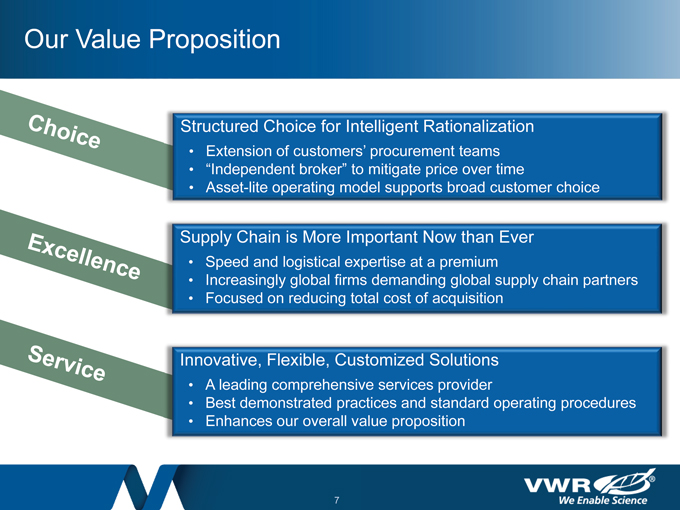
Our Value Proposition
Structured Choice for Intelligent Rationalization
Extension of customers’ procurement teams
“Independent broker” to mitigate price over time
Asset-lite operating model supports broad customer choice
Supply Chain is More Important Now than Ever
Speed and logistical expertise at a premium
Increasingly global firms demanding global supply chain partners
Focused on reducing total cost of acquisition
Innovative, Flexible, Customized Solutions
A leading comprehensive services provider
Best demonstrated practices and standard operating procedures
Enhances our overall value proposition
Excellence, Services, Choice
7
Customer Choice
Extension of Customers’ Procurement Team
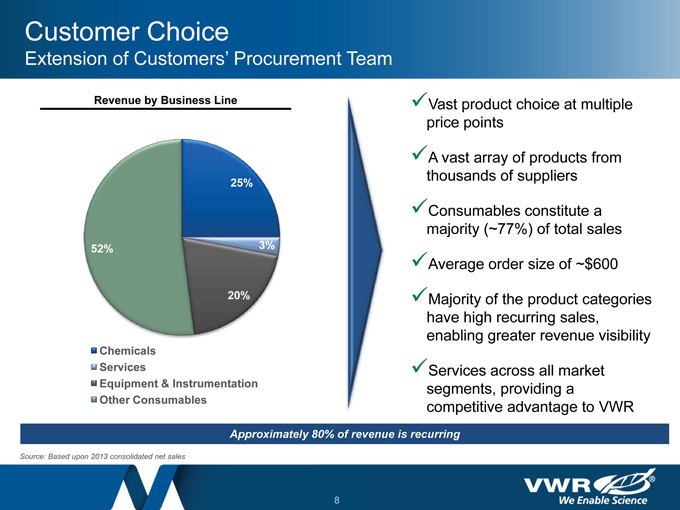
Revenue by Business Line Vast product choice at multiple
price points
A vast array of products from
25% thousands of suppliers
Consumables constitute a
majority (~77%) of total sales
52% 3%
Average order size of ~$600
20% Majority of the product categories
have high recurring sales,
enabling greater revenue visibility
Chemicals
Services Services across all market
Equipment & Instrumentation segments, providing a
Other Consumables competitive advantage to VWR
Approximately 80% of revenue is recurring
Source: Based upon 2013 consolidated net sales
8
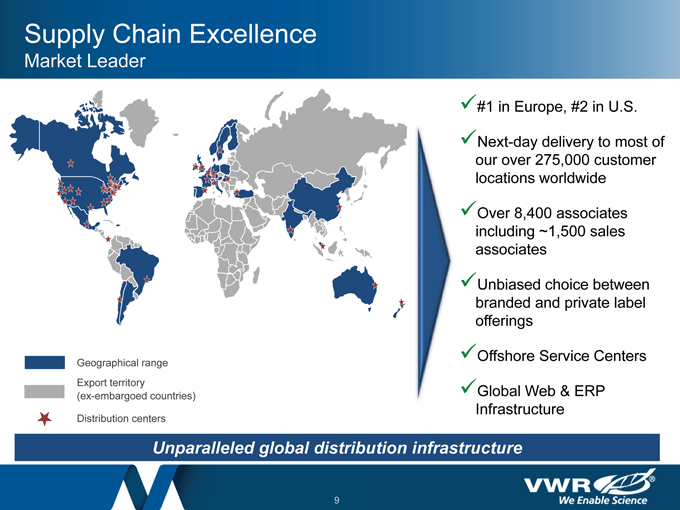
Supply Chain Excellence
Market Leader
#1 in Europe, #2 in U.S.
Next-day delivery to most of
our over 275,000 customer
locations worldwide
Over 8,400 associates
including ~1,500 sales
associates
Unbiased choice between
branded and private label
offerings
Geographical range Offshore Service Centers
Export territory Global Web & ERP
(ex-embargoed countries)
Infrastructure
Distribution centers
Unparalleled global distribution infrastructure
9
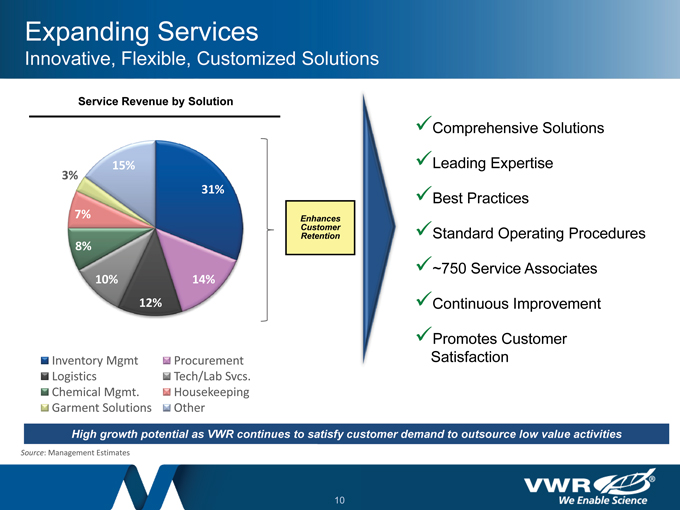
Expanding Services
Innovative, Flexible, Customized Solutions
Service Revenue by Solution
Comprehensive Solutions
15% Leading Expertise
3%
31% Best Practices
7% Enhances
Customer Standard Operating Procedures
Retention
8%
~750 Service Associates
10% 14%
12% Continuous Improvement
Promotes Customer
Inventory Mgmt Procurement Satisfaction
Logistics Tech/Lab Svcs.
Chemical Mgmt. Housekeeping
Garment Solutions Other
High growth potential as VWR continues to satisfy customer demand to outsource low value activities
Source: Management Estimates
10
Update on Financial Performance
11
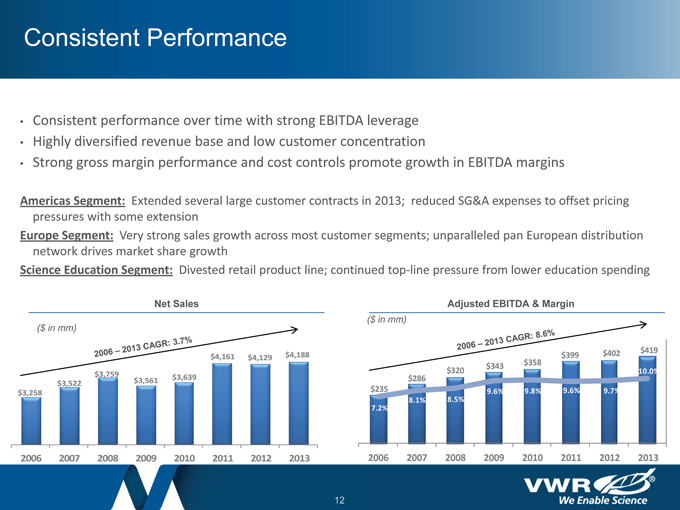
Consistent Performance
Consistent performance over time with strong EBITDA leverage
Highly diversified revenue base and low customer concentration
Strong gross margin performance and cost controls promote growth in EBITDA margins
Americas Segment: Extended several large customer contracts in 2013; reduced SG&A expenses to offset pricing pressures with some extension Europe Segment: Very strong sales growth across most customer segments; unparalleled pan European distribution network drives market share growth
Science Education Segment: Divested retail product line; continued top-line pressure from lower education spending
Net Sales Adjusted EBITDA & Margin
($ in mm)
($ in mm)
$4,161 $4,129 $4,188 $399 $402 $419
$343 $358
$320 10.0%
$3,759 $3,561 $3,639 $286
2006 – 2013 CAGR: 3.7%
2006 – 2013 CAGR: 8.6%
$3,522
$3,258 $235 9.6% 9.8% 9.6% 9.7%
8.1% 8.5%
7.2%
2006 2007 2008 2009 2010 2011 2012 2013 20062007200820092010 2011 20122013
12
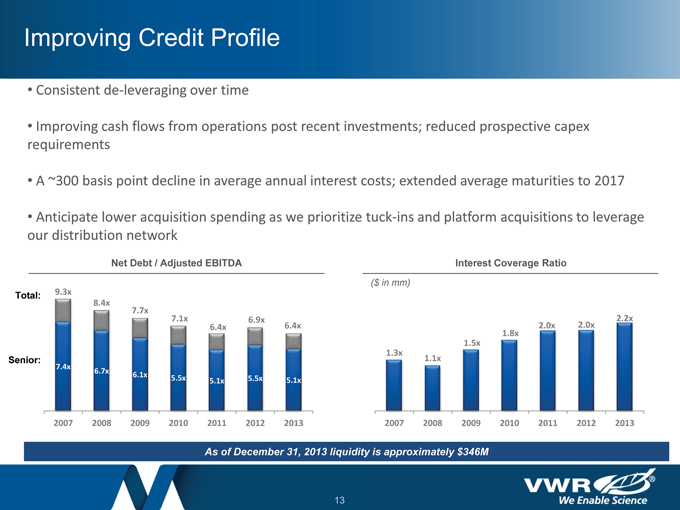
Improving Credit Profile
Consistent de-leveraging over time
Improving cash flows from operations post recent investments; reduced prospective capex
requirements
A ~300 basis point decline in average annual interest costs; extended average maturities to 2017
Anticipate lower acquisition spending as we prioritize tuck-ins and platform acquisitions to leverage
our distribution network
Net Debt / Adjusted EBITDA
Interest Coverage Ratio
($ in mm)
Total: 9.3x
8.4x
7.7x
7.1x 6.9x 2.2x
6.4x 6.4x 2.0x 2.0x
1.8x
1.5x
1.3x
Senior: 1.1x
7.4x
6.7x 6.1x 5.5x 5.5x 5.1x
5.1x
2007 2008 2009 2010 2011 2012 2013 2007 2008 2009 2010 2011 2012 2013
As of December 31, 2013 liquidity is approximately $346M
13
Key Takeaways
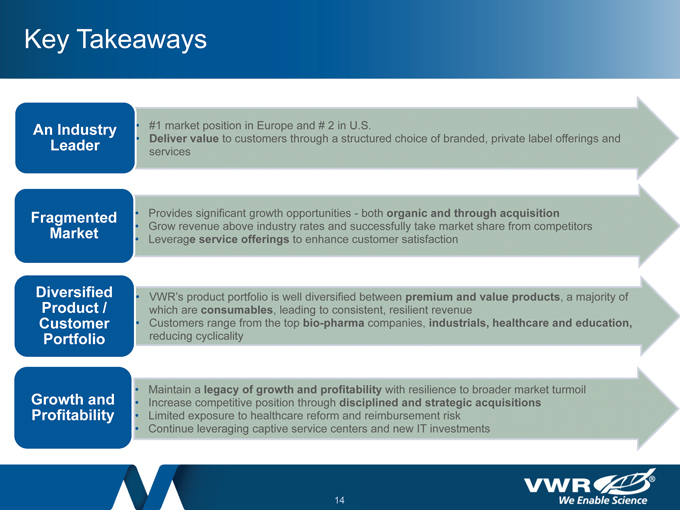
An Industry • #1 market position in Europe and # 2 in U.S.
Leader • Deliver value to customers through a structured choice of branded, private label offerings and
services
Fragmented • Provides significant growth opportunities—both organic and through acquisition
• Grow revenue above industry rates and successfully take market share from competitors
Market • Leverage service offerings to enhance customer satisfaction
Diversified • VWR’s product portfolio is well diversified between premium and value products, a majority of
Product / which are consumables, leading to consistent, resilient revenue
Customer • Customers range from the top bio-pharma companies, industrials, healthcare and education,
Portfolio reducing cyclicality
• Maintain a legacy of growth and profitability with resilience to broader market turmoil
Growth and • Increase competitive position through disciplined and strategic acquisitions
Profitability • Limited exposure to healthcare reform and reimbursement risk
• Continue leveraging captive service centers and new IT investments
14
Appendix
15
Appendix A-1—Forward-Looking Information
Statement
All statements included in or made during this presentation other than statements of historical fact may constitute forward-looking statements within the meaning of the
federal securities laws. Although we believe that our assumptions made in connection with the forward-looking statements are reasonable, there can be no assurances that the assumptions and expectations will prove to be correct.
The following are among the factors that could affect our future results and could cause those results or other outcomes to differ materially from those expressed or implied in our forward-looking statements: actions by, and our ability to maintain existing business relationships and practices with, suppliers, customers, carriers and other third parties; loss of any of our key executive officers; unexpected costs or disruptions to our business or internal controls associated with the implementation of important technology initiatives, including those relating to our enterprise resource planning and e-commerce capabilities; our ability to consummate and integrate potential acquisitions; the effect of political, economic, credit and financial market conditions, inflation and interest rates worldwide; the effect of changes in laws and regulations, including changes in accounting standards, trade, tax, price controls and other regulatory matters; increased competition from other companies in our industry and our ability to retain or increase our market shares in the principal geographical areas in which we operate; foreign currency exchange rate fluctuations; and our ability to generate sufficient funds to meet our debt obligations, capital expenditure program requirements, ongoing operating costs, acquisition financing and working capital needs.
Any such forward-looking statements should be considered in light of such important factors and in conjunction with VWR Funding, Inc.’s (the “Company”) SEC filings, including its Annual Report on Form 10-K for the year ended December 31, 2013.
16 A-1

Appendix A-2
This presentation contains a discussion of certain financial measures which are not in conformity with generally accepted accounting principles in the United States of America (“GAAP”), as described below.
References to “Adjusted EBITDA”
This presentation contains a discussion of earnings before interest, taxes, depreciation and amortization (“EBITDA”), as adjusted for certain items described below (“Adjusted EBITDA”). Adjusted EBITDA is a non-GAAP financial measure, and should not be considered as an alternative to net income or loss or any other GAAP measure of performance or liquidity.
Net income or loss is the most comparable GAAP measure of our operating results presented in the Company’s consolidated financial statements. The table presented on Appendix A-5 reconciles Adjusted EBITDA to net income or loss for the periods covered in this presentation.
Our calculation of Adjusted EBITDA eliminates the effect of charges primarily associated with financing decisions, tax regulations and capital investments and certain other items as further described on Appendix A-5. Adjusted EBITDA is a key financial
metric used by the Company’s investors and management to evaluate and measure the Company’s operating performance.
17 A-2
Appendix A-3
References to “Net Debt”
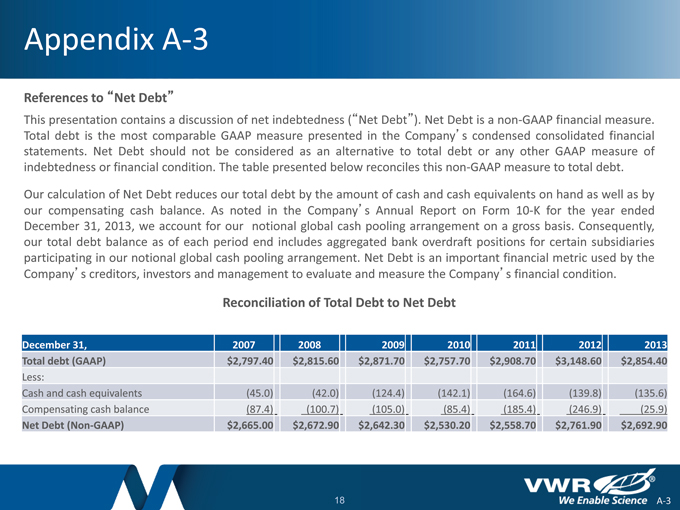
This presentation contains a discussion of net indebtedness (“Net Debt”). Net Debt is an on-GAAP financial measure. Total debt is the most comparable GAAP measure presented in the Company’s condensed consolidated financial statements. Net Debt should not be considered as an alternative to total debt or any other GAAP measure of indebtedness or financial condition. The table presented below reconciles this non-GAAP measure to total debt.
Our calculation of Net Debt reduces our total debt by the amount of cash and cash equivalents on hand as well as by our compensating cash balance. As noted in the Company’s Annual Report on Form 10-K for the year ended December 31, 2013, we account for our notional global cash pooling arrangement on a gross basis. Consequently, our total debt balance as of each period end includes aggregated bank overdraft positions for certain subsidiaries participating in our notional global cash pooling arrangement. Net Debt is an important financial metric used by the Company’s creditors, investors and management to evaluate and measure the Company’s financial condition.
Reconciliation of Total Debt to Net Debt
December 31, 2007 2008 2009 2010 2011 2012 2013
Total debt (GAAP) $2,797.40 $2,815.60 $2,871.70 $2,757.70 $2,908.70 $3,148.60 $2,854.40
Less:
Cash and cash equivalents(45.0)(42.0)(124.4)(142.1)(164.6)(139.8)(135.6)
Compensating cash balance(87.4)(100.7)(105.0)(85.4)(185.4)(246.9)(25.9)
Net Debt (Non-GAAP) $2,665.00 $2,672.90 $2,642.30 $2,530.20 $2,558.70 $2,761.90 $2,692.90
18 A-3
Appendix A-4
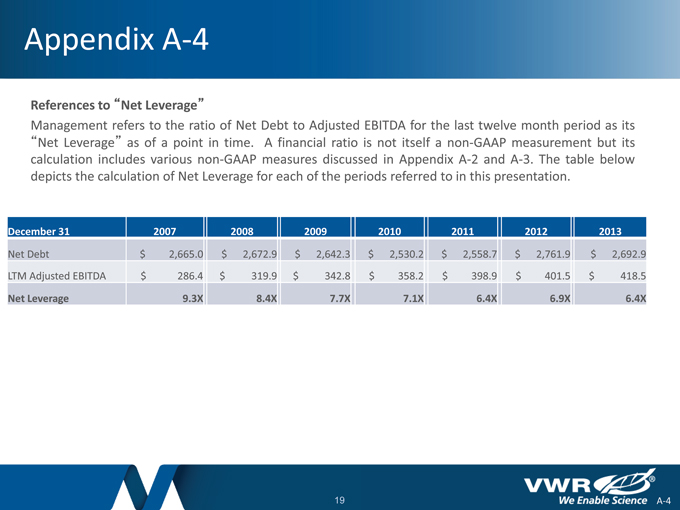
References to “Net Leverage”
Management refers to the ratio of Net Debt to Adjusted EBITDA for the last twelve month period as its
“Net Leverage” as of a point in time. A financial ratio is not itself a non-GAAP measurement but its calculation includes various non-GAAP measures discussed in Appendix A-2 and A-3. The table below depicts the calculation of Net Leverage for each of the periods referred to in this presentation.
December 31 2007 2008 2009 2010 2011 2012 2013
Net Debt $ 2,665.0 $ 2,672.9 $ 2,642.3 $ 2,530.2 $ 2,558.7 $ 2,761.9 $ 2,692.9
LTM Adjusted EBITDA $ 286.4 $ 319.9 $ 342.8 $ 358.2 $ 398.9 $ 401.5 $ 418.5
Net Leverage 9.3X 8.4X 7.7X 7.1X 6.4X 6.9X 6.4X
19 A-4
Appendix A-5
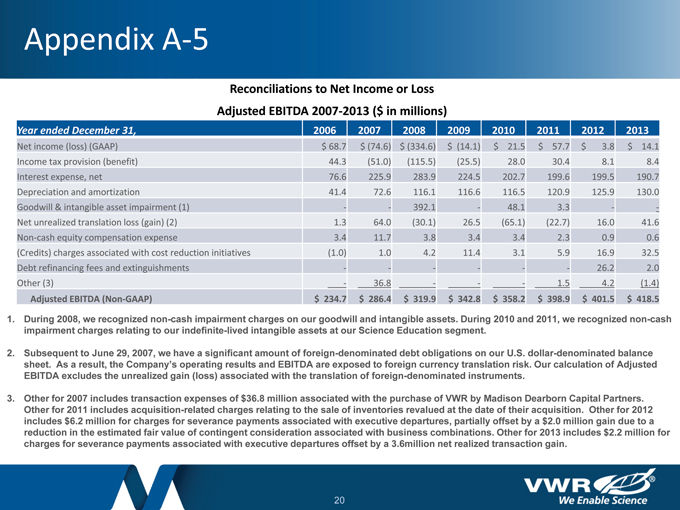
Reconciliations to Net Income or Loss
Adjusted EBITDA 2007-2013 ($ in millions)
Year ended December 31, 2006 2007 2008 2009 2010 2011 2012 2013
Net income (loss) (GAAP) $ 68.7 $ (74.6) $ (334.6) $ (14.1) $ 21.5 $ 57.7 $ 3.8 $ 14.1
Income tax provision (benefit) 44.3(51.0)(115.5)(25.5) 28.0 30.4 8.1 8.4
Interest expense, net 76.6 225.9 283.9 224.5 202.7 199.6 199.5 190.7
Depreciation and amortization 41.4 72.6 116.1 116.6 116.5 120.9 125.9 130.0
Goodwill & intangible asset impairment (1) — 392.1—48.1 3.3 —
Net unrealized translation loss (gain) (2) 1.3 64.0(30.1) 26.5(65.1)(22.7) 16.0 41.6
Non-cash equity compensation expense 3.4 11.7 3.8 3.4 3.4 2.3 0.9 0.6
(Credits) charges associated with cost reduction initiatives(1.0) 1.0 4.2 11.4 3.1 5.9 16.9 32.5
Debt refinancing fees and extinguishments — — — 26.2 2.0
Other (3)—36.8 ——1.5 4.2(1.4)
Adjusted EBITDA (Non-GAAP) $ 234.7 $ 286.4 $ 319.9 $ 342.8 $ 358.2 $ 398.9 $ 401.5 $ 418.5
During 2008, we recognized non-cash impairment charges on our goodwill and intangible assets. During 2010 and 2011, we recognized non-cash impairment charges relating to our indefinite-lived intangible assets at our Science Education segment.
Subsequent to June 29, 2007, we have a significant amount of foreign-denominated debt obligations on our U.S. dollar-denominated balance sheet. As a result, the Company’s operating results and EBITDA are exposed to foreign currency translation risk. Our calculation of Adjusted EBITDA excludes the unrealized gain (loss) associated with the translation of foreign-denominated instruments.
Other for 2007 includes transaction expenses of $36.8 million associated with the purchase of VWR by Madison Dearborn Capital Partners. Other for 2011 includes acquisition-related charges relating to the sale of inventories revalued at the date of their acquisition. Other for 2012 includes $6.2 million for charges for severance payments associated with executive departures, partially offset by a $2.0 million gain due to a reduction in the estimated fair value of contingent consideration associated with business combinations. Other for 2013 includes $2.2 million for charges for severance payments associated with executive departures offset by a 3.6million net realized transaction gain.
20