Attached files
| file | filename |
|---|---|
| 8-K - 8-K - American Homes 4 Rent | a14-7199_18k.htm |
Exhibit 99.1
|
|
Citi 2014 Global Property Conference March 2014 |
|
|
2 Disclaimer “We,” “AMH,” “AH4R,” “our company,” “the Company,” “the REIT,” “our” and “us” refer to American Homes 4 Rent, a Maryland real estate investment trust, and its subsidiaries taken as a whole. “AH LLC” or “our founders” refer to American Homes 4 Rent, LLC, a Delaware limited liability company formed by B. Wayne Hughes, our founder and chairman of our board of trustees, that will continue to perform our acquisition and renovation functions (and provides us exclusive access to related personnel) until December 2014 at which time we have the option to hire AH LLC’s personnel engaged in acquisition and renovation activities. Various statements contained in this presentation, including those that express a belief, expectation or intention, as well as those that are not statements of historical fact, are forward-looking statements. These forward-looking statements may include projections and estimates concerning the timing and success of strategies, plans or intentions. Our forward-looking statements are generally accompanied by words such as “estimate,” “project,” “predict,” “believe,” “expect,” “intend,” “anticipate,” “potential,” “plan,” “goal” or other words that convey the uncertainty of future events or outcomes. We have based these forward-looking statements on our current expectations and assumptions about future events. While we consider these expectations and assumptions to be reasonable, they are inherently subject to significant business, economic, competitive, regulatory and other risks, contingencies and uncertainties, most of which are difficult to predict and many of which are beyond our control. |
|
|
Overview of American Homes 4 Rent 3 |
|
|
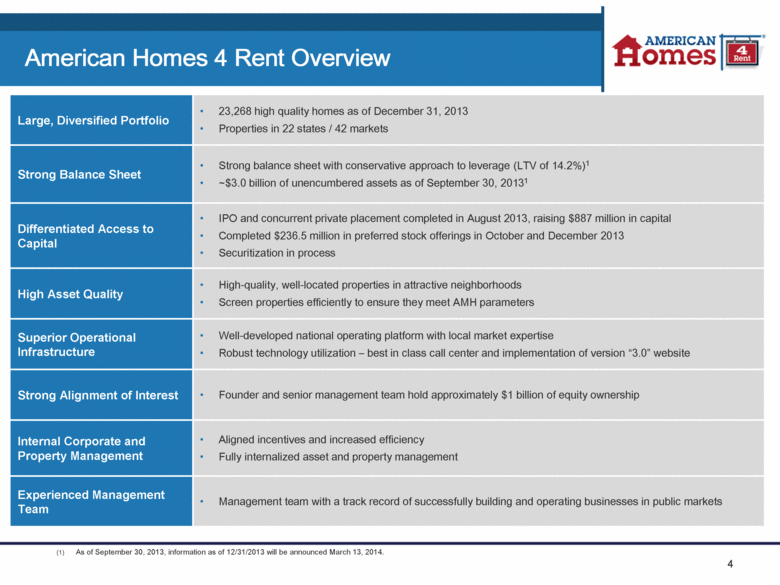
4 Large, Diversified Portfolio 23,268 high quality homes as of December 31, 2013 Properties in 22 states / 42 markets Strong Balance Sheet Strong balance sheet with conservative approach to leverage (LTV of 14.2%)1 ~$3.0 billion of unencumbered assets as of September 30, 20131 Differentiated Access to Capital IPO and concurrent private placement completed in August 2013, raising $887 million in capital Completed $236.5 million in preferred stock offerings in October and December 2013 Securitization in process High Asset Quality High-quality, well-located properties in attractive neighborhoods Screen properties efficiently to ensure they meet AMH parameters Superior Operational Infrastructure Well-developed national operating platform with local market expertise Robust technology utilization – best in class call center and implementation of version “3.0” website Strong Alignment of Interest Founder and senior management team hold approximately $1 billion of equity ownership Internal Corporate and Property Management Aligned incentives and increased efficiency Fully internalized asset and property management Experienced Management Team Management team with a track record of successfully building and operating businesses in public markets American Homes 4 Rent Overview (1) As of September 30, 2013, information as of 12/31/2013 will be announced March 13, 2014. |
|
|
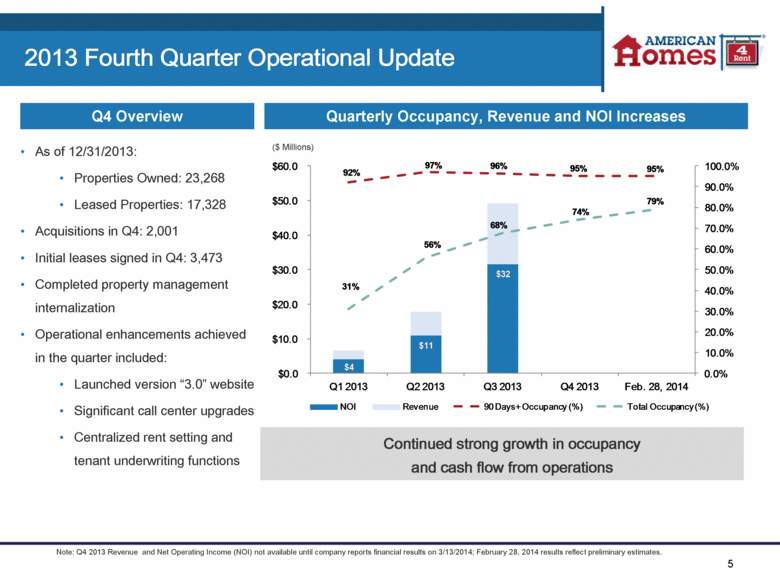
5 2013 Fourth Quarter Operational Update Quarterly Occupancy, Revenue and NOI Increases Q4 Overview As of 12/31/2013: Properties Owned: 23,268 Leased Properties: 17,328 Acquisitions in Q4: 2,001 Initial leases signed in Q4: 3,473 Completed property management internalization Operational enhancements achieved in the quarter included: Launched version “3.0” website Significant call center upgrades Centralized rent setting and tenant underwriting functions Continued strong growth in occupancy and cash flow from operations Note: Q4 2013 Revenue and Net Operating Income (NOI) not available until company reports financial results on 3/13/2014; February 28, 2014 results reflect preliminary estimates. ($ Millions) $4 $11 $32 92% 97% 96% 95% 95% 31% 56% 68% 74% 79% 0.0% 10.0% 20.0% 30.0% 40.0% 50.0% 60.0% 70.0% 80.0% 90.0% 100.0% $0.0 $10.0 $20.0 $30.0 $40.0 $50.0 $60.0 Q1 2013 Q2 2013 Q3 2013 Q4 2013 Feb. 28, 2014 NOI Revenue 90 Days+ Occupancy (%) Total Occupancy (%) |
|
|
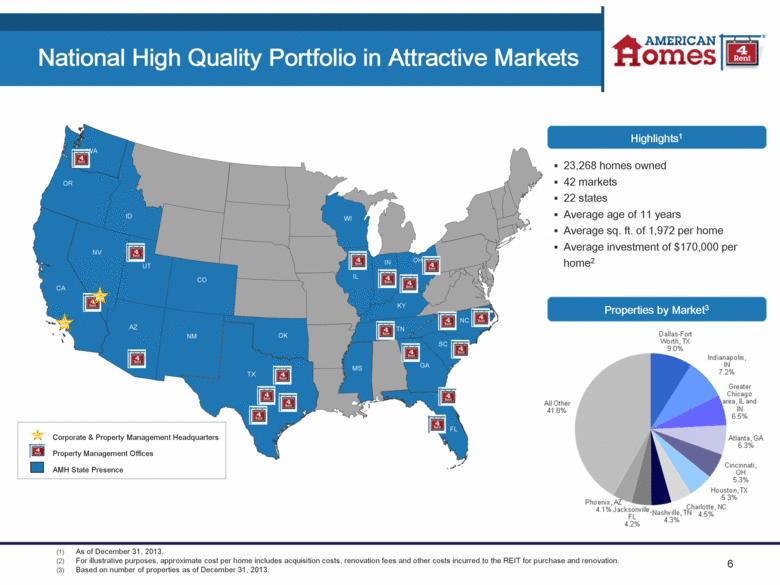
6 National High Quality Portfolio in Attractive Markets (1) As of December 31, 2013. (2) For illustrative purposes, approximate cost per home includes acquisition costs, renovation fees and other costs incurred to the REIT for purchase and renovation. (3) Based on number of properties as of December 31, 2013. SC TN WA OR CA NV UT CO AZ TX IL IN OH GA FL SC TN NC KY Corporate & Property Management Headquarters Property Management Offices AMH State Presence OK WI ID NM MS 23,268 homes owned 42 markets 22 states Average age of 11 years Average sq. ft. of 1,972 per home Average investment of $170,000 per home2 Highlights1 Properties by Market3 |
|
|
7 Market Leading Scale & Effectiveness Market Capitalization ($mm)2 $3,942 $614 $591 $1,062 # of Markets with > 500 homes 16 3 2 3 Average Age (Years) 11 26 19 34 Average Monthly Rent3 $1,368 $1,161 $1,173 $1,553 Typical Investment Per Home4 $170,000 $135,000 $128,330 $140,119 Portfolio Occupancy5 96.2% 88.7% 92.0% 92.9% Management Internal6 External Internal External G&A / Revenue7 5.5% 27.8% 28.1% 64.7% G&A / Assets7 0.3% 1.9% 1.6% 1.7% Comparison of Publicly-Traded Single Family Rental Companies1 Note: AH4R, Silver Bay and American Residential Properties as of 9/30/2013; Starwood Waypoint as of 11/30/2013. Number of homes does not include homes in escrow. (1) For Silver Bay, total properties exclude properties held for sale by the Company’s taxable REIT subsidiary; for Starwood Waypoint, excludes NPLs secured by 1,736 homes. (2) Includes partnership operating units, except Starwood Waypoint; market data as of 2/27/2014. (3) For American Residential Properties, only applies to the portfolio of self-managed single family homes owned for 6 months or longer; for Starwood Waypoint, represents average of currently leased or occupied homes as of 12/31/2013. (4) Includes acquisition cost, renovation cost and other related fees. (5) For AH4R and Starwood Waypoint, metric is based on properties available for rent for more than 90 days; for Silver Bay, stabilized properties owned 6 months or longer; for American Residential Properties, properties owned 6 months or longer. (6) Except acquisitions and renovations personnel that continue to be employed by AH LLC until December 2014, at which time AH4R has the option to employ them. AH4R has exclusive access to them prior to that period of time. (7) Annualized Q3 2013 G&A expense and revenue for AH4R, Silver Bay and American Residential Properties; for Starwood Waypoint, annualized first 9 months 2013 G&A expense and revenue, revenue including gain on sales of loans and gain on conversion of loans into real estate; for Silver Bay, G&A expense includes advisory management fee. 21,267 5,575 5,440 5,049 0 5,000 10,000 15,000 20,000 25,000 AMH SBY ARPI SWAY Total Homes Owned |
|
|
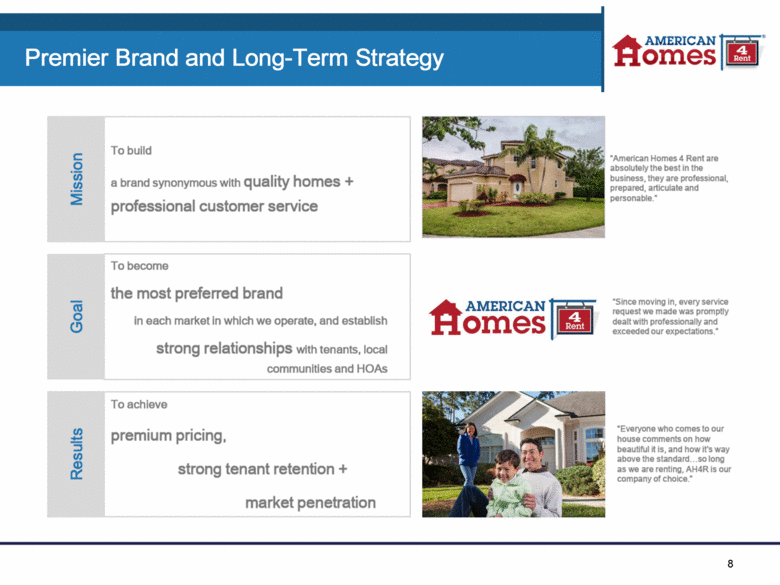
8 Premier Brand and Long-Term Strategy |
|
|
Single Family Residential Market and Analysis 9 |
|
|
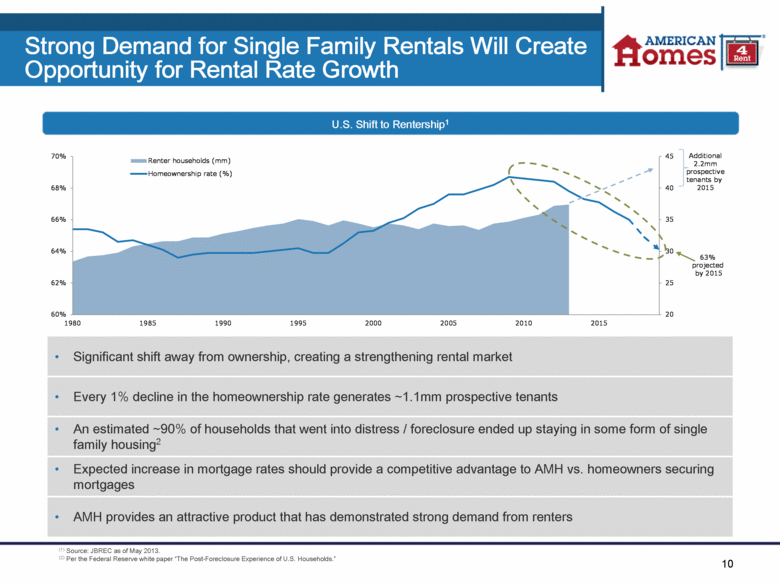
10 Strong Demand for Single Family Rentals Will Create Opportunity for Rental Rate Growth U.S. Shift to Rentership1 (1) Source: JBREC as of May 2013. (2) Per the Federal Reserve white paper “The Post-Foreclosure Experience of U.S. Households.” Significant shift away from ownership, creating a strengthening rental market Every 1% decline in the homeownership rate generates ~1.1mm prospective tenants An estimated ~90% of households that went into distress / foreclosure ended up staying in some form of single family housing2 Expected increase in mortgage rates should provide a competitive advantage to AMH vs. homeowners securing mortgages AMH provides an attractive product that has demonstrated strong demand from renters 20 25 30 35 40 45 60% 62% 64% 66% 68% 70% 1980 1985 1990 1995 2000 2005 2010 2015 Renter households (mm) Homeownership rate (%) Additional 2.2mm prospective tenants by 2015 63% projected by 2015 |
|
|
11 Single Family Has Similar Characteristics to Multi-Family in its Early Stages Consolidation opportunity for operators with scale and access to capital Highly fragmented ownership: Total institutional ownership is less than 2.0% of market AMH ownership is less than 0.2% of total single family supply Largest multi-family companies experienced the most significant growth Introduction of professional management in early years of public multi-family industry drove operational performance Source: SNL Financial. Note: Multi-Family REITs include AEC, AIV, AVB, BRE, CPT, EQR, ESS, HME, MAA, PPS, UDR, ACC, CCG and EDR. Single Family Rental REITs include AMH, SWAY, SBY and ARPI. (1) Size based on equity market capitalization as of 2/27/14. (2) Source: John Burns Real Estate Consulting, November 2013. Single Family Rental sector is primed to follow institutionalization path set by Multi-Family Size of Public Sector1 Number of Public Companies ($ in Billions) Single Family Multi-Family Single Family Multi-Family Significant Pipeline of Single Family Rentals2 $10.8 $85.1 $6.3 1994 2014 2014 42 14 4 1994 2014 2014 (Figures in Millions) 14.4 1.3 2.0 2.1 2.9 22.7 Existing single family rental Excess Vacancy Negative Equity Owners (Current) Negative Equity Owners (30 - 90 days) Negative Equity Owners (90+ days / foreclosure) Potential single family rental market Multi - Family Rental 10+ Units Inst. Grade 12.7 |
|
|
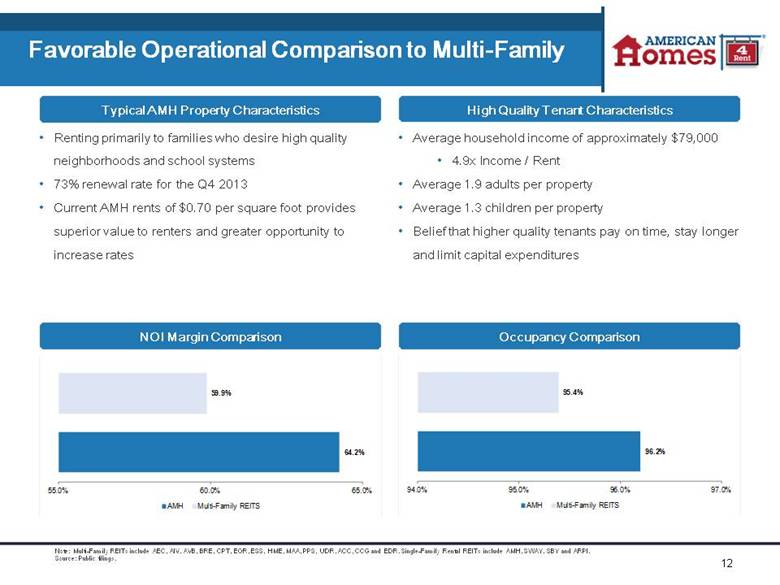
12 Favorable Operational Comparison to Multi-Family NOI Margin Comparison Occupancy Comparison Renting primarily to families who desire high quality neighborhoods and school systems 73% renewal rate for the Q4 2013 Current AMH rents of $0.70 per square foot provides superior value to renters and greater opportunity to increase rates Typical AMH Property Characteristics Average household income of approximately $79,000 4.9x Income / Rent Average 1.9 adults per property Average 1.3 children per property Belief that higher quality tenants pay on time, stay longer and limit capital expenditures Note: Multi-Family REITs include AEC, AIV, AVB, BRE, CPT, EQR, ESS, HME, MAA, PPS, UDR, ACC, CCG and EDR. Single-Family Rental REITs include AMH, SWAY, SBY and ARPI. Source: Public filings. 64.2% 59.9% 55.0% 60.0% 65.0% AMH Multi - Family REITS 96.2% 95.4% 94.0% 95.0% 96.0% 97.0% AMH Multi - Family REITS |
|
|
Company History and Senior Management 13 |
|
|
History of American Homes 4 Rent Q4 2013 23,268 Announced engagement of advisors in structuring and negotiating AMH’s first single family rental securitization Completed internalization of property management AMH completes two preferred stock offerings with aggregate proceeds of $236 million Q3 2013 21,267 Completion of $887 million IPO and concurrent private placement, and paid down borrowings outstanding under Asset Backed Facility $3.5 billion in equity capital after closing of IPO Q2 2013 17,949 Alaska Permanent Fund JV contributed 4,778 properties to the REIT for $904 million in equity consideration Began internalization of property manager and adviser March 2013 12,310 AMH raised an additional $747 million equity in a second 144A offering AMH obtained a $500 million Asset Backed Facility; subsequently increased to $800 million Feb. 2013 10,766 AH LLC contributed 2,770 homes to AMH for $492 million in equity consideration Oct./Nov. 2012 8,153 AMH formed and subsequently raised $530 million equity in a 144A offering July 2012 2,099 $500 million joint venture between AH LLC and the Alaska Permanent Fund, followed by an additional $250 million investment in November 2012 2011 - American Homes 4 Rent founded by B. Wayne Hughes Parallels between Public Storage and AMH Self-storage was a fragmented “mom & pop” consumer-focused industry Public Storage institutionalized the sector through professional management Public Storage built a well-recognized, leading national brand Public Storage developed systems to realize operating efficiencies Public Storage rolled up smaller operators to aggregate the country’s largest portfolio # Homes 2006 2006 Public Storage reaches $20 billion equity market cap with over 2,000 facilities across 38 states 1972 1972 Public Storage founded by B. Wayne Hughes with one storage facility in Southern California 14 |
|
|
15 Leadership Team with Proven History of Success Experienced and Diversified Independent Members of the Board of Trustees Dann Angeloff Matthew Hart Jim Kropp Lynn Swann Kenneth Woolley Overview of Experience President of The Angeloff Company Former Trustee, University of Southern California Former Director; Public Storage (NYSE: PSA); Storage Equities; PS Business Parks (NYSE: PSB) Former President, COO, EVP and CFO of Hilton Hotels Corp. Former SVP and Treasurer of the Walt Disney Co. Former EVP and CFO of Host Marriott Corp. Director, Air Lease Corp. (NYSE: ALC); American Airlines (NYSE: AAL) CIO of SLKW Investments LLC / CFO of Microproperties LLC (“USRP2”) Director, PS Business Parks (NYSE: PSB) and Corporate Capital Trust Former Director, US Restaurant Properties: Trustreet Properties; Madison Park REIT President of Swann, Inc. and the Lynn Swann Group Director, Fluor (NYSE: FLR); Caesar’s Entertainment (NYSE: CZR); Empower Software; National Football Foundation Former Director, H.J. Heinz Co. (NYSE: HNZ) National Spokesman, Big Brothers Big Sisters of America Founder, Executive Chairman and CIO of Extra Space Storage, Inc. (NYSE: EXR) Developed and / or acquired over 24,000 apartment units for Westcorp Management, Inc. Senior Leadership with Substantial Public Company Experience and Alignment of Interest with Investors B. Wayne Hughes David Singelyn Jack Corrigan Peter Nelson Founder & Chairman Chief Executive Officer Chief Operating Officer Chief Financial Officer Real Estate Experience 40+ years 25 years 25 years 27 years History with Public Storage AMH Trustee Overview of Experience Former Chairman and CEO of Public Storage (NYSE: PSA) Founded Public Storage and PS Business Parks (NYSE: PSB) Former Treasurer of Public Storage Former Chairman and CEO of Public Storage Canada (Formerly TSX: PUB) Co-founded private commercial and retail real estate company American Commercial Equities Former CFO of PS Business Parks Former CEO of A&H Property & Investments Former Partner at accounting firm LaRue, Corrigan & McCormick Former CFO of Alexandria Real Estate Equities (NYSE: ARE) Former CFO of Lennar Partners Former VP, Financial Planning for Public Storage |
|
|
Acquisitions and Renovations 16 |
|
|
17 Ongoing Evaluation of Acquisition Markets Identifying Attractive Target Markets Auction / Trustee MLS / Short Sale Portfolio / NPL Acquisition Channels SC SC AZ TX GA FL SC TN NC |
|
|
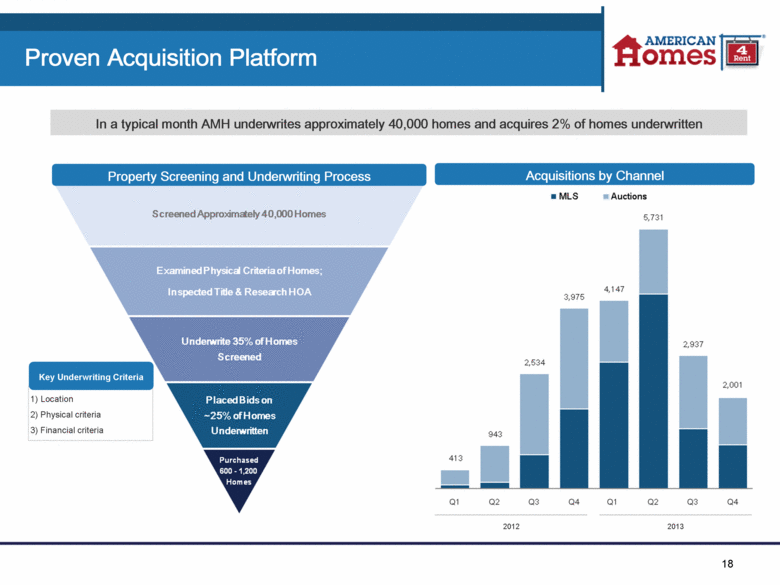
18 Proven Acquisition Platform Property Screening and Underwriting Process Acquisitions by Channel 2012 In a typical month AMH underwrites approximately 40,000 homes and acquires 2% of homes underwritten Key Underwriting Criteria 1) Location 2) Physical criteria 3) Financial criteria 2013 |
|
|
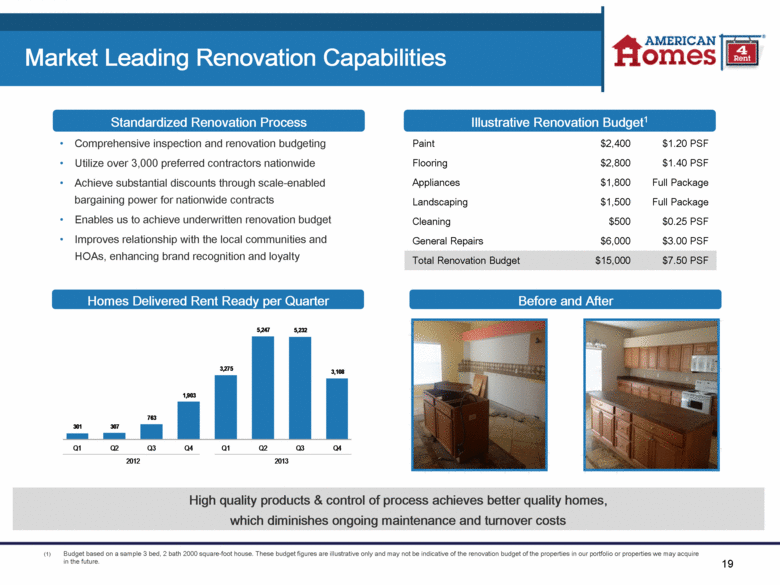
19 Market Leading Renovation Capabilities Standardized Renovation Process Homes Delivered Rent Ready per Quarter Before and After Comprehensive inspection and renovation budgeting Utilize over 3,000 preferred contractors nationwide Achieve substantial discounts through scale-enabled bargaining power for nationwide contracts Enables us to achieve underwritten renovation budget Improves relationship with the local communities and HOAs, enhancing brand recognition and loyalty Illustrative Renovation Budget1 Paint $2,400 $1.20 PSF Flooring $2,800 $1.40 PSF Appliances $1,800 Full Package Landscaping $1,500 Full Package Cleaning $500 $0.25 PSF General Repairs $6,000 $3.00 PSF Total Renovation Budget $15,000 $7.50 PSF Budget based on a sample 3 bed, 2 bath 2000 square-foot house. These budget figures are illustrative only and may not be indicative of the renovation budget of the properties in our portfolio or properties we may acquire in the future. High quality products & control of process achieves better quality homes, which diminishes ongoing maintenance and turnover costs 301 307 763 1,903 3,275 5,247 5,232 3,108 Q1 Q2 Q3 Q4 Q1 Q2 Q3 Q4 2012 2013 |
|
|
Leasing & Property Management 20 |
|
|
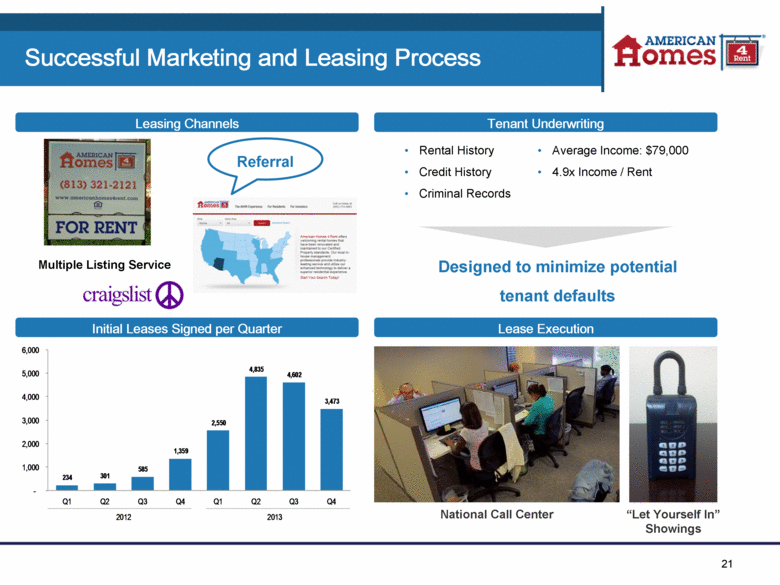
21 Successful Marketing and Leasing Process Tenant Underwriting Lease Execution 96.2% Leasing Channels Initial Leases Signed per Quarter Designed to minimize potential tenant defaults Multiple Listing Service Referral Rental History Credit History Criminal Records Average Income: $79,000 4.9x Income / Rent National Call Center “Let Yourself In” Showings 234 301 585 1,359 2,550 4,835 4,602 3,473 - 1,000 2,000 3,000 4,000 5,000 6,000 Q1 Q2 Q3 Q4 Q1 Q2 Q3 Q4 2012 2013 |
|
|
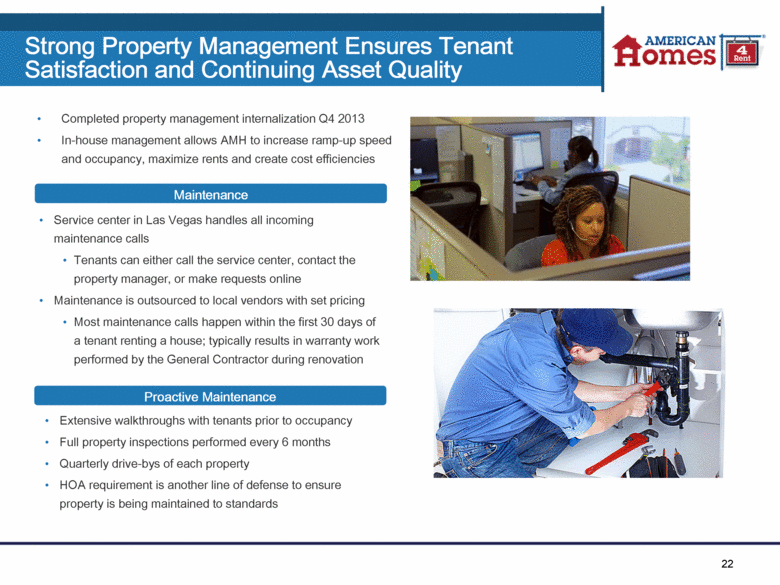
22 Strong Property Management Ensures Tenant Satisfaction and Continuing Asset Quality Proactive Maintenance Extensive walkthroughs with tenants prior to occupancy Full property inspections performed every 6 months Quarterly drive-bys of each property HOA requirement is another line of defense to ensure property is being maintained to standards Maintenance Service center in Las Vegas handles all incoming maintenance calls Tenants can either call the service center, contact the property manager, or make requests online Maintenance is outsourced to local vendors with set pricing Most maintenance calls happen within the first 30 days of a tenant renting a house; typically results in warranty work performed by the General Contractor during renovation Completed property management internalization Q4 2013 In-house management allows AMH to increase ramp-up speed and occupancy, maximize rents and create cost efficiencies |
|
|
Financial Information 23 |
|
|
24 Q3 Performance Highlights Revenues of $49.5 million, a 173% increase from the prior period’s $18.1 million in sales Net Operating Income (NOI) from leased properties of $31.2 million, a 191% increase from the second quarter Acquired 2,937 properties for approximately $450 million Properties rent-ready for more than 90 days were 96.2% leased at period end Total properties owned were 67.6% occupied Declared quarterly dividends of $0.05 per Class A common share Quarterly Operating Overview NOI is a supplemental non-GAAP financial measure that we define as rents from single family properties less property operating expenses for leased single-family properties. For the Three Months Ended March 31, June 30, Sept. 30, ($ Thousands, except per share data) 2013 2013 2013 Operating Data Single Family Properties Rents 6,644 $ 17,585 $ 48,743 $ Total Revenues 6,644 $ 18,120 $ 49,463 $ Leased Property Operating Expenses 2,566 $ 6,859 $ 17,579 $ Net Operating Income 1 4,078 $ 10,726 $ 31,164 $ NOI Margin 61% 61% 64% Funds From Operation (FFO) 19,580 $ FFO per share 0.09 $ G&A Expense and Advisory Fees / Total Revenues (%) 66% 24% 6% Annualized G&A Expense and Advisory Fees / Total Assets (%) 1.0% 0.5% 0.3% |
|
|
25 Conservative Capital Structure with Significant Dry Powder Quarterly Balance Sheet Overview ~$3.0 billion of unencumbered assets add significant leverage capacity $800 million credit facility $236.5 million of participating preferred stock issued: 5% Coupon 50% of HPA upside limited to 9% IRR Current leverage level of 14.2% of enterprise value As of September 30, 2013. For the Three Months Ended March 31, June 30, Sept. 30, ($ Thousands, except per share data) 2013 2013 2013 Balance Sheet Data Single Family Properties, Net 1,120,843 $ 3,039,504 $ 3,530,122 $ Total Assets 1,678,261 $ 3,482,695 $ 3,885,261 $ Outstanding Borrowings Under Credit Facility - $ 670,000 $ 238,000 $ Total Liabilities 49,798 $ 831,359 $ 395,968 $ Common Shares Outstanding, End of Period 86,017,823 130,068,500 185,491,294 Total Market Capitalization NA NA 3,861,700 $ NYSE AMH Closing Price 1 NA NA 16.15 $ |
|
|
AMH Business Strengths Tenant Driven Business AMH targets properties that fit an ideal tenant profile Traditional middle class neighborhoods in growing markets Minimum 3 bedrooms, 2 bathrooms, two car garage Newer properties in attractive neighborhoods Significant Scale Advantage Well developed national operating platform provides for enhanced acquisition execution, lower renovation costs, operating efficiencies and increased brand awareness Internalized management coupled with significant investment in technology further drives scale advantages "Cottage" Industry Historical “mom & pop" landlord model Current rent per square foot significantly below multi-family comparables Potential opportunity to drive rents given quality and approach Ability and expertise to streamline and control all aspects of the business model Favorable Asset Dynamics Provides a natural hedge as the business plan works across market cycles Efficient, disciplined and analytical buying strategy has allowed AMH to acquire a diversified portfolio of high quality homes Ability to optimize cash flows as AMH institutionalizes asset class Strong Industry Trends Largest real estate asset class with strong historical demand for rentals Affordability and view of home ownership have changed coming out of downturn Purchase price significantly below replacement cost providing downside protection Significant cash flow opportunity with attractive current yields and upside from increasing rents and cost efficiencies 26 |
|
|
Appendix 27 |
|
|
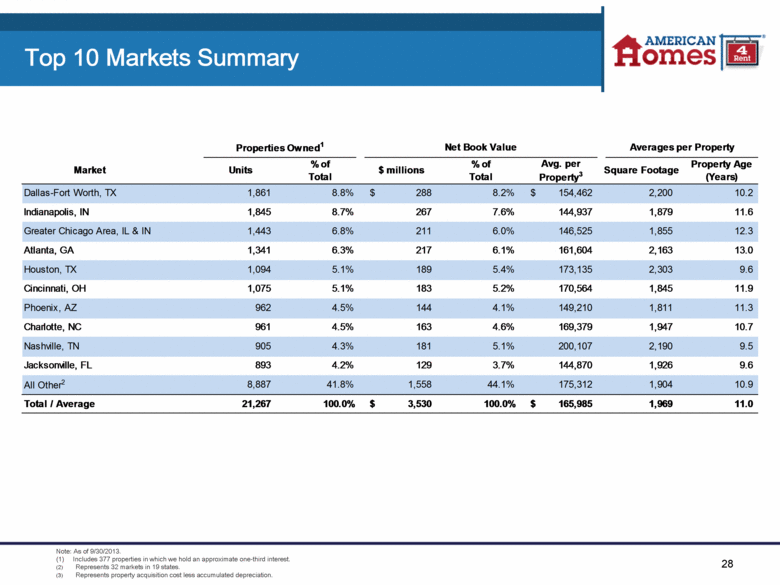
28 Top 10 Markets Summary Note: As of 9/30/2013. (1) Includes 377 properties in which we hold an approximate one-third interest. Represents 32 markets in 19 states. Represents property acquisition cost less accumulated depreciation. Properties Owned 1 Net Book Value Averages per Property Market Units % of Total $ millions % of Total Avg. per Property 3 Square Footage Property Age (Years) Dallas-Fort Worth, TX 1,861 8.8% 288 $ 8.2% 154,462 $ 2,200 10.2 Indianapolis, IN 1,845 8.7% 267 7.6% 144,937 1,879 11.6 Greater Chicago Area, IL & IN 1,443 6.8% 211 6.0% 146,525 1,855 12.3 Atlanta, GA 1,341 6.3% 217 6.1% 161,604 2,163 13.0 Houston, TX 1,094 5.1% 189 5.4% 173,135 2,303 9.6 Cincinnati, OH 1,075 5.1% 183 5.2% 170,564 1,845 11.9 Phoenix, AZ 962 4.5% 144 4.1% 149,210 1,811 11.3 Charlotte, NC 961 4.5% 163 4.6% 169,379 1,947 10.7 Nashville, TN 905 4.3% 181 5.1% 200,107 2,190 9.5 Jacksonville, FL 893 4.2% 129 3.7% 144,870 1,926 9.6 All Other 2 8,887 41.8% 1,558 44.1% 175,312 1,904 10.9 Total / Average 21,267 100.0% 3,530 $ 100.0% 165,985 $ 1,969 11.0 |
|
|
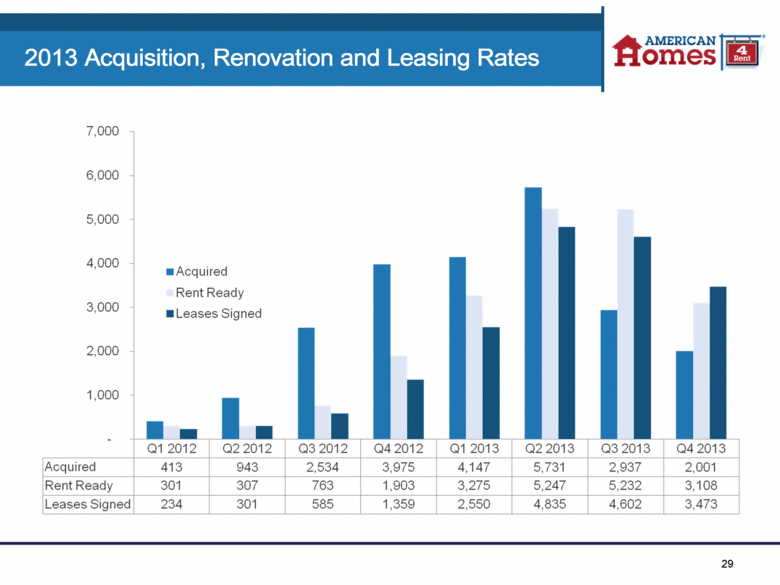
29 2013 Acquisition, Renovation and Leasing Rates |
|
|
30 Funds From Operations Reconciliation The following is a reconciliation of net loss attributable to common shareholders to FFO for three months ended September 30, 2013 (amounts in thousands, except share and per share information): We calculate FFO in accordance with the White Paper on FFO approved by the Board of Governors of the National Association of Real Estate Investment Trusts (“NAREIT”), which defines FFO as net income of loss calculated in accordance with Generally Accepted Accounting Principles (“GAAP”), excluding extraordinary items, as defined by GAAP, gains and losses from sales of depreciable real estate and impairment write-downs associated with depreciable real estate, plus real estate-related depreciation and amortization (excluding amortization of deferred financing costs and depreciation of non-real estate assets), and after adjustment for unconsolidated partnerships and joint ventures. Includes 162,725,150 weighted average Class A common shares and Class B common shares outstanding for the three months ended September 30, 2013 and assumes full conversion of all Operating Partnership units outstanding, including 13,787,292 Class A units, 31,085,974 Series C units, 4,375,000 Series D units and 4,375,000 Series E units. For the Three Months Ended Sept. 30, 2013 Net loss attributable to common shareholders (7,659) $ Adjustments: - Noncontrolling interests in the Operating Partnership 4,028 Depreciation and amortization of real estate assets 23,211 Funds from operations 19,580 $ Weighted average number of FFO shares 1 216,348,416 FFO per weighted average FFO share 0.09 $ |
|
|
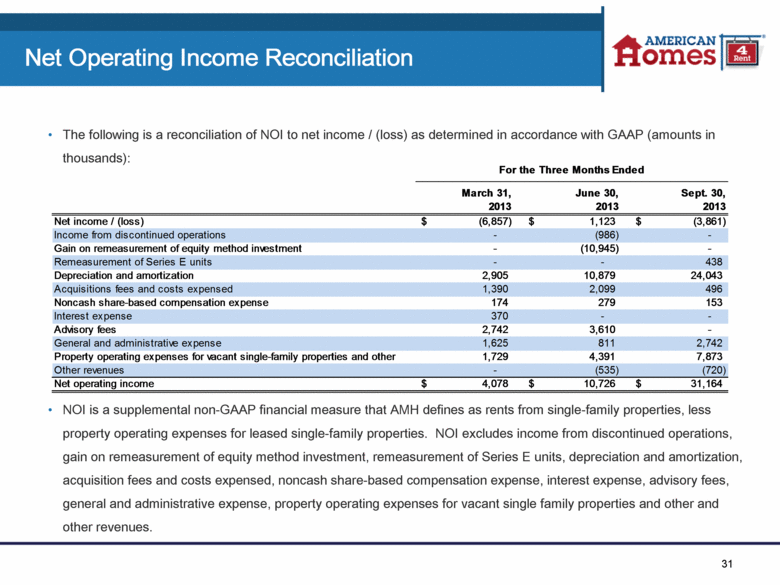
31 Net Operating Income Reconciliation The following is a reconciliation of NOI to net income / (loss) as determined in accordance with GAAP (amounts in thousands): NOI is a supplemental non-GAAP financial measure that AMH defines as rents from single-family properties, less property operating expenses for leased single-family properties. NOI excludes income from discontinued operations, gain on remeasurement of equity method investment, remeasurement of Series E units, depreciation and amortization, acquisition fees and costs expensed, noncash share-based compensation expense, interest expense, advisory fees, general and administrative expense, property operating expenses for vacant single family properties and other and other revenues. For the Three Months Ended March 31, June 30, Sept. 30, 2013 2013 2013 Net income / (loss) (6,857) $ 1,123 $ (3,861) $ Income from discontinued operations - (986) - Gain on remeasurement of equity method investment - (10,945) - Remeasurement of Series E units - - 438 Depreciation and amortization 2,905 10,879 24,043 Acquisitions fees and costs expensed 1,390 2,099 496 Noncash share-based compensation expense 174 279 153 Interest expense 370 - - Advisory fees 2,742 3,610 - General and administrative expense 1,625 811 2,742 Property operating expenses for vacant single-family properties and other 1,729 4,391 7,873 Other revenues - (535) (720) Net operating income 4,078 $ 10,726 $ 31,164 $ |
|
|
[LOGO] |

