Attached files
| file | filename |
|---|---|
| 8-K - ROSE 8K IR FEBRUARY PRESENTATION - NBL Texas, LLC | rose8k_irfebppt.htm |
Rosetta Resources Inc.
Investor Presentation
February 2014

Forward-Looking Statements and Terminology Used
This presentation includes forward-looking statements, which give the Company's current expectations or forecasts of future events
based on currently available information. Forward-looking statements are statements that are not historical facts, such as expectations
regarding drilling plans, including the acceleration thereof, production rates and guidance, resource potential, incremental
transportation capacity, exit rate guidance, net present value, development plans, progress on infrastructure projects, exposures to
weak natural gas prices, changes in the Company's liquidity, changes in acreage positions, expected expenses, expected capital
expenditures, and projected debt balances. The assumptions of management and the future performance of the Company are subject
to a wide range of business risks and uncertainties and there is no assurance that these statements and projections will be met. There
are risks and uncertainties associated with the Company’s recent acquisition of Permian Basin assets. Factors that could affect the
Company's business include, but are not limited to: the risks associated with drilling of oil and natural gas wells; the Company's ability
to find, acquire, market, develop, and produce new reserves; the risk of drilling dry holes; oil and natural gas price volatility; derivative
transactions (including the costs associated therewith and the abilities of counterparties to perform thereunder); uncertainties in the
estimation of proved, probable, and possible reserves and in the projection of future rates of production and reserve growth;
inaccuracies in the Company's assumptions regarding items of income and expense and the level of capital expenditures;
uncertainties in the timing of exploitation expenditures; operating hazards attendant to the oil and natural gas business; drilling and
completion losses that are generally not recoverable from third parties or insurance; potential mechanical failure or underperformance
of significant wells; availability and limitations of capacity in midstream marketing facilities, including processing plant and pipeline
construction difficulties and operational upsets; climatic conditions; availability and cost of material, supplies, equipment and services;
the risks associated with operating in a limited number of geographic areas; actions or inactions of third-party operators of the
Company's properties; the Company's ability to retain skilled personnel; diversion of management's attention from existing operations
while pursuing acquisitions or dispositions; availability of capital; the strength and financial resources of the Company's competitors;
regulatory developments; environmental risks; uncertainties in the capital markets; general economic and business conditions; industry
trends; and other factors detailed in the Company's most recent Form 10-K, Form 10-Q and other filings with the Securities and
Exchange Commission. If one or more of these risks or uncertainties materialize (or the consequences of such a development
changes), or should underlying assumptions prove incorrect, actual outcomes may vary materially from those forecasted or expected.
The Company undertakes no obligation to publicly update or revise any forward-looking statements except as required by law. For
filings reporting year-end 2013 reserves, the SEC permits the optional disclosure of probable and possible reserves. The Company
has elected not to report probable and possible reserves in its filings with the SEC. We use the term “net risked resources” or
“inventory” to describe the Company’s internal estimates of volumes of natural gas and oil that are not classified as proved reserves
but are potentially recoverable through exploratory drilling or additional drilling or recovery techniques. Estimates of unproved
resources are by their nature more speculative than estimates of proved reserves and accordingly are subject to substantially greater
risk of actually being realized by the Company. Estimates of unproved resources may change significantly as development provides
additional data, and actual quantities that are ultimately recovered may differ substantially from prior estimates.
2
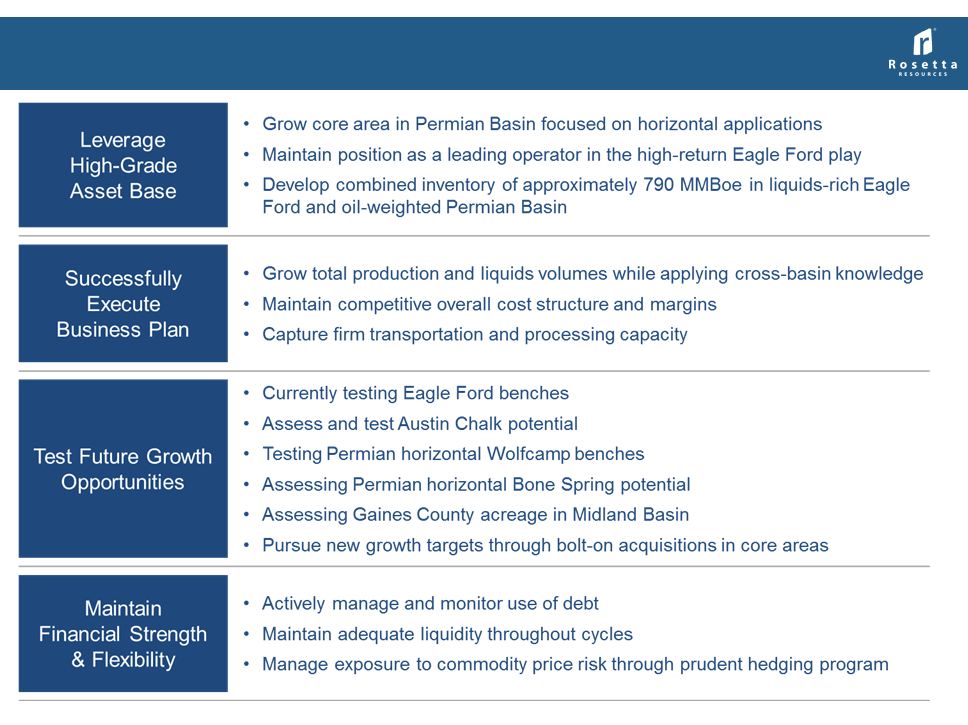
Company Strategy - Key Elements
3
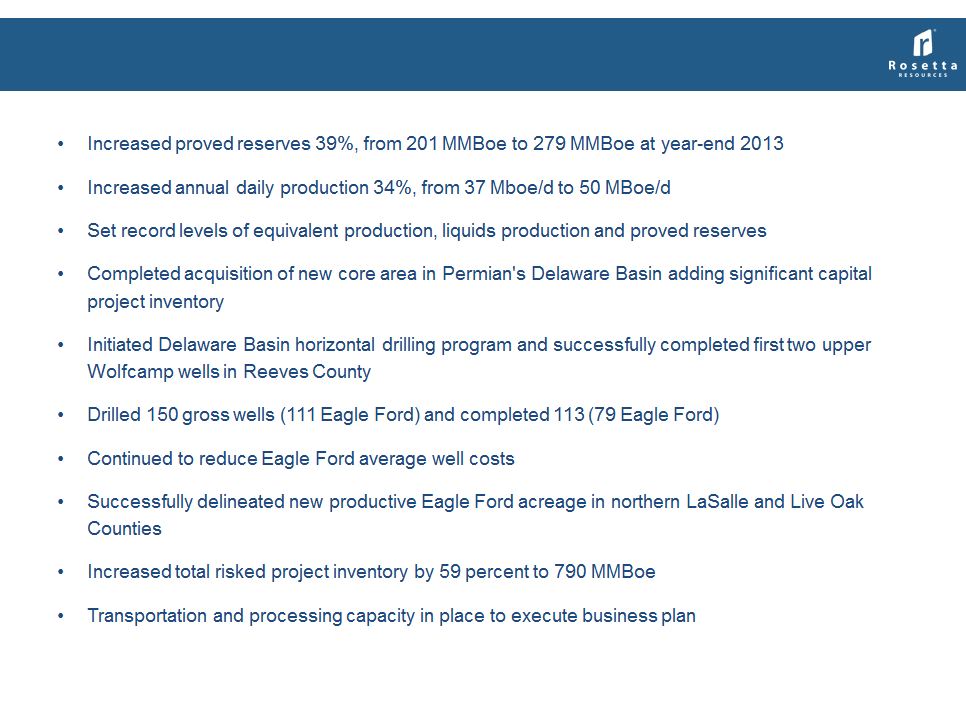
2013 Highlights
4

Rosetta Resources Asset Overview

Strong Growth Track Record
6

2014 Capital Program ($1.1 Billion1)
7

8
EAGLE FORD CORE AREA
Gates Ranch Development Timeline
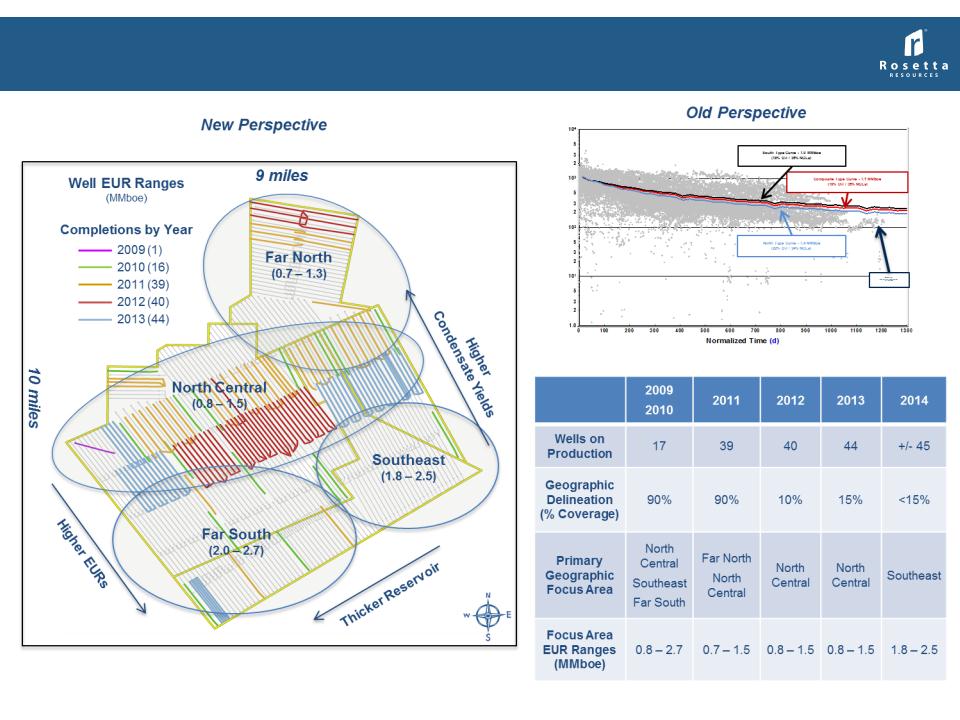
Eagle Ford Producing Wells By Year with EUR expectations
Eagle Ford Producing Wells By Year with EUR expectations
9
10
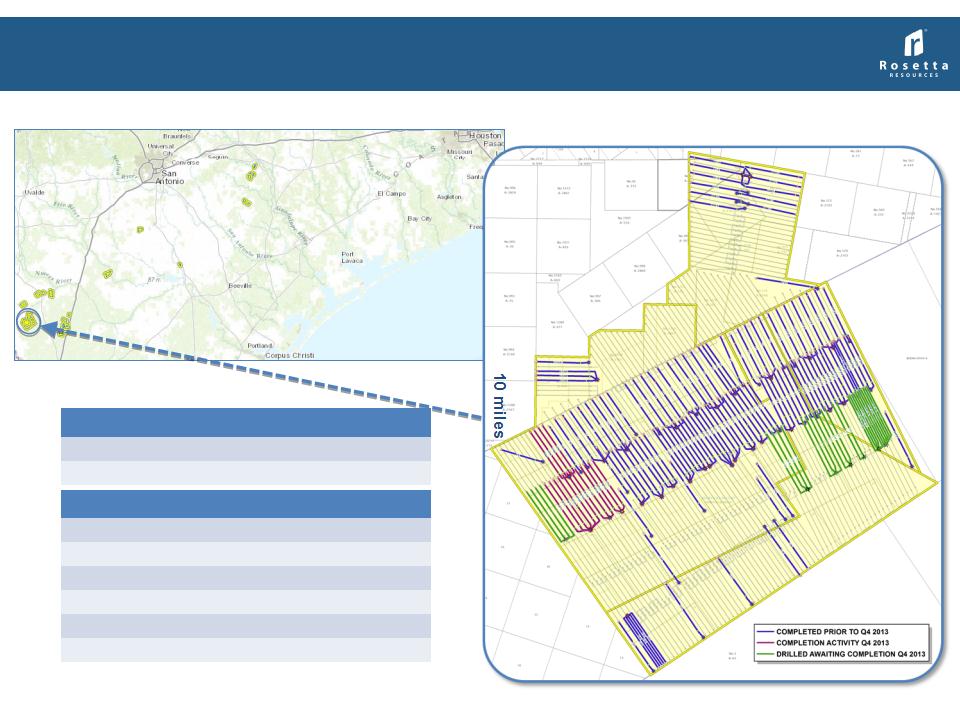
Gates Ranch
~26,200 net acres in Webb County
~26,200 net acres in Webb County
|
Eagle Ford - Dec 31, 2013 Summary
|
|
|
Completions to date:
|
140 gross completions
|
|
Locations remaining:
|
292 net well locations1
|
|
|
|
|
Average2 Lower EF Well Characteristics
|
|
|
Well Costs:
|
$6.0 - $6.5 MM
|
|
Spacing:
|
55 acres (475 feet apart)
|
|
P50 Composite EUR:
|
1.67 MMBoe (0.7 - 2.7 range)
|
|
Condensate Yield:
|
55 Bbls/MMcf (30 - 80 range)
|
|
NGL Yield:
|
110 Bbls/MMcf
|
|
Shrinkage:
|
23%
|
4Q 2013: 16 completions
1. Under current 55-acre spacing assumptions
2. Based on 5,000’ lateral length and 15-stage completion
9 miles
55 wells
Our largest continuous group of
producing wells spaced on 55
acres
producing wells spaced on 55
acres
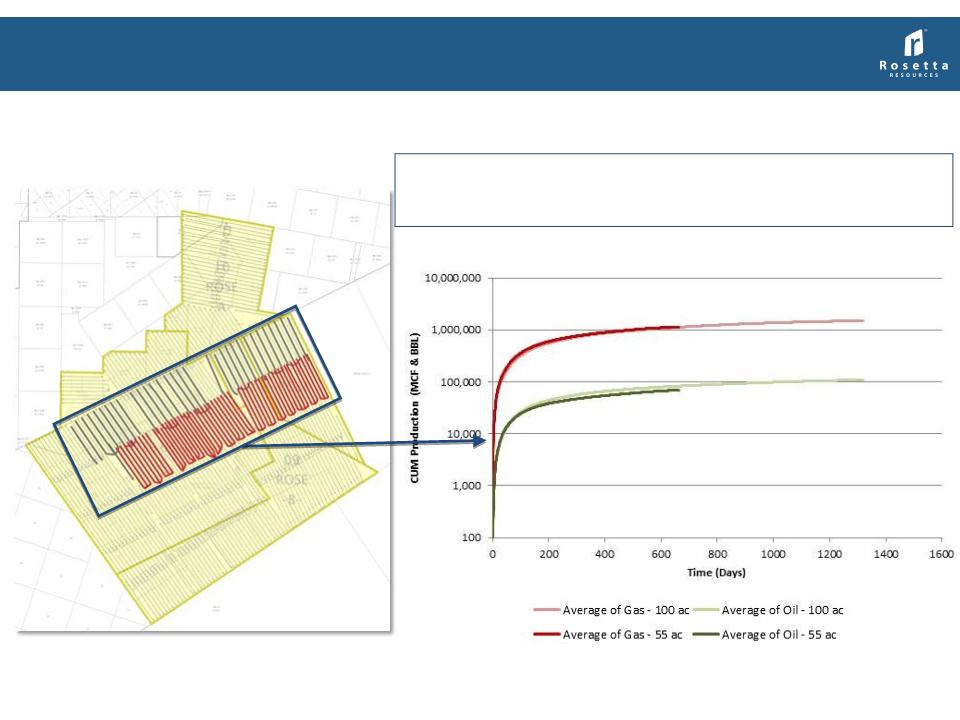
Well Performance on 55 acres
Compared to similar offsetting wells spaced at 100 acres
Compared to similar offsetting wells spaced at 100 acres
The 55 wells are performing in line with 33 comparable offsetting wells albeit
at anticipated lower condensate yields. First row offset wells were drilled
and completed early in the development of the area and spaced on 100 acres …
11
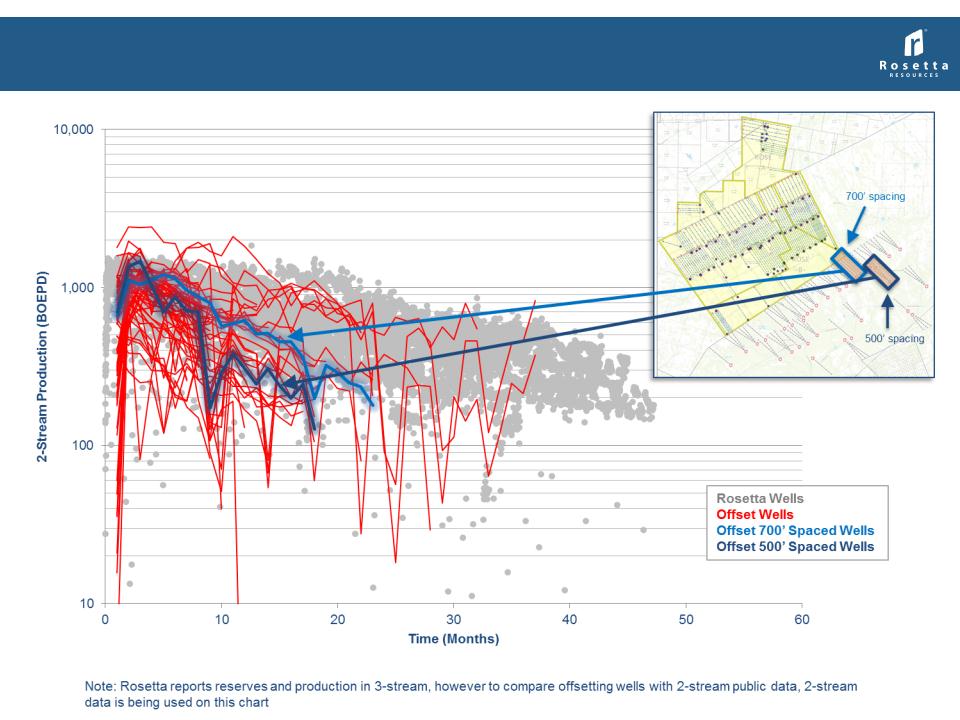
Gates Ranch - Offsetting Southern Wells
Far South & Southeast Well Spacing Performance Comparison
Far South & Southeast Well Spacing Performance Comparison
12
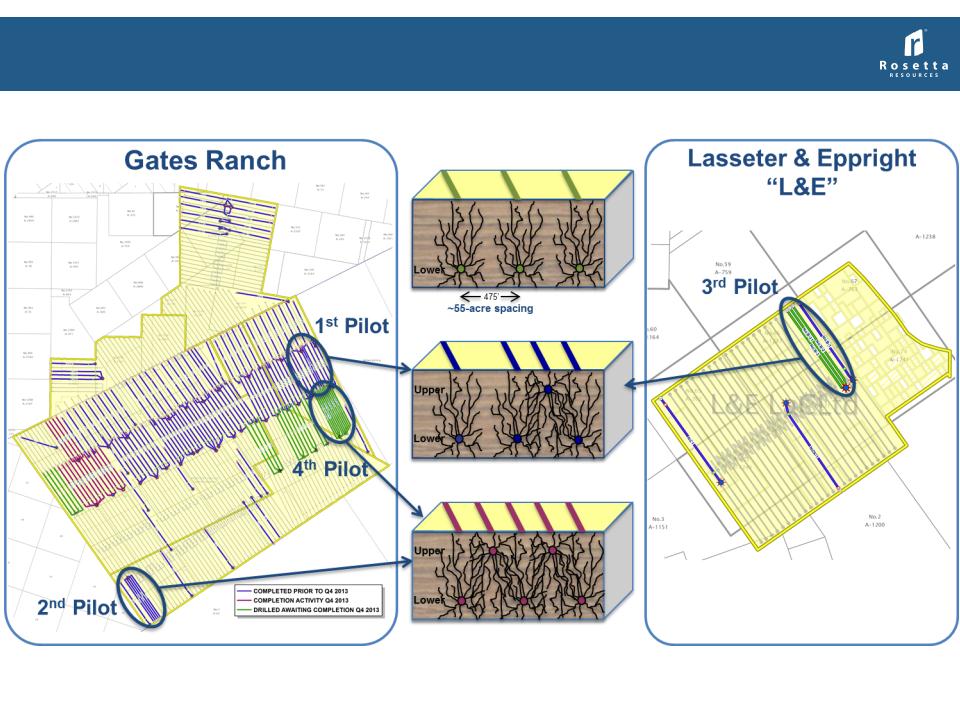
Upper Eagle Ford Pilot Areas
13

Briscoe Ranch
~3,600 net acres in southern Dimmit County
~3,600 net acres in southern Dimmit County
14
|
Dec 31, 2013 Summary
|
|
|
Completions to date:
|
16 gross completions
|
|
Locations remaining:
|
52 net well locations
|
|
|
|
|
Average Well Characteristics
|
|
|
Well Costs:
|
$6.0 - $6.5 MM
|
|
Spacing:
|
50 acres (425 feet apart)
|

Central Dimmit County Area
~8,500 net acres located in Dimmit County
~8,500 net acres located in Dimmit County
15
|
Dec 31, 2013 Summary
|
|
|
Completions to date:
|
12 gross completions
|
|
Locations remaining:
|
103 net well locations
|
|
|
|
|
Average Well Costs
|
|
|
Light Ranch & Vivion:
|
$5.5 - $6.0 MM
|
|
Lasseter & Eppright:
|
$6.0 - $6.5 MM
|
3 completions
Lasseter & Eppright
Light Ranch
6 total completions
Vivion
3 completions

Lopez Farm-In
~500 net acres in Live Oak County
~500 net acres in Live Oak County
|
Dec 31, 2013 Summary
|
|
|
Farm-In from Killam Oil
|
|
|
BPO:
|
100% WI, 75% NRI
|
|
APO:
|
65% WI, 48.75 NRI
|
|
Completions to date:
|
3 completions
|
|
Locations remaining:
|
5 net well locations
|
|
|
|
|
Average Well Characteristics
|
|
|
Well Costs:
|
$7.5 - $8.0 MM
|
|
Spacing:
|
~50 acres (400 feet apart)
|
16
7-day gross stabilized IP
1,966 Boe/d
(46% oil / 24% NGLs)

Tom Hanks
~3,500 net acres in LaSalle County
~3,500 net acres in LaSalle County
Eagle Ford Well
|
Dec 31, 2013 Summary
|
|
|
Completions to date:
|
5 gross completions
• Eagle Ford (EF) development
• Pearsall exploration
|
|
|
|
|
Average EF Well Characteristics
|
|
|
Well Costs:
|
$5.5 - $7.0 MM
|
|
Spacing:
|
~50 acres (400 feet apart)
|
|
Completions to date:
|
4 EF completion
|
|
Locations remaining:
|
51 net EF well locations
|
7-day gross stabilized IP
657 Boe/d (91% oil)
657 Boe/d (91% oil)
• 1 completion - exploration
• Un-stabilized test rate at 5 MMcf/d
• Gas content includes 1% H2S
17
18
PERMIAN BASIN CORE AREA

Permian - Reeves County
~41,000 net acres1
~41,000 net acres1
19
9
10
77
11
19
53
13
26
29
6
14
17
30
30
14
30
19
31
43
44
41
14
27
9
12
26
8
5
24
12
1
23
11
25
7
24
25
13
30
1
23
263
3
5
4
6
1
1
199
257
14
264
269
12
198
23
24
13
24
270
16
17
18
13
24
22
21
1
24
22
23
20
21
19
8
272
29
30
25
26
27
28
29
30
25
208
20
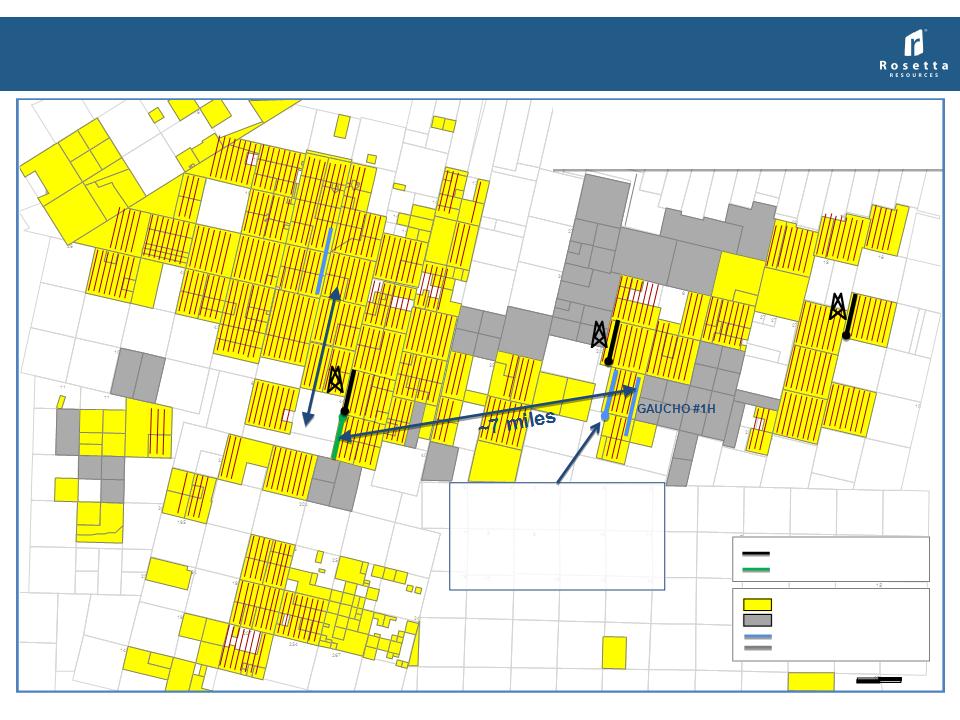
BALMORHEA 32-15 #1H
FEET
0
5,000
Gaucho 15-2H
Completed 12/2013
7-day gross stabilized IP, Boe/d
829 (74% oil / 10% NGLs)
Current Horizontal Drilling
Rosetta Operated
Other Operators
Rosetta Operated
Rosetta Non-Operated
21
20
19
611 gross operated (Avg 74% WI)
Horizontal Well Locations1
Horizontal Well Locations1
Permian - Horizontal Development Plan 12/31/2013
20
1. Horizontal project count includes potential in multiple horizons (Wolfcamp A, B-C, and 3rd Bone Spring).
Hz Drilled Awaiting Completion
~2.5 miles

Total Company Inventory
+/- 1,650 net wells -- remaining as of 12/31/2013 (excluding Upper Eagle Ford)
+/- 1,650 net wells -- remaining as of 12/31/2013 (excluding Upper Eagle Ford)
21
|
|
Net acres
|
Drilling rig
activity |
Wells
completed by Rosetta
|
Wells awaiting
completion |
Well Spacing
|
Remaining
locations |
Avg Cost /
Well ($M) |
Years remaining
|
|
Gates Ranch
(75% NRI) |
26,200
|
2 - 3
|
140
|
28
|
55
|
292
|
$6.0- $6.5
|
|
|
Briscoe Ranch
(81.3% NRI) |
3,600
|
1
|
16
|
16
|
50
|
52
|
$6.0 - $6.5
|
|
|
Central Dimmit1
(75 - 77% NRI) |
8,500
|
1
|
12
|
7
|
60
|
103
|
$5.5 - $7.0
|
|
|
Tom Hanks
(77% NRI) |
3,500
|
0 - 1
|
4
|
10
|
50
|
51
|
$5.5 - $7.0
|
|
|
Lopez
(75% NRI) |
500
|
1
|
3
|
0
|
50
|
5
|
$7.5 - $8.0
|
|
|
Undelineated Acreage2
(75 - 77% NRI) |
5,900
|
-
|
0
|
0
|
50 - 70
|
47
|
$5.5 - $7.0
|
|
|
Encinal
(75 - 77% NRI) |
12,700
|
-
|
4
|
0
|
80
|
96
|
$6.0 - $6.5
|
|
|
Total Eagle Ford3
|
60,900
|
4 - 5
|
179
|
61
|
50 - 80
|
646
|
$5.5 - $8.0
|
7
(90 wells per year)
|
|
Tom Hanks (Pearsall)
|
|
-
|
1
|
0
|
60
|
39
|
Exploration
|
|
|
Permian (Reeves Co.)
Vertical
|
41,000
|
2
|
31
|
3
|
20
|
510
|
$3.2 - $3.5
|
|
|
Permian (Reeves Co.)
Horizontal4
|
4
|
2
|
0
|
660’ between
laterals
|
446
|
$8.0 - $8.5
|
|
|
|
Total Company
|
101,900
|
9 - 11
|
213
|
64
|
20 - 80
|
1,641
|
$3.2 - $8.5
|
17 - 18
|
1. Central Dimmit includes L&E, Vivion and Light Ranch
2. Denotes roughly 5,900 net acres in the liquids window of the play
3. Excludes producing areas in Karnes Trough that are fully developed
4. Horizontal project count includes potential in multiple horizons (Wolfcamp A, B-C, and 3rd Bone Springs)

22
MARKETING AND FINANCIAL OVERVIEW

Gas Transportation Capacity
Firm gross wellhead gas takeaway
• 245 MMcf/d today
Four processing options - Gathering (Plant)
• Regency (Enterprise Plants)
• Energy Transfer “ETC” Dos Hermanas (King Ranch)
• Eagle Ford Gathering (Copano Houston Central)
• ETC Rich Eagle Ford Mainline (LaGrange/Jackson)
Oil Transportation Capacity
Gates Ranch, Briscoe Ranch & Central Dimmit Co.
• Plains Crude Gathering - Firm gathering capacity of 25,000 Bbls/d to Gardendale hub with up to
60,000 Bbls storage; operating since April 2012
60,000 Bbls storage; operating since April 2012
• Access to truck and rail loading and pipeline connections
Karnes Trough
• Rosetta-owned oil truck-loading facility operating since late July 2012
• Trucking readily available
Eagle Ford Multiple Takeaway Options
23
Gates Ranch NGL
Breakdown January 2014

Oil
• Currently trucked from leases
• Oil gravity range 45 - 49 degrees and receives no gravity deducts
Natural Gas
• Gas is rich and is processed at two plants
• Most leases under long-term gathering agreement
• Residue gas sales tied to Waha and Permian indices
NGLs
• NGLs extracted under firm, multi-year gathering/processing agreements
• Combination of net proceeds and Mont Belvieu pricing
Permian Basin Marketing
24

Commodity Derivatives Position - February 24, 2014
25

Liquidity
Adequate liquidity available to fund 2014 $1.1 billion capital program
26

Investment Summary
• Drill-bit focused producer with large acreage positions in liquids-rich
Eagle Ford and oil-weighted Permian Basin plays
Eagle Ford and oil-weighted Permian Basin plays
• Attractive core Delaware Basin position
• Successful operator in the high-return Eagle Ford area
• Large inventory of future growth opportunities
• Financial strength and flexibility; conservative philosophy
27
“Rosetta Resources - Building Rock Solid Value”

28
APPENDIX

Drilling Time Performance

Well Cost Performance - Permian Horizontals
30

Well Cost Performance - Permian Verticals
31

Attractive Well Economics (Typical Well)
32

Gates Ranch - Far South
P50 Type Curve
P50 Type Curve
EUR 2.35 MMBoe (2.0-2.7)
16% Oil / 39% NGLs
Rosetta Wells
#4-19 (3,700’ lateral)
33

Gates Ranch - Southeast
P50 Type Curve
P50 Type Curve
EUR 2.15 MMBoe (1.8-2.5)
16% Oil / 39% NGLs
Rosetta Wells
#4-19 (3,700’ lateral)
34

Gates Ranch - North Central excluding 9-5
P50 Type Curve
P50 Type Curve
EUR 1.13 MMBoe (0.8-1.5)
20% Oil / 37% NGLs
35

Gates Ranch - Far North
P50 Type Curve
P50 Type Curve
EUR 1.02 MMBoe (0.7-1.3)
20% Oil / 37% NGLs
36

P50 Type Curve - 925 MBoe
(22% Oil / 41% NGLs)
Briscoe Ranch
(days)
Initial Well
37

(days)
P50 Type Curve - 892 MBoe
(42% Oil / 29% NGLs)
Central Dimmit - Lasseter & Eppright
38

Permian - Reeves County
Vertical Wolfbone
Vertical Wolfbone
Central
East
Normalized Time (year)
Normalized Time (year)
|
Wolfbone Area
|
Central
|
East
|
|
Well Costs ($MM):
|
$3.5
|
$3.5
|
|
Spacing:
|
20-acre
|
20-acre
|
|
30-Day IP Boepd (gross):
|
237
|
269
|
|
Composite EUR Mboe (gross):
|
255
|
226
|
|
% Oil:
|
70%
|
65%
|
|
% NGL:
|
16%
|
19%
|
39
Permian - Reeves County
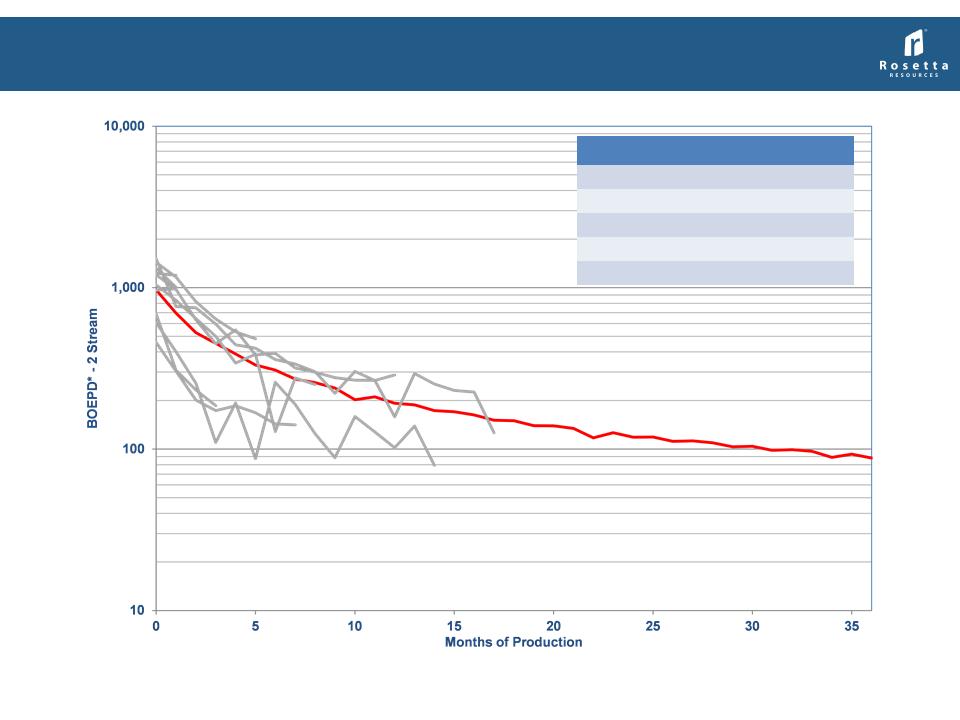
Upper Wolfcamp Horizontal Type Curve
Upper Wolfcamp Horizontal Type Curve
40
*All production data normalized to 5,000' lateral length
Note: Rosetta reports reserves and production in 3-stream, however to compare offsetting wells with 2-stream public data, 2-stream
data is being used on this chart
data is being used on this chart
|
P50 Type Curve
|
|
|
Average Well Costs ($MM)
|
$8.5
|
|
30-Day IP Boepd (gross)
|
1,090
|
|
Composite EUR Mboe (gross)
|
550
|
|
% Oil
|
74%
|
|
% NGL
|
10%
|

|
($ in millions)
|
|
|
|
|
|
|
|
Year ended December 31,
|
||||
|
|
2011
|
|
2012
|
|
2013
|
|
Net Income
|
$100.5
|
|
$159.3
|
|
$199.4
|
|
Income tax expense
|
55.7
|
|
95.9
|
|
110.6
|
|
Interest expense, net of interest capitalized
|
21.3
|
|
24.3
|
|
36
|
|
Other income (expense), net
|
0.9
|
|
0.1
|
|
0.3
|
|
Depreciation, depletion and amortization
|
123.2
|
|
154.2
|
|
218.6
|
|
EBITDA
|
$301.7
|
|
$433.8
|
|
$564.9
|
|
Unrealized derivative loss (gain)
|
(1.2)
|
|
(19.7)
|
|
16.3
|
|
Stock-based compensation expense
|
29
|
|
18.5
|
|
11
|
|
Adjusted EBITDA
|
$329.5
|
|
$432.7
|
|
$592.2
|
|
|
|
|
|
|
|
Adjusted EBITDA Reconciliation
41
EBITDA is calculated as net income, excluding income tax expense, interest expense, net of interest
capitalized, other income (expense), net, and depreciation, depletion and amortization. Adjusted EBITDA
is calculated as EBITDA excluding unrealized gains or losses on derivative instruments and stock-based
compensation expense.
capitalized, other income (expense), net, and depreciation, depletion and amortization. Adjusted EBITDA
is calculated as EBITDA excluding unrealized gains or losses on derivative instruments and stock-based
compensation expense.

Debt and Capital Structure
42