Attached files
| file | filename |
|---|---|
| 8-K - FORM 8-K - QUAKER CHEMICAL CORP | v369852_8k.htm |
| EX-99.1 - EXHIBIT 99.1 - QUAKER CHEMICAL CORP | v369852_ex99-1.htm |

1 Quaker Chemical Corporation Investor Conference Call February 28, 2014 Fourth Quarter and Full Year 2013 Results

2 Regulation G The attached charts include Company information that does not conform to generally accepted accounting principles (GAAP). Management believes that an analysis of this data is meaningful to investors because it provides insight with respect to ongoing operating results of the Company and allows investors to better evaluate the financial results of the Company. These measures should not be viewed as an alternative to GAAP measures of performance. Furthermore, these measures may not be consistent with similar measures provided by other companies. This data should b e read in conjunction with the C ompany’s fourth quarter earnings news release dated February 27, 2014, which has been furnished to the SEC on Form 8-K, and the Company’s Form 10-K for the year ended December 31, 2013, which has been filed with the SEC. Forward-Looking Statements This presentation may contain forward-looking statements that are subject to certain risks and uncertainties that could cause actual results to differ materiall y from those projected in such statements. A major risk is that the Company’s demand is largely derived from the demand for its customers’ products, which subjects the Company to downturns in a customer’s business and unanticipated customer production shutdowns. Other major risks and uncertainties include, but are not limited to, significant increases in raw material costs, customer financial stability, worldwide economic and political conditions, foreign currency fluctuations, future terrorist attacks and other acts of violence. Other factors could also adversely affect us. Therefore, we caution you not to place undue reliance on our forward-looking statements. This discussion is provided as permitted by the Private Securities Litigation Reform Act of 1995. Risks and Uncertainties Statement

3 Speakers Michael F. Barry Chairman of the Board, Chief Executive Officer & President Margaret M. Loebl Vice President, Chief Financial Officer & Treasurer Robert T. Traub General Counsel Chart #1

4 Fourth Quarter 2013 Headlines ▪ Quarterly net sales growth of 7% despite a challenging economic environment ▪ Significant earnings per share growth compared to fourth quarter 2012 ▪ Strong quarterly performance drives year - to - date operating cash flow to $73.8 million Chart #2

5 Chairman Comments ▪ Q4 2013/Full Year x Solid sales/volume despite quarter seasonality x Strong margin levels continue in tough economy x Gaining share & leveraging acquisitions x Liquidity remains a Company strength x Very good year -- revenue, net income, net operating cash flow and adjusted EBITDA ▪ 2014 Outlook x Modest market growth amongst all regions x Furthering share gains and strategic initiatives x Competition /economic conditions /raw material costs – on - going challenges Q4 2013 And Full Year 2013 Chart #3 “We remain confident in our future and expect 2014 to be another good year for Quaker, as we strive to increase revenue and earnings for the fifth consecutive year.” -- Michael F. Barry, Chairman, CEO & President

6 Product Volume by Quarter Thousand Kilograms 25,000 30,000 35,000 40,000 45,000 50,000 55,000 4Q08 YTD Avg. 1Q092Q09 3Q094Q091Q102Q10 3Q104Q101Q11 2Q113Q114Q111Q12 2Q123Q124Q12 1Q132Q133Q134Q13 Chart #4
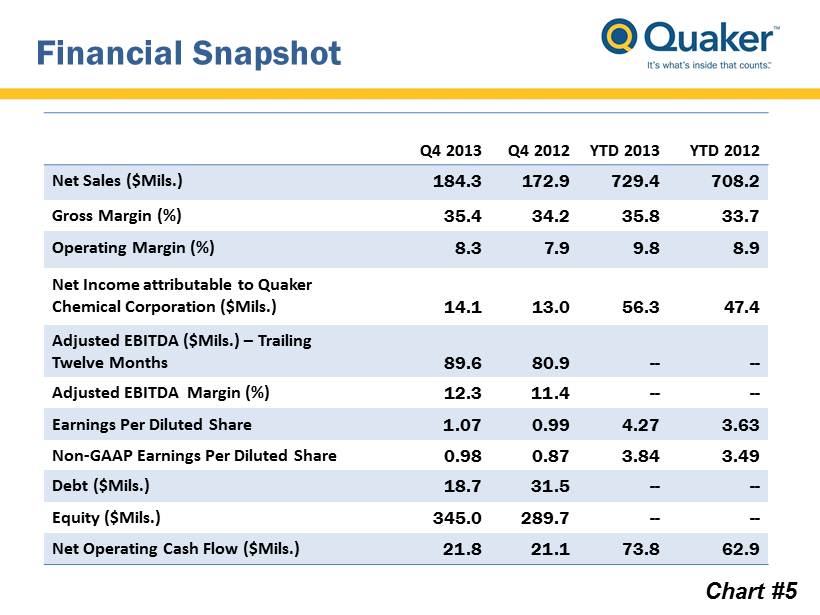
7 Financial Snapshot Q4 2013 Q4 2012 YTD 2013 YTD 2012 Net Sales ($Mils.) 184.3 172.9 729.4 708.2 Gross Margin (%) 35.4 34.2 35.8 33.7 Operating Margin (%) 8.3 7.9 9.8 8.9 Net Income attributable to Quaker Chemical Corporation ($Mils.) 14.1 13.0 56.3 47.4 Adjusted EBITDA ($Mils.) – Trailing Twelve Months 89.6 80.9 -- -- Adjusted EBITDA Margin (%) 12.3 11.4 -- -- Earnings Per Diluted Share 1.07 0.99 4.27 3.63 Non - GAAP Earnings Per Diluted Share 0.98 0.87 3.84 3.49 Debt ($Mils.) 18.7 31.5 -- -- Equity ($Mils.) 345.0 289.7 -- -- Net Operating Cash Flow ($Mils.) 21.8 21.1 73.8 62.9 Chart #5
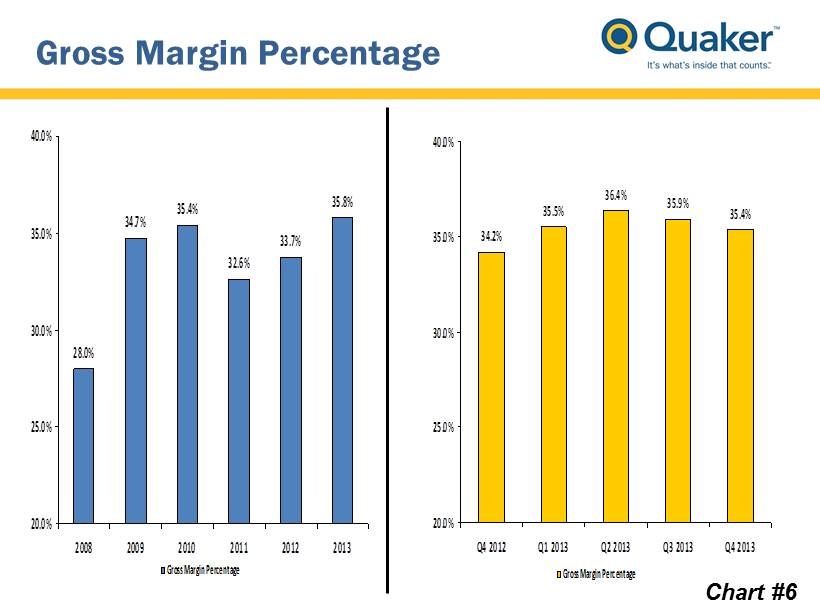
8 Gross Margin Percentage Chart #6 28.0% 34.7% 35.4% 32.6% 33.7% 35.8% 20.0% 25.0% 30.0% 35.0% 40.0% 2008 2009 2010 2011 2012 2013 Gross Margin Percentage 34.2% 35.5% 36.4% 35.9% 35.4% 20.0% 25.0% 30.0% 35.0% 40.0% Q4 2012 Q1 2013 Q2 2013 Q3 2013 Q4 2013 Gross Margin Percentage

9 Adjusted EBITDA Baseline Historical Performance $40.1 $44.2 $66.8 $73.0 $80.9 $89.6 6.90% 9.80% 12.30% 10.70% 11.40% 12.30% 2008 2009 2010 2011 2012 2013 Adjusted EBITDA ($ Mils.) Adjusted EBITDA Margin (%) Chart #7 CAGR: 17.5% +540 Margin bps 2008 – 2013

10 Balance Sheet Net Cash / (Debt) -$100 -$80 -$60 -$40 -$20 $0 $20 $40 $60 $80 2008 2009 2010 2011 2012 2013 $ Millions Cash ST/LT Debt Net Debt Chart #8
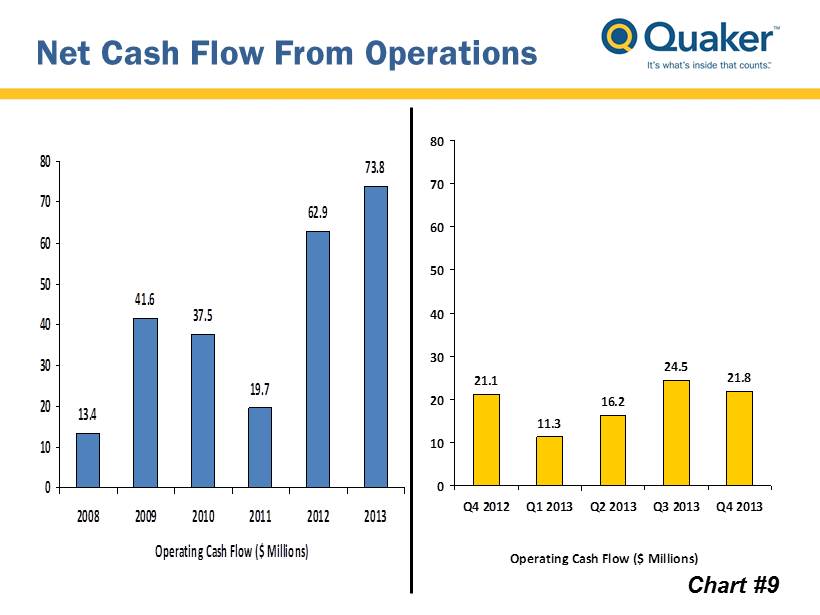
11 Net Cash Flow From Operations 21.1 11.3 16.2 24.5 21.8 0 10 20 30 40 50 60 70 80 Q4 2012 Q1 2013 Q2 2013 Q3 2013 Q4 2013 Operating Cash Flow ($ Millions) Chart #9 13.4 41.6 37.5 19.7 62.9 73.8 0 10 20 30 40 50 60 70 80 2008 2009 2010 2011 2012 2013 Operating Cash Flow ($ Millions)

12 APPENDIX
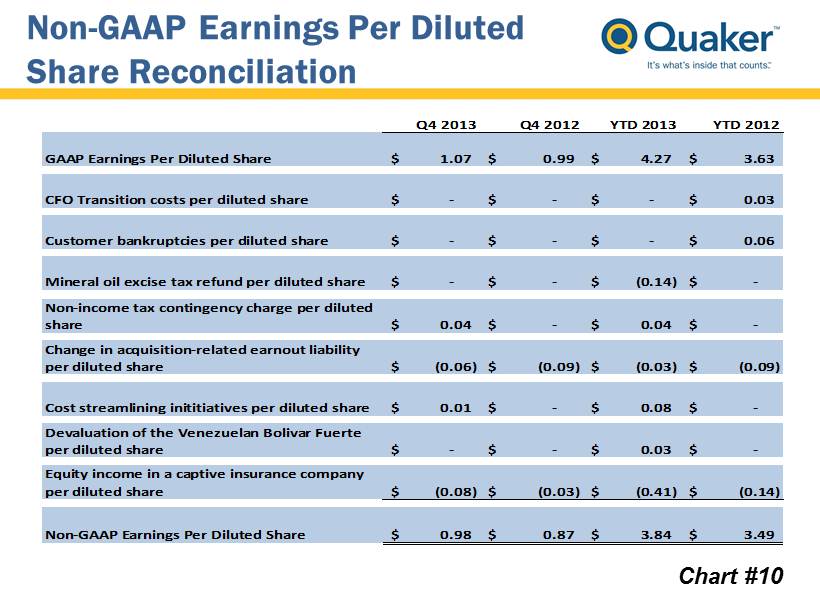
13 Chart #10 Non - GAAP Earnings Per Diluted Share Reconciliation Q4 2013 Q4 2012 YTD 2013 YTD 2012 GAAP Earnings Per Diluted Share 1.07$ 0.99$ 4.27$ 3.63$ CFO Transition costs per diluted share -$ -$ -$ 0.03$ Customer bankruptcies per diluted share -$ -$ -$ 0.06$ Mineral oil excise tax refund per diluted share -$ -$ (0.14)$ -$ Non-income tax contingency charge per diluted share 0.04$ -$ 0.04$ -$ Change in acquisition-related earnout liability per diluted share (0.06)$ (0.09)$ (0.03)$ (0.09)$ Cost streamlining inititiatives per diluted share 0.01$ -$ 0.08$ -$ Devaluation of the Venezuelan Bolivar Fuerte per diluted share -$ -$ 0.03$ -$ Equity income in a captive insurance company per diluted share (0.08)$ (0.03)$ (0.41)$ (0.14)$ Non-GAAP Earnings Per Diluted Share 0.98$ 0.87$ 3.84$ 3.49$

14 Annualized Adjusted EBITDA Reconciliation Chart #11 2008 2009 2010 2011 2012 2013 Net income 9,833 16,058 32,120 45,892 47,405 56,339 Depreciation 10,879 9,525 9,867 11,455 12,252 12,339 Amortization 1,177 1,078 988 2,338 3,106 3,445 Interest expense 5,509 5,533 5,225 4,666 4,283 2,922 Taxes on income 4,977 7,065 12,616 14,256 15,575 20,489 Restructuring and related activities 2,916 2,289 - - - - Non-income tax contingency charge - - 4,132 - - 796 Equity affiliate out of period charge - - 564 - - - Mineral oil excise tax refund - - - - - (2,540) Transition costs related to key employees 3,505 2,443 1,317 - 609 - Non-cash gain from the purchase of an equity affiliate - - - (2,718) - - Change in acquisition-related earnout liability - - - (595) (1,737) (497) Equity loss (income) from a captive insurance company 1,299 162 (313) (2,323) (1,812) (5,451) Devaluation of the Venezuelan Bolivar - - 322 - - 357 U.S customer bankruptcies - - - - 1,254 - Cost streamlining initiatives - - - - - 1,419 Adjusted EBITDA 40,095 44,153 66,838 72,971 80,935 89,618 Adjusted EBITDA Margin 6.9% 9.8% 12.3% 10.7% 11.4% 12.3% Multiply Adjusted EBITDA by Annual Run Rate 1 1 1 1 1 1 Annualized Adjusted EBITDA 40,095 44,153 66,838 72,971 80,935 89,618