Attached files
| file | filename |
|---|---|
| 8-K - ROSE 8K 4Q AND FULL YEAR 2013 EARNINGS CALL PRESENTATION - NBL Texas, LLC | rose8k_4q13fyerpresentation.htm |

Rosetta Resources Inc.
Fourth Quarter & Full Year 2013 Earnings Review
February 25, 2014

Earnings Call Agenda
Overview Jim Craddock
Financial Update John Hagale
Operational Update John Clayton
Closing Remarks Jim Craddock
2

2013 Highlights
3
|
Expense Guidance ($/Boe)
|
|
|
|
|
|
|
Direct Lease Operating Expense
|
|
$ 2.85
|
-
|
$ 3.10
|
|
|
Workover Expenses
|
|
0.60
|
-
|
0.70
|
|
|
Insurance
|
|
0.05
|
-
|
0.05
|
|
|
Ad Valorem Tax
|
|
0.65
|
-
|
0.75
|
|
|
Treating and Transportation
|
|
4.20
|
-
|
4.60
|
|
|
Production Taxes
|
|
1.30
|
-
|
1.40
|
|
|
DD&A
|
|
14.60
|
-
|
16.05
|
|
|
G&A, excluding Stock-Based Compensation
|
|
3.40
|
-
|
3.70
|
|
|
Interest Expense
|
|
2.55
|
-
|
2.80
|
|
2014 Guidance
|
Production Guidance (MBoe/d)
|
|
|
|
|
|
|
Average daily production
|
|
60
|
-
|
65
|
|
|
|
|
|
|
|
|
|
|
|
|
|
|
|
4

Strong Growth Track Record
5

Gates Ranch Development Timeline
Eagle Ford Producing Wells By Year with EUR expectations
Eagle Ford Producing Wells By Year with EUR expectations
6
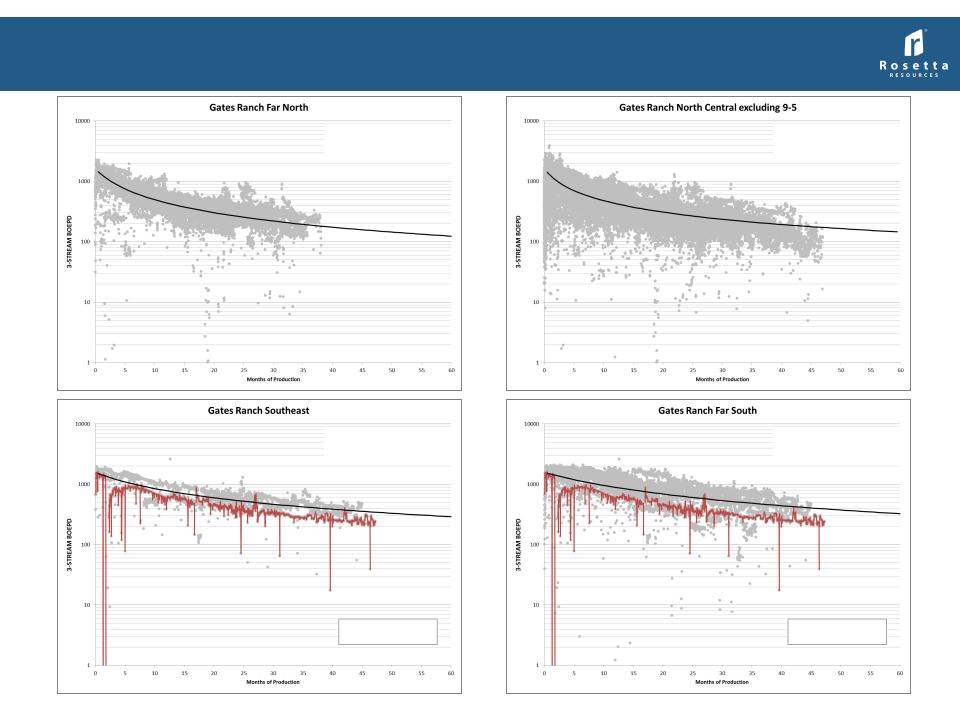
Gates Ranch - Lower Eagle Ford
Horizontal Well P50 Type Curves (3-stream)
Horizontal Well P50 Type Curves (3-stream)
7
EUR 1.02 MMBoe (0.7-1.3)
20% Oil / 37% NGLs
EUR 2.15 MMBoe (1.8-2.5)
16% Oil / 39% NGLs
EUR 1.13 MMBoe (0.8-1.5)
20% Oil / 37% NGLs
EUR 2.35 MMBoe (2.0-2.7)
16% Oil / 39% NGLs
Rosetta Wells
#4-19 (3,700’ lateral)
Rosetta Wells
#4-19 (3,700’ lateral)

55 wells
Our largest continuous group of
producing wells spaced on 55 acres
producing wells spaced on 55 acres
Well Performance on 55 acres
Compared to similar offsetting wells spaced at 100 acres
Compared to similar offsetting wells spaced at 100 acres
The 55 wells are performing in line with 33 comparable offsetting wells albeit at
anticipated lower condensate yields. First row offset wells were drilled and
completed early in the development of the area and spaced on 100 acres …
8

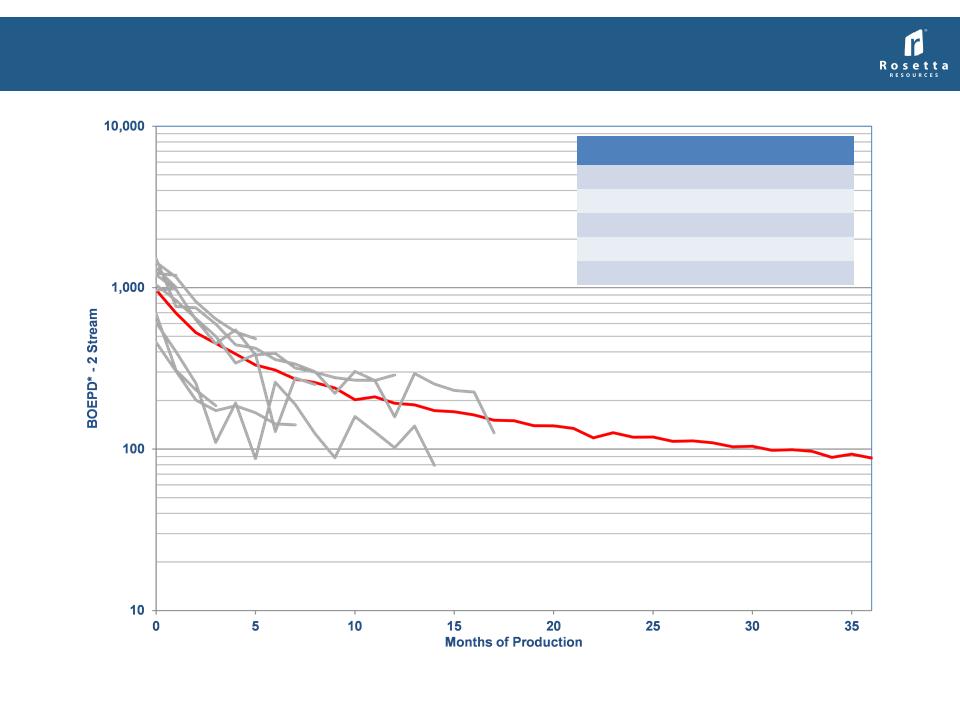
Gates Ranch - Offsetting Southern Wells
Well Spacing Performance Comparison
Well Spacing Performance Comparison
9
Note: Rosetta reports reserves and production in 3-stream, however to compare offsetting wells with 2-stream public
data, 2-stream data is being used on this chart
data, 2-stream data is being used on this chart

Upper Eagle Ford Pilot Areas
10

~2.5 miles
11
1. Horizontal project count includes potential in multiple horizons (Wolfcamp A, B-C, and 3rd Bone Spring)
Permian - Reeves County
Upper Wolfcamp Horizontal Type Curve
Upper Wolfcamp Horizontal Type Curve
12
*All production data normalized to 5,000' lateral length
Note: Rosetta reports reserves and production in 3-stream, however to compare offsetting wells with 2-stream public data, 2-stream
data is being used on this chart
data is being used on this chart
|
P50 Type Curve
|
|
|
Average Well Costs ($MM)
|
$8.5
|
|
30-Day IP Boepd (gross)
|
1,090
|
|
Composite EUR Mboe (gross)
|
550
|
|
% Oil
|
74%
|
|
% NGL
|
10%
|

Forward-Looking Statements and Terminology Used
This presentation includes forward-looking statements, which give the Company's current expectations or forecasts of future events based on currently
available information. Forward-looking statements are statements that are not historical facts, such as expectations regarding drilling plans, including
the acceleration thereof, production rates and guidance, resource potential, incremental transportation capacity, exit rate guidance, net present value,
development plans, progress on infrastructure projects, exposures to weak natural gas prices, changes in the Company's liquidity, changes in acreage
positions, expected expenses, expected capital expenditures, and projected debt balances. The assumptions of management and the future
performance of the Company are subject to a wide range of business risks and uncertainties and there is no assurance that these statements and
projections will be met. Factors that could affect the Company's business include, but are not limited to: the risks associated with drilling of oil and
natural gas wells; the Company's ability to find, acquire, market, develop, and produce new reserves; the risk of drilling dry holes; oil and natural gas
price volatility; derivative transactions (including the costs associated therewith and the abilities of counterparties to perform thereunder); uncertainties
in the estimation of proved, probable, and possible reserves and in the projection of future rates of production and reserve growth; inaccuracies in the
Company's assumptions regarding items of income and expense and the level of capital expenditures; uncertainties in the timing of exploitation
expenditures; operating hazards attendant to the oil and natural gas business; drilling and completion losses that are generally not recoverable from
third parties or insurance; potential mechanical failure or underperformance of significant wells; availability and limitations of capacity in midstream
marketing facilities, including processing plant and pipeline construction difficulties and operational upsets; climatic conditions; availability and cost of
material, supplies, equipment and services; the risks associated with operating in a limited number of geographic areas; actions or inactions of third-
party operators of the Company's properties; the Company's ability to retain skilled personnel; diversion of management's attention from existing
operations while pursuing acquisitions or dispositions; availability of capital; the strength and financial resources of the Company's competitors;
regulatory developments; environmental risks; uncertainties in the capital markets; general economic and business conditions; industry trends; and
other factors detailed in the Company's most recent Form 10-K, Form 10-Q and other filings with the Securities and Exchange Commission. If one or
more of these risks or uncertainties materialize (or the consequences of such a development changes), or should underlying assumptions prove
incorrect, actual outcomes may vary materially from those forecasted or expected. The Company undertakes no obligation to publicly update or revise
any forward-looking statements except as required by law. For filings reporting year-end 2013 reserves, the SEC permits the optional disclosure of
probable and possible reserves. The Company has elected not to report probable and possible reserves in its filings with the SEC. We use the term
“net risked resources” or “inventory” to describe the Company’s internal estimates of volumes of natural gas and oil that are not classified as proved
reserves but are potentially recoverable through exploratory drilling or additional drilling or recovery techniques. Estimates of unproved resources are
by their nature more speculative than estimates of proved reserves and accordingly are subject to substantially greater risk of actually being realized by
the Company. Estimates of unproved resources may change significantly as development provides additional data, and actual quantities that are
ultimately recovered may differ substantially from prior estimates.
13