Attached files
| file | filename |
|---|---|
| 8-K/A - CUSTOMERS BANCORP, INC. FORM 8-K/A - Customers Bancorp, Inc. | customers8ka.htm |

Focused on Delivering Profitable Growth
Investor Presentation
February 2014
NASDAQ: CUBI

2
This presentation as well as other written or oral communications made from time to time by us, may contain certain forward-looking information within the meaning of
the Securities Act of 1933, as amended, and the Securities Exchange Act of 1934, as amended. These statements relate to future events or future predictions, including
events or predictions relating to our future financial performance, and are generally identifiable by the use of forward-looking terminology such as “believes,” “expects,”
“may,” “will,” “should,” “plan,” “intend,” “on condition,” “target,” “estimates,” “preliminary,” or “anticipates” or the negative thereof or comparable terminology, or by
discussion of strategy or goals or other future events, circumstances or effects. These forward-looking statements regarding future events and circumstances involve
known and unknown risks, uncertainties and other factors that may cause our actual results, levels of activity, financial condition, performance or achievements to be
materially different from any future results, levels of activity, financial condition, performance or achievements expressed or implied by such forward-looking
statements. This information is based on various assumptions, estimates or judgments by us that may not prove to be correct.
Important factors to consider and evaluate in such forward-looking statements include:
§availability and adequacy of cash flow to meet our debt service requirements under the notes;
§changes in competitive and market factors might affect our results or operations;
§changes in laws and regulations, including without limitation changes in capital requirements under the Basel III capital proposals;
§changes in our business strategy or an inability to execute our strategy due to the occurrence of unanticipated events;
§our ability to identify potential candidates for, and consummate, acquisition or investment transactions;
§the timing and results of acquisitions or investment transactions;
§our failure to complete any or all of the transactions described herein on the terms currently contemplated;
§local, regional, national, and international economic conditions and events and the impact they may have on us and our customers, including our operations and
investments, both in the United States and contemplated in India;
investments, both in the United States and contemplated in India;
§targeted or estimated returns on assets and equity, growth rates and future asset levels;
§our ability to attract deposits and other sources of liquidity and capital;
§changes in the financial performance and/or condition of our borrowers, and issuers of securities we hold;
§changes in the level of non-performing and classified assets and charge-offs;
§changes in estimates of future loan loss reserve requirements based upon the periodic review thereof under relevant regulatory and accounting requirements, as well
as changes in borrowers’ payment behavior and creditworthiness;
as changes in borrowers’ payment behavior and creditworthiness;
§changes in our capital structure resulting from future capital offerings or acquisitions;
§inflation, interest rate, securities market and monetary and foreign currency fluctuations, both in the United States, and internationally, especially in India due to our
pending strategic investment
pending strategic investment
§the effects on our mortgage warehouse lending and retail mortgage businesses of changes in the mortgage origination markets, including changes due to changes in
monetary policies, interest rates and the regulation of mortgage originators, services and securitizers;
monetary policies, interest rates and the regulation of mortgage originators, services and securitizers;
§timely development and acceptance of new banking products and services and perceived overall value of these products and services by users;
§changes in consumer spending, borrowing and saving habits;
§technological changes;
§our ability to grow, increase market share and control expenses, and maintain sufficient liquidity;
Forward Looking Statements
timely development and acceptance of new banking products and services and perceived overall value of these products and services by users; volatility in the credit and equity markets and its effect on the general economy; the potential for customer fraud, especially in our mortgage warehouse lending business; effects of changes in accounting policies and practices, as may be adopted by the regulatory agencies, as well as the Public Company Accounting Oversight Board, the Financial Accounting Standards Board and other accounting standard setters; the businesses of the Bank and any acquisition targets, merger partners or strategic investments, and their subsidiaries not integrating successfully or such integration being more difficult, time-consuming or costly than expected; our ability to integrate currently contemplated and future acquisition targets and investments may be unsuccessful, or may be more difficult, time-consuming or costly than expected; material differences in the actual financial results of merger, acquisition, and investment activities compared with expectations; investments in new markets, domestic or foreign, where we have little or no experience; the levels of activity and revenue from referrals from contractual or investment arrangements; and the liquidity and values of our strategic investments, including foreign strategic investments in India. These forward-looking statements are subject to significant uncertainties and contingencies, many of which are beyond our control. Although we believe that the expectations reflected in the forward-looking statements are reasonable, we cannot guarantee future results, levels of activity, financial condition, performance or achievements. Accordingly, there can be no assurance that actual results and cash flows will meet our expectations or will not be materially lower than the results, cash flows, or financial condition contemplated in this presentation. You are cautioned not to place undue reliance on these forward-looking statements, which speak only as of the date of this document or, in the case of documents referred to or incorporated by reference, the dates of those documents. We do not undertake any obligation to release publicly any revisions to these forward-looking statements to reflect events or circumstances after the date of this document or to reflect the occurrence of unanticipated events. This presentation is for discussion purposes only, and shall not constitute any offer to sell or the solicitation of an offer to buy any security, nor is it intended to give rise to any legal relationship between Customers Bancorp, Inc. (the “Company”) and you or any other person, nor is it a recommendation to buy any securities or enter into any transaction with the Company. The information contained herein is preliminary and material changes to such information may be made at any time. If any offer of securities is made, it shall be made pursuant to a definitive offering memorandum or prospectus (“Offering Memorandum”) prepared by or on behalf of the Company, which would contain material information not contained herein and which shall supersede, amend and supplement this information in its entirety. Any decision to invest in the Company’s securities should be made after reviewing an Offering Memorandum, conducting such investigations as the investor deems necessary or appropriate, and consulting the investor’s own legal, accounting, tax, and other advisors in order to make an independent determination of the suitability and consequences of an investment in such securities. No offer to purchase securities of the Company will be made or accepted prior to receipt by an investor of an Offering Memorandum and relevant subscription documentation, all of which must be reviewed together with the Company’s then-current financial statements and, with respect to the subscription documentation, completed and returned to the Company in its entirety. Unless purchasing in an offering of securities registered pursuant to the Securities Act of 1933, as amended, all investors must be “accredited investors” as defined in the securities laws of the United States before they can invest in the Company.

4
Investment Proposition
§ ~$4.2 billion asset bank
§ Well capitalized at 13% + total risk based capital and 10% + tier 1 leverage
§ Target market from Boston to Washington D.C. along interstate 95
§ ROA of .95% and ROE of 9.49%; eight quarters of record core earnings
§ 3.18% net interest margin
§ 165% compounded annual growth in core earnings since 2010
§ Loan mix - 1/3 mortgage*, 1/3 commercial and 1/3 multi-family
§ 90% compounded annual growth in loans since 2009
§ DDA and total deposits compounded annual growth of 111% and 75% respectively since 2009
§ No charge-offs on loans originated after 2009
§ 0.43% non-performing assets (non-FDIC covered loans)
§ Total reserves to non-performing loans of 153%
§ Current share price ($19.67) is 11.7x estimated 2014 earnings, and 10.0x 2015 earnings
§ Price/tangible book estimated at 1.2x and 1.1x for 2014 and 2015 respectively
Strong Bank in Attractive Markets
Profitability
Balance Sheet
Credit Quality
Valuation
* Includes mortgage warehouse

5
Current Company Overview
Source: SNL Financial and Company data.
Note: Branch proposed in northeastern Philadelphia.
*Source: Company Documents.
~$4.2 bn institution with 18 sales offices with
target market from Boston to Washington D.C.
target market from Boston to Washington D.C.
Operating in key Mid-Atlantic and Northeast
markets
markets
§ New York City area (Westchester County and
Manhattan)
Manhattan)
§ Philadelphia area (Bucks, Berks, Chester, Delaware
and Philadelphia Counties in southeastern
Pennsylvania and Mercer county in New Jersey)
and Philadelphia Counties in southeastern
Pennsylvania and Mercer county in New Jersey)
§ Boston area (Operations in Boston and Providence)
§ Washington D.C. (Loan production office)
Unique “high-touch, high-tech” value proposition
§ Exceptional customer service supported by state-of-
the-art technology
the-art technology
– 24 hour concierge banking
– 400,000 free ATM’s across the country
– Leading edge mobile & internet banking
– Remote check deposits via smart phone
– Picture bill pay
– Text banking
Current Markets

6
Execution Timeline
§ We join $270 million asset
Customers Bank (FKA New
Century Bank)
Customers Bank (FKA New
Century Bank)
§ Identified existing credit
problems, adequately reserved
and recapitalized the bank
problems, adequately reserved
and recapitalized the bank
§ Actively worked out very
extensive loan problems
extensive loan problems
§ Recruited experienced
management team
management team
§ Enhanced credit and risk
management
management
§ Developed infrastructure for
organic growth
organic growth
§ Built out warehouse lending
platform and doubled deposit and
loan portfolio
platform and doubled deposit and
loan portfolio
§ Completed acquisitions:
– ISN Bank (FDIC-assisted)
– USA Bank (FDIC-assisted)
– Berkshire Bancorp (Whole
bank)
bank)
§ Recruited proven lending
teams
teams
§ Built out Commercial and Multi-
family lending platforms
family lending platforms
§ De Novo expansion; 4-6 sales
offices or teams added each
year
offices or teams added each
year
§ Continued to show strong loan
and deposit growth
and deposit growth
§ ~10%+ ROE; ~1% ROA
§ $5 to $6 billion asset bank by
end of 2015
end of 2015
2009
Assets: $350M
Equity: $22M
2010
Assets: $1.4B
Equity: $105M
2011
Assets: $2.1B
Equity: $148M
2012 2013
Assets: ~$4.2B
Equity: ~$400M

7
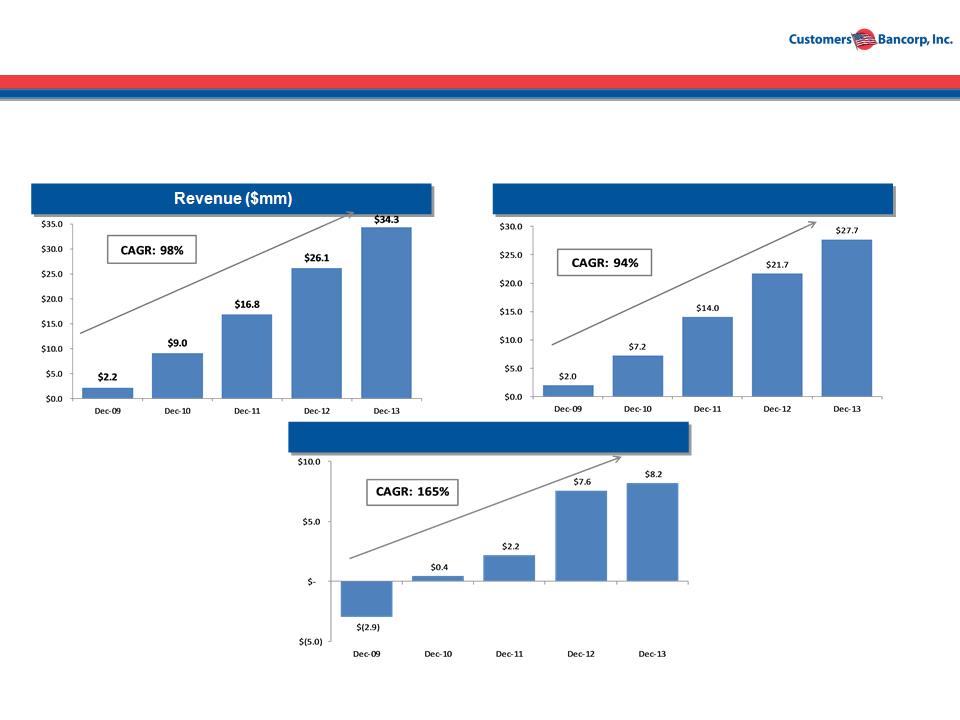
2013 Revenue Growth and Strong Credit Quality Results
in Record Earnings
in Record Earnings
§ Q4 2013 net income of $9.0 million is up 19% over 4Q
2012 mainly due to net interest income fueled by net
loan growth while maintaining high credit quality and
also growing low cost core deposits throughout the
year
2012 mainly due to net interest income fueled by net
loan growth while maintaining high credit quality and
also growing low cost core deposits throughout the
year
§ Net interest income before provision was $103.2
million in 2013 an increase of 44% compared to 2012
million in 2013 an increase of 44% compared to 2012
§ Non interest income increased $3.1 million to $7.9
million in 4Q 2013 largely due to mortgage banking
revenue of $1.1 million and securities gains of $1.3
million
million in 4Q 2013 largely due to mortgage banking
revenue of $1.1 million and securities gains of $1.3
million
§ Non-covered NPL’s as a percentage of total non-
covered NPL’s was 0.43% in 4Q 2013 compared to
0.84% in 4Q 2012
covered NPL’s was 0.43% in 4Q 2013 compared to
0.84% in 4Q 2012
Net Revenue Before Provision
Earnings Highlights
Asset Quality
(1) Excludes gain on sales of securities of $1.3 million in Q4 2013 and $9.0
million in 2012
million in 2012
(1)
(1)
(1)

8
Disciplined Model for Increasing Shareholder Value
§ Build tangible book value per share each quarter via earnings
§ Strong organic revenue growth + efficient, scalable infrastructure
result in sustainable double digit EPS growth
result in sustainable double digit EPS growth
§ A clear and simple risk management driven business strategy
§ Above average ROAA and ROAE
§ Proven management team
Disciplined Model for Superior Shareholder Value Creation

9
Lending Strategy -
Local Lending Plus Specialty Niche
Local Lending Plus Specialty Niche
Commercial Lending
Small Business
§ Target companies with less than
$5.0 million annual revenue
$5.0 million annual revenue
§ Loans (incl. SBA loans) originated
by branch network and specialist
small business relationship
managers
by branch network and specialist
small business relationship
managers
§ Banking for Mortgage Companies
§ Diversify earning assets and
revenue stream
revenue stream
§ Lower interest rate and credit risk
line of business
line of business
Commercial Banking
§ Target companies with up to $100
million annual revenues
million annual revenues
§ Very experienced teams
Multifamily & CRE
§ Focus Markets: New York &
Philadelphia MSAs
Philadelphia MSAs
§ Average Loan Size: $7.0 million
Specialty Lending
§ Mortgage Banking
§ Become experts at refinancing and
helping customers buy homes
helping customers buy homes
§ Diversified revenue source
10
Customers Bank Advantage
Cash
Management
Residential
Real Estate
Credit
Cards
Commercial
Real Estate
Commercial
Banking
Retail
Branches
Client
Makes
One Call
Makes
One Call
Client
High Touch supported by High Tech
Single Point of Contact Banking
Private /
Personal
Bankers
Personal
Bankers
Concierge
Banking
Banking
Other Products/
Services
Services

11
Single Point of Contact Pays off in Strong Loan and
Deposit Growth
Deposit Growth
§ Overcame a $700 million decrease in 2013 from the
banking for mortgage companies loans held for sale
with growth in multi family/CRE loans of $860
million and commercial and industrial loans growth
of $265 million in 2013
banking for mortgage companies loans held for sale
with growth in multi family/CRE loans of $860
million and commercial and industrial loans growth
of $265 million in 2013
§ New Banking teams in New England and New York
combined contributed $265.6 million of loan
growth in 2013
combined contributed $265.6 million of loan
growth in 2013
§ Expectation is to grow each of the New
England and New York markets to $1.0 billion
in the next 5 years
England and New York markets to $1.0 billion
in the next 5 years
§ Single point of contact
§ The banking group is completely
responsible for the customer (no
passing off to other departments)
responsible for the customer (no
passing off to other departments)
§ High Touch supported by High Tech
(1) Includes C&I and owner occupied CRE

12
Strong Loan Portfolio Growth
Loan Portfolio Mix ($mm)
§ High credit quality results from Customers’
underwriting standards and conservative loan
mix
underwriting standards and conservative loan
mix
§ Centralized credit committee approval for all
loans
loans
o Average C&I loan < $2.0 million
o Average Multi-family loans < $5 million;
concentrated in New York City
concentrated in New York City
o ~90 strong warehouse clients
o All loans are secured
o All loans are stress tested for higher rates
and a slower economy
and a slower economy
§ Banking for Mortgage companies loans
structured as repurchase agreements are
classified as loans held for sale
structured as repurchase agreements are
classified as loans held for sale
§ No losses on loans originated since new
management team took over
management team took over
Loan Distribution (3)
High Growth With Strong Credit Quality

Deposit Strategy – High Touch, High Tech Organic deposit growth goals of 20%+ a year Concierge Banking Takes banker to the customer’s home or office, 12 hours a day, 7 days a week Appointment banking approach Customer access to private bankers “Virtual Branches” out of sales offices Sales Force Experienced bankers who own a portfolio of customers Customer acquisition & retention strongly incentivized Pricing Low cost banking model allows for more pricing flexibility Significantly lower overhead costs vs. a traditional branch Pricing/profitability measured across relat`ionship Technology Implementation of technology suite allows for unique product offerings: Remote account opening & deposit capture Internet/mobile banking Free ATM deployment in U.S. Goal: All-in cost less than wholesale funding cost over the long-term Plus: Branch Operating Expense Less: Fees = All-in Cost < Competitors

14
Deposits: Organic Growth With Controlled Costs
Total Deposit Growth ($mm)
Cost of Deposits
Customers strategies of single point of contact and recruiting known teams in target markets produce
rapid deposit growth with low total cost
rapid deposit growth with low total cost
15
Results in Disciplined & Profitable Growth
Core Net Income (1)
Source: SNL Financial and Company data.
(1)Core income, on a diluted per-share basis is net income before extraordinary items, less the after-tax portion of income from investment gains and nonrecurring items. CAGR calculated from Dec-10 to Mar-13.
Net Interest Income ($mm)
• Strategy execution has produced superior growth in revenues and earnings

16
Strong Capital Levels Enable Growth
§ Strong capital enables asset and deposit
growth
growth
§ Customers raised $200+ million of equity
capital in past 18 months at book value or
better
capital in past 18 months at book value or
better
§ Current capital levels will provide for over
$1.0 billion of growth (assumes risk
weighted assets are 90% of total assets)
$1.0 billion of growth (assumes risk
weighted assets are 90% of total assets)
*Total risk based capital is an estimate pending final call report
17
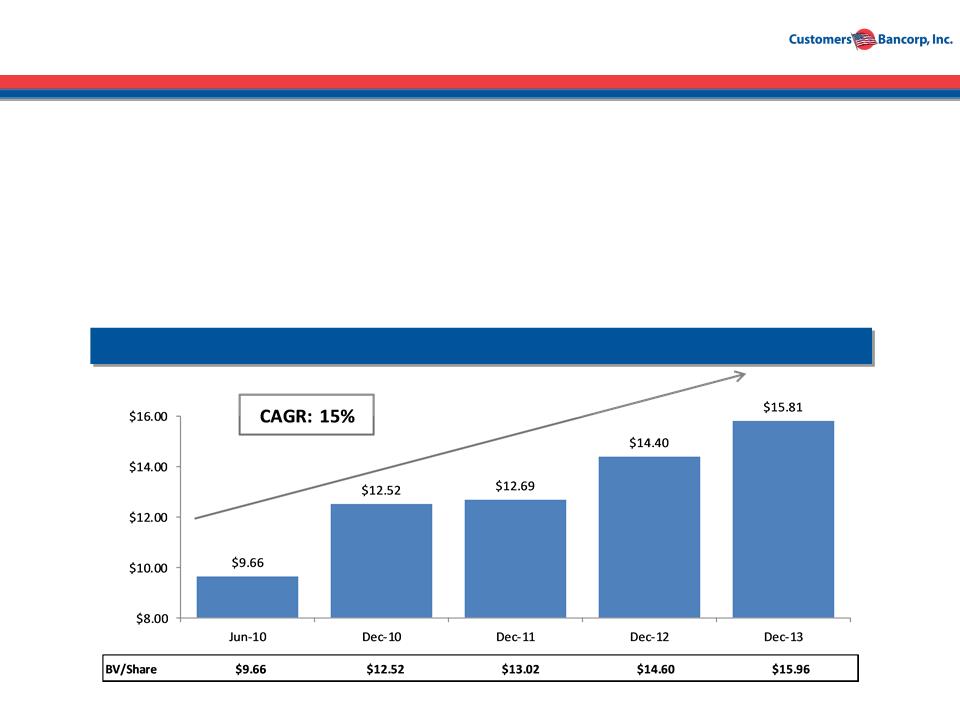
Strong Growth Provides for Shareholder Value
Creation
Creation
§ Per share tangible book value up 34% since December 2010
§ Focused on continuous growth of TBV aligns executive management compensation with shareholder
value creation
value creation
§ Strategies and key decisions are framed by estimated effect on per share TBV
§ Customers growth strategy is directed to increasing earnings per share and TBV per share
Tangible Book Value Growth
18
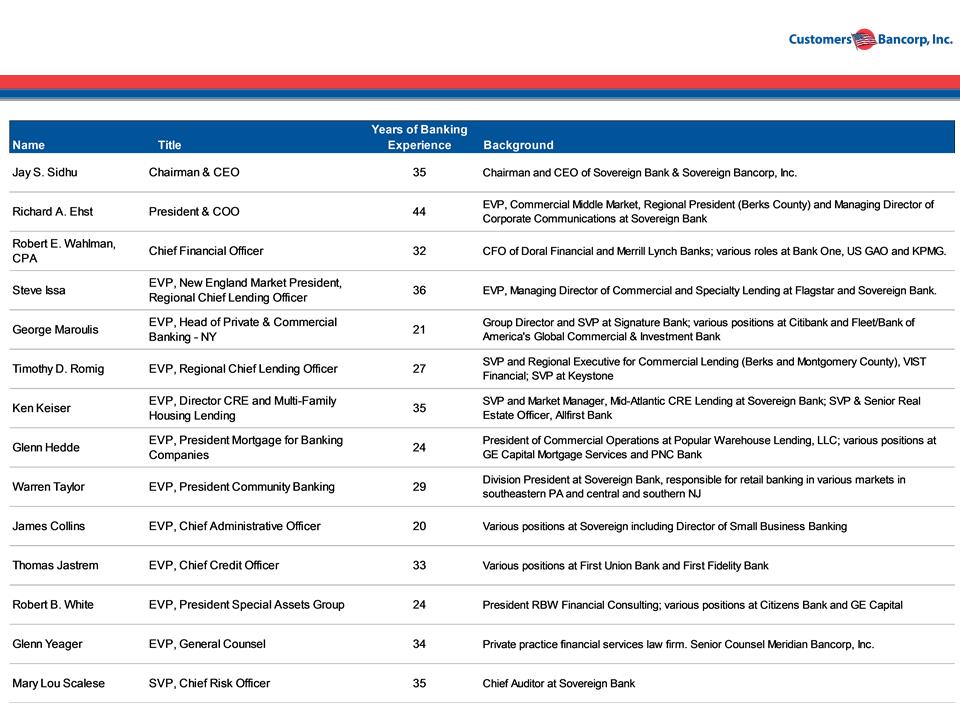
Highly Experienced Management Team

19
Key Financial Targets for the Next 3-5 Years
§ Focus in future years
§ Single point of contact model - “High touch supported by
high tech”
high tech”
§ Superior credit quality
§ Above average organic growth
§ Expense management
§ Earnings per share growth estimated at ~ 17% year over year
§ Assumes no additional common shares are issued during
2014 or 2015
2014 or 2015
§ Expecting banking for mortgage companies balances to remain
flat and continue to shrink as a percentage of total assets
flat and continue to shrink as a percentage of total assets
§ Strategically aligned technology partners
§ Core Banking Platform - Fiserv
§ Mobile Banking Platform - Malauzai
§ Unique branch model
§ 24 hours concierge bankers
§ All-In-Cost (interest expense + operating cost)
§ Alternative channels emerging in our model
§ Use of technology to reduce branch traffic
Criteria 3 -5 Year Targets
Year EPS Expectations
*Efficiency ratio = non-interest expenses/(net interest income + non-interest
income - securities gains)
income - securities gains)

20
BankMobile

21
Summary
§ Strong high performing ~$4.2 billion bank with significant growth opportunities
§ “High touch, high tech” processes and technologies result in superior growth,
returns and efficiencies
returns and efficiencies
§ Shareholder value results from the combination of increasing tangible book
value with strong and consistent earnings growth
value with strong and consistent earnings growth
§ Attractive risk-reward: growing several times faster than industry average but
trading at a significant discount to peers
trading at a significant discount to peers
§ Experienced management team delivers with strong results
§ Ranked #1 overall by Bank Director Magazine in the 2013 Growth Leader
Rankings
Rankings
22
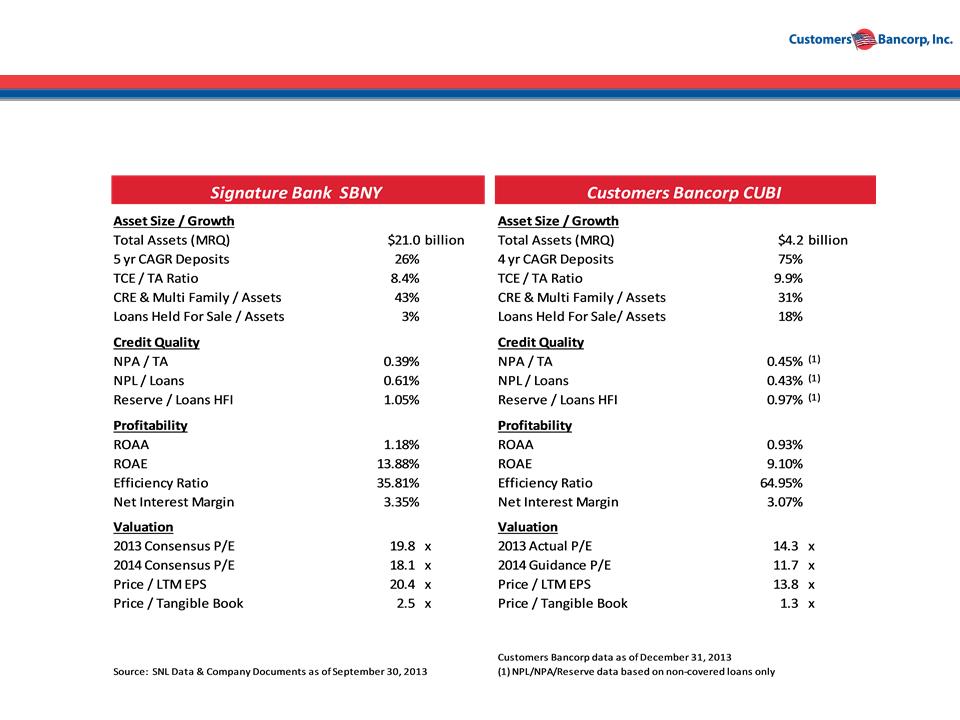
Comparison - Signature Bank SBNY
Highly successfully bank with similar banking model

23
Comparison: Texas Capital Bancshares TCBI
Highly successfully bank with similar banking model

24
Peer Group Comparison
High Performance Regional Peers
Source: SNL Financial, Company documents. Market data as of 12/31/13. Consists of Northeast and Mid-Atlantic banks and thrifts with assets between $2.0 billion and $6.0 billion and most recent quarter core ROAA greater
than 90bps. Excludes merger targets and MHCs.
than 90bps. Excludes merger targets and MHCs.
(1)Customers Bancorp NPAs/Assets calculated as non-covered NPAs divided by total assets. Non-covered NPAs excludes accruing TDRs and loans 90+ days past due and still accruing.

25
Contacts
Company
Robert Wahlman, CFO
Tel: 610-743-8074
rwahlman@customersbank.com
rwahlman@customersbank.com
www.customersbank.com
Investor Relations
Ted Haberfield
President, MZ North America
Tel: 760-755-2716
thaberfield@mzgroup.us
www.mzgroup.us

Appendix

27
Balance Sheet

28
Income Statement
29
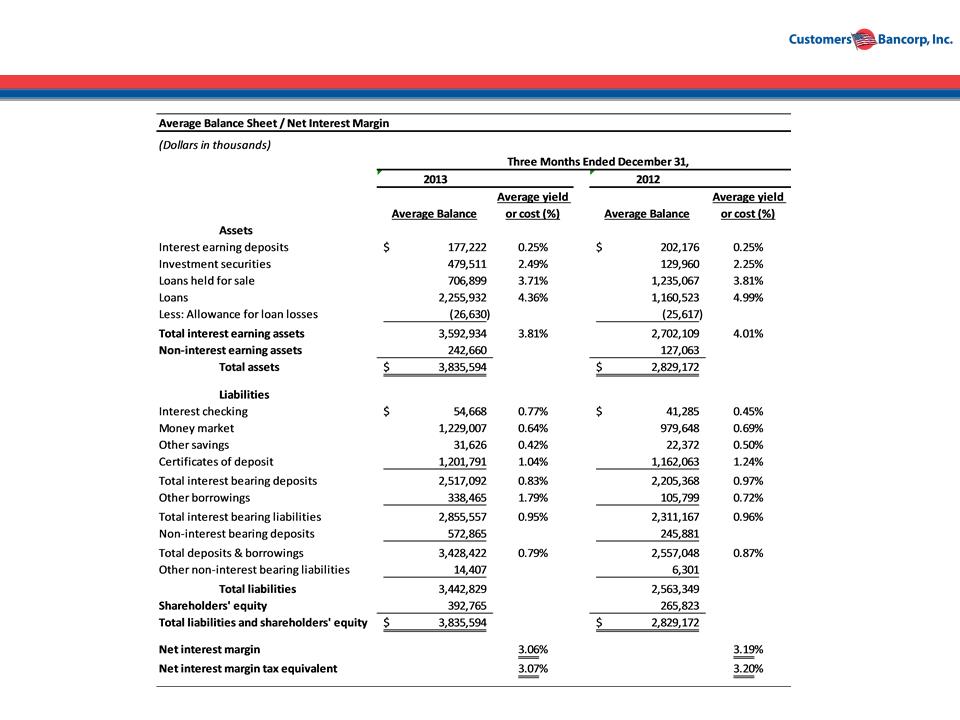
Net Interest Margin

30
Asset Quality