Attached files
| file | filename |
|---|---|
| 8-K - FORM 8-K - Altra Industrial Motion Corp. | d674209d8k.htm |
| EX-99.1 - EX-99.1 - Altra Industrial Motion Corp. | d674209dex991.htm |
Exhibit 99.2
|
|

Exhibit 99.2
Fourth-Quarter
2013 Results
Replay Number
Through March 5, 2014
877-660-6853 Domestic
201-612-7415 International
Conference ID: # 13575773
Webcast Replay at
www.altramotion.com
February 19, 2014
10:00 AM ET
Dial In Number
877-407-8293 Domestic
201-689-8349 International
Webcast at www.altramotion.com
|
|
Safe Harbor Statement Cautionary Statement Regarding Forward Looking Statements All statements, other than statements of historical fact included in this release are forward-looking statements, as that term is defined in the Private Securities Litigation Reform Act of 1995. These statements include, but are not limited to, any statement that may predict, forecast, indicate or imply future results, performance, achievements or events. Forward-looking statements can generally be identified by phrases such as “believes,” “expects,” “potential,” “continues,” “may,” “should,” “seeks,” “predicts,” “anticipates,” “intends,” “projects,” “estimates,” “plans,” “could,” “designed”, “should be,” and other similar expressions that denote expectations of future or conditional events rather than statements of fact. Forward-looking statements also may relate to strategies, plans and objectives for, and potential results of, future operations, financial results, financial condition, business prospects, growth strategy and liquidity, and are based upon financial data, market assumptions and management’s current business plans and beliefs or current estimates of future results or trends available only as of the time the statements are made, which may become out of date or incomplete. Forward-looking statements are inherently uncertain, and investors must recognize that events could differ significantly from our expectations. These statements include, but may not be limited to, those relating to the Company’s expectations around the Svendborg acquisition integration and Svendborg’s 2014 earnings, progress on margin initiatives and working capital reductions, the Company’s unaudited 2013 financial information, and the Company’s guidance for full year 2014. In addition to the risks and uncertainties noted in this release, there are certain factors that could cause actual results to differ materially from those anticipated by some of the statements made. These include: (1) competitive pressures, (2) changes in economic conditions in the United States and abroad and the cyclical nature of our markets, (3) loss of distributors, (4) the ability to develop new products and respond to customer needs, (5) risks associated with international operations, including currency risks, (6) accuracy of estimated forecasts of OEM customers and the impact of the current global economic environment on our customers, (7) risks associated with a disruption to our supply chain, (8) fluctuations in the costs of raw materials used in our products, (9) product liability claims, (10) work stoppages and other labor issues, (11) changes in employment, environmental, tax and other laws and changes in the enforcement of laws, (12) loss of key management and other personnel, (13) changes in pension and retirement liabilities, (14) risks associated with compliance with environmental laws, (15) the ability to successfully execute, manage and integrate key acquisitions and mergers, (16) failure to obtain or protect intellectual property rights, (17) risks associated with impairment of goodwill or intangibles assets, (18) failure of operating equipment or information technology infrastructure, (19) risks associated with our debt leverage and operating covenants under our debt instruments, (20) risks associated with restrictions contained in our Convertible Notes and Credit Facility, (21) risks associated with compliance with tax laws, (22) risks associated with the global recession and volatility and disruption in the global financial markets, (23) risks associated with implementation of our new ERP system, (24) risks associated with the Bauer, Lamiflex and Svendborg acquisitions and integration and other acquisitions, (25) risks associated with the Company’s investment in a new manufacturing facility in China, (26) risks associated with changes, if any, to the Company’s 2013 financial statements in connection with the completion of the audit, and (27) other risks, uncertainties and other factors described in the Company’s quarterly reports on Form 10-Q and annual reports on Form 10-K and in the Company’s other filings with the U.S. Securities and Exchange Commission (SEC) or in materials incorporated therein by reference. Except as required by applicable law, Altra Industrial Motion Corp. does not intend to, update or alter its forward looking statements, whether as a result of new information, future events or otherwise. 1
|
|
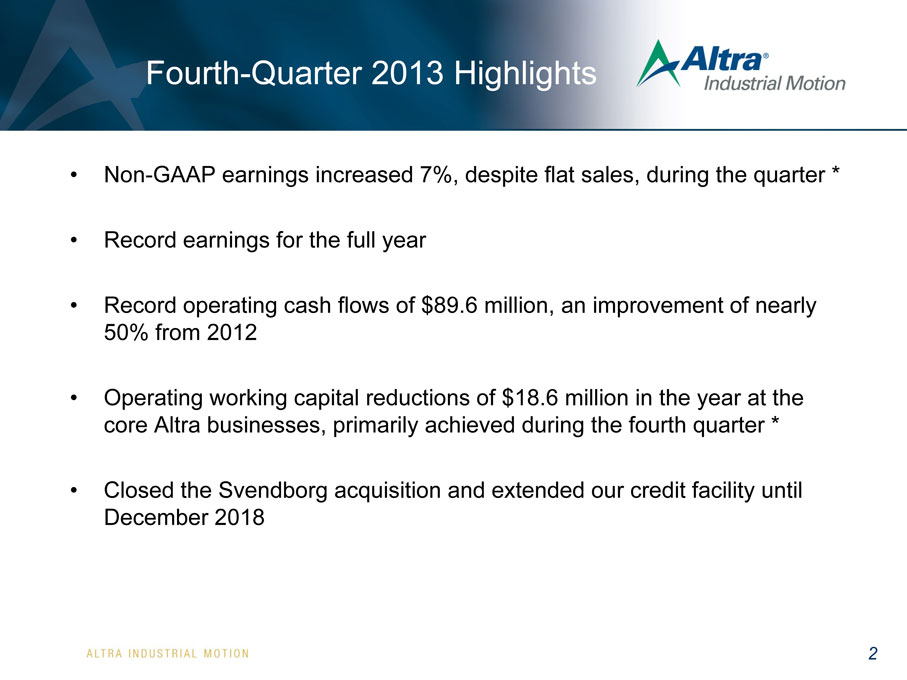
Fourth-Quarter 2013 Highlights Non-GAAP earnings increased 7%, despite flat sales, during the quarter * Record earnings for the full year Record operating cash flows of $89.6 million, an improvement of nearly 50% from 2012 Operating working capital reductions of $18.6 million in the year at the core Altra businesses, primarily achieved during the fourth quarter * Closed the Svendborg acquisition and extended our credit facility until December 2018 2
|
|
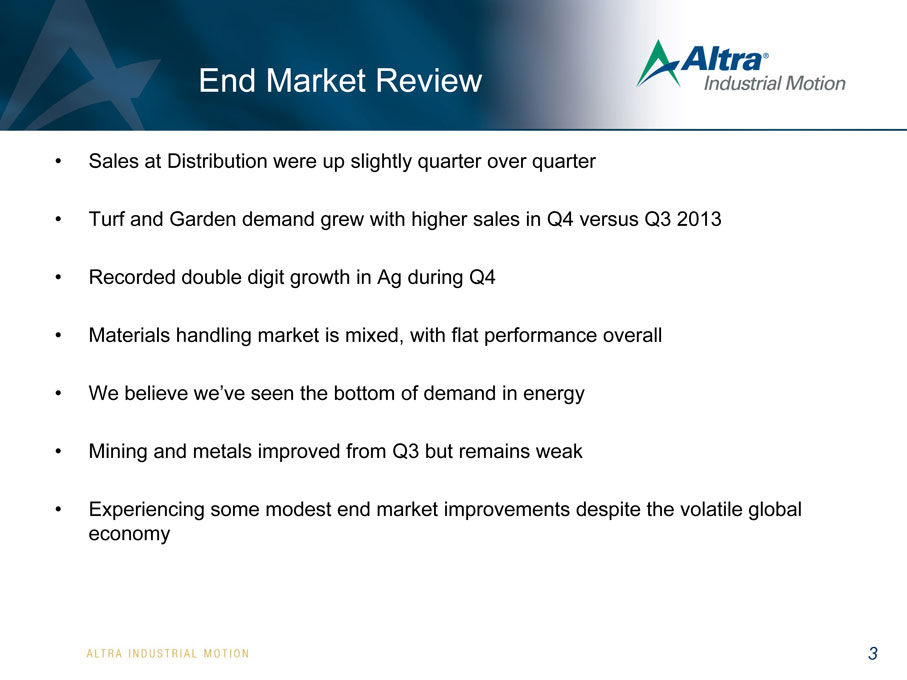
End Market Review Sales at Distribution were up slightly quarter over quarter Turf and Garden demand grew with higher sales in Q4 versus Q3 2013 Recorded double digit growth in Ag during Q4 Materials handling market is mixed, with flat performance overall We believe we’ve seen the bottom of demand in energy Mining and metals improved from Q3 but remains weak Experiencing some modest end market improvements despite the volatile global economy 3
|
|
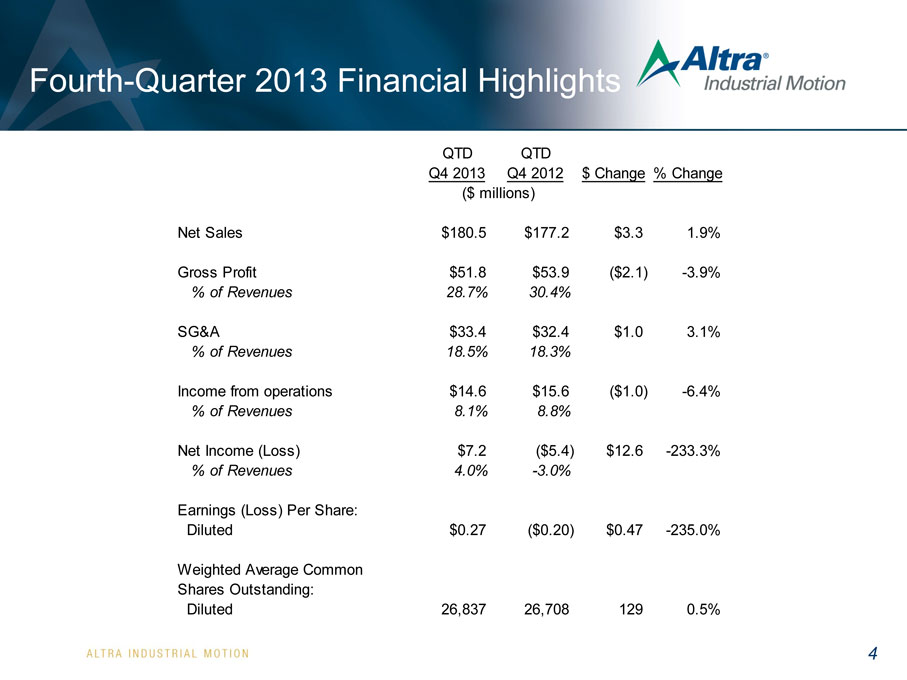
Fourth-Quarter 2013 Financial Highlights QTD QTD Q4 2013 Q4 2012 $ Change % Change ($ millions) Net Sales $180.5 $177.2 $3.3 1.9% Gross Profit $51.8 $53.9 ($2.1) -3.9% % of Revenues 28.7% 30.4% SG&A $33.4 $32.4 $1.0 3.1% % of Revenues 18.5% 18.3% Income from operations $14.6 $15.6 ($1.0) -6.4% % of Revenues 8.1% 8.8% Net Income (Loss) $7.2 ($5.4) $12.6 -233.3% % of Revenues 4.0% -3.0% Earnings (Loss) Per Share: Diluted $0.27 ($0.20) $0.47 -235.0% Weighted Average Common Shares Outstanding: Diluted 26,837 26,708 129 0.5% 4
|
|
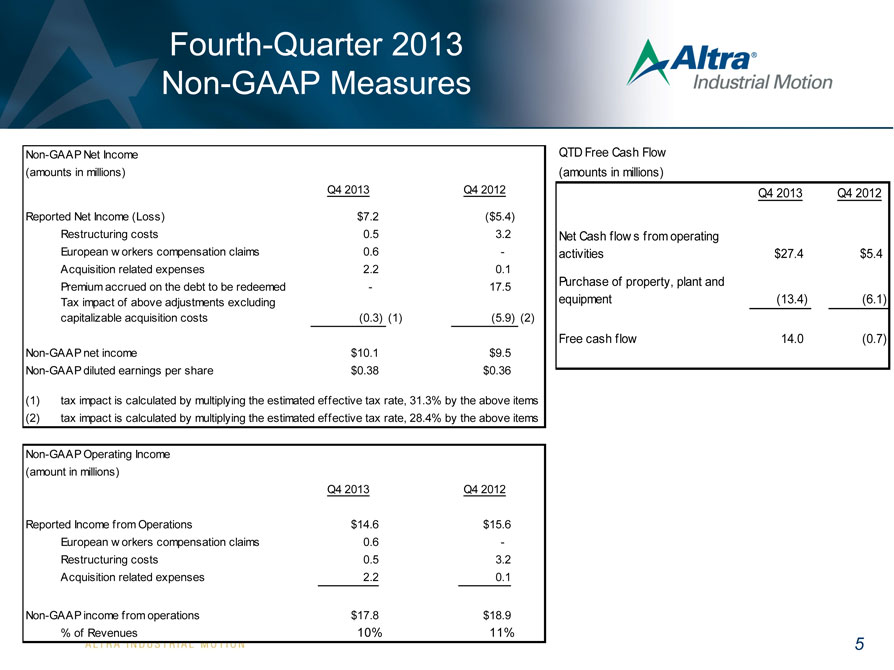
Fourth-Quarter 2013 Non-GAAP Measures Non-GAAP Net Income (amounts in millions) Q4 2013 Q4 2012 Reported Net Income (Loss) $7.2 ($5.4) Restructuring costs 0.5 3.2 European w orkers compensation claims 0.6 - Acquisition related expenses 2.2 0.1 Premium accrued on the debt to be redeemed - 17.5 Tax impact of above adjustments excluding capitalizable acquisition costs (0.3) (1) (5.9) (2) Non-GAAP net income $10.1 $9.5 Non-GAAP diluted earnings per share $0.38 $0.36 (1) tax impact is calculated by multiplying the estimated effective tax rate, 31.3% by the above items (2) tax impact is calculated by multiplying the estimated effective tax rate, 28.4% by the above items Non-GAAP Operating Income (amount in millions) Q4 2013 Q4 2012 Reported Income from Operations $ 14.6 $15.6 European w orkers compensation claims 0.6 - Restructuring costs 0.5 3.2 Acquisition related expenses 2.2 0.1 Non-GAAP income from operations $ 17.8 $18.9 % of Revenues 10% 11% QTD Free Cash Flow (amounts in millions) Q4 2013 Q4 2012 Net Cash flow s from operating activities $27.4 $5.4 Purchase of property, plant and equipment (13.4) (6.1) Free cash flow 14.0 (0.7) 5
|
|
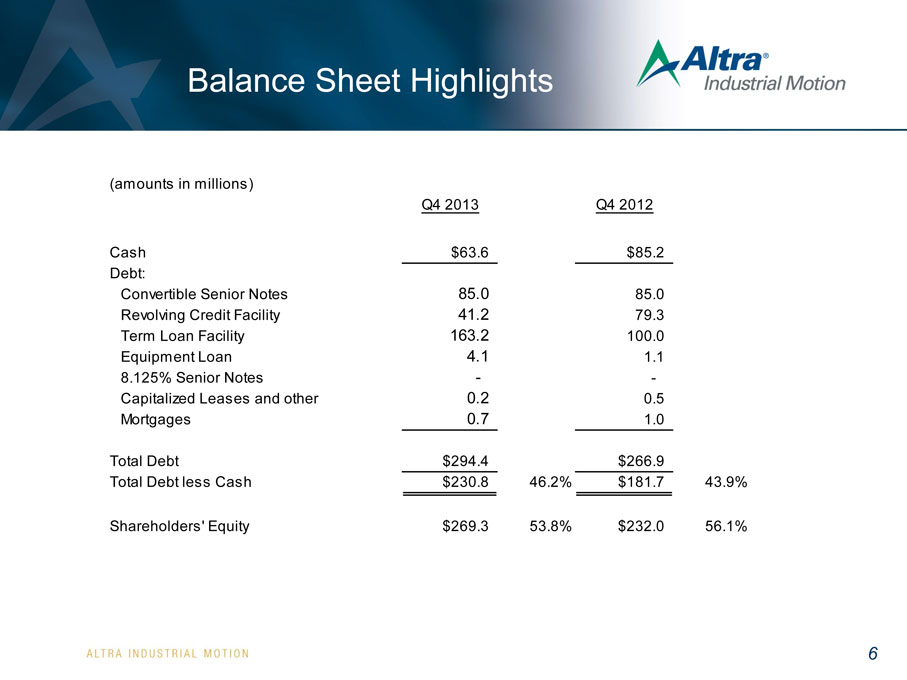
Balance Sheet Highlights
(amounts in millions)
Q4 2013 Q4 2012
Cash $63.6 $85.2
Debt:
Convertible Senior Notes 85.0 85.0
Revolving Credit Facility 41.2 79.3
Term Loan Facility 163.2 100.0
Equipment Loan 4.1 1.1
8.125% Senior Notes - -
Capitalized Leases and other 0.2 0.5
Mortgages 0.7 1.0
Total Debt $294.4 $266.9
Total Debt less Cash $230.8 46.2% $181.7 43.9%
Shareholders’ Equity $269.3 53.8% $232.0 56.1%
6
|
|
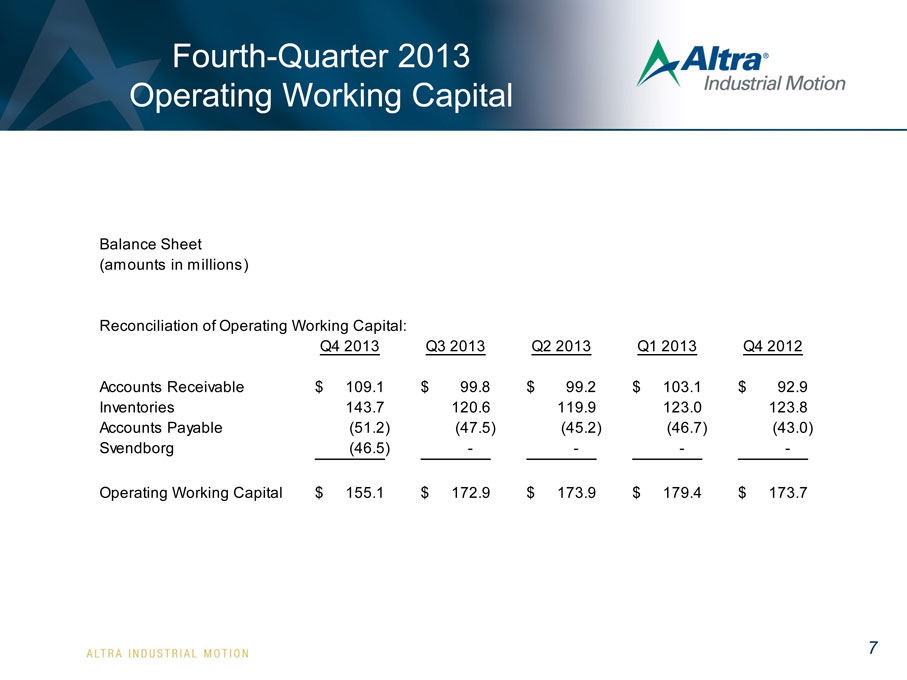
Fourth-Quarter 2013 Operating Working Capital
Balance Sheet
(amounts in millions)
Reconciliation of Operating Working Capital:
Q4 2013 Q3 2013 Q2 2013 Q1 2013 Q4 2012
Accounts Receivable $ 109.1 $ 99.8 $ 99.2 $ 103.1 $ 92.9
Inventories 143.7 120.6 119.9 123.0 123.8
Accounts Payable (51.2) (47.5) (45.2) (46.7) (43.0)
Svendborg (46.5) - - - -
Operating Working Capital $ 155.1 $ 172.9 $ 173.9 $ 179.4 $ 173.7
7
|
|
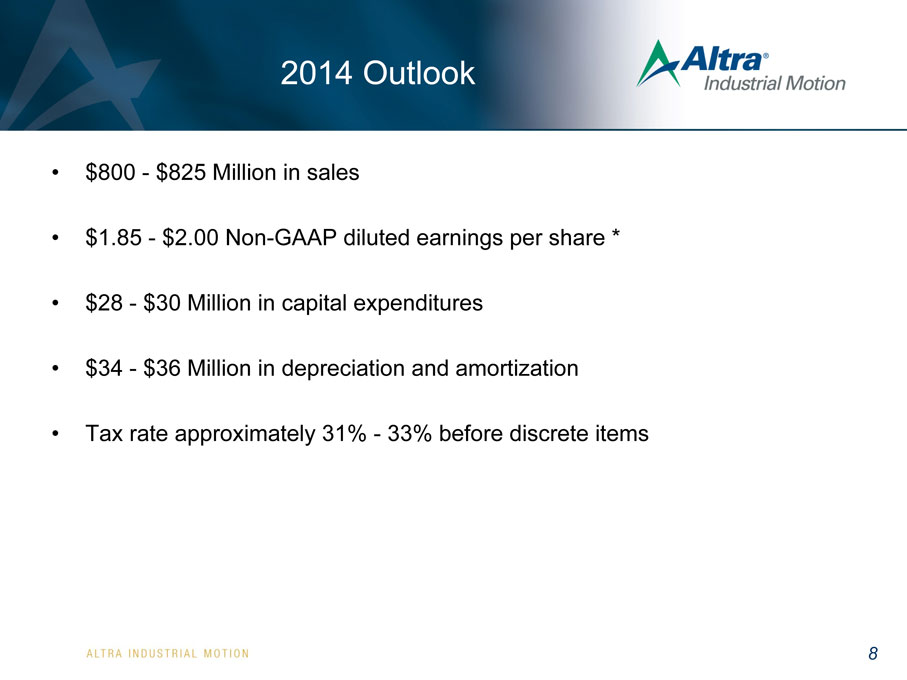
2014 Outlook
$800 - $825 Million in sales
$1.85 - $2.00 Non-GAAP diluted earnings per share *
$28 - $30 Million in capital expenditures
$34 - $36 Million in depreciation and amortization
Tax rate approximately 31% - 33% before discrete items
8
|
|
Summary
Global economic environment is uncertain, but we expect to make progress on margin initiatives and operating working capital reductions
Operational excellence is benefiting our financials
90 bps contribution to quarterly margin from pricing strategy actions
Expansion into emerging markets is on schedule
Strong balance sheet makes us ready to execute on our acquisition strategy
Excited about the Svendborg acquisition
9
|
|
Discussion of Non-GAAP Measures
* As used in this release and the accompanying slides posted on the Company’s website, non-GAAP diluted earnings per share, non-GAAP income from operations and non-GAAP net income are each calculated using either net income or income from operations that excludes acquisition related costs, restructuring costs, and other income or charges that management does not consider to be directly related to the Company’s core operating performance. Non-GAAP diluted earnings per share is calculated by dividing non-GAAP net income by GAAP weighted average shares outstanding (diluted). Non-GAAP free cash flow is calculated by deducting purchases of property, plant and equipment from net cash provided by operating activities. Non-GAAP operating working capital is calculated by deducting accounts payable from net trade receivables plus inventories less the impact of recent acquisitions.
Altra believes that the presentation of non-GAAP net income, non-GAAP income from operations, non-GAAP diluted earnings per share, non-GAAP free cash flow and non-GAAP operating working capital provides important supplemental information to management and investors regarding financial and business trends relating to the Company’s financial condition and results of operations.
10