Attached files
| file | filename |
|---|---|
| 8-K - 8-K - Mondelez International, Inc. | d680016d8k.htm |
| EX-99.1 - EX-99.1 - Mondelez International, Inc. | d680016dex991.htm |
 CAGNY Conference
February 18, 2014
Exhibit 99.2
Mondelez
International |
 Irene Rosenfeld Chairman and CEO
|
 Forward-looking statements
3
This slide presentation contains a number of forward-looking statements. Words, and variations of
words, such as “will,” “expect,” “may,” “should,”
“likely,” “believe,” “deliver,” “guidance” and similar expressions
are intended to identify our forward-looking statements. Examples of forward-looking
statements include, but are not limited to, statements we make about our future performance,
including future revenue growth, earnings per share, operating income, margins, taxes, cash
flow, market shares and shareholder returns; the drivers of our future performance, including
investments, productivity improvements and cost reductions; and dividends, share repurchases
and uses of cash. These forward-looking statements are subject to a number of risks and
uncertainties, many of which are beyond our control, which could cause our actual results to
differ materially from those indicated in our forward-looking statements. Such factors
include, but are not limited to, risks from operating globally and in emerging markets, continued
consumer weakness, continued volatility of commodity and other input costs, pricing actions,
continued weakness in economic conditions, business disruptions, increased competition and tax
law changes. For additional information on these and other factors that could affect our
forward-looking statements, see our risk factors, as they may be amended from time to time,
set forth in our filings with the SEC, including our most recently filed Annual Report on Form
10-K. We disclaim and do not undertake any obligation to update or revise any
forward-looking statement in this slide presentation, except as required by applicable law
or regulation. |
 |
 Agenda
Long-term growth algorithm and targets
Margin improvement and capital allocation
Sustaining growth and margin expansion in
North America
5 |
 A
global snacks powerhouse $35 billion revenues in 2013
75% in fast-growing snacks
Category leadership
Favorite snacks brands
Proven innovation platforms
Advantaged geographic footprint
6 |
 Snacking is a $1.2 trillion global market
7
In between
meals
As a replacement for
a meal
Source: Euromonitor |
 Three
broad reasons why people snack 8
% of MDLZ
Portfolio
~25%
~60%
~15%
MY MIND
& REFRESH |
 Snacks
are growth categories around the world 9
Well-aligned with consumer trends
Expandable consumption
Growth with GDP in emerging markets
Higher margins |
 Near-term global category growth rates have slowed,
but expected to return to historical levels
Category
2011
2012
2013
Biscuits
7.3%
7.4%
5.5%
Chocolate
5.9%
6.0%
5.3%
Gum
2.0%
0.1%
0.7%
6.4%
6.2%
4.5%
Total Snacks
6.1%
5.9%
4.7%
Powdered Beverages
9.7%
11.5%
10.6%
Coffee
12.3%
7.2%
(1.9)%
Total Global Category Growth*
6.8%
6.1%
3.8%
10
Source: ACNielsen
* Total Global Category Growth includes biscuits, chocolate, gum, candy, coffee,
powdered beverages and cream cheese categories in key markets. Candy
|
 #1
#1
#1
#1
#1
#1
#1
#2
#1
#1
#1
#1
#3
#2
--
--
#3
#2
#2
--
--
--
--
#1
#3
#3
#3
#1
#1
#3
#2
#2
#2
#2
#2
#2
#1
#2
#1
#2
#1
#1
18%
15%
30%
7%
11%
16%
Source: Euromonitor market share
North
North
America
America
Europe
Europe
Global
Global
Market
Market
Share
Share
Latin
Latin
America
America
Asia
Asia
Pacific
Pacific
Eastern
Eastern
Europe
Europe
Middle East
Middle East
& Africa
& Africa
We are a leader in our categories
Biscuits
Chocolate
Gum
Candy
Coffee
Powdered
Beverages
11 |
 Driving market share gains across our portfolio
% Revenues Gaining or Holding Share
(1)
2013
by
Category
Chocolate
~80%
Biscuits
~70%
Gum & Candy
~50%
Beverages,
~65%
Cheese & Grocery
12
(1)
Defined
as
percentage
of
revenues
in
key
markets
for
the
category
with
share
either
increasing
or
flat
versus
the
same
prior
year
period.
Based
on
Global
Nielsen
data
for
measured
channels
for
available
periods
in
2011,
2012
and
2013.
68%
49%
69%
2011
2012
2013 |
 Power
Brands and innovation platforms driving growth 13
Power Brands growing
~2x company rate
–
Significantly higher
gross margins
~13% of total revenue
from new products
Based on 2013 Revenue
Power
Brands
59%
Other
Brands
41% |
 Large,
growing emerging markets footprint 14
Revenue +9% in 2013
Expected to comprise
~45% of total revenue
by 2016
Based on 2013 Revenue
Emerging
Markets
39%
Developed
Markets
61% |
 Well-positioned for growth and value creation
15
Long-Term
Targets
Fast growing categories
Category leadership
Power Brands & innovation platforms
Emerging markets footprint
Targeting 14%-16% Adj. OI Margin by 2016
Supply chain reinvention
Fit for Purpose overheads
Modest increases in debt / interest
Share repurchases
Organic Net Revenue Growth:
At or Above Category Growth
Adjusted Operating Income
Growth: High Single Digit
Adjusted EPS Growth:
Double Digit |
 Dave
Brearton CFO
|
 Supply
Chain Reinvention driving gross margin improvement
Step change leadership talent
& capabilities
Transform global manufacturing
platforms
Redesign the supply chain
network
Drive productivity programs to
fuel growth
Improve cash management
17
$3B Gross Productivity
Cost Savings
(~$1B/per year; ~4.5% of COGS)
$1.5B Net Productivity
Cost Savings
(~$0.5B/per year; ~2.3% of COGS)
$1B Cash Flow
1
2
3
4
5
Priorities
3 Year Financial Goals |
 Making
significant progress in SCR initiative 18
Talent & Capabilities
Changed 40 of 115 key roles
Strengthened L6S capabilities
1
Gross Productivity of 4.5%
Net Productivity of 2.5%
Productivity
4
Significantly reduced cash cycle
Cash Management
5
Manufacturing Platforms
New biscuit, chocolate and gum
platforms on track
Lead lines installed or on order
2
Network Redesign
30 plants restructured
Reduced 3,000+ FTEs
Greenfield & major expansions
underway across globe
3 |
 Targeting “Fit for Purpose”
overheads
19
(1)
Reported SG&A as a % of net revenues was 24.6% in FY 2013. See GAAP to
Non-GAAP reconciliation at the end of this presentation 2013 SMG&A
Expense as % of Net Revenue R&D
9.2%
1.3%
2013 Adjusted SG&A was 24.8% of Revenue
(1)
Advertising
& Consumer
Promotions
Corporate
13.6%
0.6%
Selling
MG&A
& Other
Invest for Growth
Fit for Purpose |
 Zero-Based Budgeting will accelerate cost reductions
Savings will drive margin improvement and fuel growth
investments
Using to identify and capture sustainable cost savings
opportunities
–
–
Retain
balance
between
top-
and
bottom-line
goals
–
–
Improve efficiency and effectiveness
Aligned leadership, internal teams and external resources
Quick wins to build momentum, create more cost-focused
culture
20 |
 Driving double-digit Adjusted EPS growth
Primarily driven by high single-digit Adjusted Operating
Income growth
Modest increases in absolute debt and interest expense
Tax rate of ~20% for the next few years, gradually
increasing to mid-20s
21 |
 Strong Free Cash
Flow ($ in billions)
Net Cash Provided by Operating Activities
excluding items and Restructuring Program
(1)
$4.1
(3)
Capital Expenditures (ex Restructuring Program)
(1.5)
% of Net Revenues
4.4%
2012-14 Restructuring Program
(0.3)
$2.3
(3)
FY 13
FY 14E
Combined
2013
& 2014
22
$4.1+
~(2.0)
5%+
~(0.7)
$1.4+
$8.2+
~(3.5)
~(1.0)
$3.7+
Free Cash Flow excluding items
(2)
(1)
Net cash provided by operating activities excluding items and restructuring program excludes the
following: net cash received due to the resolution of the Starbucks arbitration, cash payments
made for accrued interest and other related fees associated with the debt tendered on December 18,
2013 and cash payment made for the 2012-2014 Restructuring Program.
(2)
Free Cash Flow excluding items is defined as Free Cash Flow (net cash provided by operating activities
less capital expenditures) excluding the following: net cash received due to the
resolution of the Starbucks arbitration, and cash payments made for accrued interest and other related fees associated with the debt tendered on December 18, 2013
(3)
Net cash provided by operating activities was $6.4 billion for FY 2013. See GAAP to Non-GAAP
reconciliations at the end of this presentation. |
 Disciplined capital deployment based on returns
Reinvest in the business to drive top-tier growth
Capex
~5%
of
Net
Revenue
Route-to-Market/A&C investments in emerging markets
Tack-on M&A, especially in emerging markets
Return of capital to shareholders
Dividend increased 8% in 2013
$7.7B share buyback program through 2016; $2.7B in 2013
Pay down debt to preserve balance sheet flexibility
Committed to investment grade rating, access to Tier 2 CP
23 |
 Well-positioned for growth and value creation
24
Long-Term
Targets
Fast growing categories
Category leadership
Power Brands & innovation platforms
Emerging markets footprint
Targeting 14%-16% Adj. OI Margin by 2016
Supply chain reinvention
Fit for Purpose overheads
Modest increases in debt / interest
Share repurchases
Organic Net Revenue Growth:
At or Above Category Growth
Adjusted Operating Income
Growth: High Single Digit
Adjusted EPS Growth:
Double Digit |
 Mark
Clouse President, North America |
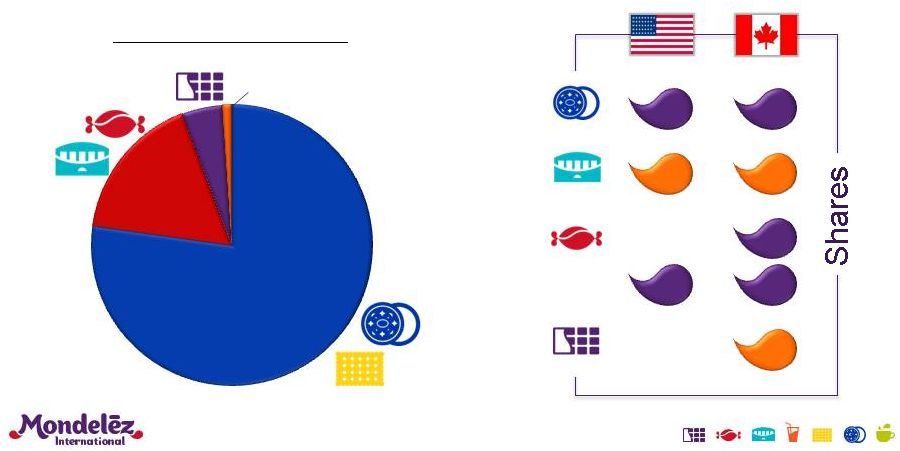 A
North American snacks powerhouse ~$6B
~$1B
#1
#2
#1
--
#3
#1
#2
#1
#1
#2
2013 Net Revenue: $7B
26
77%
17%
5%
Other 1%
Source: ACNielsen
Chocolate
Candy
&
Cough
Biscuits
Gum |
 Significant progress towards goals, roadmap in place
27
Objective
Goal
2013 Results
Roadmap
Power Brands & Platforms
Sales Execution & DSD
Sustainable
Revenue Growth
“At or Above
Category”
Organic NR
+2.9%
(1)
(1)
Reported net revenues increased 1.3% for FY 2013. See GAAP to Non-GAAP
reconciliation at the end of this presentation. (2)
Reported Segment Operating Income margin was 12.7% in FY 2013. See GAAP to
Non-GAAP reconciliation at the end of this presentation. Transform
Margins
+500 bps to
~19% by 2016
Adj. SOI Margin
14.9%
(2)
, +110 bps
Supply Chain Reinvention
World Class
Team
“Fit for
Purpose”
Category Model
In Place
Fit for Purpose Organization |
 Power
Brands focused on snacking needs 28 |
 Power
Brand focus driving acceleration and turnaround 29
|
 Innovation is creating incremental usage
30
MY MIND
& REFRESH |
 Right Pricing
& Promotion
Right
Assortment
Right
Space
Right
Category
Configuration
Right
Location for
Products
Right
Displays &
Shopper
Solutions
Sales strength pulls it all together
31 |
 DSD is
critical to winning in store 32
Displays are the best source of incremental sales
Multiple touch points drive impulse purchases |
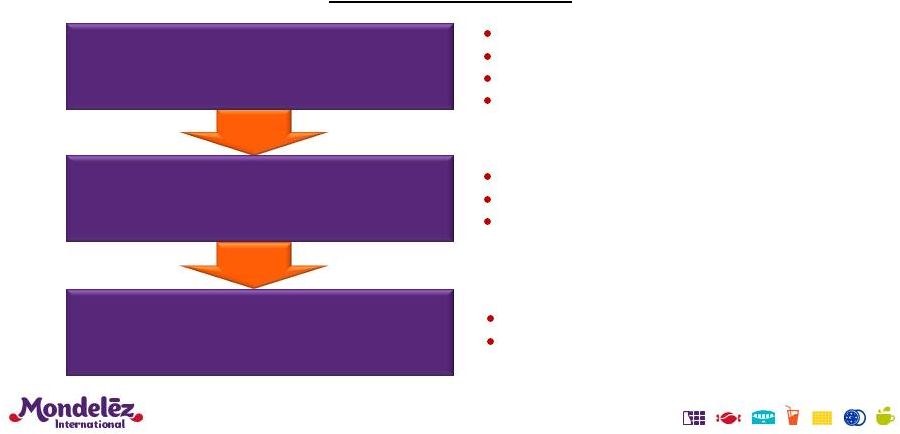
 Significant margin opportunity in supply chain
Manufacturing
Majority of existing production lines are 60+ years old
Many existing bakeries are sub-scale
Logistics
Too many distribution centers
Sub-optimal locations
33 |
 OPTIMIZED
DISTRIBUTION MODEL
34
Network redesign underway
STREAMLINE
& REINVEST
GROWTH PLANT
FOR AMERICAS |
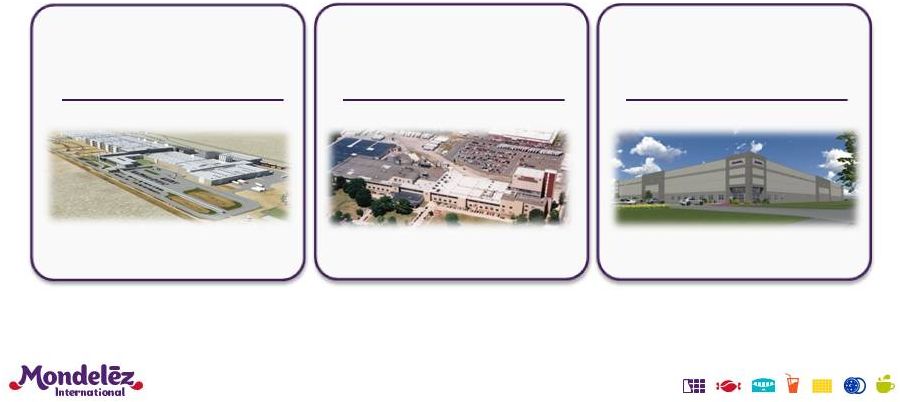
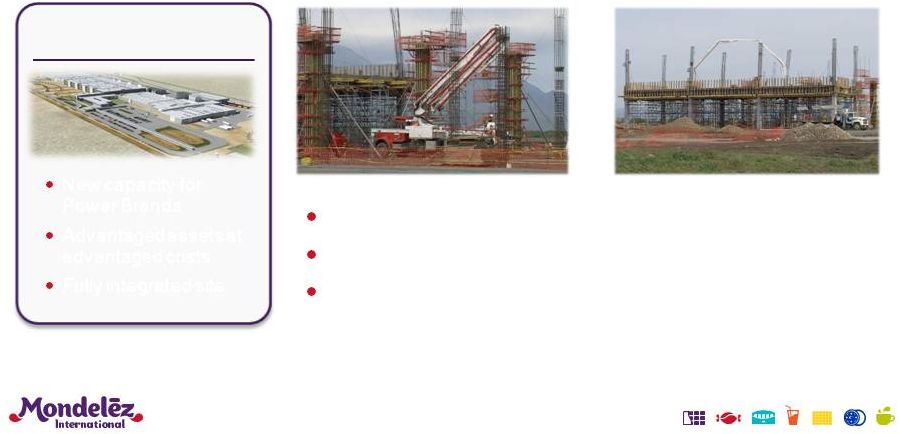 Salinas on track for “Doors Open”
in Q4 2014
35
GROWTH PLANT
FOR AMERICAS
New capacity for
Power Brands
Advantaged assets at
advantaged costs
Fully integrated site
To open with 5 lines; expandable to 14 lines
World-class technology
Logistic optimization for Mexico hub |
 Streamlining current footprint
36
Completed closure of Lakeshore Bakery, Toronto
550 positions affected
Announced closure of Philadelphia Bakery
350 positions affected with closure by early
2015 Upgrading North American asset base
Installing 16 new lines
Streamline subscale
facilities
Upgrading assets and
simplifying portfolio
STREAMLINE
& REINVEST |
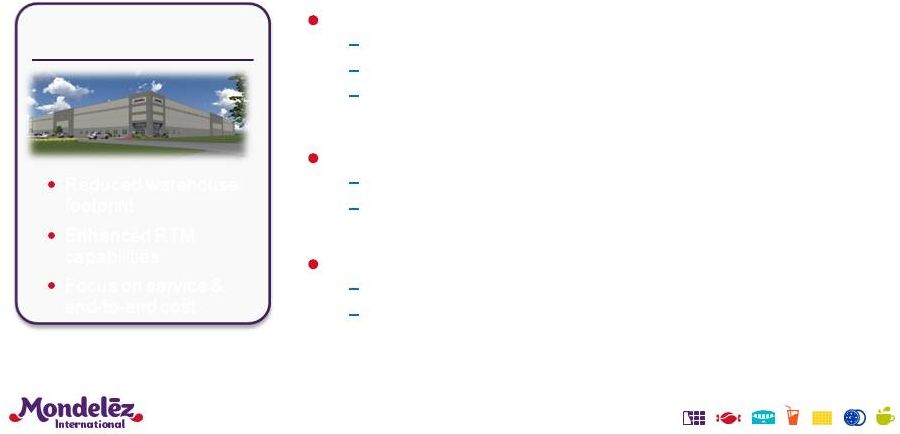 Optimizing distribution infrastructure
37
Eliminating 4 distribution centers by Q3 2014
Enables inventory reductions and service improvements
3 already exited
5% reduction in warehouse costs
Transportation efficiencies & effectiveness
Improved geographic footprint
Ship direct to branches
Service improvements
Case fill improved ~5 pp over the last 2 years
On-time delivery improved 10+ pp in 2013
OPTIMIZED
DISTRIBUTION MODEL
Reduced warehouse
footprint
Enhanced RTM
capabilities
Focus on service &
end-to-end cost |
 Creating a Fit for Purpose organization
38
Streamline category responsibility
Integrate Canada, eliminate redundancy
Focus P&L on categories
Harmonize & simplify portfolio
Lower cost structure and mindset
Zero-Based Budgeting
Embed sustainable cost leadership into culture
Aggressively build capabilities to strengthen execution
Streamline &
Simplify
Cost Savings
& Culture
Prioritized
Capability
Development |
 Plans in place to deliver
margin goal 39
Adjusted Segment Operating Income Margin
(1)
13.8%
14.9%
18% to
21%
(1)
Reported Segment Operating Income margin was 11.3% in FY 2012 and 12.7% in FY 2013.
See GAAP to Non-GAAP reconciliation at the end of this presentation.
2012
2013
2016 |
 Well-positioned for growth and value creation
Sustainable revenue growth
Significant margin improvement
Double-digit Adjusted EPS growth
Strong cash flow
Consistent top-tier financial performance over the long term
40 |
 |
 GAAP to Non-GAAP
Reconciliation 42
As
Reported/
Revised
(GAAP)
Impact of
Divestitures
(1)
Impact of
Currency
Organic
(Non-GAAP)
North America
2013
6,991
$
(39)
$
35
$
6,987
$
2012
6,903
$
(110)
$
-
$
6,793
$
% Change
1.3%
1.0
pp
0.6pp
2.9%
(1)
Net Revenues to Organic Net Revenues
For the Twelve Months Ended December 31,
($ in millions) (Unaudited)
Includes the exit of a product line upon the execution of a licensing agreement in 2013;
and a divestiture in 2012 |
 GAAP
to Non-GAAP Reconciliation 43
As
Reported/
Revised
(GAAP)
Integration
Program and other
Acquisition
Integration costs
(1)
Spin-Off Costs
and Related
Adjustments
(2)
2012-2014
Restructuring
Program
Costs
(3)
Benefit from
Indemnification
Resolution
(4)
Operating
Income from
Divestitures
Gains on
Acquisition and
Divestitures,
net
(5)
Acquisition-
related costs
As Adjusted
(Non-GAAP)
Mondelez International
2013
Operating Income
3,971
$
220
$
62
$
330
$
(336)
$
(6)
$
(30)
$
2
$
4,213
$
Operating Income margin
11.2%
12.0%
2012
Operating Income
3,637
$
140
$
512
$
110
$
-
$
(79)
$
(107)
$
1
$
4,214
$
Operating Income margin
10.4%
12.2%
North America
2013
Segment Operating Income
889
$
1
$
-
$
160
$
-
$
(11)
$
-
$
-
$
1,039
$
Segment Operating Income margin
12.7%
14.9%
2012
Segment Operating Income
781
$
6
$
77
$
98
$
-
$
(26)
$
-
$
-
$
936
$
Segment Operating Income margin
11.3%
13.8%
Europe
2013
Segment Operating Income
1,699
$
88
$
-
$
131
$
-
$
(2)
$
-
$
-
$
1,916
$
Segment Operating Income margin
12.1%
13.6%
2012
Segment Operating Income
1,762
$
47
$
1
$
6
$
-
$
(53)
$
-
$
-
$
1,763
$
Segment Operating Income margin
12.8%
13.0%
(1)
(2)
(3)
(4)
(5)
Restructuring Program costs represent restructuring and related implementation
costs reflecting primarily severance, asset disposals and other manufacturing-related costs.
As part of our 2010 Cadbury acquisition, the company became the responsible party
for tax matters under the Cadbury Schweppes Plc and Dr Pepper Snapple Group, Inc. (“DPSG”) Tax Sharing and
Indemnification Agreement dated May 1, 2008 (“Tax Indemnity”) for certain
2007 and 2008 transactions relating to the demerger of Cadbury’s Americas Beverage business. A U.S. federal tax audit of
DPSG for the 2006-2008 tax years was concluded with the IRS in August 2013. As
a result, the company recorded a favorable impact of $363 million due to the reversal of the accrued liability in
excess of the amount paid to DPSG under the Tax Indemnity. The company recorded
$336 million in selling, general and administrative expenses and $49 million in interest and other expense, net,
partially offset by $22 million of tax expense for an impact of $0.20 per diluted
share. On February 22, 2013, the company acquired the remaining interest in a
biscuit operation in Morocco, which is now a wholly-owned subsidiary within the EEMEA segment. A pre-tax gain of $22
million was recorded in connection with the acquisition. In addition, during
the twelve months ended December 31, 2013, the company divested a salty snack business in Turkey, a confectionery
business in South Africa and a chocolate business in Spain. A pre-tax
gain of $8 million was recorded in connection with these divestitures.
Operating Income To Adjusted Operating Income
($ in millions, except percentages) (Unaudited)
For the Twelve Months Ended December 31,
Integration
Program
costs
are
defined
as
the
costs
associated
with
combining
the
Mondelez
International
and
Cadbury
businesses,
and
are
separate
from
those
costs
associated
with
the
acquisition.
Spin-Off
Costs
represent
transaction
and
transition
costs associated
with
preparing
the
businesses
for
independent
operations
consisting
primarily
of
financial
advisory
fees,
legal
fees,
accounting
fees,
tax
services
and
information
systems
infrastructure duplication,
and
financing
and
related
costs
to
redistribute
debt
and
secure
investment
grade
ratings
for
both
the
Kraft
Foods
Group
business
and
the
Mondelez
International
business.
Spin-Off
related
adjustments
include
the
pension
adjustment
defined
as
the
estimated
benefit
plan expense associated
with
certain
benefit
plan
obligations
transferred
to Kraft Foods Group in the Spin-Off.
-
-
- |
 GAAP
to Non-GAAP Reconciliation 44
As
Reported/
Recorded
(GAAP)
Integration Program
and other
Acquisition
Integration costs
(3)
Spin-Off Costs
and Related
Adjustments
(4)
2012-2014
Restructuring
Program Costs
(5)
Benefit from
Indemnification
Resolution
(6)
Impact from
Divestitures
Acquisition-
related costs
As Adjusted
(Non-GAAP)
Net Revenues
35,299
$
-
$
-
$
-
$
-
$
(70)
$
-
$
35,229
$
Advertising and Consumer Promotion
3,234
$
-
$
-
$
-
$
-
$
(4)
$
-
$
3,230
$
Selling, Marketing, G & A and Other/Income & Expense
5,025
(160)
(55)
(4)
-
4,806
Research and Development
471
1
-
-
-
-
-
472
General corporate expense
(1)
283
(1)
(62)
2
-
-
222
Other
(2)
(334)
-
-
-
336
-
(2)
-
Selling, General and Administrative expenses
8,679
$
(160)
$
(62)
$
(53)
$
336
$
(8)
$
(2)
$
8,730
$
Advertising and Consumer Promotion
9.2%
9.2%
Selling, Marketing, G & A and Other/Income & Expense
14.2%
13.7%
Research and Development
1.3%
1.3%
General corporate expense
(1)
0.8%
0.6%
Other
(2)
(0.9)%
0.0%
Selling, General and Administrative expenses
24.6%
24.8%
(1)
(2)
(3)
(4)
(5)
(6)
Spin-Off
Costs
represent
transaction
and
transition
costs
associated
with
preparing
the
businesses
for
independent
operations
consisting
primarily
of
financial
advisory
fees,
legal
fees,
accounting
fees,
tax
services
and
information
systems
infrastructure
duplication,
and
financing
and
related
costs
to
redistribute
debt
and
secure
investment
grade
ratings
for
both
the
Kraft
Foods
Group
business
and
the
Mondelez
International
business.
Restructuring Program costs represent related implementation costs included in
SG&A reflecting primarily severance and asset disposal costs. As part of
our 2010 Cadbury acquisition, the company became the responsible party for tax matters under the Cadbury Schweppes Plc and Dr Pepper Snapple Group, Inc. (“DPSG”) Tax Sharing and Indemnification Agreement
dated May 1, 2008 (“Tax Indemnity”) for certain 2007 and 2008 transactions
relating to the demerger of Cadbury’s Americas Beverage business. A U.S. federal tax audit of DPSG for the 2006-2008 tax years was concluded with
the IRS in August 2013. As a result, the company recorded a favorable impact of $363
million due to the reversal of the accrued liability in excess of the amount paid to DPSG under the Tax Indemnity. The company recorded
$336
million
in
selling,
general
and
administrative
expenses
and
$49
million
in
interest
and
other
expense,
net,
partially
offset
by
$22
million
of
tax
expense
for
an
impact
of
$0.20
per
diluted
share.
SG&A Expense To Adjusted SG&A Expense
For the Twelve Months Ended December 31, 2013
($ in millions, except percentages) (Unaudited)
Excludes asset impairment costs recorded within general corporate expenses.
Includes
benefit
from
indemnification
resolution,
and
acquisition-related
costs.
Integration
Program
costs
are
defined
as
the
costs
associated
with
combining
the
Mondelez
International
and
Cadbury
businesses,
and
are
separate
from
those
costs
associated
with
the
acquisition.
-
- |
 GAAP
to Non-GAAP Reconciliation 45
Net Cash Provided by Operating Activities (GAAP)
6,410
$
Items
Cash impact of the resolution of the Starbucks arbitration
(1)
(2,616)
Cash payments for accrued interest and other related fees associated with
debt tendered as of December 18, 2013.
(2)
81
Restructuring Program
Cash payments for Restructuring Program expenses
221
Net Cash Provided by Operating Activities excluding items and
Restructuring Program (Non-GAAP)
4,096
$
Capital Expenditures (GAAP)
1,622
$
Restructuring Progam capital expenditures
(61)
Capital Expenditures excluding Restructuring Program (Non-GAAP)
1,561
$
(1)
(2)
On December 18, 2013, the company completed a $3.4 billion cash tender offer for
some of its outstanding high coupon long-term debt. The amount
above reflects the cash payments associated with accrued interest and other
related fees.
For the Twelve Months Ended December 31, 2013
Net Cash Provided by Operating Activities
and Capital Expenditures
($ in millions) (Unaudited)
During the fourth quarter of 2013, the dispute with Starbucks Coffee Company was
resolved. The amount noted above reflects the cash received from
Starbucks of $2,764 million net of $148 million attorney's fees paid. |
 GAAP
to Non-GAAP Reconciliation 46
Net Cash Provided by Operating Activities (GAAP)
6,410
$
Capital Expenditures
(1,622)
Free Cash Flow (Non-GAAP)
4,788
$
Items
Cash
impact
of
the
resolution
of
the
Starbucks
arbitration
(1)
(2,616)
Cash payments for accrued interest and other related fees associated with
debt
tendered
as
of
December
18,
2013.
(2)
81
Free Cash Flow excluding items (Non-GAAP)
2,253
$
(1)
(2)
On December 18, 2013, the company completed a $3.4 billion cash tender offer for
some of its outstanding high coupon long-term debt. The amount
above reflects the cash payments associated with accrued interest and other
related fees.
For the Twelve Months Ended December 31, 2013
Net Cash Provided by Operating Activities
to Free Cash Flow excluding items
($ in millions) (Unaudited)
During the fourth quarter of 2013, the dispute with Starbucks Coffee Company was
resolved. The amount noted above reflects the cash received from
Starbucks of $2,764 million net of $148 million attorney's fees paid. |