Attached files
| file | filename |
|---|---|
| 8-K - 8-K - HARDINGE INC | a14-5927_18k.htm |
| EX-99.1 - EX-99.1 - HARDINGE INC | a14-5927_1ex99d1.htm |
Exhibit 99.2
|
|
Fourth Quarter and Year End 2013 Financial Results Conference Call February 13, 2014 NASDAQ: HDNG www.hardinge.com Douglas J. Malone Vice President and Chief Financial Officer Richard L. Simons Chairman, President and Chief Executive Officer |
|
|
Safe Harbor Statement This presentation may contain forward-looking statements (within the meaning of Section 27A of the Securities Act of 1933, as amended and Section 21E of the Securities Exchange Act of 1934, as amended). Any such statements are based upon management’s current expectations that involve risks and uncertainties. Any statements that are not statements of historical fact or that are about future events may be deemed to be forward-looking statements. For example, words such as “may”, “will”, “should”, “estimates”, “predicts”, “potential”, “continue”, “strategy”, “believes”, “anticipates”, “plans”, “expects”, “intends” and similar expressions are intended to identify forward-looking statements. The Company’s actual results or outcomes and the timing of certain events may differ significantly from those discussed in any forward-looking statements. The following factors are among those that could cause actual results to differ materially from the forward-looking statements, which involve risks and uncertainties, and that should be considered in evaluating any such statement: fluctuations in the machine tool business cycles, changes in general economic conditions in the U.S. or internationally, the mix of products sold and the profit margins thereon, the relative success of the Company’s entry into new product and geographic markets, the Company’s ability to manage its operating costs, actions taken by customers such as order cancellations or reduced bookings by customers or distributors, competitor’s actions such as price discounting or new product introductions, governmental regulations and environmental matters, changes in the availability of cost of materials and supplies, the implementation of new technologies and currency fluctuations. The Company undertakes no obligation to publicly update any forward-looking statement, whether as a result of new information, future events, or otherwise. |
|
|
Strong Fourth Quarter Sales ($ in millions) $329 $214 $257 $342 $334 $103 Quarterly Net Sales Annual Net Sales $90 $67 Acquisitions more than offset the organic sales decline compared with Q4 2012 Sales to all regions improved over trailing third quarter $79 $80 Actual net sales may differ due to rounding. |
|
|
Gross Margin Quarterly Sales and Gross Margin Annual Sales and Gross Margin Net Sales (in millions) Q4 2013 gross margin impacted by lower machine tool production in certain factories 2013 gross margin improvement over prior years due to favorable product mix Sales ($ in millions) *Gross Profit and Gross Margin for Q2 2013, Q3 2013, Q4 2013, 2009 and 2013 were adjusted to exclude unusual items. All amounts shown pertain to continuing operations. See supplemental slides for Adjusted Gross Profit and Gross Margin reconciliation and other important disclaimers regarding adjusted Gross Profit and Gross Margin. Actual net sales may differ due to rounding. |
|
|
Operating Margin Quarterly Sales & Operating Margin Annual Sales & Operating Margin Q4 2013 operating margin benefitted from leverage on higher sales Sales ($ in millions) * Annual Operating Income and Operating Margin for 2009, 2010, 2012 and 2013 and quarterly Operating Income and Operating Margin for Q4 2012, Q1 2013, Q2 2013, Q3 2013 and Q4 2013 were adjusted to exclude unusual items. All amounts shown pertain to continuing operations. See supplemental slides for Adjusted Operating Income and Operating Margin reconciliation and other important disclaimers regarding Adjusted Operating Income and Operating Margin. Actual net sales may differ due to rounding. |
|
|
Quarterly Net Income Annual Net Income Net Income ($ in millions) * Annual Net Income for 2009, 2010, 2012 and 2013 and quarterly Net Income for Q4 2012, Q1 2013, Q2 2013, Q3 2013 and Q4 2013 were adjusted to exclude unusual items. All amounts shown pertain to continuing operations. See supplemental slides for Adjusted Net Income reconciliation and other important disclaimers regarding Adjusted Net Income. Q4 2013 net income benefitted from higher sales |
|
|
Emphasis on Productivity and Cash Managed Working Capital* as a Percent of Sales (Avg) Receivable Days Outstanding (Avg) Inventory Turns (Avg) * Managed Working Capital is defined as: Receivables + Inventory - Payables - Customer Deposits |
|
|
Financial Strength and Flexibility Total Capitalization ($ in millions) * Reflects expansion capital investments in China and Switzerland of $17.2 million in 2011 and $3.3 million in 2012. ** Midpoint of guidance of $5.5 million to $6.5 million provided on February 13, 2014. Cash & Cash Equivalents Capital Expenditures $166.5 $162.9 $168.5 $181.2 $230.2 Total Capitalization Q4 2013 Q4 2012 Cash provided by operating activities $17.4 $17.8 CapEx (1.7) (1.5) Operating free cash flow $15.7 $16.3 |
|
|
Geographic Diversity Creates Larger Addressable Market ($ in millions) Annual Orders $288 $372 $297 $175 $288 Quarterly Orders $58 $74 $71 $76 $67 Q4 2013 organic orders improved over prior-year period and trailing quarter Q4 2013 orders include $10.4 million of orders from acquired operations N.A.: $5.5 million of orders from acquisitions Europe: $4.6 million of orders from acquisitions Asia: $0.3 million of orders from acquisitions Actual orders may differ due to rounding. |
|
|
($ in millions) Backlog Lead times vary by product line Grinding: six to nine months Milling and turning: two to six months Workholding parts and accessories: Standard - next day, Specials – four to eight weeks Enhanced Backlog through Acquisitions $123 $91 |
|
|
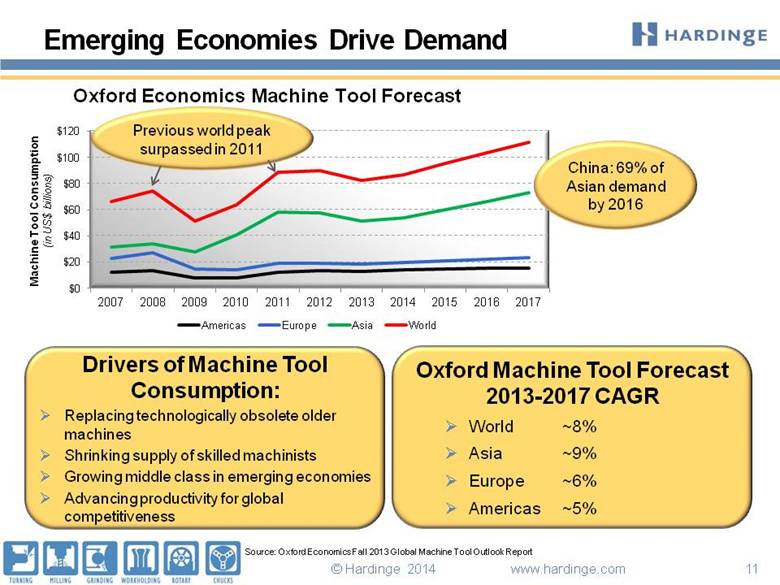
Oxford Economics Machine Tool Forecast Source: Oxford Economics Fall 2013 Global Machine Tool Outlook Report Emerging Economies Drive Demand Machine Tool Consumption (in US$ billions) Previous world peak surpassed in 2011 China: 69% of Asian demand by 2016 Drivers of Machine Tool Consumption: Replacing technologically obsolete older machines Shrinking supply of skilled machinists Growing middle class in emerging economies Advancing productivity for global competitiveness Oxford Machine Tool Forecast 2013-2017 CAGR World ~8% Asia ~9% Europe ~6% Americas ~5% |
|
|
Long-term outlook on machine tool industry remains positive Acquisitions have improved sales and margin profile Expecting moderate growth in 2014; Slow start in Q1 Macroeconomic factors expected to drive U.S. improvements Customer feedback in Asia remains positive for growth in machine tool Europe bottomed in mid 2013, moderate recovery expected to continue during 2014 Drive sales, strengthen earnings power and create leverage Innovation: Engineering and development to maintain competitive edge Hardinge Inc. Performance Excellence – our Lean Six Sigma performance improvement initiative Strategy includes pursuing acquisitions to complement organic growth Overview and Outlook |
|
|
Fourth Quarter and Year End 2013 Earnings Conference Call February 13, 2014 NASDAQ: HDNG www.hardinge.com |
|
|
NASDAQ: HDNG SUPPLEMENTAL INFORMATION www.hardinge.com |
|
|
Adjusted Gross Profit Reconciliation ($ in millions) Gross Profit and Gross Margin for 2009 , 2013, Q2 2013, Q3 2013 and Q4 2013 were adjusted to exclude unusual items as listed above Hardinge believes that when used in conjunction with GAAP measures, Adjusted Gross Profit, which is a non-GAAP measure, assists in the understanding of Hardinge’s operating performance. Q1 Q2 Q3 Q4 2009 2010 2011 2012 2013 2013 2013 2013 2013 Sales $ 214.1 $ 257.0 $ 341.6 $ 334.4 $ 329.5 $ 67.2 $ 79.4 $ 79.8 $ 103.1 Cost of sales 173.3 195.7 250.5 237.6 236.2 48.2 56.6 57.7 73.7 Gross profit 40.8 61.3 91.1 96.8 93.3 19.0 22.8 22.1 29.4 Inventory impairment 5.0 - - - - - - - - Inventory step-up charge - - - - 1.9 - 0.7 0.4 0.8 Adjusted gross profit $ 45.8 $ 61.3 $ 91.1 $ 96.8 $ 95.2 $ 19.0 $ 23.5 $ 22.5 $ 30.2 Adjusted gross margin 21.4% 23.9% 26.7% 29.0% 28.9% 28.2% 29.6% 28.2% 29.3% |
|
|
Annual Adjusted Net Income and Operating Income ($ in millions) Net Income, Operating Income and Operating Margin in 2009, 2010, 2012 and 2013 were adjusted to exclude unusual items as listed above. Hardinge believes that when used in conjunction with GAAP measures, adjusted Net Income (loss) and adjusted Operating Income (loss), which are non-GAAP measures, assist in the understanding of Hardinge’s operating performance. Actual amounts may differ due to rounding. 2009 2010 2011 2012 2013 Net (loss) income ($33.3) ($5.2) $12.0 $17.9 $9.9 Inventory impairment 5.0 - - - - Impairment charge - - - - 6.2 Restructuring 5.4 - - - - Gain on sale & acquisition - (1.7) - - - Income from discontinued operations and gain on disposal of discontinued operations, net of tax - - - - (5.5) Inventory step-up charge - - - - 1.9 Acquisition transaction expense - - - 0.2 2.2 Other adjustment - 3.5 - (2.7) 0.2 Net (loss) income / adjusted net (loss) income (22.9) (3.4) 12.0 15.4 14.9 Plus: Interest expense, net 1.8 0.3 0.2 0.7 1.0 Adjusted income tax expense 1.9 2.2 4.4 4.3 1.4 Adjusted operating (loss) income ($19.2) ($0.9) $16.6 $20.4 $17.3 Sales $214.1 $257.0 $341.6 $334.4 $329.5 Adjusted operating margin (9.0)% (0.4)% 4.9% 6.1% 5.3% |
|
|
Quarterly Adjusted Net Income and Operating Income ($ in millions) Quarterly Net Income, Operating Income and Operating Margin were adjusted to exclude unusual items as listed above. Hardinge believes that when used in conjunction with GAAP measures, adjusted Net Income (loss) and adjusted Operating Income (loss), which are non-GAAP measures, assist in the understanding of Hardinge’s operating performance. Q4 2012 Q1 2013 Q2 2013 Q3 2013 Q4 2013 Net income 7.752 $ 0.040 $ 2.265 $ 1.479 $ 6.143 $ Inventory step-up charge - - 0.708 0.422 0.785 Acquisition transaction expense 0.290 0.645 0.970 0.281 0.258 Income from discontinued operations and gain on disposal of discontinued operations, net of tax - - (0.209) (0.276) (5.047) Impairment Charge - - - - 6.239 Other adjustment (2.720) - - 0.186 - Adjusted net income 5.322 0.685 3.734 2.092 8.378 Plus: Interest expense, net 0.181 0.190 0.297 0.311 0.267 Adjusted income tax expense 1.332 0.222 0.316 0.875 (0.051) Adjusted operating income 6.835 1.097 4.347 3.278 8.594 Sales 90.560 $ 67.219 $ 80.814 $ 82.258 $ 103.102 $ Adjusted operating margin 7.5% 1.6% 5.4% 4.0% 8.3% |
|
|
Quarterly Financial Appendix ($ in millions, except for per share data) 3/31/2012 6/30/2012 9/30/2012 12/31/2012 3/31/2013 6/30/2013 9/30/2013 12/31/2013 Net sales $ 74.650 $ 86.320 $ 82.883 $ 90.560 $ 67.219 $ 79.354 $ 79.784 $ 103.102 Cost of sales 53.461 62.348 58.889 62.878 48.246 56.588 57.742 73.644 Gross profit 21.189 23.972 23.994 27.682 18.973 22.766 22.042 29.458 Gross profit margin 28.4% 27.8% 28.9% 30.6% 28.2% 28.7% 27.6% 28.6% Selling, general and administrative expenses 17.599 19.047 18.569 20.981 18.245 19.963 19.572 21.753 (Loss) gain on sale of assets (0.002) (0.012) (0.013) 0.107 (0.042) 0.031 0.002 0.053 Impairment charge - - - - - - - 6.239 Other expense (income) 0.204 0.099 0.127 0.049 0.318 0.109 (0.101) 0.101 Income from operations 3.388 4.838 5.311 6.545 0.452 2.663 2.569 1.312 Operating margin 4.5 % 5.6 % 6.4 % 7.2 % 0.7 % 3.4 % 3.2 % 1.3 % Interest expense 0.140 0.269 0.246 0.204 0.205 0.311 0.325 0.287 Interest income (0.024) (0.027) (0.044) (0.023) (0.015) (0.014) (0.015) (0.020) Income from continuing before income taxes 3.272 4.596 5.109 6.364 0.262 2.366 2.259 1.045 Income tax expense (benefit) 0.829 0.956 1.089 (1.388) 0.222 0.310 1.056 (0.051) Income from continuing operations $ 2.443 $ 3.640 $ 4.020 $ 7.752 $ 0.040 $ 2.056 $ 1.203 $ 1.096 Income from discontinued operations, net of tax - - - - - 0.209 0.276 0.157 Gain from disposal of discontinued operations, net of tax - - - - - - - 4.890 Net Income $ 2.443 $ 3.640 $ 4.020 $ 7.752 $ 0.040 $ 2.265 $ 1.479 $ 6.143 Basic earnings per share Continuing operations $ 0.21 $ 0.31 $ 0.35 $ 0.67 $ - $ 0.17 $ 0.10 $ 0.09 Discontinued operations $ - $ - $ - $ - $ - $ 0.02 $ 0.03 $ 0.01 Disposal of discontinued operations $ - $ - $ - $ - $ - $ - $ - $ 0.40 Earnings per share $ 0.21 $ 0.31 $ 0.35 $ 0.67 $ - $ 0.19 $ 0.13 $ 0.50 Diluted earnings per share Continuing operations $ 0.21 $ 0.31 $ 0.34 $ 0.66 $ - $ 0.17 $ 0.10 $ 0.09 Discontinued operations $ - $ - $ - $ - $ - $ 0.02 $ 0.03 $ 0.01 Disposal of discontinued operations $ - $ - $ - $ - $ - $ - $ - $ 0.40 Earnings per share $ 0.21 $ 0.31 $ 0.34 $ 0.66 $ - $ 0.19 $ 0.13 $ 0.50 Cash dividends declared per share $ 0.02 $ 0.02 $ 0.02 $ 0.02 $ 0.02 $ 0.02 $ 0.02 $ 0.02 Weighted avg. shares outstanding: Basic 11.524 11.562 11.567 11.574 11.660 11.663 11.721 12.160 Weighted avg. shares outstanding: Diluted 11.557 11.600 11.606 11.619 11.743 11.754 11.813 12.253 Quarter Ended |