Attached files
| file | filename |
|---|---|
| 8-K - 8-K - CatchMark Timber Trust, Inc. | d677129d8k.htm |
 RISI
Timberland Conference February 2014
Exhibit 99.1 |
 1
Forward Looking Statements
This presentation contains certain forward-looking statements within the meaning of the federal
securities laws. These forward-looking statements are based on certain assumptions, discuss
future expectations, describe future plans and strategies, contain financial and operating
projections or state other forward- looking information. The Company’s ability to
predict results or the actual effect of future events, actions, plans or strategies is
inherently uncertain. Although the Company believes that the expectations reflected in such
forward-looking statements are based on reasonable assumptions, the Company’s actual results
and performance could differ materially from those set forth in, or implied by, the
forward-looking statements as a result of risks and uncertainties, including those
described in the Company’s filings with the Securities and Exchange Commission. You are
cautioned not to place undue reliance on any of these forward-looking statements, which
reflect the Company’s views on this date. Furthermore, except as required by law,
the Company is under no duty to, and does not intend to, update any of our forward- looking
statements after this date, whether as a result of new information, future events or otherwise. |
 2
Annual Housing Starts vs. Real Sawtimber Prices
(starts in 000s / US$ per ton)
It’s All About Housing
Housing starts drive sawtimber prices: 1.5mm starts = $40+ sawtimber (vs. $23
today). Source: Forest Economic Advisors.
Projected Housing Starts
Projected Lumber Consumption
(starts in millions)
(BBF)
Source:
Timber Mart-South South-wide Average Sawtimber Prices.
Note:
Prices are adjusted for inflation and converted to 2013 dollars based on the
Producer Price Index (PPI).
0.8
0.9
1.2
1.4
1.6
1.8
0.5
1.0
1.5
2.0
12
13
14
15
16
17
$20
$30
$40
$50
$60
500
1,000
1,500
2,000
2,500
Total Housing Starts
Pine Sawtimber
44.4
48.5
53.2
57.7
63.0
67.3
30
40
50
60
70
80
12
13
14
15
16
17 |
 3
Mountain Pine Beetle Impact Will Be Pronounced
U.S. Housing Starts vs. B.C. Interior Annual Allowable Cut
MPB epidemic is projected to lead to reduced lumber production of 20% in B.C.
Inventory of Available Live and Dead Lodgepole Pine By Years Since Attack
(Mil m³)
(starts in MMs / AAC in Mil m³)
Poor Grade of
Lumber
Lower Log
Recovery
Longer Haul
Distances
Higher Costs &
Lower Production
from B.C.
~20% Decline in B.C. Supply
~5% Decline in N. American Supply
Economic Shelf Life = 8-12 years
Source: Forest Economic Advisors.
2.1
0.6
1.5
64.1
66.9
50.7
2005
2009
Trend
Housing Starts
B.C. Interior AAC
-
200
400
600
800
1,000
1,200
1,400
1,600
99
00
01
02
03
04
05
06
07
08
09
10
11
12
13
14
15
16
17
18
19
20
Live
<8 yrs
9-10 yrs
11-12 yrs
>12 yrs
Year |
 4
17.0
13.8
-
4.0
8.0
12.0
16.0
20.0
2005
2016
Lumber Production
Eastern Canada Producers Have Multiple Challenges
Eastern Canada Lumber Production
Increased harvest restrictions and large-scale paper mill closures are projected
to lead to reduced lumber production of 20% in Eastern Canada.
Unsustainable
Harvest Levels
Higher Costs & Lower Production from
Eastern Canada
Issue
Government
Mandated Harvest
Reductions
Result
Closure of Pulp and
Paper Mills
Severely Impacted
Sawmill Economics
Net Impact
Source: Forest Economic Advisors.
~20% Decline in E. Canada Supply
~5% Decline in N. American Supply |
 5
Log and Lumber Export Volume Has Surged
China has driven exponential growth in log and lumber exports from the Pacific
Northwest and British Columbia, respectively.
U.S. Pacific Northwest Log Exports
British Columbia Lumber Exports (excl. U.S.)
(BBF)
(BBF)
Source: Forest Economic Advisors.
Source: Forest Economic Advisors.
-
0.5
1.0
1.5
2.0
02
03
04
05
06
07
08
09
10
11
12
13
China
Rest of World
Year
-
2.0
4.0
6.0
8.0
02
03
04
05
06
07
08
09
10
11
12
13
China
Rest of World
Year |
 6
Aggregate Supply-Demand Impact Will Be Unprecedented
These supply-demand factors equate to +1.7 million housing start
equivalents. Mountain Pine Beetle Epidemic in
British Columbia
Significant Increase in Lumber and
Log Exports to China
Major Timber Supply Contractions
in Eastern Canada
Recent Upturn in U.S. Residential
Construction
Annual Supply Impact
(Housing Start Equivalents)
Annual Demand Impact
(Housing Start Equivalents)
(220,000)
(175,000)
+450,000
+890,000
Aggregate Impact on Lumber
Supply-Demand Balance
~1.74 million
Versus 2013 Starts of ~950k
Source: Forest Economic Advisors. |
 7
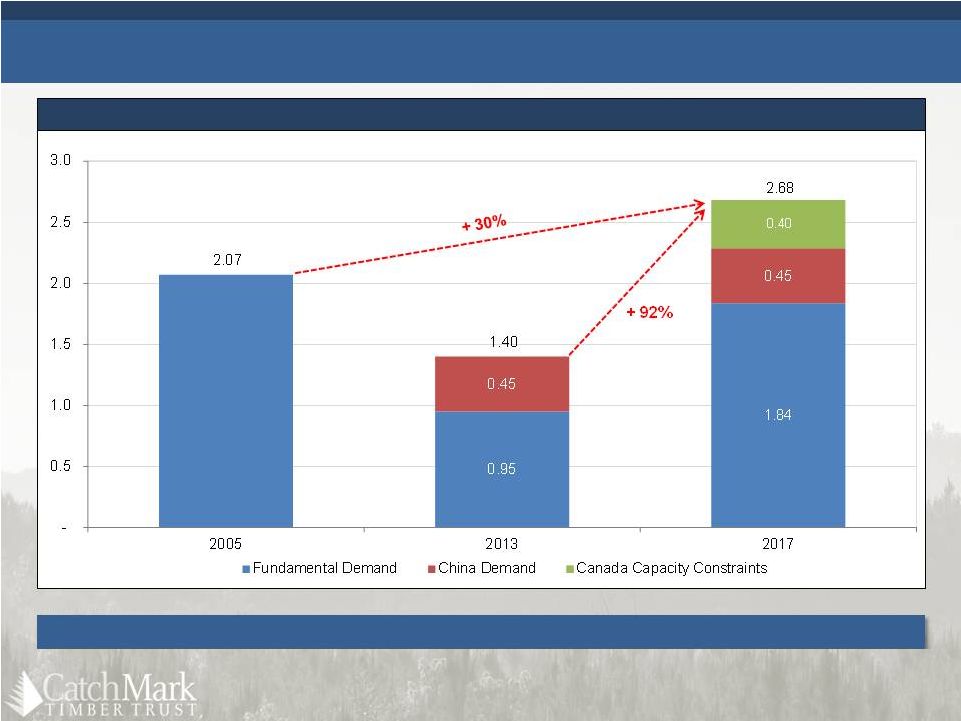
“Super-Cycle”
Creates New Peak
2005 vs. 2013 vs. 2017 Housing Start Equivalents
(starts in millions)
Source: Forest Economic Advisors.
New “super-cycle” peak (+30% vs. 2005) should drive significantly higher sawtimber
prices. |
 8
Non-correlated asset class with inflation protection
Industry leveraged to timber “super-cycle”
Clearing house for mid-sized forests
Substantial pipeline of finite life institutional timberland portfolios
High demand fiber basket with diverse mill customers
Very strong pulpwood market
Only publicly-traded REIT invested exclusively in timberlands
Largest U.S. timber market with strong fundamentals
Significant experience in timberland investment and operations
Strong
track
record
at
TimberStar
–
acquired
$1.4
billion
of
timberlands and exited at 2.0x equity multiple within 4 years
Strategically Located Portfolio
Opportune Acquisition
Environment
CatchMark Highlights
Experienced Management
Team
“Pure Play”
U.S. South Timber
REIT
Attractive Asset Class |
 Overview of CatchMark Timber Trust Holdings
280,000 acres of commercial
timberlands
247,200 fee acres
32,800 leased acres
Approximately 10.7mm tons of
merchantable timber (as of
12/31/13)
50+ mills within 100-mile radius
Delivers approximately 750
truckloads weekly
Planted 13.9mm trees since
2007 acquisition
Well-diversified species and
product mix
75% pine / 25% hardwood
by acreage
41% sawtimber / 59%
pulpwood by volume
SFI-certified
Forest Product Mills within
100-mile radius
Counties with CatchMark
Ownership
Alabama
Georgia
Note: Colors on U.S. map denote major timberland markets.
9 |
 10
CatchMark is a Pure-Play Timber REIT
2012 EBITDA from Non-Timber Businesses
CatchMark will be the only pure-play, publicly-traded timber REIT with a
focus on recurring harvest cash flow.
%
of
Average
Timberland
Adjusted
EBITDA
from
Land
Sales
(1)
(1)
Data
based
on
5-year
average
data
(2008
–
2012); Timberland Adjusted EBITDA includes timber harvest EBITDA, land sales
EBITDA and non-cash basis of land sales. (2)
Weyerhaeuser does not provide disclosure on land sales.
52%
9%
63%
11%
25%
0%
0%
20%
40%
60%
80%
100%
WY
PCL
RYN
PCH
DEL
CatchMark
% of Total EBITDA
NA
64%
43%
44%
24%
25%
0%
10%
20%
30%
40%
50%
60%
70%
80%
WY
PCL
RYN
PCH
DEL
CatchMark
% of Timberland Adj. EBITDA
(2) |
 11
(1)
Gross proceeds of $163 million less fees and expenses of $14.4 million.
(2)
Based on price as of 2/6/2014.
(3)
Based on debt divided by (debt plus equity market cap).
$150mm committed, multi-draw acquisition
facility with accordion up to $225mm
Grid pricing overview:
LOC / Term Loan: L+150 to L+275
Acquisition Facility: L+175 to L+300
+ 20 to 35 bps commitment fee
$15mm revolver (undrawn)
Debt remaining post-IPO converted to term
loan
Conservative Capital Structure with Embedded Growth Capacity
CatchMark has low leverage with over $200 million of embedded leverage / acquisition
capacity.
($ in 000s)
9/30/2013
Pro Forma
(1)
New Credit Facility Overview
Cash & Cash Equivalents
$12,467
Total Debt
32,254
Net Debt
$19,787
Preferred Stock
–
Stockholders' Equity
303,794
Equity Market Cap.
(2)
$337,242
Debt to Total Market Cap.
(3)
8.7% |
 12
Historical Timberland Transaction Volume
($ in millions)
Timberland M&A Activity Is Picking Up
Significant TIMO owned portfolios acquired in 2003 –
2008 expected to re-enter the market.
Source: Forest Economic Advisors.
2003 –
2008 Volume = $35 billion
$680
$1,634
$2,032
$3,767
$3,074
$6,130
$8,458
$8,391
$4,901
$1,949
$1,060
$1,337
$3,404
$3,853
2000
2001
2002
2003
2004
2005
2006
2007
2008
2009
2010
2011
2012
2013 |
 Timely Growth Opportunity
Cyclical buying opportunities in timberland
Significant upside potential from improving market dynamics
Substantial pipeline of finite life institutional timberland
portfolios
Focus on key U.S. South and Pacific Northwest regions
Target well-stocked properties capable of generating stable cash flow
Utilize attractive cost of capital
Senior team with deep and proven timber investing experience
Strong management track record and historical investor returns
$1.4 billion capital invested, 1.4x capital returned, 2.0x equity returned
Opportunity / Timing
Strategy
Track Record
CatchMark is well-positioned to execute its growth strategy and leverage the
anticipated sector recovery.
13 |
 14
Conclusion / Key Takeaways
Proactive asset management philosophy and value maximization mindset
Significant experience investing in and operating timberlands
Track record of delivering strong investor returns
Non-correlated asset class, inflation protection, direct play on housing
recovery Stable and predictable cash flows with significant upside
potential Excellent anchor asset located in competitive fiber basket
Pure-play timber REIT focused on timberland operations
Balance sheet capacity and pipeline to grow accretively
Strong governance structure with industry best practices
Valuation at discount to recent private market transaction precedents
Represents attractive entry point with significant upside from industry
“super-cycle” Asset
Team
Platform
CatchMark represents a compelling opportunity.
Valuation |
 |
