Attached files
| file | filename |
|---|---|
| 8-K - FORM 8-K - ROWAN COMPANIES PLC | v367705_8k.htm |

Execution Year Credit Suisse Vail Energy Summit Matt Ralls, Chief Executive Officer February 12, 2014
Execution Year Investor Presentation February, 2014

Forward - Looking Statements 2 This report contains f orward - looking statements within the meaning of the Private Securities Litigation Reform Act of 1995, including, without limitation, as well as statements as to the expectations, beliefs and future expected business, financial performance and prospects of the Company that are based on current expectations and are subject to certain risks, assumptions, trends and uncertainties that could cause actual results to differ materially from those projected by the Company. Among the factors that could cause actual results to differ materially include oil and natural gas prices, the level of offshore expenditures by energy companies, variations energy demand, changes in day rates, cancellation by our customers of drilling contracts, letter agreements or letters of intent or the exercise of early termination provisions, risks associated with fixed cost drilling operations, cost overruns or delays on shipyard repair, construction or transportation of drilling units, maintenance and repair costs, costs or delays for conversion or upgrade projects, operating hazards and equipment failure, risks of collision and damage, casualty losses and limitations on insurance coverage, customer credit and risk of customer bankruptcy,, the general economy and energy industry, weather conditions in the Company’s operating areas, increasing complexity and costs of compliance with environmental and other laws and regulations, changes in tax laws and interpretations by taxing authorities, civil unrest and instability, terrorism and hostilities in our areas of operations that may result in loss or seizure of assets, the outcome of disputes and legal proceedings, effects of the change in our corporate structure, and other risks disclosed in the Company's filings with the U.S. Securities and Exchange Commission. Each forward - looking statement speaks only as of the date hereof, and the Company expressly disclaims any obligation to update or revise any forward - looking statements, except as required by law.
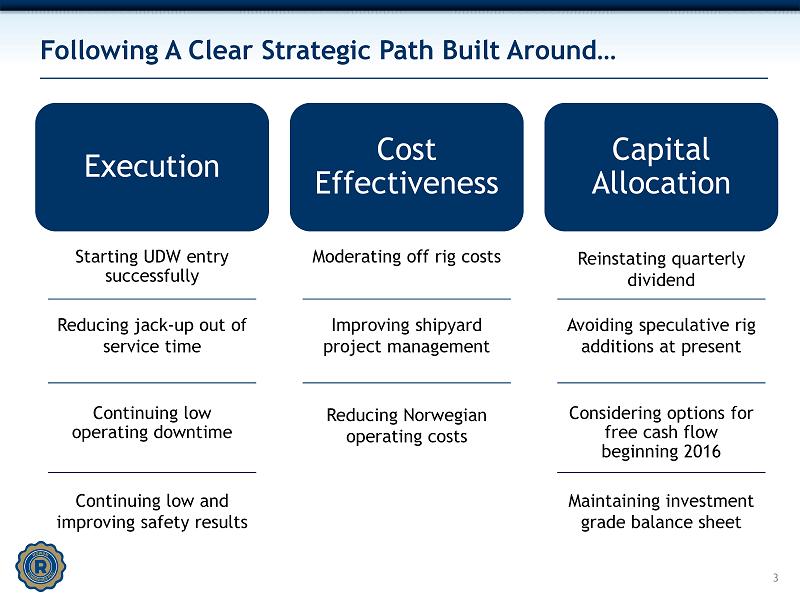
Following A Clear Strategic Path Built Around… 3 Continuing low operating downtime Execution Starting UDW entry successfully Continuing low and improving safety results Reducing jack - up out of service time Capital Allocation Considering options for free cash flow beginning 2016 Reinstating quarterly dividend Avoiding speculative rig additions at present Maintaining investment grade balance sheet Cost Effectiveness Moderating off rig costs Improving shipyard project management Reducing Norwegian operating costs
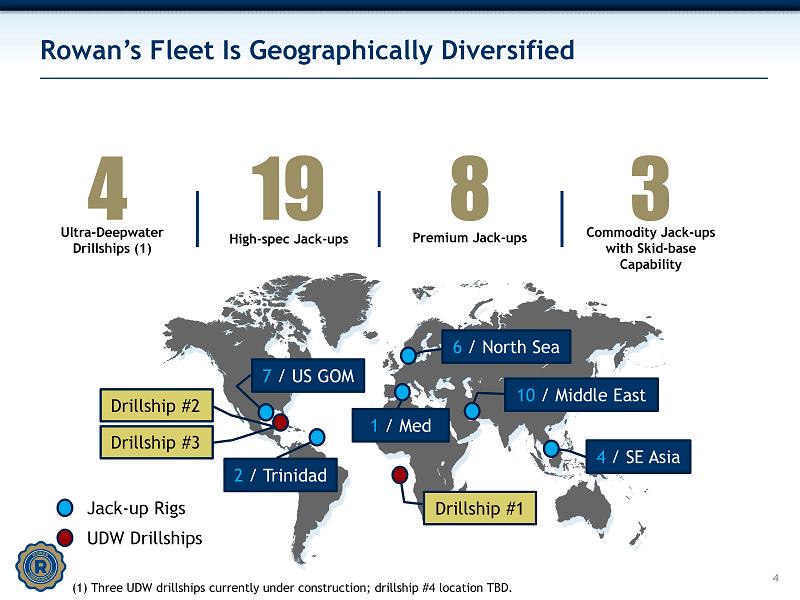
Rowan’s Fleet Is Geographically Diversified 4 6 / North Sea 10 / Middle East 4 / SE Asia 7 / US GOM Drillship #1 19 High - spec Jack - ups 8 Premium Jack - ups 3 Commodity Jack - ups with Skid - base Capability 4 Ultra - Deepwater Drillships (1) 1 / Med 2 / Trinidad Drillship #2 Jack - up Rigs UDW Drillships Drillship #3 (1) Three UDW drillships currently under construction; drillship #4 location TBD.
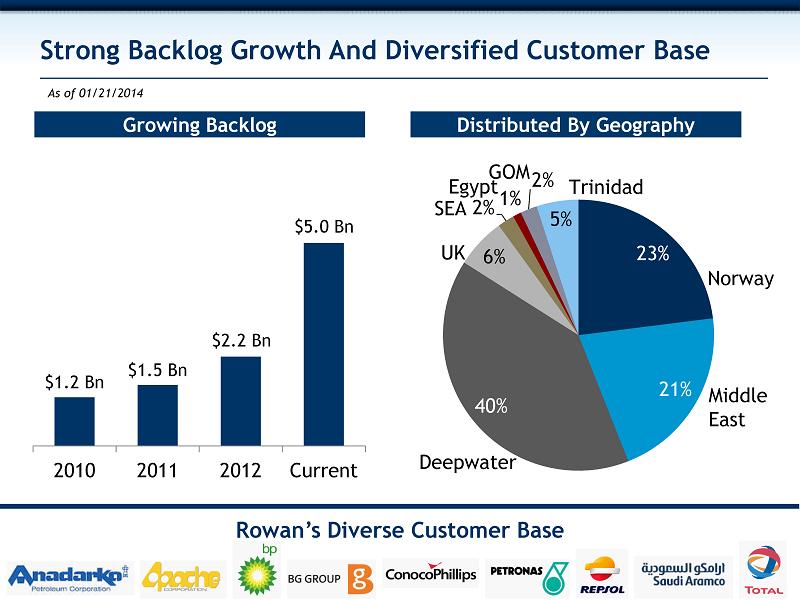
5 Strong Backlog Growth And Diversified Customer Base $1.2 Bn $1.5 Bn 2010 2011 2012 Current $2.2 Bn $5.0 Bn 23% 21% 40% 6% 2% 1% 2% 5% Norway Middle East Deepwater UK SEA Egypt Trinidad Growing Backlog Distributed By Geography Rowan’s Diverse Customer Base GOM As of 01/21/2014
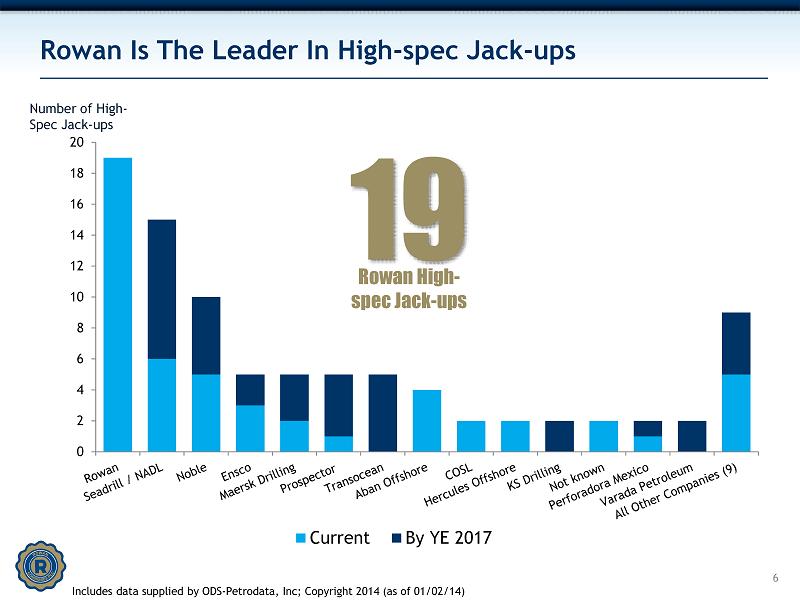
Rowan Is The Leader In High - spec Jack - ups Number of High - Spec Jack - ups 0 2 4 6 8 10 12 14 16 18 20 Current By YE 2017 19 Rowan High - spec Jack - ups Includes data supplied by ODS - Petrodata, Inc; Copyright 2014 (as of 01/02/14) 6

Rowan Achieves Higher Jack - up Day Rates And Utilization Comparison of Current Jack - up Day Rates: Rowan vs. Peers (000s) Comparison of Jack - up Utilization 2003 – 2013: Rowan vs. Peers 0 20 40 60 80 100 Rowan(2) Peers (1) (1) Peers include DO, RIG, NE, SDRL/ NADL, and ESV (2) Rowan’s marketed utilization is currently 100% $278 $156 $144 $124 $177 $144 $113 $117 $0 $50 $100 $150 $200 $250 $300 N. Sea S.E. Asia U.S. GOM Mid East Rowan Peers (1) 7 Includes data supplied by ODS - Petrodata, Inc; Copyright 2014 (as of 01/02/14)
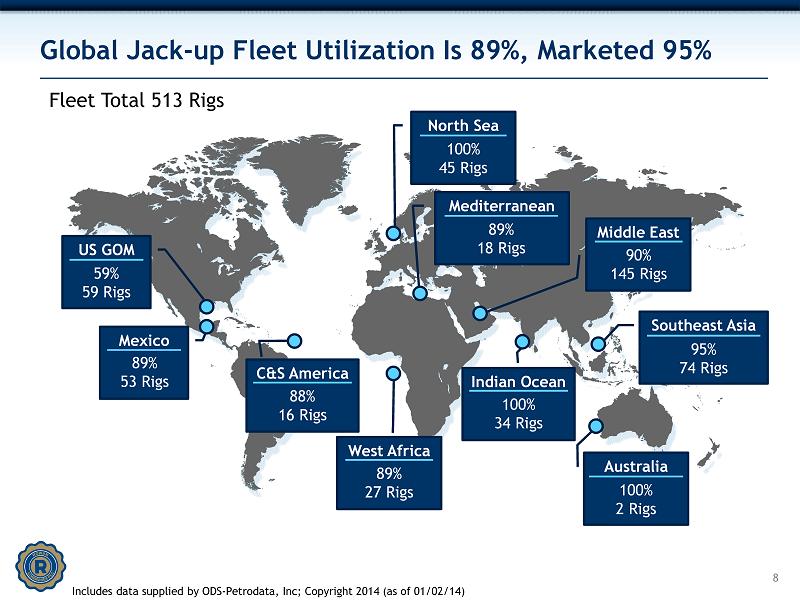
Global Jack - up Fleet Utilization Is 89%, Marketed 95% 8 US GOM Indian Ocean North Sea Mediterranean Middle East Southeast Asia Mexico C&S America West Africa Australia 59% 59 Rigs 89% 53 Rigs 88% 16 Rigs 89% 27 Rigs 100% 34 Rigs 100% 2 Rigs 95% 74 Rigs 90% 145 Rigs 89% 18 Rigs 100% 45 Rigs Includes data supplied by ODS - Petrodata, Inc; Copyright 2014 (as of 01/02/14) Fleet Total 513 Rigs
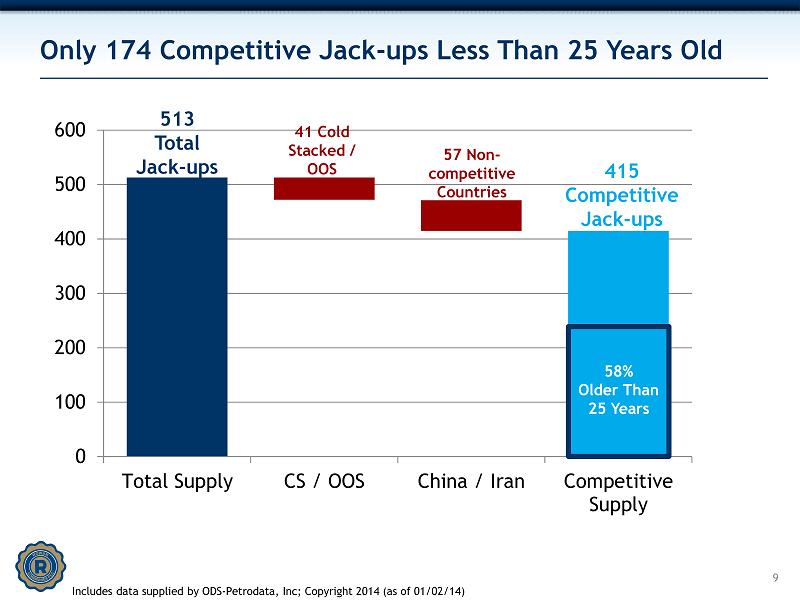
Only 174 Competitive Jack - ups Less Than 25 Years Old 0 100 200 300 400 500 600 Total Supply CS / OOS China / Iran Competitive Supply 513 Total Jack - ups 41 Cold Stacked / OOS 57 Non - competitive Countries 415 Competitive Jack - ups 58% Older Than 25 Years 9 Includes data supplied by ODS - Petrodata, Inc; Copyright 2014 (as of 01/02/14)

Jack - up Market Bifurcation Continues In Improving Market 20 40 60 80 100 IS, MS, MC <300'IC 300'IC 350'+ IC(including High Spec) High Spec* Worldwide Utilization By Rig Class % * Excludes Chinese Rig, Master Driller 10 Includes data supplied by ODS - Petrodata, Inc; Copyright 2014 (as of 01/02/14)
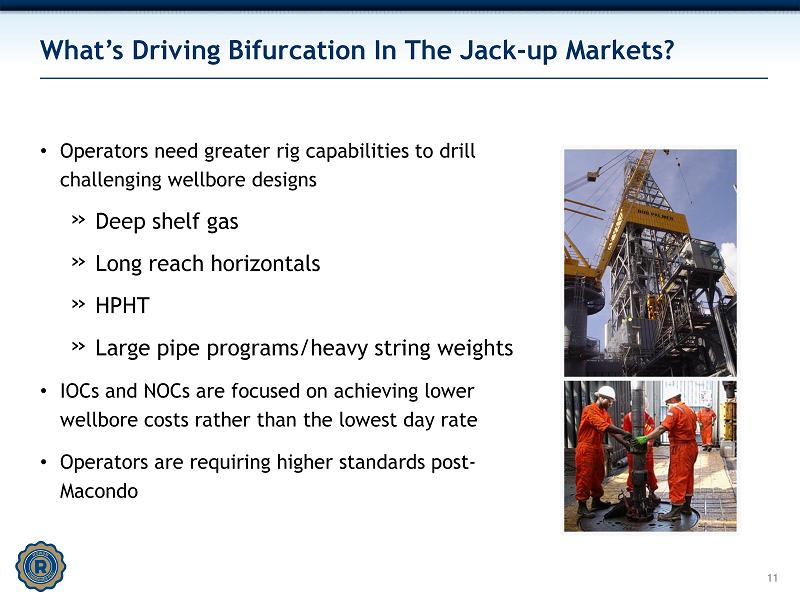
What’s Driving Bifurcation In The Jack - up Markets? • Operators need greater rig capabilities to drill challenging wellbore designs » Deep shelf gas » Long reach horizontals » HPHT » Large pipe programs/heavy string weights • IOCs and NOCs are focused on achieving lower wellbore costs rather than the lowest day rate • Operators are requiring higher standards post - Macondo 11

0 50 100 150 200 250 300 A Wave Of Jack - up Retirements Could Be Coming 12 World jack - up rig population over 40 years old is growing… # of jack - ups 40+ years JACK - UPS OVER 40+ YEARS IN 10 YEARS 294 26 JACK - UPS OVER 40+ YEARS TODAY Includes data supplied by ODS - Petrodata, Inc; Copyright 2014 (as of 01/02/14)
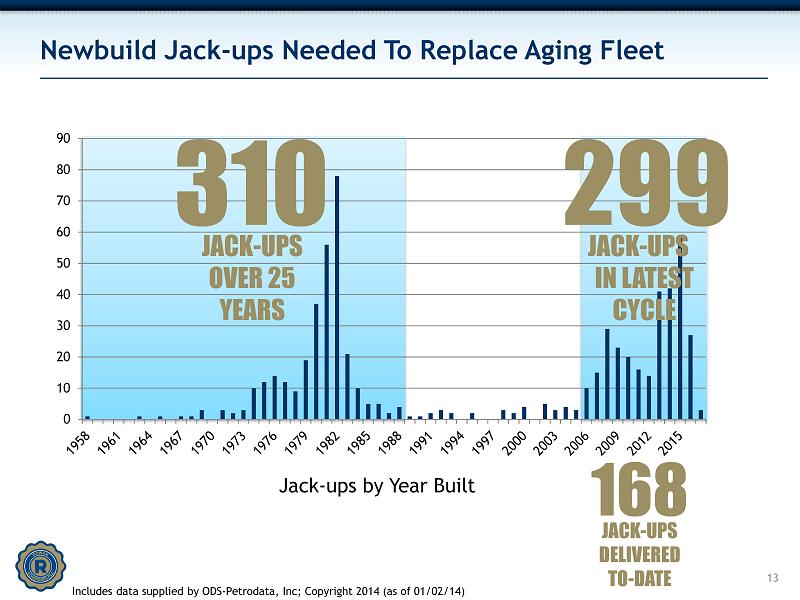
Newbuild Jack - ups Needed To Replace Aging Fleet 13 Jack - ups by Year Built JACK - UPS DELIVERED TO - DATE 168 0 10 20 30 40 50 60 70 80 90 310 JACK - UPS OVER 25 YEARS 299 JACK - UPS IN LATEST CYCLE Includes data supplied by ODS - Petrodata, Inc; Copyright 2014 (as of 01/02/14)
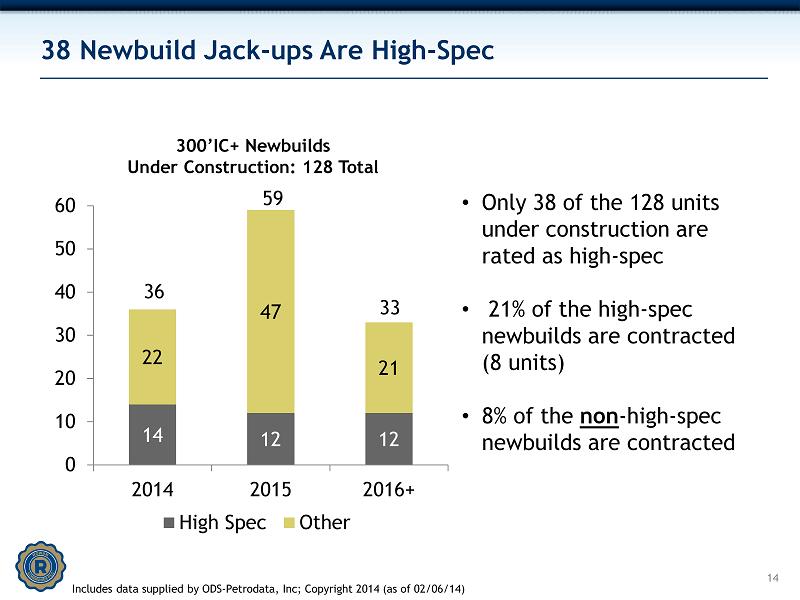
38 Newbuild Jack - ups Are High - Spec 14 14 12 12 22 47 21 0 10 20 30 40 50 60 2014 2015 2016+ High Spec Other 300’IC+ Newbuilds Under Construction: 128 Total 59 36 33 • Only 38 of the 128 units under construction are rated as high - spec • 21% of the high - spec newbuilds are contracted (8 units) • 8% of the non - high - spec newbuilds are contracted Includes data supplied by ODS - Petrodata, Inc; Copyright 2014 (as of 02/06/14)

0 100 200 300 400 2000 2001 2002 2003 2004 2005 2006 2007 2008 2009 2010 2011 2012 2013 High - Spec Rates Have Climbed Through Newbuild Cycle 15 $0 $50,000 $100,000 $150,000 $200,000 $250,000 Premium* High Spec Average Earned Day Rate Cumulative Jack - ups Delivered * Premium rigs defined as 350’IC+ (inclusive of high - spec jack - ups) 187 15 Includes data supplied by ODS - Petrodata, Inc; Copyright 2014 (as of 02/06/14)
Rowan Is Confident About 2014 Jack - up Fleet Rollovers • 19 of 30 Rowan jack - ups are scheduled to rollover in 2014 • 12 of the 19 jack - ups are high - spec rigs, and demand for high - spec equipment continues to be strong • Locations : Middle East (7 rigs), GOM (5 rigs), SEA (4 rigs), North Sea (2 rigs), and Med (1 rig) » All seven rigs scheduled to rollover in the Middle East are currently contracted with Saudi Aramco, and Saudi Aramco is expected to increase its jack - up fleet » Rowan jack - ups are expected to roll to higher day rates in 2014 16
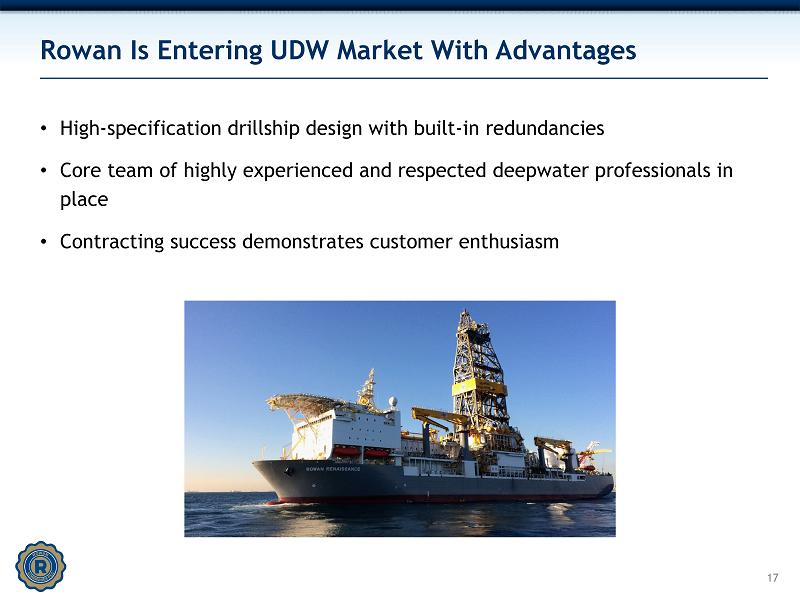
Rowan Is Entering UDW Market With Advantages • High - specification drillship design with built - in redundancies • Core team of highly experienced and respected deepwater professionals in place • Contracting success demonstrates customer enthusiasm 17

Rowan UDW Construction Program Progressing • Delivered first UDW rig, Rowan Renaissance , in January 2014 » Despite supplier delays, still targeting on rate April 2014 • UDW man power ramp up progressing as planned • Construction on schedule for next three drillships: Rowan Resolute , Rowan Reliance and Rowan Relentless 18

3 of 4 UDW Drillships Contracted 19 Delivered January 2014 2013 2014 2015 3 Year Contract Commences April 2014 Rowan Renaissance 1 Delivery June 2014 2 Rowan Resolute Delivery October 2014 3 Rowan Reliance Delivery March 2015 4 Rowan Relentless 3 Year Contract Commences September 2014 3 Year Contract Commences January 2015
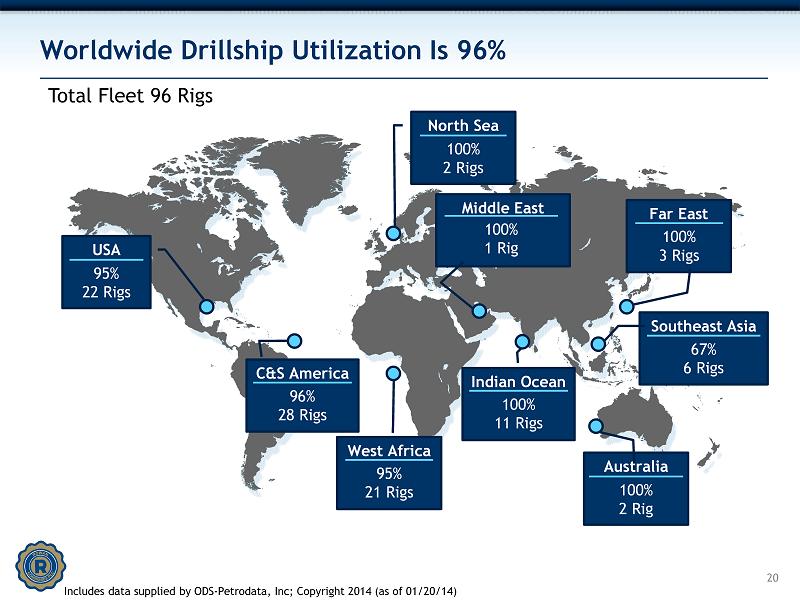
Worldwide Drillship Utilization I s 96% 20 20 USA Indian Ocean North Sea Middle East Far East Southeast Asia C&S America West Africa Australia 95% 22 Rigs 96% 28 Rigs 95% 21 Rigs 100% 11 Rigs 100% 2 Rig 67% 6 Rigs 100% 3 Rigs 100% 1 Rig 100% 2 Rigs Includes data supplied by ODS - Petrodata, Inc; Copyright 2014 (as of 01/20/14) Total Fleet 96 Rigs
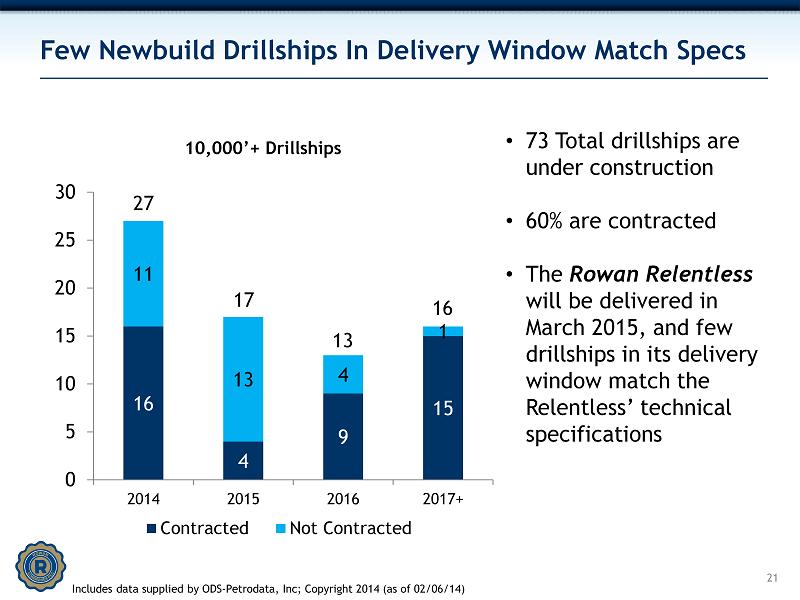
Few Newbuild Drillships In Delivery Window Match Specs 21 16 4 9 15 11 13 4 1 0 5 10 15 20 25 30 2014 2015 2016 2017+ Contracted Not Contracted 10,000’+ Drillships 17 27 • 73 Total drillships are under construction • 60% are contracted • The Rowan Relentless will be delivered in March 2015, and few drillships in its delivery window match the Relentless’ technical specifications 13 Includes data supplied by ODS - Petrodata, Inc; Copyright 2014 (as of 02/06/14) 16

Floater Market Bifurcating At A Fast Pace 50 60 70 80 90 100 <5,000' 5,000'-7,499' 7,500'-9,999' 10,000'+ % Worldwide Utilization by Water Depth 22 Floater Market includes drillships and semis. D ata supplied by ODS - Petrodata, Inc; Copyright 2014 (as of 01/02/14)

$300,000 $350,000 $400,000 $450,000 $500,000 $550,000 $600,000 $650,000 $700,000 UDW Day Rates Remain at $550K Or Above 23 $619K $608K $602K Rowan Industry Includes data supplied by ODS - Petrodata, Inc; Copyright 2014 (as of 01/20/14) (1) (1) $461K Transocean 5 th Gen rig contracted for eight months in Nigeria for Shell.
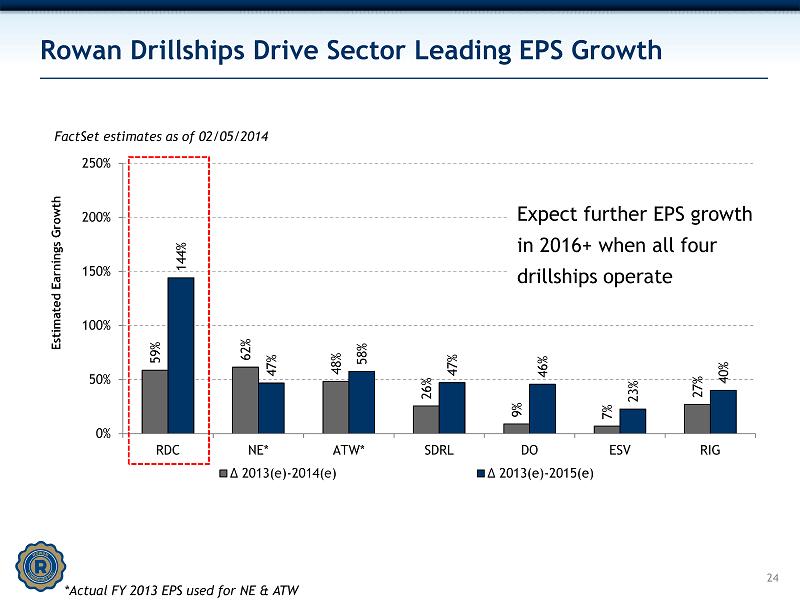
59% 62% 48% 26% 9% 7% 27% 144% 47% 58% 47% 46% 23% 40% 0% 50% 100% 150% 200% 250% RDC NE* ATW* SDRL DO ESV RIG Estimated Earnings Growth Δ 2013( e) - 2014(e) Δ 2013( e) - 2015(e) FactSet e stimates as of 02/05/2014 Rowan Drillships Drive Sector Leading EPS Growth 24 Expect further EPS growth in 2016+ when all four drillships operate *Actual FY 2013 EPS used for NE & ATW

25 Earnings Growth Not Reflected In 2015 Multiples As of April 12, 2012 Aggregate Value Price to Share Price to Earnings to EBITDA Book Price 2012 2013 2014 2012 2013 2014 Value ($) (x) (x) (x) (x) (x) (x) Seadrill 50.27 16.7x 10.5x 8.9x 7.4x 6.1x 5.7x 1.1x Transocean 37.27 11.9x 11.0x 9.8x 10.5x 9.6x 8.4x 2.8x ENSCO 66.02 15.6x 12.9x 10.7x 8.1x 7.0x 6.2x 2.1x Noble 36.53 12.3x 8.7x 6.9x 7.5x 5.9x 5.4x 1.1x Diamond Offshore 53.53 9.7x 8.0x 7.2x 7.7x 6.6x 6.3x 1.1x Rowan 33.99 12.8x 8.8x 7.0x 8.0x 6.0x 5.0x 1.0x Atwood Oceanics 44.03 10.6x 8.5x 7.1x 8.3x 6.4x 5.0x 1.7x Mean 12.8x 9.8x 8.2x 8.2x 6.8x 6.0x 1.6x Median 12.3x 8.8x 7.2x 8.0x 6.4x 5.7x 1.1x As of February 5, 2014 Aggregate Value Price to Share Price to Earnings to EBITDA Book Price 2013 2014 2015 2013 2014 2015 Value ($) (x) (x) (x) (x) (x) (x) $35.49 12.5x 10.0x 8.6x 10.7x 8.7x 7.5x 2.1x $41.61 10.0x 8.0x 7.2x 6.3x 5.4x 5.1x 0.9x $48.58 7.8x 7.3x 6.4x 6.6x 6.1x 5.4x 0.9x $30.49 10.6x 8.3x 6.6x 7.0x 5.7x 4.8x 0.9x $46.51 10.2x 9.5x 7.1x 5.5x 4.7x 3.6x 1.4x $31.35 16.0x 10.1x 6.5x 8.2x 6.1x 4.4x 0.8x $45.35 8.3x 7.1x 5.7x 7.2x 6.0x 4.8x 1.3x 10.8x 8.6x 6.9x 7.4x 6.1x 5.1x 1.2x 10.2x 8.3x 6.6x 7.0x 6.0x 4.8x 0.9x Source: Thomson Financial

1.89% 1.65% 3.27% 2.47% 1.37% 0.80% 0.74% 1.32% Rowan Is Focused On Execution - Increasing on Rate Time 11% 11% 14% 10% 9% 8% 13% 10% 11% 9% 5% 5% Out of Service Operational Downtime Includes shipyard, transit and inspection days when: Rigs are on contract and available to earn day rate, but off rate due to operational issues. Rig is mobilizing or undergoing modifications between contracts and often compensated, but revenue is deferred. Rig is undergoing inspections, refurbishments, upgrades and generally not compensated. — — 8 % Est. 10% 12% 26

Rowan Newbuild Drillship Program Fully Financed (in millions) Projected 12/31/2013 Projected 12/31/2014 Cash and available credit $1,843 $1,142 Total Debt $2,009 $2,808 Total Debt - to - Cap 29% 35% Net Debt - to - Cap 16% 34% 27 Investment Grade Balance Sheet (Baa3/BBB - ) Rowan Newbuild Capex With Four Drillships $455 MM 2014 2015 $1,522 MM In January 2014 Rowan completed an $800 million public debt offering and increased its revolver to $1 billion (1) (1) Projected 12/31/2014 reflects increase in revolving credit facility from $750 million to $1 billion, currently undrawn.
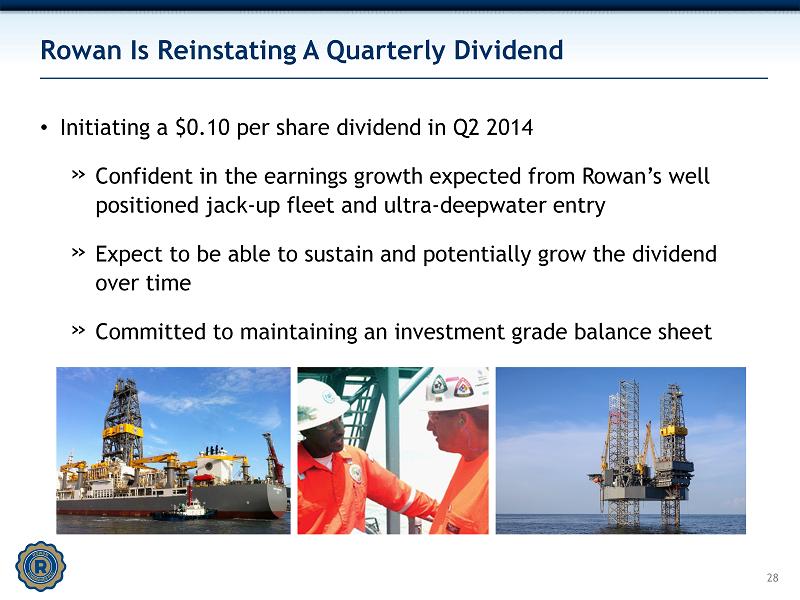
Rowan Is Reinstating A Quarterly Dividend • Initiating a $0.10 per share dividend in Q2 2014 » Confident in the earnings growth expected from Rowan’s well positioned jack - up fleet and ultra - deepwater entry » Expect to be able to sustain and potentially grow the dividend over time » Committed to maintaining an investment grade balance sheet 28

29 Rowan is One Team built around great equipment, great people, and a shared set of values and purpose.

Appendix 30
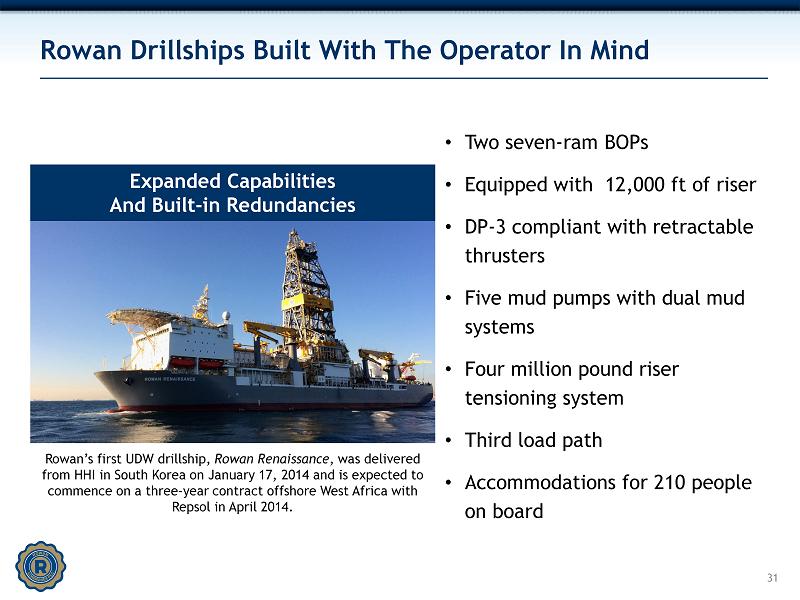
Rowan Drillships Built With The Operator In Mind • Two seven - ram BOPs • Equipped with 12,000 ft of riser • DP - 3 compliant with retractable thrusters • Five mud pumps with dual mud systems • Four million pound riser tensioning system • Third load path • Accommodations for 210 people on board 31 Expanded Capabilities And Built - in Redundancies Rowan’s first UDW drillship, Rowan Renaissance , was delivered from HHI in South Korea on January 17, 2014 and is expected to commence on a three - year contract offshore West Africa with Repsol in April 2014.

2013 Operating Cost Components 52% 11% 18% 4% 3% 3% 9% Labor & Fringes Employee-related * R&M Insurance Rig moves Rebillables All other ** 32 * Employee - related costs include training, catering and crew transportation ** Other includes rentals, medics, agent commissions, satellite communications and other misc. drilling costs
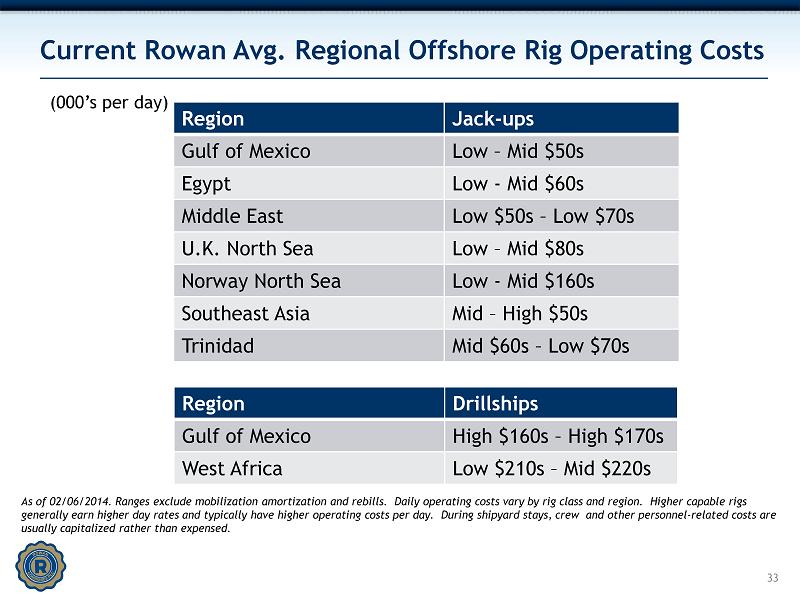
Current Rowan Avg. Regional Offshore Rig Operating Costs 33 Region Jack - ups Gulf of Mexico Low – Mid $50s Egypt Low - Mid $60s Middle East Low $50s – Low $70s U.K. North Sea Low – Mid $80s Norway North Sea Low - Mid $160s Southeast Asia Mid – High $50s Trinidad Mid $60s – Low $70s (000’s per day) As of 02/06/2014. Ranges exclude mobilization amortization and rebills. Daily operating costs vary by rig class and region. Hi gher capable rigs generally earn higher day rates and typically have higher operating costs per day. During shipyard stays, crew and other pe rso nnel - related costs are usually capitalized rather than expensed. Region Drillships Gulf of Mexico High $160s – High $170s West Africa Low $210s – Mid $220s

Glossary of Terms Blowout Preventer (BOP): An emergency shut - off device comprised of a series, or “stack”, of valves that shut the wellbore in the event that hydrocarbons enter the wellbore and pressure containment is compromised. The BOP is intended to serve as a pressure control system of last resort. Cold - stacked Rig: An offshore rig that is not actively marketed and is completely down - manned. Cold stacked rigs generally require significant time and capital expenditures to reactivate. Day rate Contract : A contractual agreement where a drilling contractor is paid a daily rate. Customer carries majority of the operating risk so long as the drilling contractor meets the basic standards of equipment and personnel specified by the contract. Estimated Planned Off Rate Time : Defined by Rowan as those days where a rig will not be available to earn any revenue due to shipyard, transit, inspection periods, or suspension of operations. High - specification Rig : Defined by Rowan as rigs with a two million pound or greater hook - load capacity. Hook - load: A commonly used metric to define the lifting capacity of a rigs drawworks and derrick system. Operational Downtime : When a rig is under contract and unable to conduct planned operations due to equipment breakdowns or procedural failures. Operational downtime will result in a related revenue reduction. The company expects operational downtime to account for approximately 2.5% of in - service days. Out of Service Days: I nclude days for which no revenues are recognized other than operational downtime and stacked days (cold - stacked days or off rate between contracts). The company may be compensated for certain out - of service days, such as for shipyard stays or for transit periods preceding a contract ; however recognition of any such compensation received is deferred and recognized over the period of drilling operations. Utilization : A rate that specifies the percentage of time that a rig (or fleet of rigs) earned day rate in a specified period. 34

Investor Contact: Suzanne M. Spera Director, Investor Relations sspera@rowancompanies.com 713.960.7517 Rowan Companies 2800 Post Oak Blvd. Suite 5450 Houston, TX 77056 713.621.7800 www.rowancompanies.com