Attached files
| file | filename |
|---|---|
| EX-32.2 - EXHIBIT 32.2 - ROWAN COMPANIES PLC | rdc-12312016x10kexhibit322.htm |
| EX-32.1 - EXHIBIT 32.1 - ROWAN COMPANIES PLC | rdc-12312016x10kexhibit321.htm |
| EX-31.2 - EXHIBIT 31.2 - ROWAN COMPANIES PLC | rdc-12312016x10kexhibit312.htm |
| EX-31.1 - EXHIBIT 31.1 - ROWAN COMPANIES PLC | rdc-12312016x10kexhibit311.htm |
| EX-24 - EXHIBIT 24 - ROWAN COMPANIES PLC | rdc-12312016x10kexhibit24.htm |
| EX-23 - EXHIBIT 23 - ROWAN COMPANIES PLC | rdc-12312016x10kexhibit23.htm |
| EX-21 - EXHIBIT 21 - ROWAN COMPANIES PLC | rdc-12312016x10kexhibit21.htm |
| EX-10.38 - EXHIBIT 10.38 - ROWAN COMPANIES PLC | rdc-12312016x10kexhibit1038.htm |
| EX-10.34 - EXHIBIT 10.34 - ROWAN COMPANIES PLC | rdc-12312016x10kexhibit1034.htm |
| EX-10.7 - EXHIBIT 10.7 - ROWAN COMPANIES PLC | rdc-12312016x10kexhibit107.htm |
| EX-2.2 - EXHIBIT 2.2 - ROWAN COMPANIES PLC | rdc-12312016x10kexhibit22.htm |
| EX-2.1 - EXHIBIT 2.1 - ROWAN COMPANIES PLC | rdc-12312016x10kex21.htm |
UNITED STATES SECURITIES AND EXCHANGE COMMISSION
Washington, D.C. 20549
FORM 10-K
þ | ANNUAL REPORT PURSUANT TO SECTION 13 OR 15(d) OF THE SECURITIES EXCHANGE ACT OF 1934 |
For the year ended December 31, 2016 | |
OR | |
¨ | TRANSITION REPORT PURSUANT TO SECTION 13 OR 15(d) OF THE SECURITIES EXCHANGE ACT OF 1934 |
For the transition period from __________ to __________ | |
Commission File Number: 1-5491
Rowan Companies plc
(Exact name of registrant as specified in its charter)
England and Wales | 98-1023315 |
(State or other jurisdiction of incorporation or organization) | (I.R.S. Employer Identification No.) |
2800 Post Oak Boulevard, Suite 5450
Houston, Texas 77056-6189
(Address of principal executive offices)
Registrant’s telephone number, including area code: (713) 621-7800
Securities registered pursuant to Section 12(b) of the Act:
Title of each class | Name of each exchange on which registered |
Class A ordinary shares, $0.125 par value | New York Stock Exchange |
Securities registered pursuant to Section 12(g) of the Act: None
Indicate by check mark if the registrant is a well-known seasoned issuer, as defined in Rule 405 of the Securities Act. Yes þ No ¨
Indicate by check mark if the registrant is not required to file reports pursuant to Section 13 or 15(d) of the Act. Yes ¨ No þ
Indicate by check mark whether the registrant (1) has filed all reports required to be filed by Section 13 or 15(d) of the Securities Exchange Act of 1934 during the preceding 12 months (or for such shorter period that the registrant was required to file such reports), and (2) has been subject to such filing requirements for the past 90 days. Yes þ No ¨
Indicate by check mark whether the registrant has submitted electronically and posted on its corporate website, if any, every Interactive Data File required to be submitted and posted pursuant to Rule 405 of Regulation S-T (§232.405 of this chapter) during the preceding 12 months (or for such shorter period that the registrant was required to submit and post such files). Yes þ No ¨
Indicate by check mark if disclosure of delinquent filers pursuant to Item 405 of Regulation S-K (§229.405 of this chapter) is not contained herein, and will not be contained, to the best of registrant’s knowledge, in definitive proxy or information statements incorporated by reference in Part III of this Form 10-K or any amendment to this Form 10-K. þ
Indicate by check mark whether the registrant is a large accelerated filer, an accelerated filer, a non-accelerated filer, or a smaller reporting company. See definitions of “large accelerated filer,” “accelerated filer” and “smaller reporting company” in Rule 12b-2 of the Exchange Act. Large accelerated filer þ Accelerated filer ¨ Non-accelerated filer ¨ Smaller reporting company ¨
Indicate by check mark whether the registrant is a shell company (as defined in Rule 12b-2 of the Exchange Act). Yes ¨ No þ
The aggregate market value of common equity held by non-affiliates of the registrant was approximately $2.2 billion as of June 30, 2016, based upon the closing price of the registrant’s ordinary shares on the New York Stock Exchange Composite Tape of $17.66 per share.
The number of Class A ordinary shares, $0.125 par value, outstanding at February 17, 2017, was 125,495,703, which excludes 2,479,014 shares held by an affiliated employee benefit trust.
DOCUMENTS INCORPORATED BY REFERENCE
Document | Part of Form 10-K |
Portions of the Proxy Statement for the 2017 Annual General Meeting of Shareholders | Part III, Items 10-14 |
Page | |
FORWARD-LOOKING STATEMENTS
Statements contained in this report, including in the documents incorporated by reference herein, that are not historical facts are forward-looking statements within the meaning of Section 27A of the Securities Act of 1933 and Section 21E of the Securities Exchange Act of 1934. Forward-looking statements include words or phrases such as “anticipate,” “believe,” “estimate,” “expect,” “intend,” “plan,” “project,” “could,” “may,” “might,” “should,” “will,” “forecast,” “potential,” “outlook,” “scheduled,” “predict,” “will be,” “will continue,” “will likely result,” and similar words and specifically include statements regarding expected financial and operating performance; dividend payments; share repurchases or repayment of debt; business strategies; expected utilization, day rates, revenues, operating expenses, contract terms, contract backlog and fleet status; benefits of our joint venture with Saudi Aramco; capital expenditures; tax rates and positions; impairments; insurance coverages; access to financing and funding sources, including borrowings under our credit facility; the availability, delivery, mobilization, contract commencement, relocation or other movement of rigs and the timing thereof; construction, enhancement, upgrade or repair and costs and timing thereof; the suitability of rigs for future contracts; general market, business and industry conditions, trends and outlook; rig demand; future operations; the impact of increasing regulatory requirements; divestiture of selected assets; expense management; the likely outcome of legal proceedings the impact of competition and consolidation in the industry; the timing of acquisitions, dispositions and other business transactions; customer financial position; and commodity prices. Such statements are subject to numerous risks, uncertainties and assumptions that may cause actual results to vary materially from those indicated, including:
• | prices of oil and natural gas and industry expectations about future prices and impacts of regional or global financial or economic downturns; |
• | changes in the offshore drilling market, including fluctuations in worldwide rig supply and demand, competition or technology, including as a result of delivery of newbuild drilling units; |
• | variable levels of drilling activity and expenditures in the energy industry, whether as a result of actions by OPEC, global capital markets and liquidity, prices of oil and natural gas or otherwise, which may result in decreased demand and/or cause us to idle or stack, sell or scrap additional rigs; |
• | possible termination, suspension, renegotiation or cancellation of drilling contracts (with or without cause) as a result of general and industry economic conditions, distressed financial condition of our customers, force majeure, mechanical difficulties, delays, labor disturbances, strikes, performance or other reasons; payment or operational delays by our customers; or restructuring or insolvency of significant customers; |
• | changes or delays in actual contract commencement dates, contract option exercises, contract revenues and contract awards; |
• | our ability to enter into, and the terms of, future drilling contracts for drilling units whose contracts are expiring and drilling units currently idled or stacked; |
• | downtime, lost revenue and other risks associated with drilling operations, operating hazards, or rig relocations and transportation, including rig or equipment failure, collisions, damage and other unplanned repairs, the availability of transport vessels, hazards, self-imposed drilling limitations and other delays due to weather conditions, work stoppages or otherwise, and the availability or high cost of insurance coverage for certain offshore perils or associated removal of wreckage or debris and other losses; |
• | regulatory, legislative or permitting requirements affecting drilling operations and other compliance obligations in the areas in which our rigs operate; |
• | tax matters, including our effective tax rates, tax positions, results of audits, tax disputes, changes in tax laws, treaties and regulations, tax assessments and liabilities for taxes; |
• | our ability to realize the expected benefits of our joint venture with Saudi Aramco, and increased risks of concentrated operations in the Middle East; |
• | access to spare parts, equipment and personnel to maintain, upgrade and service our fleet; |
• | potential cost overruns and other risks inherent to repair, inspections or upgrade of drilling units, unexpected delays in rig and equipment delivery and engineering or design issues, delays in acceptance by our customers, or delays in the dates our drilling units will enter a shipyard, be transported and delivered, enter service or return to service; |
2
• | operating hazards, including environmental or other liabilities, risks, expenses or losses, whether related to well-control issues, collisions, groundings, blowouts, fires, explosions, weather or hurricane delays or damage, losses or liabilities (including wreckage or debris removal) or otherwise; |
• | our ability to retain highly skilled personnel on commercially reasonable terms, whether due to competition, cost cutting initiatives, labor regulations, unionization or otherwise; our ability to seek and receive visas for our personnel to work in our areas of operation in a timely manner; |
• | governmental action and political and economic uncertainties, including uncertainty or instability resulting from civil unrest, military or political demonstrations, acts of war, strikes, terrorism, piracy or outbreak or escalation of hostilities or other crises in areas in which we operate, which may result in expropriation, nationalization, confiscation or deprivation of assets, extended business interruptions, suspended operations, or suspension and/or termination of contracts and payment disputes based on force majeure events; |
• | cyber-breaches, outbreaks of any disease or epidemic and other related travel restrictions in any of our areas of operations; |
• | the outcome of legal proceedings, or other claims or contract disputes, including inability to collect receivables or resolve significant contractual or day rate disputes, any renegotiation, nullification, cancellation or breach of contracts with customers or other parties; |
• | potential for additional asset impairments; |
• | our liquidity, adequacy of cash flows to meet obligations, or our ability to access or obtain financing and other sources of capital, such as in the debt or equity capital markets; |
• | volatility in currency exchange rates and limitations on our ability to use or convert illiquid currencies; |
• | effects of accounting changes and adoption of accounting policies; |
• | potential unplanned expenditures and funding requirements, including investments in pension plans and other benefit plans; |
• | economic volatility and political, legal and tax uncertainties following the vote in the U.K. to exit the European Union (“Brexit”) and any subsequent referendum in Scotland to seek independence from the U.K.; |
• | other important factors described from time to time in the reports filed by us with the Securities and Exchange Commission and the New York Stock Exchange. |
All forward-looking statements contained in this Form 10-K speak only as of the date of this document and are expressly qualified in their entirety by such factors. We undertake no obligation to update or revise publicly any revisions to any such forward-looking statements that may be made to reflect events or circumstances after the date of this Form 10-K, or to reflect the occurrence of unanticipated events, except as required by applicable law.
Other relevant factors are included in Item 1A, “Risk Factors,” of this Form 10-K.
3
PART I
ITEM 1. BUSINESS
Overview
Rowan Companies plc is a public limited company incorporated under the laws of England and Wales and listed on the New York Stock Exchange. The terms “Rowan,” “Rowan plc,” “Company,” “we,” “us” and “our” refer to Rowan plc and its consolidated subsidiaries, unless the context otherwise requires.
Rowan plc is a global provider of offshore contract drilling services to the international oil and gas industry, with a focus on high-specification and premium jack-up rigs and ultra-deepwater drillships. Our fleet currently consists of 29 mobile offshore drilling units, including 25 self-elevating jack-up rigs and four ultra-deepwater drillships. Our fleet operates worldwide, including the United States Gulf of Mexico (US GOM), the United Kingdom (U.K.) and Norwegian sectors of the North Sea, the Middle East and Trinidad.
As of February 14, 2017, the date of our most recent Fleet Status Report, two of our four drillships were under contract in the US GOM. Additionally, we had three jack-up rigs under contract in the North Sea, nine under contract in the Middle East, three under contract in Trinidad and two under contract in the US GOM. We had an additional six marketed jack-up rigs, two cold-stacked jack-up rigs and two marketed drillship without a contract.
We contract our drilling rigs, related equipment and work crews primarily on a “day rate” basis. Under day rate contracts, we generally receive a fixed amount per day for each day we are performing drilling or related services. In addition, our customers may pay all or a portion of the cost of moving our equipment and personnel to and from the well site. Contracts generally range in duration from one month to multiple years.
For information with respect to our revenues, operating income and assets by operating segment, and revenues and long-lived assets by geographic area, see Note 13 of Notes to Consolidated Financial Statements in Part II, Item 8 of this Form 10-K.
Drilling Fleet
We believe our high-specification and premium jack-up fleet and ultra-deepwater drillships are well positioned to serve the worldwide market for high-pressure/high-temperature (HPHT) wells, including those in demanding locations. As of February 14, 2017, our drilling fleet consists of the following:
• | Four ultra-deepwater drillships; |
• | Nineteen high-specification cantilever jack-up rigs; and |
• | Six premium cantilever jack-up rigs. |
We use the term “high-specification” to describe jack-ups with a hook-load capacity of at least two million pounds and the term “premium” to denote independent-leg cantilever jack-ups that can operate in at least 300 feet of water in benign environments.
Ultra-Deepwater Drillships – Our ultra-deepwater drillships are self-propelled vessels equipped with computer-controlled dynamic-positioning systems, which allow them to maintain position without anchors through the use of their onboard propulsion and station-keeping systems. Drillships have greater variable loading capacity than semisubmersible rigs, enabling them to carry more supplies on board and, thus, making them better suited for drilling in deep water in remote locations. Our drillships are equipped with two drilling stations within a single derrick allowing the drillships to perform preparatory activities off-line and potentially simultaneous drilling tasks during certain stages of drilling, subject to legal restrictions in various jurisdictions, enabling increased drilling efficiency particularly during the initial stages of a well. In addition, our drillships are equipped to drill in 12,000-foot water depths, are equipped with 2,500,000 pound hook-load capability, and are capable of drilling HPHT wells to 40,000-foot depths. Each is equipped with two fully redundant blowout preventers, which significantly reduce non-productive time associated with repair and maintenance. In addition, each drillship is equipped with an active-heave crane for simultaneous deployment of subsea equipment. The sum total of these and other advanced features make the drillships very attractive to our customers.
High-Specification and Premium Jack-up Rigs – Our jack-ups are capable of drilling wells to maximum depths ranging from 25,000 to 40,000 feet and in maximum water depths ranging from 300 to 550 feet, depending on rig size, location and outfitting. All of our high-specification rigs are equipped with the high pressure circulation and pressure control equipment that are necessary for HPHT operations. Each of our jack-ups is designed with a hull that is fully equipped to serve as a drilling platform supported by three independently elevating legs. The rig is towed to the drilling site where the legs are lowered into and penetrate the ocean
4
floor, and the hull raises itself out of the water up to the elevation required to drill the well using a self-contained rack and pinion system.
Our three N-Class rigs are capable of drilling in water depths to 435 feet in harsh environments such as the North Sea depending on location and outfitting. The N-Class rigs, which were designed for operation in the highly regulated Norwegian sector of the North Sea, can be equipped to perform drilling and production operations simultaneously. Our first N-Class rig, the Rowan Viking, was delivered in 2010, and the Rowan Stavanger and Rowan Norway were delivered in 2011.
Our four EXL class rigs enable HPHT drilling in water depths up to 350 feet and are equipped with a hook-load capacity of two million pounds. The first three EXL class rigs were delivered in 2010, and the Rowan EXL IV was delivered in 2011.
Our three 240C class rigs were designed for HPHT drilling in water depths up to 400 feet in benign environments and are equipped with a hook-load capacity of 2.5 million pounds. The Rowan Mississippi and the Ralph Coffman were added to the fleet in 2008 and 2009, respectively, and the Joe Douglas was added to the fleet in 2012.
Three of our four Super Gorilla class rigs were delivered during the period from 1998 to 2001 and can be equipped for simultaneous drilling and production operations. They can operate year-round in 400 feet of water in harsh environments such as the North Sea. The Bob Palmer, our fourth Super Gorilla class rig delivered in 2003, is an enhanced version of the Super Gorilla class jack-up designated a Super Gorilla XL. With 713 feet of leg, 139 feet more than the Super Gorillas, and 30 percent larger spud cans, the Bob Palmer can operate in water depths to 550 feet in normally benign environments like the US GOM and the Middle East or in water depths to 400 feet in hostile environments such as the North Sea.
Our four Tarzan Class rigs were delivered during the period from 2004 to 2008 and are specifically designed for deep-well, HPHT drilling in up to 300 feet of water in benign environments.
Our Rowan Gorilla class rig, the Rowan Gorilla IV, was designed in the mid 1980s as a heavier-duty class of jack-up rig and is capable of operating in water depths to 450 feet in benign environments.
In 2016, we sold two of our older rigs in our jack-up fleet, the Rowan Gorilla II in November and the Rowan Gorilla III in December. The units were sold under agreements that prohibit their future use as drilling units.
See Item 2, “Properties,” for additional information regarding our fleet.
Our operations are subject to many uncertainties and hazards. See Item 1A, “Risk Factors,” for additional information.
Joint Venture
On November 21, 2016, Rowan and the Saudi Arabian Oil Company (“Saudi Aramco”), through their subsidiaries, entered into a Shareholders’ Agreement to create a 50/50 joint venture to own, manage and operate offshore drilling units in Saudi Arabia. The new entity is anticipated to commence operations in the second quarter of 2017.
At formation of the new company, each of Rowan and Saudi Aramco will contribute $25 million to be used for working capital needs. The Asset Contribution and Transfer Agreements provide that at commencement of operations, Rowan will contribute three rigs and its local shore based operations, and Saudi Aramco will contribute two rigs and cash to maintain equal equity ownership in the new company. Rowan will then contribute two more rigs in late 2018 when those rigs complete their current contracts, and Saudi Aramco will make a matching cash contribution at that time. At the various asset contribution dates, excess cash is expected to be distributed in equal parts to the shareholders. Rigs contributed will receive contracts for an aggregate 15 years, renewed and re-priced every three years, provided that the rigs meet the technical and operational requirements of Saudi Aramco.
Rowan rigs in Saudi Arabia not selected for contribution will be managed by the new company until the end of their current contracts pursuant to a management services agreement that provides for a management fee equal to a percentage of revenue to cover overhead costs. After the management period ends, such rigs may be selected for contribution, lease, or they will be required to relocate outside of the Kingdom.
Each of Rowan and Saudi Aramco will be obligated to fund their portion of the purchase of up to 20 new build jack-up rigs ratably over 10 years. The first rig is expected to be delivered as early as 2021. The partners intend that the newbuild jack-up rigs will be financed out of available cash from operations and/or funds available from third party debt financing. Saudi Aramco as a customer will provide drilling contracts to support the new company in the acquisition of the new rigs. If cash from operations or financing is not available to fund the cost of the newbuild jack-up rig, each partner is obligated to contribute funds to purchase such rigs, up to a maximum amount of $1.25 billion per partner in the aggregate for all 20 newbuild jack-up rigs.
5
Contracts
Our drilling contracts generally provide for a fixed amount of compensation per day (day rate), and are either “well-to-well,” “multiple-well” or "fixed-term" generally ranging from one month to several years. Well-to-well contracts are typically cancellable by either party upon completion of drilling. Fixed-term contracts usually contain a termination provision such that either party may terminate if drilling operations are suspended for extended periods as a result of events of force majeure. While many fixed-term contracts are for relatively short periods of three months or less, many others are for one or more years, and all can continue for periods longer than the original terms. Well-to-well contracts can be extended over multiple series of wells. Many drilling contracts contain renewal or extension provisions exercisable at the option of the customer at mutually agreeable rates. Many of our drilling contracts provide for separate lump-sum payments for rig mobilization and demobilization. We recognize lump-sum fees and related expenses over the primary contract term. We recognize reimbursement of certain costs as revenues and expenses at the time they are incurred. Our contracts for work generally provide for payment in United States (U.S.) dollars except for amounts required by applicable law to be paid in the local currency or amounts required to meet local expenses.
A number of factors affect our ability to obtain contracts at profitable rates within a given region. Such factors, which are discussed further under “Competition” and in “Risk Factors” include the global economic climate, the price of oil and gas which can affect our customers' drilling budgets, over- or under-supply of drilling units, location and availability of competitive equipment, the suitability of equipment for the project, comparative operating cost of the equipment, competence of drilling personnel and other competitive factors. Profitability may also depend on receiving adequate compensation for the cost of moving equipment to drilling locations.
During periods of weak demand and declining day rates, we have historically entered into contracts at lower rates in order to keep our rigs working. At times, however, market conditions have forced us to "warm-stack" rigs to reduce costs during extended periods between contracts. We currently have two ultra-deepwater drillships and five jack-ups warm stacked. We have also cold stacked certain of our idle older rigs to reduce cost further and have ultimately sold five such rigs over the last two years, the Rowan Juneau, Rowan Alaska, Rowan Louisiana, Rowan Gorilla II and Rowan Gorilla III. All but the Rowan Louisiana were sold under agreements that prohibit their future use as drilling units.
Our contract backlog was estimated to be approximately $1.7 billion at February 14, 2017, down from approximately $3.6 billion at January 20, 2016. Backlog at February 14, 2017 does not account for anticipated changes to the Middle East fleet due to the formation of the 50/50 joint venture with Saudi Aramco expected to commence operations in second quarter 2017. See "Joint Venture" above and "Management’s Discussion and Analysis of Financial Condition and Results of Operations – Liquidity and Capital Resources" in Part II, Item 7 of this Form 10-K for further information with respect to our backlog.
Competition
The contract drilling industry is highly competitive, and success in obtaining contracts involves many factors, including supply and demand for drilling units, price, rig capability, operating and safety performance, and reputation.
In the jack-up drilling market, we compete with numerous offshore drilling contractors that together have 458 marketed jack-up rigs worldwide as of February 14, 2017, with an additional 103 units that are under construction or on order. (We define marketed rigs as all rigs that are not cold-stacked.) We estimate that 69 delivered and marketed jack-ups, or 15 percent of the world’s marketed jack-up fleet, are high-specification, including Rowan's 19 high-specification rigs. At February 14, 2017, there were 213 marketed floaters (drillships and semi-submersibles) worldwide, with an additional 48 units that are under construction or on order. We estimate that 100 of these floaters, or approximately 47 percent of the world’s marketed fleet, are capable of drilling in water depths of 10,000 feet or more, but only an estimated 32 floaters, or approximately 15 percent of the world's marketed fleet, have 2,500,000 pound hook-load capability and are equipped with dual blow-out preventers, which are key specifications valued by our customers.
A significant contributing factor to the softness in the offshore drilling market has been the influx of 231 newbuild jack-ups and 158 newbuild floaters delivered since early 2006. The addition of newbuild units, combined with numerous rigs having rolled off contracts in past months, has continued to increase competition, putting additional downward pressure on day rates and utilization. Of the approximately 103 jack-up rigs under construction worldwide scheduled for delivery through 2020 (33% of the currently utilized jack-up fleet of approximately 310 rigs), approximately 50 are considered high-specification (72% of the delivered high-specification fleet). Currently, there are approximately 77 competitive newbuild jack-up rigs scheduled for delivery during 2017, and only five have contracts. For the floater market there are approximately 48 floaters under construction worldwide for delivery through 2020 (32% of the currently utilized floater fleet of approximately 149 rigs). Following the negotiated delivery delays on several units into future years, there are approximately 30 competitive newbuild floaters scheduled for delivery during 2017, with 11 having contracts.
6
Based on the number of rigs as tabulated by IHS-Petrodata, we are the seventh largest offshore drilling contractor in the world and the fifth largest jack-up rig operator. Based on market capitalization, we are the fourth largest publically traded pure play offshore driller. Some of our competitors have greater financial and other resources and may be more able to make technological improvements to existing equipment or replace equipment that becomes obsolete. In addition, those contractors with larger and more diversified drilling fleets may be better positioned to withstand unfavorable market conditions.
We market our drilling services to present and potential customers, including large international energy companies, smaller independent energy companies and foreign government-owned or government-controlled energy companies. See “Management’s Discussion and Analysis of Financial Condition and Results of Operations” in Part II, Item 7 of this Form 10-K for a discussion of current and anticipated industry conditions and their impact on our operations.
Governmental Regulation
Many aspects of our operations are subject to governmental regulation, including those relating to environmental protection and pollution control. In addition, governmental regulations concerning licensing and permitting, equipment specifications, training requirements or other matters could increase the costs of our operations and could reduce exploration activity in the areas in which we operate.
We could become liable for damages resulting from pollution which could materially affect our financial position, operations and liquidity. Generally we are indemnified under our drilling contracts for pollution, well damage and environmental damage, except in certain cases of pollution emanating above the surface from our drilling rigs. This indemnity includes costs associated with regaining control of a wild well, removal and disposal of pollutants, environmental remediation and claims by third parties for damages. However, such contractual indemnification provisions may not adequately protect us for several reasons such as (i) the contractual indemnity provisions may require us to assume some of the liability; (ii) our customers may not have the financial resources necessary to honor the contractual indemnity provisions; or (iii) the contractual indemnity provisions may be unenforceable under applicable law.
Our customers often require us to assume responsibility for pollution damages when we are at fault. We seek to limit our liability exposure to a non-material amount, or an amount within the limits of our available insurance coverage. For example, a contract may provide that we will assume the first $5 million of costs related to an incident resulting in wellbore pollution due to our negligence, with the customer assuming responsibility for all costs in excess of $5 million. We can provide no assurance that we will be able to negotiate indemnities and/or limitation of liability provisions or that such indemnification and/or limitation of liability provisions can be enforced or will be sufficient. Our customers may challenge the validity or enforceability of the indemnity provision for several reasons, including but not limited to applicable law, judicial decisions, the language of the indemnity provision, reasons of public policy, degree of fault and/or the circumstances resulting in the pollution.
In the event of an incident resulting in wellbore pollution where we are liable for all or a portion of such event, the impact on our financial position, operations and liquidity would depend on the scope of the incident. In this instance, we would seek to enforce our legal rights, including the enforcement of the indemnity obligation and redress from all parties at fault. In addition, we maintain limited insurance for liability related to negative environmental impacts of a sudden and accidental pollution event, as described below. Such an event would adversely affect our results of operations, financial position and cash flows if both insurance and indemnity protection were unavailable or insufficient and the incident was significant.
The U.S., U.K. and other other jurisdictions in which we operate have various regulations and requirements with which we must comply. For example, pursuant to the Clean Water Act, a National Pollutant Discharge Elimination Permit (NPDES permit) is required for discharges into the US GOM. The permit holder is the designated responsible party for any environmental impacts that occur in the event of the discharge of any unpermitted substance, including a fuel spill or oil leak from an offshore installation such as a mobile drilling unit. We operate in accordance with NPDES permit standards regardless of the holder.
Pursuant to the U.K. Offshore Directive, we are required to have an approved Oil Pollution Emergency Plan (OPEP) for each drilling unit operating in U.K. waters. The Offshore Directive also specifies additional regulations related to safety, licensing, environmental protection, emergency response and liability with which we comply.
Additionally, pursuant to the International Maritime Organization (IMO), we are required to have a Shipboard Oil Pollution Emergency Plan (SOPEP) for each of our drilling units. Our SOPEP establishes detailed procedures for rapid and effective response to spill events that may occur as a result of our operations or those of the operator. This plan is reviewed annually and updated as necessary. Onboard drills are conducted periodically to maintain effectiveness of the plan, and each rig is outfitted with equipment to respond to minor spills. For operations in the U.S., our SOPEPs are subject to review and approval by various organizations including the United States Coast Guard, the EPA and the Bureau of Safety and Environmental Enforcement (BSEE), and are recertified every five years by the American Bureau of Shipping, a Recognized Organization under the IMO.
7
As the designated responsible party, an operator has the primary responsibility for spill response, including having contractual arrangements in place with emergency spill response organizations to supplement any onboard spill response equipment. Pursuant to our SOPEPs, we have certain resources and supplies onboard our drilling units to mitigate the impact of an incident until an emergency spill response organization can deploy its resources. However, we also have an agreement with an emergency spill response organization should we have an incident that exceeds the scope of our onboard spill response equipment. Our primary spill response provider in the U.S. has been in business since 1994 and specializes in helping industries prevent and clean up oil and other hydrocarbon spills. Our provider has represented it holds all necessary licenses, certifications and permits to respond to environmental emergencies in the US GOM and maintains contacts with other response resources and organizations outside the US GOM. We believe we have adequate equipment and third-party resources available to us to respond to an emergency spill; however, we can provide no assurance that adequate resources will be available.
We are actively involved in various industry-led initiatives and work groups, including but not limited to those of the American Petroleum Institute, the International Association of Drilling Contractors, the Ocean Energy Safety Institute, and the British Rig Owners Association, which are intended to improve safety and protection of the environment.
Oil and gas operations in the US GOM and in many of the other jurisdictions in which we operate are subject to regulation with respect to well design, casing and cementing and well control procedures, as well as rules requiring operators to systematically identify risks and establish safeguards against those risks through a comprehensive safety and environmental management system, or SEMS. Any serious oil and gas industry related event heightens governmental and environmental concerns and may lead to legislative proposals being introduced which may materially limit or prohibit offshore drilling in certain areas. New regulations continue to be implemented, including rules regarding drilling systems and equipment, such as blowout preventer and well-control systems and lifesaving systems, as well as rules regarding employee training, engaging personnel in safety management and requiring third-party audits of SEMS programs.
On July 28, 2016, BSEE published a final rule, Oil and Gas and Sulfur Operations in the Outer Continental Shelf-Blowout Preventer Systems and Well Control to implement recommendations of the Deepwater Horizon Commission. The new regulations took effect on July 28, 2016, with a number of requirements to be phased in over several years.
Regulatory compliance has and may continue to materially impact our capital expenditures and earnings, particularly in the event of an environmental incident. Given the state-of-the-art design of our drillships and high specification of our jack-up fleet, we believe we are well positioned competitively to our peers to be able to comply with current and future governmental regulations.
Insurance
We maintain insurance coverage for damage to our drilling rigs, third-party liability, workers’ compensation and employers’ liability, sudden and accidental pollution and other types of loss or damage. Our insurance coverage is subject to deductibles and self-insured retentions which must be met prior to any recovery. Additionally, our insurance is subject to exclusions and limitations, and we can provide no assurance that such coverage will adequately protect us against liability from all potential consequences and damages.
Our current insurance policies provide coverage for loss or damage to our fleet of drilling rigs on an agreed value basis (which varies by unit) subject to a deductible of either $25 million or $15 million per occurrence, depending on the unit's geographic location. This coverage does not include damage to our rigs arising from a US GOM named windstorm, for which we are self-insured.
We maintain insurance policies providing limited coverage for liability associated with negative environmental impacts of a sudden and accidental pollution event, third-party liability, employers’ liability (including Jones Act liability) and automobile liability, and these policies are subject to various exclusions, deductibles and underlying limits. In addition, we maintain excess liability coverage with an annual aggregate limit of $700 million subject to a self-insured retention of $10 million except for liabilities (including removal of wreck) arising out of a US GOM named windstorm, which are subject to a self-insured retention of $200 million.
Our rig physical damage and liability insurance renews each June. We can provide no assurance we will be able to secure coverage of a similar nature with similar limits at comparable costs.
Employees
At December 31, 2016, we had 2,917 employees worldwide, compared to 3,496 and 4,051 at December 31, 2015 and 2014, respectively, and 264 independent contractors. Certain of our employees and contractors in international markets, such as Trinidad and Norway, are represented by labor unions and work under collective bargaining or similar agreements, which are subject to periodic renegotiation. We consider relations with our employees to be satisfactory.
8
Customers
In 2016, Saudi Aramco, Freeport-McMoRan, Cobalt International, Repsol and ConocoPhillips accounted for 20%, 12%, 12%, 12% and 11%, respectively, of consolidated revenues. Saudi Aramco and ConocoPhillips revenue was derived from our jack-up segment, and Repsol and Cobalt International revenue, as well as nearly all of Freeport-McMoRan revenue, was derived from our deepwater segment.
Reports filed with or furnished to the SEC
Our Annual Reports on Form 10-K, Quarterly Reports on Form 10-Q, Current Reports on Form 8-K and amendments to those reports filed or furnished pursuant to Section 13(a) or 15(d) of the Securities Exchange Act of 1934 (the Exchange Act) are made available free of charge on our website at www.rowan.com as soon as reasonably practicable after we electronically file such material with, or furnish it to, the SEC. Information contained on or accessible from our website is not incorporated by reference into this Form 10-K and should not be considered a part of this report or any other filing that we make with the SEC.
ITEM 1A. RISK FACTORS
There are numerous factors that affect our business and operating results, many of which are beyond our control. The following is a description of significant factors that might cause our future operating results to differ materially from those currently expected. The risks described below are not the only risks facing our Company. Additional risks and uncertainties not specified herein, not currently known to us or currently deemed to be immaterial also may materially adversely affect our business, financial position, operating results and/or cash flows.
Our business depends on the level of activity in the offshore oil and gas industry, which is significantly affected by declines in oil or gas prices and reduced demand for oil and gas products.
Our business depends heavily on a variety of economic and political factors and the level of oil and gas activity worldwide. Sustained declines in oil or natural gas prices, combined with market expectations of a prolonged weakened global market, have caused oil and gas companies to significantly reduce their exploration, development and production activities, thereby decreasing demand for offshore drilling services and leading to lower rig utilization and day rates for our services. Oil and natural gas prices have historically been very volatile, and our drilling operations have in the past suffered through long periods of weak market conditions.
Demand for our drilling services depends on many factors beyond our control, including:
• | worldwide demand for and prices of oil and natural gas, and expectations regarding future energy prices; |
• | the supply of drilling units in the worldwide fleet versus demand; |
• | the level of exploration and development expenditures by energy companies and their ability to raise capital; |
• | the willingness and ability of the Organization of Petroleum Exporting Countries (OPEC) to limit production levels and influence prices; |
• | the level of production in non-OPEC countries; |
• | the effect of economic sanctions that affect the energy industry; |
• | the general economy, including inflation and changes in the rate of economic growth; |
• | the condition of global capital markets; |
• | adverse sea, weather and climate conditions in our principal operating areas, including possible disruption of exploration and development activities due to loop currents, hurricanes and other severe sea and weather conditions; |
• | the cost of exploring for, developing, producing and delivering oil and natural gas; |
• | environmental and other laws and regulations; |
• | policies of various governments regarding exploration and development of oil and natural gas reserves; |
• | nationalization of assets or workforce and/or confiscation of assets; |
• | worldwide tax policies and treaties; |
• | political and military conflicts in oil-producing areas and the effects of terrorism; |
9
• | increased supply of oil and gas from onshore development and relative cost of offshore drilling versus onshore oil and gas production; |
• | the development and exploitation of alternative fuels and energy sources, and |
• | merger, divestiture, restructuring and consolidation of our customers and competitors and their assets. |
Adverse developments affecting the industry as a result of one or more of these factors, including any further decline in oil or gas prices or the failure of oil or gas prices to increase, a global recession, continued declines in demand for oil and gas products, increased oversupply of drilling units, and increased regulation of drilling and production, would adversely affect our business, financial condition and results of operations.
The success of our business is dependent upon our ability to secure contracts for our drilling units at sufficient day rates. Depressed oil and gas prices and an oversupply of drilling units have led to further reductions in rig utilization and day rates, which may materially impact our profitability.
Our ability to meet our cash flow obligations depends on our ability to secure ongoing work for our drilling units at sufficient day rates. As of February 14, 2017, we had eight jack-up drilling units without contracts (including two cold-stacked); ten with contract terms ending in 2017; six with contract terms ending in 2018; and one with a contract term ending in 2024; and two of our four drillships without contracts; one of our drillships has a contract ending in 2017 and the other contract ends in early 2018. Given current market conditions future demand for offshore drilling units and day rates may continue to remain at low levels, possibly for an extended period of time. Failure to secure profitable contracts for our drilling units could negatively impact our operating results and financial position, impair our ability to generate sufficient cash flow to fund our capital expenditures and/or meet our other obligations.
Prior to the downturn in the drilling sector, the industry experienced a significant increase in construction activity. The resulting increase in supply of newbuild drilling units, combined with the decrease in demand for offshore drilling services, has led to an oversupply of drilling units and further declines in utilization and day rates that is expected to continue for some time. According to industry sources, there were 458 marketed jack-up rigs worldwide as of February 14, 2017, an additional 103 units that are under construction or on order and 213 marketed floaters (drillships and semi-submersible) worldwide, with an additional 48 units that are under construction or on order. (We define marketed rigs as all rigs that are not cold-stacked.) A continued decline in utilization and day rates would further impact our revenues and profitability.
A further decline in the market for contract drilling services could result in additional asset impairment charges.
We recognized asset impairment charges on our jack-up drilling units aggregating approximately $566 million in 2014, $330 million in 2015 and $34 million in 2016, or approximately 7%, 4% and 0.5%, respectively, of our fixed asset carrying values. Prolonged periods of low utilization and day rates, the cold-stacking of idle assets, or the sale of assets below their then carrying value could result in the recognition of additional impairment charges on our drilling units if future cash flow estimates, based upon information available to management at the time, indicate that their carrying value may not be recoverable. See “Impairment of Long-lived Assets” in Note 2 of Notes to Consolidated Financial Statements in Part II, Item 8 of this Form 10-K for additional information.
We are subject to operating risks that could result in environmental damage, property loss, personal injury, death, business interruptions and other losses.
Our drilling operations are subject to many operational hazards such as blowouts, explosions, fires, collisions, punch-throughs (i.e., when one leg of a jack-up rig breaks through the hard crust of the ocean floor, placing stress on the other legs), mechanical or technological failures, navigation errors, or equipment defects that could increase the likelihood of accidents. Accidents can result in:
• | serious damage to or destruction of property and equipment; |
• | personal injury or death; |
• | costly delays or cancellations of drilling operations; |
• | interruption or cessation of day rate revenue; |
• | uncompensated downtime; |
• | reduced day rates; |
• | significant impairment of producing wells, leased properties, pipelines or underground geological formations; |
10
• | damage to fisheries and pollution of the marine and coastal environment; and |
• | fines and penalties. |
Our drilling operations are also subject to marine hazards, whether at drilling sites or while equipment is under tow, such as a vessel capsizing, sinking, colliding or grounding. In addition, raising and lowering jack-up rigs and drilling into high-pressure formations are complex, hazardous activities, and we periodically encounter problems. Any ongoing change in weather or sea patterns or climate conditions could increase the adverse impact of marine hazards.
In past years, we have experienced some of the types of incidents described above, including punch-throughs and towing accidents resulting in lost or damaged equipment and high-pressure drilling accidents resulting in lost or damaged formations. Any future such events could result in operating losses and have a significant impact on our business.
The global nature of our operations involves additional risks, particularly in certain foreign jurisdictions.
Our operations are significantly diversified internationally. Foreign operations are often subject to additional political, economic and other uncertainties, such as with respect to taxation policies, customs restrictions, local content requirements, regulatory requirements, currency convertibility and repatriation, security threats including terrorism, piracy, and the risk of asset expropriation. Political unrest and regulatory restrictions could halt operations or impact us in other unforeseen ways.
Many countries have regulations or policies requiring or rewarding the participation of local companies and individuals in the petroleum-related activities. Such participation requirements can include, without limitation, the ownership of oil and gas concessions, the hiring of local agents and partners, the procurement of goods and services from local sources, and the employment of local workers. The requirements can also include co-ownership of our drilling units, in whole or in part, by home country companies or citizens and /or require reflagging of our drilling units under the flag of the home country. The governments of many of these foreign countries have become increasingly active in requiring higher levels of local participation which may increase our costs and risks of operating in these regions, thereby limiting our ability to enter into, relocate from, or compete in these regions.
In addition, our inability to obtain visas and work permits for our employees in foreign jurisdictions on a timely basis could delay or interrupt our operations resulting in an adverse impact on our business. Further, governmental restrictions in some jurisdictions may make it difficult for us to move our personnel, assets and operations in and out of these regions without delays or downtime.
In foreign areas where legal protections may be less available to us, we assume greater risk that our customer may terminate contracts without cause on short notice, contractually or by governmental action. Additionally, operations in certain areas, such as the North Sea and US GOM, are highly regulated and have higher compliance and operating costs in general.
Although we are a U.K. company, a significant majority of our revenues and expenses are transacted in U.S. dollars, which is our functional currency. However, in certain countries in which we operate, local laws or contracts may require us to receive some portion of payment in the local currency. We are exposed to foreign currency exchange risk to the extent the amount of our monetary assets denominated in the foreign currency differs from our obligations in that foreign currency. In order to mitigate the effect of exchange rate risk, we attempt to limit foreign currency holdings to the extent they are needed to pay liabilities denominated in the foreign currency. At December 31, 2016, we held Egyptian pounds in the amount of $5.1 million. We ceased drilling operations in Egypt in 2014, and are currently working to obtain access to the funds for use outside Egypt to the extent they are not utilized; however, we can provide no assurance we will be able to convert or utilize such funds in the future.
The offshore drilling industry is highly competitive and cyclical, with intense price competition.
The offshore contract drilling industry is a highly competitive and cyclical business characterized by numerous competitors, high capital and operating costs and evolving capability of newer rigs. Drilling contracts are often awarded on a competitive-bid basis, and intense price competition, rig availability, location and suitability, experience of the workforce, efficiency, safety performance record, technical capability and condition of equipment, operating integrity, reputation, industry standing and client relations are all factors in determining which contractor is awarded a contract. Our future success and profitability will partly depend upon our ability to keep pace with our customers’ demands with respect to these factors.
In addition to intense competition, our industry has historically been cyclical. The contract drilling industry is currently in a period of low demand for offshore drilling services, excess rig supply, a prolonged period of declining oil and gas prices and reduced worldwide drilling activity. These conditions have intensified the competition in the industry and put significant downward pressure on day rates. As a result, we may be unable to secure profitable contracts for our drilling units, we may have to contract our rigs at substantially lower rates for long periods of time, enter into nontraditional fee arrangements, or idle or cold-stack some of our drilling units, all of which would adversely affect our operating results, cash flows and financial position.
11
We may experience reduced profitability if our customers terminate or seek to renegotiate our drilling contracts, and our backlog of drilling revenue may not be fully realized.
We may be subject to the increased risk of our customers seeking to terminate or renegotiate their contracts. Our customers’ ability to perform their obligations under drilling contracts with us may also be adversely affected by their own financial position, restricted credit markets and the current industry downturn. If our customers cancel or are unable to renew some of their contracts and we are unable to secure new contracts on a timely basis and on substantially similar terms, if contracts are disputed or suspended for an extended period of time, or if a number of our contracts are renegotiated, such events would adversely affect our business, financial condition and results of operations.
Most of our term drilling contracts may be canceled by the customer without penalty upon the occurrence of events beyond our control such as the loss or destruction of the drilling unit, or the suspension of drilling operations for a specified period of time as a result of a breakdown of major equipment. While most of our contracts require the customer to pay a termination fee in the event of an early cancellation without cause, early termination payments may not fully compensate us for the loss of the contract, and could result in the drilling unit becoming idle or cold-stacked for an extended period of time. If we or our customers are unable to perform under existing contracts for any reason or replace terminated contracts with new contracts having less favorable terms, our backlog of estimated revenues would decline, adversely affecting our financial results.
We must make substantial capital and operating expenditures to maintain, and upgrade our drilling fleet.
Our business is highly capital intensive and dependent on having sufficient cash flow and or available sources of financing in order to fund capital expenditure requirements. We can provide no assurance that we will have access to adequate or economical sources of capital to fund necessary capital expenditures.
We have and will likely continue to have certain customer concentrations, and the loss of a significant customer would adversely impact our financial results.
A concentration of customers increases the risks associated with any possible (i) termination or nonperformance of drilling contracts, (ii) failure to renew contracts or award new contracts, or (iii) reduction of our customers' drilling programs. In 2016, five customers accounted for 67% of our consolidated revenues. The loss or material reduction of business from a significant customer would have an adverse impact on our results of operations and cash flows. Moreover, our drilling contracts subject us to counterparty risks. The ability of each of our counterparties to perform its obligations under a contract with us will depend on a number of factors that are beyond our control such as the overall financial condition of the counterparty. Should a significant counterparty fail to honor its obligations under an agreement with us, we could sustain losses, which could have a material adverse effect on our business, financial condition and results of operations.
If we or our customers are unable to acquire or renew permits and approvals required for drilling operations, we may be forced to suspend or cease our operations, and our profitability may be reduced.
Crude oil and natural gas exploration and production operations require numerous permits and approvals for us and our customers from governmental agencies in the areas in which we operate. In addition, many governmental agencies have increased regulatory oversight and permitting requirements in recent years. If we or our customers are not able to obtain necessary permits and approvals in a timely manner, our operations will be adversely affected. Obtaining all necessary permits and approvals may necessitate substantial expenditures to comply with the requirements of these permits and approvals, future changes to these permits or approvals, or any adverse change in the interpretation of existing permits and approvals. In addition, such regulatory requirements and restrictions could also delay or curtail our operations, require us to make substantial expenditures to meet compliance requirements, and could have a significant impact on our financial condition or results of operations and may create a risk of expensive delays or loss of value if a project is unable to function as planned.
For example, the Bureau of Ocean Energy Management and the BSEE, have implemented significant environmental and safety regulations applicable to drilling operations in the US GOM. These regulations have at times adversely impacted the ability of our customers to obtain necessary permits and approval on a timely basis and/or to continue operations uninterrupted under existing permits.
We may not realize the expected benefits of our joint venture with Saudi Aramco and the joint venture may introduce additional risks to our business.
In November 2016, Rowan and Saudi Aramco announced plans to form a 50/50 joint venture with Rowan and Saudi Aramco each contributing existing drilling units and capital as the foundation of the new company. The new venture is anticipated to commence operations in the second quarter of 2017, subject to regulatory approvals and start-up efforts, and is expected to add up to 20 newbuild jack-up rigs to its fleet over ten years commencing as early as 2021. There can be no assurance that this venture will
12
commence operations on schedule, that the new jack-up rigs will begin operations as anticipated or that we will realize the expected return on our investment. We may also experience difficulty jointly managing the venture, and integrating our existing employees, business systems, technologies and services with those of Saudi Aramco in order to operate the joint venture efficiently. Further, in the event the new company has insufficient cash from operations or is unable to obtain third party financing, we may periodically be required to make additional capital contributions to the new company, up to a maximum aggregate contribution of $1.25 billion, which could affect our liquidity position. As a result of these risks, it may take longer than expected for us to realize the expected returns from this venture or such returns may ultimately be less than anticipated. Additionally, if we are unable to make any required contributions, our ownership in the new company could be diluted which could hinder our ability to effectively manage the new company and harm our operating results or financial condition.
Increases in regulatory requirements could significantly increase our costs or delay our operations.
Many aspects of our operations are subject to governmental regulation, including equipping and operating vessels, drilling practices and methods, and taxation. For example, operations in certain areas, such as the US GOM and the North Sea, are highly regulated and have higher compliance and operating costs in general. We may be required to make significant expenditures in order to comply with existing or new governmental laws and regulations. It is also possible that such laws and regulations may in the future add significantly to our operating costs or result in a reduction of revenues associated with downtime required to implement regulatory requirements.
Oil and gas operations in the US GOM and in many of the international locations in which we operate are subject to regulation with respect to well design, casing and cementing and well control procedures, as well as rules requiring operators to systematically identify risks and establish safeguards against those risks through a comprehensive safety and environmental management system, or SEMS. New regulations continue to be implemented, including rules regarding drilling systems and equipment, such as blowout preventer and well-control systems and lifesaving systems, as well as rules regarding employee training, engaging personnel in safety management and requiring third-party audits of SEMS programs. Such new regulations may require modifications or enhancements to existing systems and equipment, or require new equipment, and could increase our operating costs and cause downtime for our units if we are required to take any of them out of service between scheduled surveys or inspections, or if we are required to extend scheduled surveys or inspections to meet any such new requirements. Additional governmental regulations concerning licensing, taxation, equipment specifications, training requirements or other matters could increase the costs of our operations and could reduce exploration activity in the areas in which we operate.
Governments in some countries are increasingly active in regulating and controlling the ownership of concessions, the exploration for oil and gas, and other aspects of the oil and gas industry. These governmental regulations may limit or substantially increase the cost of drilling activity in an operating area generally. The modification of existing laws or regulations or the adoption of new laws or regulations curtailing exploratory or developmental drilling for oil and gas for economic, environmental or other reasons could materially and adversely affect our operations by limiting drilling opportunities. In addition, the offshore drilling industry is highly dependent on demand for services from the oil and gas industry and accordingly, regulations of the production and transportation of oil and gas generally could impact demand for our services.
Regulation of greenhouse gases and climate change could have a negative impact on our business.
Governments around the world are increasingly focused on enacting laws and regulations regarding climate change and regulation of greenhouse gases. Lawmakers and regulators in the U.S., the U.K. and other jurisdictions where we operate have proposed or enacted regulations requiring reporting of greenhouse gas emissions and the restriction thereof. In addition, efforts have been made and continue to be made in the international community toward the adoption of international treaties or protocols that would address global climate change issues and impose reductions of hyrdrocarbon-based fuels. Laws or regulations incentivizing or mandating the use of alternative energy sources such as wind power and solar energy have also been enacted in certain jurisdictions. Laws, regulations, treaties and international agreements related to greenhouse gases and climate change may unfavorably impact our business, our suppliers and our customers, and result in increased compliance costs, operating restrictions and could reduce drilling in the offshore oil and gas industry, all of which would have a negative impact on our business.
Our drilling units are subject to damage or destruction by severe weather, and our drilling operations may be affected by severe weather conditions.
Our drilling rigs are located in areas that frequently experience hurricanes and other forms of severe weather conditions. These conditions can cause damage or destruction to our drilling units. Further, high winds and turbulent seas can cause us to suspend operations on drilling units for significant periods of time. Even if our drilling units are not damaged or lost due to severe weather, we may experience disruptions in our operations due to evacuations, reduced ability to transport personnel to the drilling unit, or damage to our customers’ platforms and other related facilities. Additionally, our customers may not choose to contract our rigs for use during hurricane season, particularly in the US GOM. Future severe weather could result in the loss or damage to our rigs or curtailment of our operations, which could adversely affect our financial position, results of operations and cash flows.
13
Taxing authorities may challenge our tax positions, and we may not be able to realize expected benefits.
We are subject to tax laws, regulations and treaties in many jurisdictions. Changes to these laws or interpretations could affect the taxes we pay in various jurisdictions. Our tax positions are subject to audit by relevant tax authorities who may disagree with our interpretations or assessments of the effects of tax laws, treaties, or regulations, or their applicability to our corporate structure or certain of our transactions we have undertaken. We could therefore incur material amounts of unrecorded income tax cost if our positions are challenged and we are unsuccessful in defending them.
Changes in or non-compliance with tax laws and changes to our income tax estimates could adversely impact our financial results.
In 2012, we changed our legal domicile to the U.K. There are legislative proposals in the U.S. that attempt to treat companies that have undertaken similar transactions as U.S. corporations subject to U.S. taxes or to limit the tax deductions or tax credits available to U.S. subsidiaries of these corporations. The realization of the expected tax benefits of our redomestication could be impacted by changes in tax laws, tax treaties or tax regulations or the interpretation or enforcement thereof or differing interpretation or enforcement of applicable law by the IRS or other tax authorities. Changes in our effective tax rates as determined from time to time, the inability to realize anticipated tax benefits, or the imposition of additional taxes could have a material impact on our results of operations, financial position and cash flows. Our future effective tax rates could be adversely affected by changes in the valuation of our deferred tax assets and liabilities, the ultimate repatriation of earnings from the non-U.S. subsidiaries of Rowan Companies Inc. (RCI), a wholly owned, indirect subsidiary of the Company, to RCI, or by changes in applicable regulations and accounting principles.
Changes in our recorded tax estimates (including estimated reserves for uncertain tax positions) may have a material impact on our results of operations, financial position and cash flows. We do not provide for deferred income taxes on undistributed earnings of non-U.K. subsidiaries, except for certain subsidiaries that are not permanently reinvested or that will not be permanently reinvested in the future. It is generally our policy and intention to permanently reinvest earnings of non-U.S. subsidiaries of RCI outside the U.S. Should the non-U.S. subsidiaries of RCI make a distribution from these earnings, we may be subject to additional income taxes.
Political disturbances, war, or terrorist attacks and changes in global trade policies and economic sanctions could adversely impact our operations.
Our operations are subject to political and economic risks and uncertainties, including instability resulting from civil unrest, political demonstrations, mass strikes, or an escalation or additional outbreak of armed hostilities or other crises in oil or natural gas producing areas, which may result in extended business interruptions, suspended operations and danger to our employees, or result in claims by our customers of a force majeure situation and payment disputes. Additionally, we are subject to risks of terrorism, piracy, political instability, hostilities, expropriation, confiscation or deprivation of our assets or military action impacting our operations, assets or financial performance in many of our areas of operations.
Operating and maintenance costs of our drilling units may be significant, and could have an adverse effect on the profitability of our contracts. In addition, operational interruptions or maintenance or repair work may cause our customers to suspend or reduce payment of day rates until operation is resumed, which may lead to loss of revenue or termination or renegotiation of the drilling contract.
Most of our drilling contracts provide for the payment of a fixed day rate during periods of operation and reduced day rates during periods of other activities. Given current market conditions, we may not be able to negotiate day rates sufficient to cover increased or unanticipated costs. Our operating expenses and maintenance costs can be unpredictable, and depend on a variety of factors including: crew costs, costs of provisions, equipment, insurance, maintenance and repairs, customer and regulatory requirements, and shipyard costs, many of which are beyond our control. Our profit margins may therefore vary over the terms of our contracts, which could adversely affect our financial position, results of operations and cash flows.
Our customers may be entitled to pay a waiting, or standby, rate lower than the full operational day rate if a drilling unit is idle for reasons that are not related to the ability of the rig to operate. In addition, if a drilling unit is taken out of service for maintenance and repair for a period of time exceeding the scheduled maintenance periods set forth in the drilling contract, we may not be entitled to payment of day rates until the unit is able to work. If the interruption of operations were to exceed a determined period, our customers may have the right to pay a rate that is significantly lower than the waiting rate for a period of time, and, thereafter, may terminate the drilling contracts related to the subject rig. Suspension of drilling contract payments, prolonged payment of reduced rates or termination of any drilling contract as a result of an interruption of operations could materially adversely affect our business, financial condition and results of operations.
14
Our rig operating and maintenance costs include fixed costs that will not decline in proportion to decreases in rig utilization and day rates.
We do not expect our rig operating and maintenance costs to decline proportionately when rigs are not in service or when day rates decline. Fixed costs continue to accrue during out-of-service periods (such as shipyard stays and rig mobilizations preceding a contract), which represented approximately 4.5% of our available rig days in 2016. Operating revenue may fluctuate as rigs are recontracted at prevailing market rates upon termination of a contract, but costs for operating a rig are generally fixed or only slightly variable regardless of the day rate being earned. Additionally, if our rigs are idle between contracts, we typically continue to incur operating and personnel costs because the crew is retained to prepare the rig for its next contract. During times of reduced activity, reductions in costs may not be immediate as some crew members may be required to assist in the rig's removal from service. Moreover, as our rigs are mobilized from one geographic location to another, the labor and other operating and maintenance costs may increase significantly.
We may have difficulty obtaining or maintaining insurance in the future, and some of our losses may not be covered by insurance.
We maintain insurance coverage for damage to our drilling rigs, third-party liability, workers’ compensation and employers’ liability, sudden and accidental pollution, and other types of loss or damage. There are some losses, however, for which insurance may not be available or only available at much higher prices. For example, we do not currently maintain named windstorm physical damage coverage on any of our drilling units located in the US GOM.
We can provide no assurance that our insurance coverage will adequately protect us against liability from potential consequences and damages, or that we will be able to maintain adequate insurance in the future. A significant event which is not adequately covered by insurance and /or the failure of one or more of our insurance providers to meet claim obligations or losses or liabilities resulting from uninsured or underinsured events could adversely affect our financial position, results of operations and cash flows.
Our contractual indemnification provisions may not be sufficient to cover our liabilities.
Our drilling contracts provide for varying levels of indemnification and allocation of liabilities between the parties with respect to liabilities resulting from various hazards associated with the drilling industry, such as loss of well control, well-bore pollution and damage to subsurface reservoirs and injury or death to personnel. The degree of indemnification we may receive from operators varies from contract to contract based on market conditions and customer requirements existing when the contract was negotiated and recovery is dependent on the customer's financial condition. Our drilling contracts generally indemnify us for injuries and death of our customers’ employees and loss or damage to our customers’ property. Our service agreements generally indemnify us for injuries and death of our service providers’ employees. However, the enforceability of our indemnities may be subject to differing interpretations, or further limited or prohibited under applicable law or by contract, particularly in cases of gross negligence, willful misconduct, punitive damages or punitive fines and/or penalties. The failure of a customer to meet its indemnification obligations, or losses or liabilities resulting from events excluded from or unenforceable under contractual indemnification obligations would adversely affect our financial position, results of operations and cash flows.
Our information technology systems are subject to cybersecurity risks and threats.
We depend heavily on technologies, systems and networks that we manage, and others that are managed by our third-party service and equipment providers or customers, to conduct our business and operations. Cybersecurity risks and threats to such systems continue to grow and may be difficult to anticipate, prevent, identify or mitigate. If any of our, our service providers' or our customers' security systems prove to be insufficient, we could be adversely affected by having our business and financial systems compromised, our companies’, employees’, vendors’ or customers’ confidential or proprietary information altered, lost or stolen, or our (or our customers’) business operations or safety procedures disrupted, degraded or damaged. A breach or failure could also result in injury (financial or otherwise) to people, loss of control of, or damage to, our (or our customers’) assets, harm to the environment, reputational damage, breaches of laws or regulations, litigation and other legal liabilities. In addition, we may incur significant costs to prevent, respond to or mitigate cybersecurity risks or events and to defend against any investigations, litigation or other proceedings that may follow such events. Such a failure or breach of our systems could adversely and materially impact our business operations, financial position, results of operations and cash flows.
Failure to comply with anti-corruption and anti-bribery laws could result in fines, criminal penalties and drilling contract terminations and could have an adverse impact on our business.
The U.S. Foreign Corrupt Practices Act (FCPA), the U.K. Bribery Act 2010 (UK Bribery Act) and similar laws in other jurisdictions generally prohibit companies and their intermediaries from making improper payments to foreign officials for the purpose of obtaining or retaining business. We have operated and may in the future operate in parts of the world where strict compliance with anti-corruption and anti-bribery laws may conflict with local customs and practices. Any failure to comply with the FCPA, UK
15
Bribery Act, or other anti-corruption laws due to our own acts or omissions or the acts or omissions of others, including our partners, agents or vendors, could subject us to civil and criminal penalties or other sanctions, which would adversely affect our business, financial position, results of operations or cash flows. We could also face fines, sanctions and other penalties from authorities in the relevant foreign jurisdictions, including prohibition of our participation in or curtailment of business operations in those jurisdictions and the seizure of drilling units or other assets.
Failure to retain highly skilled personnel could hurt our operations.
We require highly skilled and experienced personnel to operate our rigs and provide technical services and support for our operations. In the past, during periods of high demand for drilling services and increasing worldwide industry fleet size, shortages of qualified personnel have occurred. Such shortages could result in our loss of qualified personnel to competitors, impair the timeliness and quality of our work and create upward pressure on costs. If we are unable to retain or train skilled personnel, our operations and quality of service could be adversely impacted.
We are involved in litigation and legal proceedings from time to time that could have a negative effect on us if determined adversely.
We are, from time to time, involved in various legal proceedings, which may include, among other things, contract disputes, personal injury, environmental, toxic tort, employment, tax and securities litigation, governmental investigations or proceedings, and litigation that arises in the ordinary course of our business. Although we intend to defend any of these matters vigorously, we cannot predict with certainty the outcome or effect of any claim or other litigation matter. Our profitability may be adversely affected by the outcome of claims or contract disputes, including any inability to collect receivables or resolve significant contractual or day rate disputes, and any purported nullification, cancellation or breach of contracts with customers or other parties. Litigation may have an adverse effect on us because of potential negative outcomes, the costs associated with defending the lawsuits, the diversion of resources, reputational damage, and other factors.
Recent downgrades in our credit ratings may affect our ability to access the credit and debt capital markets.
Our ability to maintain a sufficient level of liquidity to meet our financial and operating needs is dependent upon our future performance, operating cash flows, and our access to credit and debt capital markets. In turn, our level of liquidity and access to credit and debt capital markets depends on general economic conditions, industry cycles, financial, business and other factors affecting our operations, as well as our credit ratings. Tightening in the credit markets due to the current economic environment, concerns about the offshore drilling industry and our credit ratings may restrict our access to the credit and debt capital markets in the future and increase the cost of such indebtedness. As a result, our future cash flows and access to capital may be insufficient to meet all of our capital requirements, debt obligations and contractual commitments, and any insufficiency could have an adverse impact on our business.
Certain credit rating agencies have downgraded our credit ratings below investment grade, and may further downgrade our credit ratings at any time. A further downgrade in our ratings could have adverse consequences on our business and future prospects, including the following:
• | Restrict our ability to access credit and debt capital markets; |
• | Cause us to refinance or issue debt with less favorable terms and conditions; |
• | Pay increased fees under our debt agreements; |
• | Negatively impact current and prospective customers’ willingness to transact business with us; |
• | Impose additional insurance, guarantee and collateral requirements; or |
• | Limit our access to bank and third-party guarantees, surety bonds and letters of credit. |
Technology disputes could negatively impact our operations or increase our costs.
Drilling rigs use proprietary technology and equipment which can involve potential infringement of a third party’s rights, including patent rights. The majority of the intellectual property rights relating to our jack-ups and drillships are owned by us or our suppliers or sub-suppliers, however, in the event that we or one of our suppliers or sub-suppliers becomes involved in a dispute over infringement rights relating to equipment owned or used by us, we may lose access to repair services or replacement parts, or we could be required to cease use of some equipment or forced to modify our jack-ups or drillships. We could also be required to pay license fees or royalties for the use of equipment. Technology disputes involving us or our suppliers or sub-suppliers could adversely affect our financial results and operations.
16
Unionization efforts and labor regulations in certain countries in which we operate could materially increase our costs or limit our flexibility.
Certain of our employees and contractors in international markets such as Trinidad and Norway are represented by labor unions and work under collective bargaining or similar agreements, which are subject to periodic renegotiation. Further, efforts may be made from time to time to unionize other portions of our workforce. In addition, we have experienced, and in the future may experience, strikes or work stoppages and other labor disruptions. Additional unionization efforts, new collective bargaining agreements or work stoppages could materially increase our costs, reduce our revenues or limit our operations.
Supplier capacity constraints or shortages in parts or equipment, supplier production disruptions, supplier quality and sourcing issues or price increases could increase our operating costs, decrease our revenues and adversely impact our operations.
Our reliance on third-party suppliers, manufacturers and service providers to secure equipment used in our drilling operations could expose us to volatility in the quality, price and availability of such items. Certain specialized parts and equipment we use in our operations may be available only from a single or small number of suppliers. A disruption in the deliveries from such third-party suppliers, capacity constraints, production disruptions, price increases, defects or quality-control issues, recalls or other decreased availability or servicing of parts and equipment could adversely affect our ability to meet our commitments to customers, adversely impact our operations and revenues by resulting in uncompensated downtime, reduced day rates or the cancellation or termination of contracts, or increase our operating costs.
The enforcement of civil liabilities against Rowan plc may be more difficult.
Because Rowan plc is a public limited company incorporated under English law, investors could experience more difficulty enforcing judgments obtained against Rowan plc in U.S. courts than would be the case for U.S. judgments obtained against a U.S. company. In addition, it may be more difficult to bring some types of claims against Rowan plc in courts in the U.K. than it would be to bring similar claims against a U.S. company in a U.S. court.
Our articles of association include mandatory offer provisions that may have the effect of discouraging, delaying or preventing hostile takeovers, including those that might result in a premium being paid over the market price of our shares, and discouraging, delaying or preventing changes in control or management.
Although Rowan plc is not currently subject to the U.K. Takeover Code, certain provisions similar to the mandatory offer provisions and certain other aspects of the U.K. Takeover Code are included in our articles of association. As a result, among other matters, a Rowan plc shareholder, that together with persons acting in concert, acquired 30 percent or more of our issued shares without making an offer to all of our other shareholders that is in cash or accompanied by a cash alternative would be at risk of certain Board sanctions unless they acted with the consent of our Board or the prior approval of the shareholders. The ability of shareholders to retain their shares upon completion of a mandatory offer may depend on whether the offeror subsequently causes us to propose a court-approved scheme of arrangement that would compel minority shareholders to transfer or surrender their shares in favor of the offeror or, if the offeror has acquired at least 90 percent of the relevant shares, the offeror requires minority shareholders to accept the offer under the ‘squeeze-out’ provisions in our articles of association. The mandatory offer provisions in our articles of association could have the effect of discouraging the acquisition and holding of interests of 30 percent or more of issued shares and encouraging those shareholders who may be acting in concert with respect to the acquisition of shares to seek to obtain the consent of our Board before effecting any additional purchases. In addition, these provisions may adversely affect the market price of our shares or inhibit fluctuations in the market price of our shares that could otherwise result from actual or rumored takeover attempts.
As a result of shareholder approval requirements required under U.K. law, we may have less flexibility than as a Delaware corporation with respect to certain aspects of capital management.
Unlike most U.S. state corporate law, English law provides that a board of directors may generally only allot shares with the prior authorization of shareholders, which such authorization may only extend for a maximum period of five years. English law also generally provides shareholders preemptive rights when new shares are issued for cash unless such rights are waived by the shareholders.
English law also generally prohibits us from repurchasing our shares on the open market, and prohibits us from repurchasing our shares by way of “off-market purchases” without the prior approval of shareholders, which approval may only extend for a maximum period of five years.
Prior to the redomestication, our Board was authorized to allot a certain amount of shares, exclude certain preemptive rights in shares for cash offerings and effect off market purchases, in each case without further shareholder approval. However, these authorizations expire in April 2017. As such, we will be unable to issue new shares or repurchase shares unless and until we
17
receive renewed shareholder approval. In addition, even if approved by shareholders, our ability to issue and repurchase shares may be substantially more restricted than a U.S. company.
English law requires that we meet certain additional financial requirements before we declare dividends and return funds to shareholders.
Under English law, a public company may only declare dividends and make other distributions to shareholders (such as a share buyback) if the company has sufficient distributable reserves and meets certain net asset requirements. If we do not have sufficient distributable reserves or cannot meet the net asset requirements, we may be limited in our ability to timely pay dividends and effect other distributions to our shareholders.
The United Kingdom’s referendum to exit from the European Union (E.U.) will have uncertain effects and could adversely impact our business, results of operations and financial condition.
On June 23, 2016, the U.K. voted to exit from the E.U. (commonly referred to as “Brexit”). The terms of Brexit and the resulting U.K./E.U. relationship are uncertain for companies doing business both in the U.K. and the overall global economy. In addition, our business and operations may be impacted by any subsequent vote in Scotland to seek independence from the U.K. Risks related to Brexit that we may encounter include:
• | adverse impact on macroeconomic growth and oil and gas demand resulting from the strength of the U.S. dollar; |
• | continued volatility in currencies including the British pound and U.S. dollar that may impact our financial results; |
• | reduced demand for our services in the U.K. and globally; |
• | increased costs of doing business in the U.K. and in the North Sea; |
• | increased regulatory costs and challenges for operating our business in the North Sea; |
• | volatile capital and debt markets, and access to other sources of capital; |
• | risks related to our global tax structure and the tax treaties upon which we rely; |
• | business uncertainty resulting from prolonged political negotiations; and |
• | uncertain stability of the E.U. and global economy if other countries exit the E.U. |
ITEM 1B. UNRESOLVED STAFF COMMENTS
The Company has no unresolved SEC staff comments.
18
ITEM 2. PROPERTIES
Our primary U.S. offices are located in leased space in Houston, Texas. Additionally, we own or lease other office, maintenance and warehouse facilities in Texas, Scotland, Saudi Arabia, Bahrain, Dubai, Qatar, Trinidad, Norway, Luxembourg, Angola, Egypt, Singapore, Indonesia, Cyprus and Malaysia.
Drilling Rigs
Following are the principal drilling equipment owned by Rowan and their location at February 14, 2017.
Depth (feet) | |||||
Rig Name/Type | Class Name | Water (4) | Drilling (5) | Year of Shipyard Delivery | Location |
Ultra-Deepwater Drillships: | |||||
Rowan Renaissance | Gusto MSC P10,000 | 12,000 | 40,000 | 2014 | US GOM |
Rowan Resolute | Gusto MSC P10,000 | 12,000 | 40,000 | 2014 | US GOM |
Rowan Reliance | Gusto MSC P10,000 | 12,000 | 40,000 | 2014 | US GOM |
Rowan Relentless | Gusto MSC P10,000 | 12,000 | 40,000 | 2015 | US GOM |
Jack-ups: | |||||
Rowan Norway (1) | N-Class | 400 | 35,000 | 2011 | U.K. |
Rowan Stavanger (1) | N-Class | 400 | 35,000 | 2011 | U.K. |
Rowan Viking (1) | N-Class | 435 | 35,000 | 2010 | Norway |
Rowan EXL IV (1) | EXL | 320 | 35,000 | 2011 | Bahrain |
Rowan EXL III (1) | EXL | 350 | 35,000 | 2010 | US GOM |
Rowan EXL II (1) | EXL | 350 | 35,000 | 2010 | Trinidad |
Rowan EXL I (1) | EXL | 350 | 35,000 | 2010 | Bahrain |
Joe Douglas (1) | 240C | 350 | 35,000 | 2012 | Trinidad |
Ralph Coffman (1) | 240C | 350 | 35,000 | 2009 | Trinidad |
Rowan Mississippi (1) | 240C | 375 | 35,000 | 2008 | Saudi Arabia |
J.P. Bussell (1) | Tarzan | 300 | 35,000 | 2008 | Bahrain |
Hank Boswell (1) | Tarzan | 300 | 35,000 | 2006 | Saudi Arabia |
Bob Keller (1) | Tarzan | 300 | 35,000 | 2005 | Saudi Arabia |
Scooter Yeargain (1) | Tarzan | 300 | 35,000 | 2004 | Saudi Arabia |
Bob Palmer (1) | Super Gorilla XL | 475 | 35,000 | 2003 | Saudi Arabia |
Rowan Gorilla VII (1) | Super Gorilla | 400 | 35,000 | 2001 | U.K. |
Rowan Gorilla VI (1) | Super Gorilla | 400 | 35,000 | 2000 | U.K. |
Rowan Gorilla V (1) | Super Gorilla | 400 | 35,000 | 1998 | U.K. |
Rowan Gorilla IV (1) | Gorilla | 450 | 30,000 | 1986 | US GOM |
Rowan California (2)(3) | 116C | 300 | 25,000 | 1983 | Bahrain |
Cecil Provine (2)(3) | 116C | 300 | 25,000 | 1982 | US GOM |
Gilbert Rowe (2) | 116C | 300 | 30,000 | 1981 | Saudi Arabia |
Arch Rowan (2) | 116C | 300 | 25,000 | 1981 | Saudi Arabia |
Charles Rowan (2) | 116C | 300 | 25,000 | 1981 | Saudi Arabia |
Rowan Middletown (2) | 116C | 300 | 25,000 | 1980 | Saudi Arabia |
______________________________
(1) High-specification jack-up, which is defined as having hook-load capacity of at least two million pounds.
(2) Premium jack-up, which is defined as an independent leg, cantilevered rig capable of operating in water depths of 300 feet or more.
(3) Currently cold-stacked.
(4) Water depths are the maximum "rated" depths in the current region, as currently outfitted.
(5) Maximum estimated drilling depth, subject to well characteristics and rig outfitting.
19
ITEM 3. LEGAL PROCEEDINGS
We are involved in various routine legal proceedings incidental to our businesses and are vigorously defending our position in all such matters. We believe there are no known contingencies, claims or lawsuits that could have a material adverse effect on our financial position, results of operations or cash flows.
ITEM 4. MINE SAFETY DISCLOSURES
Not applicable.
EXECUTIVE OFFICERS OF THE REGISTRANT
The names, positions and ages of the executive officers of the Company as of February 24, 2017, are listed below. Our executive officers are appointed by the Board of Directors and serve at the discretion of the Board of Directors. There are no family relationships among these officers, nor any arrangements or understandings between any officer and any other person pursuant to which the officer was selected.
Name | Position | Age |
Thomas P. Burke | President and Chief Executive Officer | 49 |
Stephen M. Butz | Executive Vice President and Chief Financial Officer | 45 |
Mark A. Keller | Executive Vice President, Business Development | 64 |
Melanie M. Trent | Executive Vice President, General Counsel, Chief Administrative Officer and Company Secretary | 52 |
Dennis Baldwin | Chief Accounting Officer | 56 |
T. Fred Brooks | Executive Vice President, Operations and Engineering | 59 |
Dr. Burke was appointed Chief Executive Officer and elected a director of the Company in April 2014. He served as Chief Operating Officer beginning in July 2011 and was appointed President in March 2013. Dr. Burke first joined the Company in December 2009, serving as Chief Executive Officer and President of LeTourneau Technologies until the sale of LeTourneau in June 2011. From 2006 to 2009, Dr. Burke was a Division President at Complete Production Services, an oilfield services company, and from 2004 to 2006, served as its Vice President for Corporate Development.
Mr. Butz became Executive Vice President and Chief Financial Officer upon joining the Company in December 2014, and also served as Treasurer from December 2014 through February 2016. Prior to joining the Company, Mr. Butz served as Executive Vice President and Chief Financial Officer at Hercules Offshore, Inc. He was Senior Vice President and Chief Financial Officer of Hercules Offshore from 2010 to 2013 and held a number of other key positions after joining Hercules Offshore in 2005, including Director of Corporate Development and Vice President, Finance and Treasurer. Prior to joining Hercules Offshore, Mr. Butz held positions in both investment and commercial banking.
Since January 2007, Mr. Keller’s principal occupation has been Executive Vice President, Business Development. Prior to that time, Mr. Keller served as Senior Vice President, Marketing.
Ms. Trent became Executive Vice President and General Counsel in September 2014. Prior to that time, Ms. Trent served as Senior Vice President, Chief Administrative Officer and Company Secretary since July 2011. From March 2010 to July 2011, she served as Vice President and Corporate Secretary. Ms. Trent has served as Corporate Secretary since she joined the Company in 2005.
Mr. Baldwin became Chief Accounting Officer in April 2016. Prior to joining the Company, he served as Vice President, Controller and Chief Accounting Officer for Cameron International Corporation from March 2014 until March 2016. Prior to such time, he was Senior Vice President and Chief Accounting Officer of KBR, Inc. from August 2010 to March 2014, and Vice President and Chief Accounting Officer of McDermott International from October 2007 to August 2010. He also previously served at Integrated Electrical Services and Veritas DGC.
Mr. Brooks became Executive Vice President, Operations and Engineering in February 2017. Prior to that time, he served as Senior Vice President, Operations from October 2012 through January 2017, and as Vice President, Deepwater Operations from March 2011 through September 2012. Prior to joining the Company, Mr. Brooks served as Senior Vice President of Operations at Northern Offshore from 2008 through 2010. He also served in various management positions at GlobalSantaFe from 1998 through 2007, including Vice President of West Africa Operations, and Vice President of Worldwide Deepwater & Gulf of Mexico Operations.
20
PART II
ITEM 5. MARKET FOR REGISTRANT’S COMMON STOCK, RELATED STOCKHOLDER MATTERS AND ISSUER PURCHASES OF EQUITY SECURITIES
Our shares are listed on the NYSE under the symbol “RDC.” The following table sets forth the high and low sales prices of our shares for each quarterly period within the two most recent years as reported by the NYSE Consolidated Transaction Reporting System.
2016 | 2015 | |||||||||||||||
Quarter | High | Low | High | Low | ||||||||||||
First | $ | 18.43 | $ | 10.67 | $ | 25.13 | $ | 17.23 | ||||||||
Second | 19.94 | 14.58 | 24.31 | 17.56 | ||||||||||||
Third | 19.06 | 12.00 | 21.14 | 14.63 | ||||||||||||
Fourth | 21.68 | 13.02 | 21.83 | 15.41 | ||||||||||||
On February 17, 2017, there were 72 shareholders of record. Many of our shareholders hold their shares in "street name" by a nominee of Depository Trust Company, which is one shareholder of record.
We declared and paid a dividend of $0.10 per share in each quarter of 2015. In January 2016, our Board of Directors discontinued dividend payments.
21
The graph below presents the relative investment performance of our ordinary shares, the Dow Jones U.S. Oil Equipment & Services Index, and the S&P 500 Index for the five-year period ended December 31, 2016, assuming reinvestment of dividends.
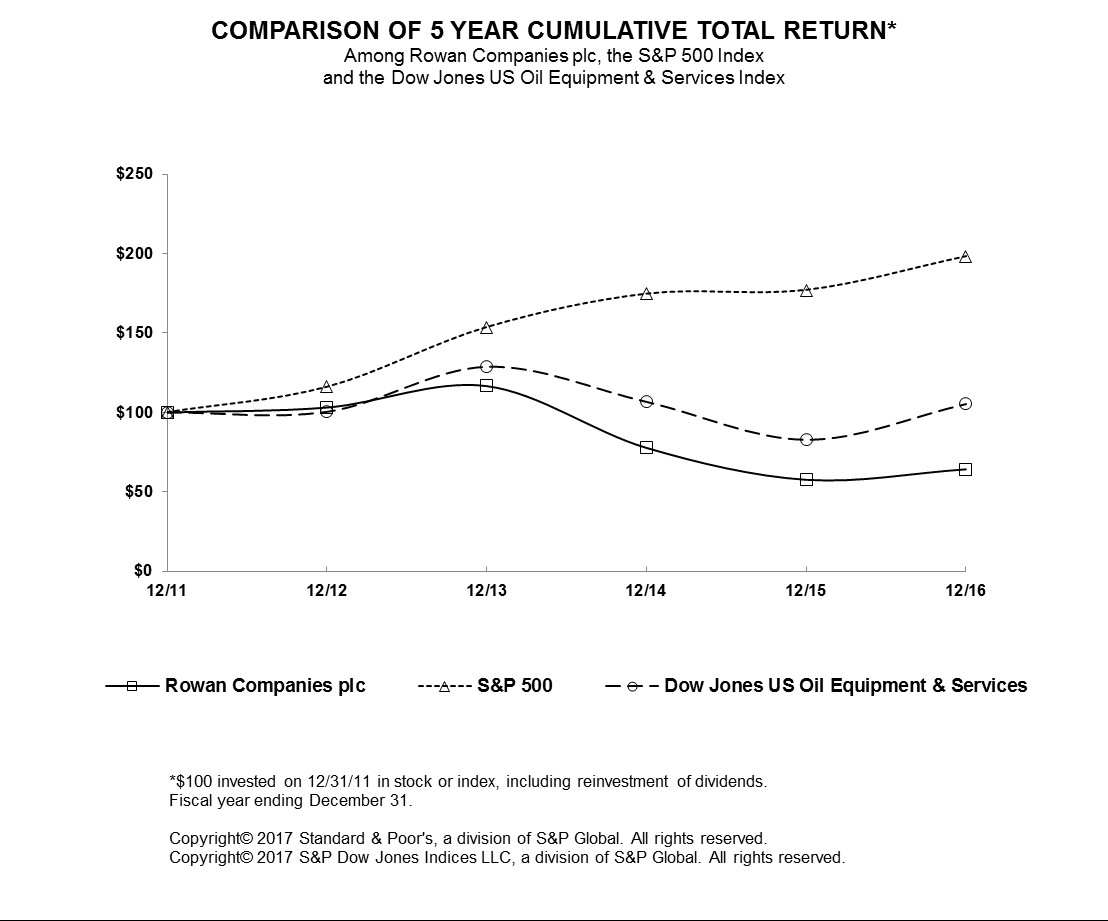
12/31/2011 | 12/31/2012 | 12/31/2013 | 12/31/2014 | 12/31/2015 | 12/31/2016 | ||||||||||||
Rowan | 100.00 | 103.10 | 116.58 | 77.73 | 57.62 | 64.21 | |||||||||||
S&P 500 Index | 100.00 | 116.00 | 153.58 | 174.60 | 177.01 | 198.18 | |||||||||||
Dow Jones US Oil Equipment & Services Index | 100.00 | 100.33 | 128.83 | 106.64 | 82.67 | 105.26 | |||||||||||
22
Issuer Purchases of Equity Securities
The following table summarizes acquisitions of our shares for the fourth quarter of 2016:
Month ended | Total number of shares purchased 1 | Average price paid per share 1 | Total number of shares purchased as part of publicly announced plans or programs2 | Approximate dollar value of shares that may yet be purchased under the plans or programs2 | ||||||||||
October 31, 2016 | 3,495 | $ | 14.16 | — | $ | — | ||||||||
November 30, 2016 | 2,003,817 | $ | 0.16 | — | $ | — | ||||||||
December 31, 2016 | 2,625 | $ | 18.10 | — | $ | — | ||||||||
Total | 2,009,937 | $ | 0.20 | — | ||||||||||
(1) The total number of shares acquired includes shares acquired from employees by an affiliated employee benefit trust ("EBT") upon forfeiture of nonvested awards or in satisfaction of tax withholding requirements and shares purchased, if any, pursuant to a publicly announced share repurchase program. The price paid for shares acquired as a result of forfeitures is the nominal value of $0.125 per share. The price paid for shares acquired in satisfaction of withholding taxes is the share price on the date of the transaction. In November 2016, the Company issued 2.0 million shares to the EBT, which shares were acquired at a price equal to the nominal value of $0.125 per share. There were no shares repurchased under any share repurchase program during the fourth quarter of 2016. | ||||||||||||||
(2) The ability to make share repurchases is subject to the discretion of the Board of Directors and the limitations set forth in the Companies Act, which generally provide that share repurchases may only be made out of distributable reserves. In addition, U.K. law also generally prohibits a company from repurchasing its own shares through “off market purchases” without the prior approval of shareholders, which approval lasts for a maximum period of five years. Prior to and in connection with the redomestication, the Company obtained approval to purchase its own shares. To effect such repurchases, the Company entered into a purchase agreement with a specified dealer in July 2012, pursuant to which the Company may purchase up to a maximum of 50,000,000 shares over a five-year period, subject to an annual cap of 10% of the shares outstanding at the beginning of each applicable year. Subject to Board approval, share repurchases may be commenced or suspended from time to time without prior notice and, in accordance with the shareholder approval and U.K. law, any shares repurchased by the Company will be cancelled. The authority to repurchase shares terminates in April 2017 unless otherwise reapproved by the Company’s shareholders. U.K. law prohibits the Company from purchasing its shares in the open market because Rowan is not traded on a recognized investment exchange in the U.K. | ||||||||||||||
For information concerning our shares to be issued in connection with equity compensation plans, see Part III, Item 12, “Security Ownership of Certain Beneficial Owners and Management and Related Stockholder Matters,” of this Form 10-K.
23
ITEM 6. SELECTED FINANCIAL DATA
Selected financial data for each of the last five years is presented below:
2016 | 2015 | 2014 | 2013 | 2012 | |||||||||||||||
(Dollars in millions, except per share amounts) | |||||||||||||||||||
Operations | |||||||||||||||||||
Revenues | $ | 1,843.2 | $ | 2,137.0 | $ | 1,824.4 | $ | 1,579.3 | $ | 1,392.6 | |||||||||
Costs and expenses: | |||||||||||||||||||
Direct operating costs (excluding items shown below) | 778.2 | 993.1 | 991.3 | 860.9 | 752.2 | ||||||||||||||
Depreciation and amortization | 402.9 | 391.4 | 322.6 | 271.0 | 247.9 | ||||||||||||||
Selling, general and administrative | 102.1 | 115.8 | 125.8 | 131.3 | 99.7 | ||||||||||||||
(Gain) loss on disposals of property and equipment | 8.7 | (7.7 | ) | (1.7 | ) | (20.1 | ) | (2.5 | ) | ||||||||||
Gain on litigation settlement (1) | — | — | (20.9 | ) | — | (4.7 | ) | ||||||||||||
Material charges and other operating items (2) | 32.9 | 337.3 | 574.0 | 4.5 | 45.0 | ||||||||||||||
Total costs and expenses | 1,324.8 | 1,829.9 | 1,991.1 | 1,247.6 | 1,137.6 | ||||||||||||||
Income (loss) from operations | 518.4 | 307.1 | (166.7 | ) | 331.7 | 255.0 | |||||||||||||
Other income (expense) — net (3) | (192.8 | ) | (149.4 | ) | (102.9 | ) | (70.5 | ) | (71.5 | ) | |||||||||
Income (loss) from continuing operations before income taxes | 325.6 | 157.7 | (269.6 | ) | 261.2 | 183.5 | |||||||||||||
Provision (benefit) for income taxes | 5.0 | 64.4 | (150.7 | ) | 8.6 | (19.8 | ) | ||||||||||||
Income (loss) from continuing operations | 320.6 | 93.3 | (118.9 | ) | 252.6 | 203.3 | |||||||||||||
Discontinued operations, net of taxes (4) | — | — | 4.0 | — | (22.7 | ) | |||||||||||||
Net income (loss) | $ | 320.6 | $ | 93.3 | $ | (114.9 | ) | $ | 252.6 | $ | 180.6 | ||||||||
Basic income (loss) per common share: | |||||||||||||||||||
Income (loss) from continuing operations | $ | 2.56 | $ | 0.75 | $ | (0.96 | ) | $ | 2.04 | $ | 1.65 | ||||||||
Income (loss) from discontinued operations | — | — | 0.03 | — | (0.18 | ) | |||||||||||||
Net income (loss) | $ | 2.56 | $ | 0.75 | $ | (0.93 | ) | $ | 2.04 | $ | 1.47 | ||||||||
Diluted income (loss) per common share: | |||||||||||||||||||
Income (loss) from continuing operations | $ | 2.55 | $ | 0.75 | $ | (0.96 | ) | $ | 2.03 | $ | 1.64 | ||||||||
Income (loss) from discontinued operations | — | — | 0.03 | — | (0.18 | ) | |||||||||||||
Net income (loss) | $ | 2.55 | $ | 0.75 | $ | (0.93 | ) | $ | 2.03 | $ | 1.46 | ||||||||
Financial Position | |||||||||||||||||||
Cash and cash equivalents | $ | 1,255.5 | $ | 484.2 | $ | 339.2 | $ | 1,092.8 | $ | 1,024.0 | |||||||||
Property and equipment — net | $ | 7,060.0 | $ | 7,405.8 | $ | 7,432.2 | $ | 6,385.8 | $ | 6,071.7 | |||||||||
Total assets | $ | 8,675.6 | $ | 8,347.3 | $ | 8,392.3 | $ | 7,975.8 | $ | 7,699.5 | |||||||||
Current portion of long-term debt | $ | 126.8 | $ | — | $ | — | $ | — | $ | — | |||||||||
Long-term debt, less current portion | $ | 2,553.4 | $ | 2,692.4 | $ | 2,788.5 | $ | 2,008.7 | $ | 2,009.6 | |||||||||
Shareholders’ equity | $ | 5,113.9 | $ | 4,772.5 | $ | 4,691.4 | $ | 4,893.8 | $ | 4,531.7 | |||||||||
Statistical Information | |||||||||||||||||||
Current ratio (5) | 3.27 | 2.80 | 2.82 | 4.50 | 5.61 | ||||||||||||||
Debt to capitalization ratio | 34 | % | 36 | % | 37 | % | 29 | % | 31 | % | |||||||||
Book value per share of common stock outstanding | $ | 40.76 | $ | 38.24 | $ | 37.66 | $ | 39.39 | $ | 36.48 | |||||||||
Price range of common stock: | |||||||||||||||||||
High | $ | 21.68 | $ | 25.13 | $ | 35.17 | $ | 38.65 | $ | 39.40 | |||||||||
Low | $ | 10.67 | $ | 14.63 | $ | 19.50 | $ | 30.21 | $ | 28.62 | |||||||||
Cash dividends declared per share | $ | — | $ | 0.40 | $ | 0.30 | $ | — | $ | — | |||||||||
___________________
(1) | Gain on litigation settlement includes: 2014 – a gain of $20.9 million in cash received for damages incurred as a result of a tanker’s collision with the Rowan EXL I in 2012; and 2012 – a $4.7 million gain for cash received in connection with the settlement of a 2005 dispute with a customer. |
(2) | Material charges and other operating expenses consisted of the following: 2016 – $34.3 million of non-cash impairment charges and a $1.4 million reversal of an estimated liability for settlement of a withholding tax matter during a tax amnesty period which was related to a legal settlement for a 2014 termination of a contract for refurbishment work on the Rowan Gorilla III, as noted below in the 2015 period. A payment of such withholding taxes during the tax amnesty period resulted in the waiver of applicable penalties and interest; 2015 – $329.8 million of non-cash asset impairment charges and a $7.6 million adjustment to an estimated liability for the 2014 termination of a contract for refurbishment work on the Rowan Gorilla III. A settlement agreement for this matter was signed during the third quarter of 2015; 2014 – $574.0 million of non-cash asset impairment charges; 2013 – $4.5 million of non-cash asset impairment charges; and 2012 – $13.8 million of legal and consulting fees incurred in connection with the Company’s redomestication, $12.0 million of repair costs for the Rowan EXL I following its collision with a tanker, $8.7 million of pension settlement costs in connection with lump sum pension payments to employees of the Company’s former manufacturing subsidiary, $8.1 million of non-cash asset impairment charges, and $2.3 million of incremental non-cash share-based compensation cost in connection with the retirement of an employee. |
(3) | In 2016, other income (expense), net includes $31.2 million loss on debt extinguishment. |
24
(4) | In 2011, the Company sold its manufacturing and land drilling operations, which are classified as discontinued operations. In 2014, we sold a land rig retained from the sale and recognized a $4.0 million gain, net of tax. |
(5) | Current ratio excludes assets and liabilities of discontinued operations. |
ITEM 7. MANAGEMENT’S DISCUSSION AND ANALYSIS OF FINANCIAL CONDITION AND RESULTS OF OPERATIONS
OUR BUSINESS
Rowan plc is a global provider of offshore contract drilling services to the international oil and gas industry, with a focus on high-specification and premium jack-up rigs and ultra-deepwater drillships. Our fleet currently consists of 29 mobile offshore drilling units, including 25 self-elevating jack-up rigs and four ultra-deepwater drillships. Our fleet operates worldwide, including the United States Gulf of Mexico, the United Kingdom and Norwegian sectors of the North Sea, the Middle East and Trinidad.
As of February 14, 2017, the date of our most recent Fleet Status Report, two of our four drillships were under contract in the US GOM. Additionally, we had three jack-up rigs under contract in the North Sea, nine under contract in the Middle East, three under contract in Trinidad and two under contract in the US GOM. We had an additional six marketed jack-up rigs, two cold-stacked jack-up rigs and two marketed drillships without a contract.
We contract our drilling rigs, related equipment and work crews primarily on a “day rate” basis. Under day rate contracts, we generally receive a fixed amount per day for each day we are performing drilling or related services. In addition, our customers may pay all or a portion of the cost of moving our equipment and personnel to and from the well site. Contracts generally range in duration from one month to multiple years.
Joint Venture
On November 21, 2016, Rowan and the Saudi Arabian Oil Company (“Saudi Aramco”), through their subsidiaries, entered into a Shareholders’ Agreement to create a 50/50 joint venture to own, manage and operate offshore drilling units in Saudi Arabia. The new entity is anticipated to commence operations in the second quarter of 2017 (see Part I, Item 1, "Business" of this Form 10-K).
Customer Contract Termination and Settlement
On May 23, 2016, we reached an agreement with Freeport-McMoRan Oil and Gas LLC (“FMOG”) and its parent company, Freeport-McMoRan Inc. (“FCX”) in connection with the drilling contract for the drillship Rowan Relentless (“FMOG Agreement”), which was scheduled to terminate in June 2017. The FMOG Agreement provided that the drilling contract be terminated immediately, and that FCX pay us $215 million to settle outstanding receivables and early termination of the contract, which was received in 2016. In addition, we signed rights to receive two additional contingent payments from FCX, payable on September 30, 2017, of $10 million and $20 million depending on the average price of West Texas Intermediate (“WTI”) crude oil over a 12-month period beginning June 30, 2016. The $10 million payment will be due if the average price over the period is greater than $50 per barrel and the additional $20 million payment will be due if the average price over the period is greater than $65 per barrel (“FMOG Provision”). The Company warm-stacked the Rowan Relentless in order to reduce costs. During the quarter ended June 30, 2016, the Company recognized $173.2 million in revenue for the Rowan Relentless, including $130.9 million for the cancelled contract value, $6.2 million for the fair value of the derivative associated with the FMOG Provision, $5.6 million for previously deferred revenue related to the contract, and $30.5 million for operations through May 22, 2016. In January 2017, Rowan and FCX settled the $10 million contingent payment provision with a $6.0 million payment received by Rowan.
Customer Contract Amendment
On September 15, 2016, we amended our contract with Cobalt International Energy, L.P. (“Cobalt”), for the drillship Rowan Reliance, which was scheduled to conclude on February 1, 2018. The amendment provided cash settlement payments to Rowan totaling $95.9 million, that the drillship remains at its current day rate of approximately $582,000 and that the drilling contract may be terminated as early as March 31, 2017. The Company received cash payments totaling $76.3 million in 2016 and expects to receive a final cash payment of $19.6 million on or before March 31, 2017. In addition, if Cobalt continues its operations with the Rowan Reliance after March 31, 2017, the day rate will be reduced to approximately $262,000 per day for the remaining operating days through February 1, 2018 (subject to further adjustment thereafter). Cobalt International Energy, Inc., the parent of Cobalt, also committed to use the Company as its exclusive provider of comparable drilling services for a period of five years. As we have the obligation and intent to have the drillship or a substitute available through the pre-amended contract scheduled end date, in certain circumstances, the $95.9 million settlement was recorded as a deferred revenue liability. As of December 31, 2016, $86.5 million and $9.4 million of the deferred revenue liability is classified as current and noncurrent, respectively, and is included in Deferred Revenue, and Other Liabilities, respectively, in the Consolidated Balance Sheet. Amortization of deferred
25
revenue will begin on April 1, 2017 and extend no further than the pre-amended contract scheduled end date.
CURRENT BUSINESS ENVIRONMENT
Despite some recent signs of stabilization in commodity prices, the business environment for offshore drillers continues to be challenging as operators' capital expenditures have declined dramatically over the past two years. The resulting cancellation or postponement of drilling programs have resulted in significantly reduced demand for offshore drilling services globally. Additionally, the 231 new jack-ups and 158 new floaters that have been delivered since the beginning of the current newbuild cycle in early 2006 have exacerbated the situation. The rate of drilling contract terminations and expirations has continued to outpace new contract awards, resulting in reduced rig utilization and downward pressure on day rates. We expect this dynamic to continue in 2017. Contractors have responded by stacking certain idle equipment and deferring newbuild deliveries, however, the jack-up and floater markets remain oversupplied.
Further, as of February 14, 2017, there were 103 additional jack-up rigs on order or under construction worldwide for delivery through 2020 (relative to approximately 310 jack-up rigs currently on contract), and 48 floaters on order or under construction worldwide for delivery through 2020 (relative to approximately 149 floater rigs currently on contract). Only five jack-ups and 18 floaters currently on order or under construction have contracts secured for their future delivery dates. We expect several of these rigs may eventually be cancelled and many others will likely continue to be deferred until a recovery in demand is visible.
In response to market conditions over the past two years, we have reduced day rates on certain drilling contracts, some in exchange for extended contract duration, sold five of our oldest jack-ups, cold-stacked two of our older jack-ups, and have warm stacked five of our jack-ups and two of our ultra-deepwater drillships. We have agreed to one termination of an ultra-deepwater drillship contract and agreed to reduce the duration of another contract in exchange for certain upfront payments. Similarly, we have had two early terminations of jack-up rig contracts in recent months. Though in each case we have received or expect to receive a substantial portion of the backlog, these terminations add to the number of rigs available for work over the near term, likely increasing idle time in our fleet.
While we have seen some recent improvement in tender activity, given the current supply and demand dynamics and in the absence of a sustained recovery in commodity prices, we expect the business environment to continue to deteriorate in 2017 for the broad market. We believe that utilization rates for jack-ups could bottom sometime in 2017, and floater utilization could bottom sometime in 2018. These market conditions have increased our risk of customer defaults, restructurings or insolvency which may prompt further renegotiations or terminations of our drilling contracts.
However, we believe that we are strategically well-positioned to take advantage of the expected increase in activity given our strong and stable financial condition, current backlog of $1.7 billion as of February 14, 2017 (excluding anticipated changes to the Middle East fleet due to the formation of the 50/50 joint venture with Saudi Aramco expected to commence operations in second quarter 2017, see Part I, Item 1, "Business" of this Form 10-K), solid operational reputation, and modern fleet of high-specification jack-ups and state-of-the-art ultra-deepwater drillships. While challenging market conditions persist, we continue to focus on operating and cost efficiencies which could include cold-stacking or retiring additional drilling rigs, layoffs or other cost cutting initiatives.
26
RESULTS OF OPERATIONS
The following table presents certain key performance indicators by rig classification:
2016 | 2015 | 2014 | |||||||||
Revenues (in millions): | |||||||||||
Deepwater | $ | 824.7 | $ | 730.8 | $ | 170.5 | |||||
Jack-ups | 994.7 | 1,361.3 | 1,598.8 | ||||||||
Subtotal - Day rate revenues | 1,819.4 | 2,092.1 | 1,769.3 | ||||||||
Other revenues (1) | 23.8 | 44.9 | 55.1 | ||||||||
Total revenues | $ | 1,843.2 | $ | 2,137.0 | $ | 1,824.4 | |||||
Revenue-producing days: | |||||||||||
Deepwater | 1,238 | 1,178 | 262 | ||||||||
Jack-ups | 5,999 | 7,852 | 9,019 | ||||||||
Total revenue-producing days | 7,237 | 9,030 | 9,281 | ||||||||
Available days: (2) | |||||||||||
Deepwater | 1,464 | 1,263 | 330 | ||||||||
Jack-ups | 8,784 | 9,558 | 10,220 | ||||||||
Total available days | 10,248 | 10,821 | 10,550 | ||||||||
Average day rate (in thousands): (3) | |||||||||||
Deepwater (4) | $ | 550.7 | $ | 620.5 | $ | 650.4 | |||||
Jack-ups | $ | 165.8 | $ | 173.4 | $ | 177.3 | |||||
Total fleet (4) | $ | 231.7 | $ | 231.7 | $ | 190.6 | |||||
Utilization: (5) | |||||||||||
Deepwater | 85 | % | 93 | % | 80 | % | |||||
Jack-ups | 68 | % | 82 | % | 88 | % | |||||
Total fleet | 71 | % | 83 | % | 88 | % | |||||
(1) Other revenues, which are primarily revenues received for contract reimbursable costs, are excluded from the computation of average day rate. | |||||||||||
(2) Available days are defined as the aggregate number of calendar days (excluding days for which a rig is cold-stacked) in the period, or, with respect to new rigs entering service, the number of calendar days in the period from the date the rig was placed in service. | |||||||||||
(3) Average day rate is computed by dividing day rate revenues by the number of revenue-producing days, including fractional days. Day rate revenues include the contractual rates and amounts received in lump sum, such as for rig mobilization or capital improvements, which are amortized over the initial term of the contract. Revenues attributable to reimbursable expenses are excluded from average day rates. | |||||||||||
(4) Average day rate for 2016 includes operating days for the Rowan Relentless up to the contract termination which was 143 days for 2016. | |||||||||||
(5) Utilization is the number of revenue-producing days, including fractional days, divided by the number of available days. | |||||||||||
27
Rig Utilization
The following table sets forth an analysis of time that our rigs were idle or out-of-service as a percentage of available days (which excludes cold-stacked rigs) and time that our rigs experience operational downtime and are off-rate as a percentage of revenue-producing day:
2016 | 2015 | 2014 | ||||||
Deepwater: | ||||||||
Idle (1) | 15.2 | % | — | — | ||||
Out-of-service (2) (3) | 0.1 | % | — | 15.1 | % | |||
Operational downtime (4) | 0.1 | % | 6.7 | % | 6.3 | % | ||
Jack-up: | ||||||||
Idle (1) | 25.4 | % | 13.5 | % | 1.4 | % | ||
Out-of-service (2) | 5.3 | % | 3.3 | % | 9.5 | % | ||
Operational downtime (4) | 1.4 | % | 1.2 | % | 1.0 | % | ||
(1) Idle Days – We define idle days as the time a rig is not under contract and is available to work. Idle days exclude cold-stacked rigs, which are not marketed. | ||||||||
(2) Out-of-Service Days – We define out-of-service days as those days when a rig is (or is planned to be) out of service and is not able to earn revenue. The Company may be compensated for certain out-of-service days, such as for shipyard stays or for rig transit periods preceding a contract; however, recognition of any such compensation is deferred and recognized over the primary term of the drilling contract. | ||||||||
(3) Out-of-service time for our deepwater fleet for 2014 included 27 days attributable to the Rowan Resolute (35% of in-service time) for commissioning. | ||||||||
(4) Operational Downtime – We define operational downtime as the unbillable time when a rig is under contract and unable to conduct planned operations due to equipment breakdowns or procedural failures. | ||||||||
28
2016 Compared to 2015
A summary of our consolidated results of operations follows (in millions):
Year ended December 31, | ||||||||||||||
2016 | 2015 | Change | % Change | |||||||||||
Deepwater: | ||||||||||||||
Revenues | $ | 827.5 | $ | 747.8 | $ | 79.7 | 11 | % | ||||||
Operating expenses: | ||||||||||||||
Direct operating costs (excluding items below) | 222.0 | 276.6 | (54.6 | ) | (20 | )% | ||||||||
Depreciation and amortization | 115.0 | 94.6 | 20.4 | 22 | % | |||||||||
Other operating items | 0.1 | — | 0.1 | n/m | ||||||||||
Income from operations | $ | 490.4 | $ | 376.6 | $ | 113.8 | 30 | % | ||||||
Jack-ups: | ||||||||||||||
Revenues | $ | 1,015.7 | $ | 1,389.2 | $ | (373.5 | ) | (27 | )% | |||||
Operating expenses: | ||||||||||||||
Direct operating costs (excluding items below) | 556.2 | 716.5 | (160.3 | ) | (22 | )% | ||||||||
Depreciation and amortization | 282.6 | 283.9 | (1.3 | ) | — | % | ||||||||
Other operating items | 40.9 | 328.8 | (287.9 | ) | n/m | |||||||||
Income from operations | $ | 136.0 | $ | 60.0 | $ | 76.0 | 127 | % | ||||||
Unallocated costs and other: | ||||||||||||||
Operating expenses: | ||||||||||||||
Depreciation and amortization | $ | 5.3 | $ | 12.9 | $ | (7.6 | ) | (59 | )% | |||||
Selling, general and administrative | 102.1 | 115.8 | (13.7 | ) | (12 | )% | ||||||||
Other operating items | 0.6 | 0.8 | (0.2 | ) | n/m | |||||||||
Loss from operations | $ | (108.0 | ) | $ | (129.5 | ) | $ | 21.5 | (17 | )% | ||||
Total company: | ||||||||||||||
Revenues | $ | 1,843.2 | $ | 2,137.0 | $ | (293.8 | ) | (14 | )% | |||||
Direct operating costs (excluding items below) | 778.2 | 993.1 | (214.9 | ) | (22 | )% | ||||||||
Depreciation and amortization | 402.9 | 391.4 | 11.5 | 3 | % | |||||||||
Selling, general and administrative | 102.1 | 115.8 | (13.7 | ) | (12 | )% | ||||||||
Other operating items | 41.6 | 329.6 | (288.0 | ) | n/m | |||||||||
Income from operations | 518.4 | 307.1 | 211.3 | 69 | % | |||||||||
Other (expense), net | (192.8 | ) | (149.4 | ) | (43.4 | ) | 29 | % | ||||||
Income from continuing operations before income taxes | 325.6 | 157.7 | 167.9 | 106 | % | |||||||||
Provision for income taxes | 5.0 | 64.4 | (59.4 | ) | (92 | )% | ||||||||
Income from continuing operations | 320.6 | 93.3 | 227.3 | 244 | % | |||||||||
Discontinued operations, net of tax | — | — | — | n/m | ||||||||||
Net income | $ | 320.6 | $ | 93.3 | $ | 227.3 | 244 | % | ||||||
“n/m” means not meaningful. | ||||||||||||||
29
Revenues
Consolidated. The decrease in consolidated revenue is described below.
Deepwater. An analysis of the net changes in revenues for 2016, compared to 2015, are set forth below (in millions):
Increase (decrease) | |||
Contract termination for Rowan Relentless and related items | $ | 142.7 | |
Rowan Reliance and Rowan Relentless fully in service in 2016 versus startup in February and June of 2015, respectively, net of idle time in the current period | 21.5 | ||
Lower unbillable downtime | 14.6 | ||
Lower drillship average day rates | (84.8 | ) | |
Lower reimbursable revenues | (14.3 | ) | |
Net increase | $ | 79.7 | |
Jack-ups. An analysis of the net changes in revenues for 2016, compared to 2015, are set forth below (in millions):
Increase (Decrease) | |||
Lower jack-up utilization | $ | (319.8 | ) |
Lower jack-up average day rates | (46.1 | ) | |
Lower reimbursable revenues | (7.9 | ) | |
Other | 0.3 | ||
Net decrease | $ | (373.5 | ) |
Direct operating costs
Consolidated. The decrease in consolidated direct operating costs is described below.
Deepwater. An analysis of the net changes in direct operating costs for 2016, compared to 2015, are set forth below (in millions):
Increase (decrease) | |||
Addition of the Rowan Reliance and Rowan Relentless | $ | 19.7 | |
Reduction in drillship direct operating expense | (34.8 | ) | |
Decrease due to idle drillship | (15.4 | ) | |
Lower reimbursable costs | (14.3 | ) | |
Reduction in shore base costs and other | (9.8 | ) | |
Net decrease | $ | (54.6 | ) |
Jack-ups. An analysis of the net changes in direct operating costs for 2016, compared to 2015, are set forth below (in millions):
Decrease | |||
Decrease due to idle or cold-stacked rigs | $ | (115.9 | ) |
Reduction in jack-up direct operating expense | (29.9 | ) | |
Lower reimbursable costs | (7.9 | ) | |
Reduction in shore base costs and other | (6.6 | ) | |
Decrease | $ | (160.3 | ) |
Depreciation and amortization
Depreciation and amortization for 2016 increased largely due to the addition of the Rowan Reliance and Rowan Relentless in 2015.
30
Selling, general and administrative
Selling, general and administrative expenses for 2016 decreased largely due to lower personnel costs. In addition, professional fees and information technology expenses decreased in 2016 as compared to 2015.
Other operating items
Material charges for 2016 included a $34.3 million non-cash impairment charge to reduce the carrying values of five of our jack-up drilling units, partially offset by a $1.4 million reversal of an estimated liability for settlement of a withholding tax matter during a tax amnesty period which was related to a legal settlement for a 2014 termination of a contract for refurbishment work on the Rowan Gorilla III, as noted below in the 2015 period. Payment of such withholding taxes during the tax amnesty period resulted in the waiver of applicable penalties and interest.
Material charges for 2015 included a $329.8 million non-cash impairment charge to reduce the carrying values of ten of our jack-up drilling units and a $7.6 million adjustment to an estimated liability for the 2014 termination of a contract for refurbishment work on the Rowan Gorilla III. A settlement agreement for this matter was signed during the third quarter of 2015.
In 2016 we had a loss on disposals of property and equipment of $8.7 million, compared to a gain of $7.7 million in 2015.
Other expense, net
The increase in Other Expense, Net, is primarily due to a $31.2 million net loss on the early extinguishment of debt in 2016 compared to $1.5 million in 2015. Interest capitalization was $16.2 million in 2015. There was no interest capitalization in 2016 as the drillship construction program was completed in 2015. Additionally, our foreign currency exchange losses increased to $9.7 million in 2016 compared to $3.9 million in 2015 primarily due to the devaluation of the Egyptian pound. Partially offsetting these increases, our debt retirements in late 2015 and early 2016 resulted in a reduction in interest expense in 2016.
Provision for income taxes
In 2016, we recognized an income tax provision of $5.0 million on pretax income of $325.6 million. The 2016 tax provision was primarily due to the current year operations offset by the amortization of deferred intercompany gains and losses and deferred tax benefit as a result of current year restructuring.
In 2015, we recognized an income tax provision of $64.4 million on pretax income of $157.7 million. The 2015 tax provision was primarily due to the establishment of a valuation allowance on the U.S. deferred tax assets, impairments of assets in foreign jurisdictions with no tax benefits, and an increase in income in high-tax jurisdictions, offset by additional tax benefit for the U.S.-impaired assets and an increase in income in low-tax jurisdictions.
31
2015 Compared to 2014
A summary of our consolidated results of operations follows (in millions):
Year ended December 31, | ||||||||||||||
2015 | 2014 | Change | % Change | |||||||||||
Deepwater: | ||||||||||||||
Revenues | $ | 747.8 | $ | 179.8 | $ | 568.0 | 316 | % | ||||||
Operating expenses: | ||||||||||||||
Direct operating costs (excluding items below) | 276.6 | 87.8 | 188.8 | 215 | % | |||||||||
Depreciation and amortization | 94.6 | 24.4 | 70.2 | 288 | % | |||||||||
Income from operations | $ | 376.6 | $ | 67.6 | $ | 309.0 | 457 | % | ||||||
Jack-ups: | ||||||||||||||
Revenues | $ | 1,389.2 | $ | 1,644.6 | $ | (255.4 | ) | (16 | )% | |||||
Operating expenses: | ||||||||||||||
Direct operating costs (excluding items below) | 716.5 | 903.5 | (187.0 | ) | (21 | )% | ||||||||
Depreciation and amortization | 283.9 | 283.5 | 0.4 | — | % | |||||||||
Other operating items | 328.8 | 544.9 | (216.1 | ) | n/m | |||||||||
Income (loss) from operations | $ | 60.0 | $ | (87.3 | ) | $ | 147.3 | n/m | ||||||
Unallocated costs and other: | ||||||||||||||
Operating expenses: | ||||||||||||||
Depreciation and amortization | $ | 12.9 | $ | 14.7 | $ | (1.8 | ) | (12 | )% | |||||
Selling, general and administrative | 115.8 | 125.8 | (10.0 | ) | (8 | )% | ||||||||
Other operating items | 0.8 | 6.5 | (5.7 | ) | n/m | |||||||||
Loss from operations | $ | (129.5 | ) | $ | (147.0 | ) | $ | 17.5 | (12 | )% | ||||
Total company: | ||||||||||||||
Revenues | $ | 2,137.0 | $ | 1,824.4 | $ | 312.6 | 17 | % | ||||||
Direct operating costs (excluding items below) | 993.1 | 991.3 | 1.8 | — | % | |||||||||
Depreciation and amortization | 391.4 | 322.6 | 68.8 | 21 | % | |||||||||
Selling, general and administrative | 115.8 | 125.8 | (10.0 | ) | (8 | )% | ||||||||
Other operating items | 329.6 | 551.4 | (221.8 | ) | n/m | |||||||||
Income (loss) from operations | 307.1 | (166.7 | ) | 473.8 | n/m | |||||||||
Other (expense), net | (149.4 | ) | (102.9 | ) | (46.5 | ) | 45 | % | ||||||
Income (loss) from continuing operations before income taxes | 157.7 | (269.6 | ) | 427.3 | n/m | |||||||||
Provision (benefit) for income taxes | 64.4 | (150.7 | ) | 215.1 | n/m | |||||||||
Income (loss) from continuing operations | 93.3 | (118.9 | ) | 212.2 | n/m | |||||||||
Discontinued operations, net of tax | — | 4.0 | (4.0 | ) | n/m | |||||||||
Net income (loss) | $ | 93.3 | $ | (114.9 | ) | $ | 208.2 | n/m | ||||||
“n/m” means not meaningful. | ||||||||||||||
32
Revenues
Consolidated. The increase in consolidated revenue is described below.
Deepwater. An analysis of the net changes in revenues for 2015, compared to 2014, are set forth below (in millions):
Increase | |||
Addition of the Rowan Reliance and Rowan Relentless in 2015 | $ | 290.4 | |
Addition of the Rowan Renaissance and Rowan Resolute in 2014 | 269.9 | ||
Revenues for reimbursable costs and other, net | 7.7 | ||
Increase | $ | 568.0 | |
Jack-ups. An analysis of the net changes in revenues for 2015, compared to 2014, are set forth below (in millions):
Decrease | |||
Lower jack-up utilization | $ | (206.9 | ) |
Lower average day rates for existing rigs | (30.6 | ) | |
Revenues for reimbursable costs and other, net | (17.9 | ) | |
Decrease | $ | (255.4 | ) |
Direct operating costs
Consolidated. An analysis of the net changes in direct operating costs for 2015, compared to 2014, are set forth below (in millions):
Increase (decrease) | |||
2015 Compared to 2014: | |||
Addition of the Rowan Reliance and Rowan Relentless in 2015 | $ | 76.4 | |
Addition of the Rowan Renaissance and Rowan Resolute in 2014 | 68.4 | ||
Return to work of the Rowan Gorilla III, Rowan Gorilla VI and the Rowan Viking | 32.2 | ||
Decrease due to idle, sold or cold-stacked rigs | (75.8 | ) | |
Reduction of regional shorebases | (13.5 | ) | |
Reimbursable costs | (10.1 | ) | |
Other, net - primarily repair and maintenance and personnel costs for other rigs | (75.8 | ) | |
Net increase | $ | 1.8 | |
Depreciation and amortization
The increase in depreciation was primarily due to the addition of the four drillships.
Selling, general and administrative
Selling, general and administrative expenses decreased primarily due to cost-reduction measures, which included reductions in headcount and fewer professional services.
Other operating items
As a result of the extended downturn in the market for offshore contract drilling services, we conducted an impairment test of our assets in 2015 and determined that the carrying values for ten of our jack-up rigs were not recoverable from their undiscounted expected future cash flows and exceeded their fair values. As a result, we recognized an aggregate non-cash asset impairment charge in 2015 in the amount of $329.8 million. In 2014, we recognized non-cash asset impairment charges totaling $565.7 million on twelve jack-up rigs and a charge of $8.3 million for impairment of a Company aircraft, which we sold later in 2014 at an immaterial loss.
In 2015, we sold the Rowan Louisiana, Rowan Alaska and Rowan Juneau jack-up drilling rigs in separate sales and recognized a net gain totaling $8.8 million on proceeds of $15.9 million.
33
In 2015, we recognized a $7.6 million charge for the termination of a contract in connection with refurbishment work on the Rowan Gorilla III.
In 2014, the Company settled its litigation with the owners and operators of a tanker that collided with the Rowan EXL I in 2012 and received $20.9 million in cash as compensation for damages incurred in 2012 for repair costs to and loss of use of the rig. We recognized the cash receipt in 2014 as a component of operating income.
Provision (benefit) for income taxes
In 2015, we recognized an income tax provision of $64.4 million on pretax income of $157.7 million. The 2015 tax provision was primarily due to the establishment of a valuation allowance on the U.S. deferred tax assets, impairments of assets in foreign jurisdictions with no tax benefits, and an increase in income in high-tax jurisdictions, offset by additional tax benefit for the U.S.-impaired assets and an increase in income in low-tax jurisdictions.
In 2014, we recognized an income tax benefit of $150.7 million on a $269.6 million pretax loss from continuing operations. The benefit was primarily due to the acceleration of previously deferred intercompany gains and losses associated with impaired assets, the amortization of deferred intercompany gains and losses related to outbounding certain U.S.-owned rigs to our non-U.S. subsidiaries in prior years, and the settlement agreement reached with the U.S. Internal Revenue Service in September 2014.
Discontinued operations, net of tax
In 2014, we sold a land rig that was retained in connection with the 2011 sale of the Company's manufacturing operations and recognized a gain on sale of $4.0 million, net of tax effects.
LIQUIDITY AND CAPITAL RESOURCES
Key balance sheet amounts and ratios at December 31 were as follows (dollars in millions):
2016 | 2015 | ||||||
Cash and cash equivalents | $ | 1,255.5 | $ | 484.2 | |||
Current assets | $ | 1,580.3 | $ | 921.3 | |||
Current liabilities | $ | 483.8 | $ | 328.7 | |||
Current ratio | 3.27 | 2.80 | |||||
Current portion of long-term debt | $ | 126.8 | $ | — | |||
Long-term debt, less current portion | $ | 2,553.4 | $ | 2,692.4 | |||
Shareholders' equity | $ | 5,113.9 | $ | 4,772.5 | |||
Debt to capitalization ratio | 34 | % | 36 | % | |||
Sources and uses of cash and cash equivalents were as follows (in millions):
2016 | 2015 | 2014 | |||||||||
Net operating cash flows | $ | 900.6 | $ | 996.9 | $ | 423.0 | |||||
Borrowings, net of issue costs | 491.3 | 220.0 | 792.7 | ||||||||
Reduction of long-term debt | (511.8 | ) | (317.9 | ) | — | ||||||
Capital expenditures | (117.6 | ) | (722.9 | ) | (1,958.2 | ) | |||||
Payment of cash dividends | — | (50.5 | ) | (37.7 | ) | ||||||
Proceeds from disposals of property and equipment | 6.2 | 19.4 | 22.0 | ||||||||
Proceeds from exercise of share options | — | — | 4.7 | ||||||||
All other, net | 2.6 | — | (0.1 | ) | |||||||
Total net source (use) | $ | 771.3 | $ | 145.0 | $ | (753.6 | ) | ||||
Operating Cash Flows
Cash flows from operations decreased to approximately $901 million in 2016 from $997 million in 2015 primarily due to lower drilling activity, the cash loss on early extinguishment of debt, combined with uses of cash for current assets and liabilities, partially offset by deferred revenues and changes in other non-current assets and liabilities. Operating cash flows for 2015 compared to
34
2014 were positively impacted by the startup of the drillships in 2014 and 2015 and favorable changes in working capital, including lower pension contributions in 2015.
We have not provided deferred income taxes on certain undistributed earnings of non-U.K. subsidiaries. Generally, earnings of non-U.K. subsidiaries in which RCI does not have a direct or indirect ownership interest can be distributed to Rowan plc without imposition of either U.K. or local country tax. It is generally our policy and intention to permanently reinvest earnings of non-U.S. subsidiaries of RCI outside the U.S. However, we have recognized taxes related to the earnings of certain subsidiaries that are not permanently reinvested or that will not be permanently reinvested in the future.
As of December 31, 2016, RCI's portion of the unremitted earnings of its non-U.S. subsidiaries that could be includable in taxable income of RCI, if distributed, was approximately $376 million. If facts and circumstances cause us to change our expectations regarding future tax consequences, the resulting tax impact could have a material effect on our consolidated financial statements. Should the non-U.S. subsidiaries of RCI make a distribution from these earnings, we may be subject to additional income taxes. It is not practicable to estimate the amount of deferred tax liability related to the undistributed earnings, and RCI's non-U.S. subsidiaries have no plan to distribute earnings in a manner that would cause them to be subject to U.S., U.K. or other local country taxation.
At December 31, 2016, RCI’s non-U.S. subsidiaries held approximately $328 million of the $1.256 billion of consolidated cash and cash equivalents. Management believes the Company has significant net assets, liquidity, contract backlog and/or other financial resources available to meet our operational and capital investment requirements and otherwise allow us to continue to maintain our policy of reinvesting such undistributed earnings outside the U.K. and U.S. indefinitely.
Backlog
Our backlog by geographic area as of the date of our most recent Fleet Status Report is presented below (in millions):
February 14, 2017 | |||||||||||
Jack-ups | Deepwater | Total | |||||||||
US GOM | $ | 21.5 | $ | 486.7 | $ | 508.2 | |||||
Middle East (1) | 914.2 | — | 914.2 | ||||||||
North Sea | 189.8 | — | 189.8 | ||||||||
Central and South America | 72.4 | — | 72.4 | ||||||||
Total backlog | $ | 1,197.9 | $ | 486.7 | $ | 1,684.6 | |||||
(1) Backlog does not account for the anticipated changes to the Middle East fleet due to the formation of the 50/50 joint venture with Saudi Aramco expected to commence operations in second quarter 2017 (see Part I, Item 1, "Business" of this Form 10-K). | |||||||||||
We estimate our backlog will be realized as follows (in millions):
February 14, 2017 | |||||||||||
Jack-ups | Deepwater | Total | |||||||||
2017 | $ | 554.7 | $ | 350.8 | $ | 905.5 | |||||
2018 | 294.5 | 135.9 | 430.4 | ||||||||
2019 | 65.0 | — | 65.0 | ||||||||
2020 | 65.0 | — | 65.0 | ||||||||
2021 and later years | 218.7 | — | 218.7 | ||||||||
Total backlog | $ | 1,197.9 | $ | 486.7 | $ | 1,684.6 | |||||
Backlog does not account for the anticipated changes to the Middle East fleet due to the formation of the 50/50 joint venture with Saudi Aramco expected to commence operations in second quarter 2017 (see Part I, Item 1, "Business" of this Form 10-K). | |||||||||||
Our contract backlog represents remaining contractual terms and may not reflect actual revenue due to renegotiations or a number of factors such as rig downtime, out of service time, estimated contract durations, customer concessions or contract cancellations.
About 49% of our remaining available rig days in 2017 and 23% of available rig days in 2018 are included in backlog as revenue producing days as of February 14, 2017, excluding cold-stacked rigs. As of that date, we had two jack-ups that were cold-stacked and six jack-ups and two drillships that were available.
35
Since 2014, we have recognized asset impairment charges on several of our jack-up drilling units as a result of the decline in market conditions and the expectation of future demand and day rates. If market conditions deteriorate further, we could be required to recognize additional impairment charges in future periods.
Investing Activities
Capital expenditures in 2016 totaled $117.6 million and included the following:
• | $68.5 million for improvements to the existing fleet, including contractually required modifications; and |
• | $49.1 million for rig equipment and other. |
We currently estimate our 2017 capital expenditures will range from approximately $105-$115 million, primarily for fleet maintenance, rig equipment, spares and other. This amount excludes any contractual modifications that may arise due to our securing additional work.
We expect to fund our 2017 capital expenditures using available cash and cash flows from operations.
Our capital budget reflects an appropriation of money that we may or may not spend, and the timing of such expenditures may change. We will periodically review and adjust the capital budget as necessary based upon current and forecasted cash flows and liquidity, anticipated market conditions in our business, the availability of financial resources, and alternative uses of capital to enhance shareholder value.
Capital expenditures for 2015 totaled $722.9 million and included $541.3 million towards drillship construction, including costs for mobilization, commissioning, riser gas-handling equipment, software certifications and spares; $132.5 million for improvements to the existing fleet, including contractually required modifications; and $49.1 million for rig equipment inventory and other. With the delivery of our fourth and final drillship in March 2015, we concluded our ultra-deepwater drillship construction program. We took delivery of the first three drillships in 2014.
Capital expenditures for 2014 totaled $2.0 billion and included $1.6 billion towards drillship construction; $345 million for improvements to the existing fleet, including contractually required modifications; and $53 million for rig equipment, spares and other.
Financing Activities
In January 2014, we completed the issuance and sale in a public offering of $400 million aggregate principal amount of 4.75% Senior Notes due 2024 (the "2024 Notes"), and $400 million aggregate principal amount of 5.85% Senior Notes due 2044 (the "2044 Notes"). Net proceeds of the offering were approximately $792 million, which the Company used for its drillship construction program and for general corporate purposes.
In May 2015, we amended and restated our revolving credit agreement to increase the borrowing capacity under the facility from $1 billion to $1.5 billion and to extend the maturity date by one year to January 2020. In January 2016, we further amended the revolving credit agreement to extend the maturity date by one year to January 2021. Availability under the facility is $1.5 billion through January 23, 2019, declining to $1.44 billion through January 23, 2020, and to approximately $1.29 billion through the maturity in 2021. There were no amounts drawn under the revolving credit agreement at December 31, 2016.
Advances under our revolving credit agreement bear interest at LIBOR or Base Rate plus an applicable margin, which is dependent upon our credit ratings. The applicable margins for LIBOR and Base Rate advances range from 1.125% - 2.0% and 0.125% - 1.0%, respectively. We are also required to pay a commitment fee on undrawn amounts of the credit agreement, which ranges from 0.125% to 0.35%, depending on our credit ratings.
The revolving credit agreement requires us to maintain a total debt-to-capitalization ratio of less than or equal to 60%. Additionally, the credit agreement has customary restrictive covenants that, including others, restrict our ability to incur certain debt and liens, enter into certain merger and acquisition agreements, sell, transfer, lease or otherwise dispose of all or substantially all of our assets and substantially change the character of our business from contract drilling.
During 2015, we paid $101.1 million in cash to retire $97.9 million aggregate principal amount of the 5% Senior Notes due 2017 (the "2017 Notes") and 7.875% Senior Notes due 2019 (the "2019 Notes"), plus accrued interest, and recognized a $1.5 million loss on early extinguishment of debt.
During the first half of 2016, we paid $45.2 million in cash to retire $47.9 million aggregate principal amount of the 2017 Notes and 2019 Notes, and recognized a $2.4 million gain on early extinguishment of debt.
36
In December 2016, we commenced cash tender offers for $750 million aggregate principal amount of certain Senior Notes (as defined below) issued by the Company, which such tender offers expired on January 3, 2017. Senior Notes validly tendered and accepted for purchase prior to the early tender expiration time on December 16, 2016, received tender offer consideration plus an early tender premium. As a result of the tender offers, in December 2016, we paid $490.5 million to redeem $463.9 million aggregate principal amount of outstanding Senior Notes, consisting of $265.5 million of the 2017 Notes, $186.7 million of the 2019 Notes, $9.8 million of 4.875% Senior Notes due 2022 (the "2022 Notes") and $1.9 million of the 2024 Notes, and recognized a $33.6 million loss on the early extinguishment of debt which included approximately $5.9 million of bank and legal fees.
On December 19, 2016, we completed the issuance of $500 million aggregate principal amount of 7.375% Senior Notes due 2025 (the "2025 Notes") at a price of 100% of the principal amount. We used the net proceeds of the offering, approximately $492 million, along with cash on hand, to fund the redemption of Senior Notes related to the tender offers. $5.3 million of the cash paid to the underwriting banks in the form of the underwriters discount and structuring fee was expensed and included in the $33.6 million loss on early extinguishment of debt related to the December 2016 tender offers. Interest on the 2025 Notes is payable on June 15 and December 15 of each year, beginning on June 15, 2017. The 2025 Notes contain a provision whereby upon a change of control repurchase event, as defined in the indenture governing the 2025 Notes, we may be required to make an offer to repurchase all outstanding notes at a price in cash equal to 101% of the aggregate principal amount of the notes repurchased, plus any accrued and unpaid interest to the repurchase date. Otherwise, the 2025 Notes contain substantially the same provisions as the Company’s other Senior Notes.
In January 2017, at the expiration of the tender offers, we paid $32.8 million to redeem $34.6 million aggregate principal amount of outstanding Senior Notes, consisting of $0.1 million of the 2017 Notes, $0.9 million of the 2019 Notes and $33.6 million of the 2022 Notes.
On January 9, 2017, we called for redemption $92.1 million aggregate principal amount of the 2017 Notes that remained outstanding and on February 8, 2017, we paid $94.0 million to redeem such notes.
As of December 31, 2016, we had $2.7 billion of outstanding long-term debt consisting of $92.2 million principal amount of the 2017 Notes; $209.8 million principal amount of the 2019 Notes; $690.2 million principal amount of the 2022 Notes; $398.1 million aggregate principal amount of the 2024 Notes; $500.0 million aggregate principal amount of the 2025 Notes; $400.0 million principal amount of 5.4% Senior Notes due 2042; and $400.0 million aggregate principal amount of the 2044 Notes (together, the “Senior Notes”). The Senior Notes are fully and unconditionally guaranteed on a senior and unsecured basis by Rowan plc (see Note 16 of Notes to Consolidated Financial Statements in Item 8 of this Form 10-K).
Annual interest payments on the Senior Notes are estimated to be approximately $150 million in 2017. No principal payments are required until each series’ final maturity date. Management believes that cash flows from operating activities, existing cash balances, and amounts available under the revolving credit facility will be sufficient to satisfy the Company’s cash requirements for the following twelve months.
Restrictive provisions in the Company’s bank credit facility agreement limit consolidated debt to 60% of book capitalization. Our consolidated debt to total capitalization ratio at December 31, 2016, was 34%.
Other provisions of our debt agreements limit the ability of the Company to create liens that secure debt, engage in sale and leaseback transactions, merge or consolidate with another company and, in the event of noncompliance, restrict investment activities and asset purchases and sales, among other things. The Company was in compliance with its debt covenants at December 31, 2016, and expects to remain in compliance throughout 2017.
37
Cash Dividends
Prior to 2014, the Company had not paid a quarterly cash dividend since 2008. Cash dividends for 2014 and 2015 are set forth below:
Cash dividend per share | Declaration date | Record date | Payment date | ||||||
2014: | |||||||||
Second quarter | $ | 0.10 | 4/25/2014 | 5/5/2014 | 5/20/2014 | ||||
Third quarter | 0.10 | 7/31/2014 | 8/11/2014 | 8/26/2014 | |||||
Fourth quarter | 0.10 | 10/30/2014 | 11/11/2014 | 11/25/2014 | |||||
2015: | |||||||||
First quarter | $ | 0.10 | 1/29/2015 | 2/9/2015 | 3/3/2015 | ||||
Second quarter | 0.10 | 5/1/2015 | 5/12/2015 | 5/26/2015 | |||||
Third quarter | 0.10 | 7/31/2015 | 8/11/2015 | 8/25/2015 | |||||
Fourth quarter | 0.10 | 10/29/2015 | 11/9/2015 | 11/23/2015 | |||||
In January 2016, the Company announced that it had discontinued its quarterly dividend.
Off-balance Sheet Arrangements and Contractual Obligations
The Company had no off-balance sheet arrangements as of December 31, 2016 or 2015, other than operating lease obligations and other commitments in the ordinary course of business.
The following is a summary of our contractual obligations at December 31, 2016, including obligations recognized on our balance sheet and those not required to be recognized (in millions):
Payments due by period | |||||||||||||||||||
Total | Within 1 year | 2 to 3 years | 4 to 5 years | After 5 years | |||||||||||||||
Long-term debt principal payment | $ | 2,690 | $ | 92 | $ | 210 | $ | — | $ | 2,388 | |||||||||
Interest on Senior Notes | 1,866 | 154 | 295 | 269 | 1,148 | ||||||||||||||
Purchase obligations | 62 | 60 | 2 | — | — | ||||||||||||||
Operating leases | 35 | 7 | 12 | 5 | 11 | ||||||||||||||
Total | $ | 4,653 | $ | 313 | $ | 519 | $ | 274 | $ | 3,547 | |||||||||
As of December 31, 2016, our liability for unrecognized tax benefits related to uncertain tax positions totaled $135.0 million, inclusive of interest and penalties. Due to the high degree of uncertainty related to these tax matters, we are unable to make a reasonably reliable estimate as to the timing of cash settlement with the respective taxing authorities, and we have therefore excluded this amount from the contractual obligations presented in the table above.
We periodically employ letters of credit in the normal course of our business, and had outstanding letters of credit of approximately $2.9 million at December 31, 2016.
If the new joint venture company has insufficient cash from operations or financing is not available to fund the cost of the newbuild jack-up rigs, Rowan will be obligated to contribute funds to purchase such rigs, up to a maximum amount of $1.25 billion for all 20 newbuild jack-up rigs (see Part I, Item 1, "Business" of this Form 10-K).
Pension Obligations
Minimum contributions under defined benefit pension plans are determined based upon actuarial calculations of pension assets and liabilities that involve, among other things, assumptions about long-term asset returns and interest rates. Similar calculations were used to estimate pension costs and obligations as reflected in our consolidated financial statements (see “Critical Accounting Policies and Management Estimates – Pension and other postretirement benefits”). As of December 31, 2016, our financial statements reflected an aggregate unfunded pension liability of $228 million. We expect to make minimum contributions to our defined benefit pension plans of approximately $30 million in 2017, and we will continue to make significant pension contributions over the next several years. Additional funding may be required if, for example, future interest rates or pension asset values decline or there are changes in legislation.
38
Contingent Liabilities
We are involved in various legal proceedings incidental to our businesses and are vigorously defending our position in all such matters. The Company believes that there are no known contingencies, claims or lawsuits that could have a material effect on its financial position, results of operations or cash flows.
CRITICAL ACCOUNTING POLICIES AND MANAGEMENT ESTIMATES
Our significant accounting policies are presented in Note 2 of “Notes to Consolidated Financial Statements” in Item 8 of this Form 10-K. These policies and management judgments, assumptions and estimates made in their application underlie reported amounts of assets and liabilities at the date of the financial statements and reported amounts of revenues and expenses during the reporting period. We believe that our most critical accounting policies and management estimates involve carrying values of long-lived assets, pension and other postretirement benefit liabilities and costs (specifically assumptions used in actuarial calculations), and income taxes (particularly our estimated reserves for uncertain tax positions), as changes in such policies and/or estimates would produce significantly different amounts from those reported herein.
Depreciation and impairments of long-lived assets
We depreciate our assets using the straight-line method over their estimated useful service lives after allowing for salvage values. We estimate useful lives and salvage values by applying judgments and assumptions that reflect both historical experience and expectations regarding future operations, utilization and performance. Useful lives may be affected by a variety of factors including technological advances in methods of oil and gas exploration, changes in market or economic conditions, and changes in laws or regulations that affect the drilling industry. Applying different judgments and assumptions in establishing useful lives and salvage values may result in values that differ from recorded amounts. In connection with the completion of an asset impairment test in 2014, we reevaluated our policy with respect to salvage values and, in light of our historical experience, we reduced salvage values for our jack-up rigs from 20 percent to 10 percent of historical cost.
We evaluate the carrying value of our property and equipment, primarily our drilling rigs, whenever events or changes in circumstances indicate that their carrying values may not be recoverable. Potential impairment indicators include rapid declines in commodity prices, stock prices, rig utilization and day rates, among others. The offshore drilling industry has historically been highly cyclical and it is not unusual for rigs to be underutilized or idle for extended periods of time and subsequently resume full or near full utilization when business cycles improve. Similarly, during periods of excess supply, rigs may be contracted at or near cash break-even rates for extended periods. Impairment situations may arise with respect to specific rigs, specific categories or classes of rigs, or rigs in a certain geographic region. Our rigs are mobile and may generally be moved from regions with excess supply, if economically feasible.
Asset impairment evaluations are, by nature, highly subjective. In most instances, they involve expectations of future cash flows to be generated by our drilling rigs and are based on management's judgments and assumptions regarding future industry conditions and operations, as well as management's estimates of future expected utilization, contract rates, expense levels and capital requirements. The estimates, judgments, and assumptions used by management in the application of our asset impairment policies reflect both historical experience and an assessment of current operational, industry, market, economic and political environments. The use of different estimates, judgments, assumptions (including discount rates) and expectations regarding future industry conditions and operations would likely result in materially different asset carrying values and operating results.
In 2016, 2015 and 2014, we conducted impairment tests of our assets and determined that the carrying values of certain jack-up rigs were not recoverable from their undiscounted cash flows and exceeded their fair values. As a result, we recognized non-cash asset impairment charges of approximately $34 million, $330 million and $566 million in 2016, 2015 and 2014, respectively (see Note 2 of Notes to Consolidated Financial Statements in Item 8 of this Form 10-K).
Pension and other postretirement benefits
Our pension and other postretirement benefit liabilities and costs are based upon actuarial computations that reflect our assumptions about future events, including long-term asset returns, interest rates, annual compensation increases, mortality rates and other factors. Key assumptions at December 31, 2016, included weighted average discount rates of 4.29% and 4.53% used to determine pension benefit obligations and net cost, respectively, an expected long-term rate of return on pension plan assets of 7.15% and annual healthcare cost increases ranging from 6.9% in 2016 to 4.5% in 2038 and beyond. The assumed discount rate is based upon the average yield for Moody’s Aa-rated corporate bonds, and the rate of return assumption reflects a probability distribution of expected long-term returns that is weighted based upon plan asset allocations. A one-percentage-point decrease in the assumed discount rate would increase our recorded pension and other postretirement benefit liabilities by approximately $93.7 million, while a one-percentage-point decrease (increase) in the expected long-term rate of return on plan assets would increase (decrease)
39
annual net benefits cost by approximately $5.4 million. A one-percentage-point increase in the assumed healthcare cost trend rate has no impact on 2016 other postretirement benefit cost. To develop the expected long-term rate of return on assets assumption, we considered the current level of expected returns on risk-free investments (primarily government bonds), the historical level of the risk premium associated with the plans’ other asset classes, and the expectations for future returns of each asset class. The expected return for each asset class was then weighted based upon the current asset allocation to develop the expected long-term rate of return on assets assumption for the plan, which was reduced to 7.15% at December 31, 2016, from 7.30% at December 31, 2015.
Income taxes
In accordance with accounting guidelines for income tax uncertainties, we evaluate each tax position to determine if it is more likely than not that the tax position will be sustained upon examination, based on its merits. A tax position that meets the more-likely-than-not recognition threshold is subject to a measurement assessment to determine the amount of benefit to recognize in income for the period, and a reserve, if any. Our income tax returns are subject to audit by U.S. federal, state, and foreign tax authorities. Determinations by such taxing authorities that differ materially from our recorded estimates, either favorably or unfavorably, may have a material impact on our results of operations, financial position and cash flows. We believe our reserve for uncertain tax positions totaling $120 million at December 31, 2016, is properly recorded in accordance with the accounting guidelines.
Recent Accounting Pronouncements
See Note 2 of Notes to Consolidated Financial Statements in Item 8 of this Form 10-K.
ITEM 7A. QUANTITATIVE AND QUALITATIVE DISCLOSURES ABOUT MARKET RISKS
Interest rate risk – Our outstanding debt at December 31, 2016, consisted entirely of fixed-rate debt with a carrying value of $2.680 billion and a weighted-average annual interest rate of 5.8%. Due to the fixed-rate nature of our debt, management believes the risk of loss due to changes in market interest rates is not material.
Currency exchange rate risk – A substantial majority of our revenues are received in U.S. dollars, which is our functional currency. However, in certain countries in which we operate, local laws or contracts may require us to receive some payment in the local currency. We are exposed to foreign currency exchange risk to the extent the amount of our monetary assets denominated in the foreign currency differs from our obligations in that foreign currency. In order to mitigate the effect of exchange rate risk, we attempt to limit foreign currency holdings to the extent they are needed to pay liabilities in the local currency. Prior to 2016, we entered into spot purchases or short-term derivative transactions, such as forward exchange contracts, with one-month durations. We did not enter into such transactions for the purpose of speculation, trading or investing in the market and we believe that our use of forward exchange contracts has not exposed us to material credit risk or other material market risk. Although our risk policy allows us to enter into such forward exchange contracts, we do not currently anticipate entering into such transactions in the future and had no such contracts outstanding as of December 31, 2016.
Commodity price risk – Fluctuating commodity prices affect our future earnings materially to the extent that they influence demand for our products and services.
Fair Value Derivative Asset – At December 31, 2016, the fair value of the Contingent Payment Derivative related to the FMOG Provision was $6.1 million. We estimate the fair value of this instrument using Monte Carlo simulation which takes into account a variety of factors including the Price Targets, the WTI Spot price, the expected volatility, the risk-free interest rate, the slope of the WTI forward curve, and the remaining contractual term of the FMOG Provision. We are required to revalue this instrument each quarter. We believe that the assumptions that have the greatest impact on the determination of fair value is the WTI Spot Price on the valuation date and the expected volatility. In January 2017, a portion of the Contingent Payment Derivative was settled with a $6.0 million payment received by the Company. (see Note 1 of Notes to Consolidated Financial Statements in Item 8 of this Form 10-K). The following table illustrates the potential effect on the fair value of the derivative asset at December 31, 2016 from changes in the assumptions made (in millions):
Increase (Decrease) in Asset Value | |||
10% decrease in WTI spot price | $ | (3.3 | ) |
10% decrease in expected volatility | $ | 0.2 | |
40
ITEM 8. FINANCIAL STATEMENTS AND SUPPLEMENTARY DATA
INDEX | Page |
41
REPORT OF INDEPENDENT REGISTERED PUBLIC ACCOUNTING FIRM
To the Board of Directors and Shareholders of
Rowan Companies plc
Houston, Texas
We have audited the accompanying consolidated balance sheets of Rowan Companies plc and subsidiaries (the “Company”) as of December 31, 2016 and 2015, and the related consolidated statements of operations, comprehensive income (loss), changes in shareholders’ equity, and cash flows for each of the three years in the period ended December 31, 2016. Our audits also included the financial statement schedule listed in the Index at Item 15. These financial statements and financial statement schedule are the responsibility of the Company’s management. Our responsibility is to express an opinion on the financial statements and financial statement schedule based on our audits.
We conducted our audits in accordance with the standards of the Public Company Accounting Oversight Board (United States). Those standards require that we plan and perform the audit to obtain reasonable assurance about whether the financial statements are free of material misstatement. An audit includes examining, on a test basis, evidence supporting the amounts and disclosures in the financial statements. An audit also includes assessing the accounting principles used and significant estimates made by management, as well as evaluating the overall financial statement presentation. We believe that our audits provide a reasonable basis for our opinion.
In our opinion, such consolidated financial statements present fairly, in all material respects, the financial position of Rowan Companies plc and subsidiaries at December 31, 2016 and 2015, and the results of their operations and their cash flows for each of the three years in the period ended December 31, 2016, in conformity with accounting principles generally accepted in the United States of America. Also, in our opinion, such financial statement schedule, when considered in relation to the basic consolidated financial statements taken as a whole, present fairly, in all material respects, the information set forth therein.
We have also audited, in accordance with the standards of the Public Company Accounting Oversight Board (United States), the Company’s internal control over financial reporting as of December 31, 2016, based on the criteria established in Internal Control – Integrated Framework (2013) issued by the Committee of Sponsoring Organizations of the Treadway Commission and our report dated February 24, 2017 expressed an unqualified opinion on the Company’s internal control over financial reporting.
/s/ DELOITTE & TOUCHE LLP
Houston, Texas
February 24, 2017
42
ROWAN COMPANIES PLC
MANAGEMENT’S REPORT ON INTERNAL CONTROL OVER FINANCIAL REPORTING
The management of Rowan is responsible for establishing and maintaining adequate internal control over financial reporting for the Company as defined in Rules 13a-15(f) and 15d-15(f) of the Securities Exchange Act of 1934, as amended. Our internal controls were designed to provide reasonable assurance as to the reliability of our financial reporting and the preparation and presentation of consolidated financial statements in accordance with accounting principles generally accepted in the United States, as well as to safeguard assets from unauthorized use or disposition.
We are required to assess the effectiveness of our internal controls relative to a suitable framework. The Committee of Sponsoring Organizations of the Treadway Commission (COSO) in its Internal Control - Integrated Framework (2013), developed a formalized, organization-wide framework that embodies five interrelated components — the control environment, risk assessment, control activities, information and communication and monitoring, as they relate to three internal control objectives — operating effectiveness and efficiency, financial reporting reliability and compliance with laws and regulations.
Our assessment included an evaluation of the design of our internal control over financial reporting relative to COSO and testing of the operational effectiveness of our internal control over financial reporting. Based upon our assessment, we have concluded that our internal controls over financial reporting were effective as of December 31, 2016.
The independent registered public accounting firm Deloitte & Touche LLP has audited Rowan’s consolidated financial statements and financial statement schedule included in our 2016 Annual Report on Form 10-K and has issued an attestation report on the Company’s internal control over financial reporting.
/s/ THOMAS P. BURKE | /s/ STEPHEN M. BUTZ |
Thomas P. Burke | Stephen M. Butz |
President and Chief Executive Officer | Executive Vice President and Chief Financial Officer |
February 24, 2017 | February 24, 2017 |
43
REPORT OF INDEPENDENT REGISTERED PUBLIC ACCOUNTING FIRM
To the Board of Directors and Shareholders of
Rowan Companies plc
Houston, Texas
We have audited the internal control over financial reporting of Rowan Companies plc and subsidiaries (the "Company") as of December 31, 2016, based on criteria established in Internal Control – Integrated Framework (2013) issued by the Committee of Sponsoring Organizations of the Treadway Commission. The Company's management is responsible for maintaining effective internal control over financial reporting and for its assessment of the effectiveness of internal control over financial reporting, included in the accompanying Management’s Report on Internal Control Over Financial Reporting. Our responsibility is to express an opinion on the Company's internal control over financial reporting based on our audit.
We conducted our audit in accordance with the standards of the Public Company Accounting Oversight Board (United States). Those standards require that we plan and perform the audit to obtain reasonable assurance about whether effective internal control over financial reporting was maintained in all material respects. Our audit included obtaining an understanding of internal control over financial reporting, assessing the risk that a material weakness exists, testing and evaluating the design and operating effectiveness of internal control based on the assessed risk, and performing such other procedures as we considered necessary in the circumstances. We believe that our audit provides a reasonable basis for our opinion.
A company's internal control over financial reporting is a process designed by, or under the supervision of, the company's principal executive and principal financial officers, or persons performing similar functions, and effected by the company's board of directors, management, and other personnel to provide reasonable assurance regarding the reliability of financial reporting and the preparation of financial statements for external purposes in accordance with generally accepted accounting principles. A company's internal control over financial reporting includes those policies and procedures that (1) pertain to the maintenance of records that, in reasonable detail, accurately and fairly reflect the transactions and dispositions of the assets of the company; (2) provide reasonable assurance that transactions are recorded as necessary to permit preparation of financial statements in accordance with generally accepted accounting principles, and that receipts and expenditures of the company are being made only in accordance with authorizations of management and directors of the company; and (3) provide reasonable assurance regarding prevention or timely detection of unauthorized acquisition, use, or disposition of the company's assets that could have a material effect on the financial statements.
Because of the inherent limitations of internal control over financial reporting, including the possibility of collusion or improper management override of controls, material misstatements due to error or fraud may not be prevented or detected on a timely basis. Also, projections of any evaluation of the effectiveness of the internal control over financial reporting to future periods are subject to the risk that the controls may become inadequate because of changes in conditions, or that the degree of compliance with the policies or procedures may deteriorate.
In our opinion, the Company maintained, in all material respects, effective internal control over financial reporting as of December 31, 2016, based on the criteria established in Internal Control – Integrated Framework (2013) issued by the Committee of Sponsoring Organizations of the Treadway Commission.
We have also audited, in accordance with the standards of the Public Company Accounting Oversight Board (United States), the consolidated financial statements and financial statement schedule as of and for the year ended December 31, 2016 of the Company and our report dated February 24, 2017 expressed an unqualified opinion on those financial statements and financial statement schedule.
/s/ DELOITTE & TOUCHE LLP
Houston, Texas
February 24, 2017
44
ROWAN COMPANIES PLC AND SUBSIDIARIES
CONSOLIDATED STATEMENTS OF OPERATIONS
(In millions, except per share amounts)
Years ended December 31, | |||||||||||
2016 | 2015 | 2014 | |||||||||
REVENUES | $ | 1,843.2 | $ | 2,137.0 | $ | 1,824.4 | |||||
COSTS AND EXPENSES: | |||||||||||
Direct operating costs (excluding items below) | 778.2 | 993.1 | 991.3 | ||||||||
Depreciation and amortization | 402.9 | 391.4 | 322.6 | ||||||||
Selling, general and administrative | 102.1 | 115.8 | 125.8 | ||||||||
(Gain) loss on disposals of property and equipment | 8.7 | (7.7 | ) | (1.7 | ) | ||||||
Gain on litigation settlement | — | — | (20.9 | ) | |||||||
Material charges and other operating items | 32.9 | 337.3 | 574.0 | ||||||||
Total costs and expenses | 1,324.8 | 1,829.9 | 1,991.1 | ||||||||
INCOME (LOSS) FROM OPERATIONS | 518.4 | 307.1 | (166.7 | ) | |||||||
OTHER INCOME (EXPENSE): | |||||||||||
Interest expense, net of interest capitalized | (155.5 | ) | (145.3 | ) | (103.9 | ) | |||||
Interest income | 3.8 | 1.1 | 1.8 | ||||||||
Loss on debt extinguishment | (31.2 | ) | (1.5 | ) | — | ||||||
Other - net | (9.9 | ) | (3.7 | ) | (0.8 | ) | |||||
Total other (expense) - net | (192.8 | ) | (149.4 | ) | (102.9 | ) | |||||
INCOME (LOSS) FROM CONTINUING OPERATIONS BEFORE INCOME TAXES | 325.6 | 157.7 | (269.6 | ) | |||||||
Provision (benefit) for income taxes | 5.0 | 64.4 | (150.7 | ) | |||||||
INCOME (LOSS) FROM CONTINUING OPERATIONS | 320.6 | 93.3 | (118.9 | ) | |||||||
DISCONTINUED OPERATIONS, NET OF TAX | — | — | 4.0 | ||||||||
NET INCOME (LOSS) | $ | 320.6 | $ | 93.3 | $ | (114.9 | ) | ||||
INCOME (LOSS) PER SHARE - BASIC: | |||||||||||
Income (loss) from continuing operations | $ | 2.56 | $ | 0.75 | $ | (0.96 | ) | ||||
Discontinued operations | $ | — | $ | — | $ | 0.03 | |||||
Net income (loss) | $ | 2.56 | $ | 0.75 | $ | (0.93 | ) | ||||
INCOME (LOSS) PER SHARE - DILUTED: | |||||||||||
Income (loss) from continuing operations | $ | 2.55 | $ | 0.75 | $ | (0.96 | ) | ||||
Discontinued operations | $ | — | $ | — | $ | 0.03 | |||||
Net income (loss) | $ | 2.55 | $ | 0.75 | $ | (0.93 | ) | ||||
See Notes to Consolidated Financial Statements.
45
ROWAN COMPANIES PLC AND SUBSIDIARIES
CONSOLIDATED STATEMENTS OF COMPREHENSIVE INCOME (LOSS)
(In millions)
Years ended December 31, | |||||||||||
2016 | 2015 | 2014 | |||||||||
NET INCOME (LOSS) | $ | 320.6 | $ | 93.3 | $ | (114.9 | ) | ||||
OTHER COMPREHENSIVE INCOME (LOSS) | |||||||||||
Net changes in pension and other postretirement plan assets and benefit obligations recognized in other comprehensive income, net of income tax expense (benefit) of $(2.8), $3.4, and ($47.0), respectively | (5.1 | ) | 7.0 | (87.3 | ) | ||||||
Net reclassification adjustments for amounts recognized in net income (loss) as a component of net periodic benefit cost, net of income tax expense of $3.8, $7.4, and $5.3, respectively | 7.4 | 13.8 | 9.8 | ||||||||
2.3 | 20.8 | (77.5 | ) | ||||||||
COMPREHENSIVE INCOME (LOSS) | $ | 322.9 | $ | 114.1 | $ | (192.4 | ) | ||||
See Notes to Consolidated Financial Statements.
46
ROWAN COMPANIES PLC AND SUBSIDIARIES
CONSOLIDATED BALANCE SHEETS
(In millions, except par value)
December 31, | |||||||
2016 | 2015 | ||||||
ASSETS | |||||||
CURRENT ASSETS: | |||||||
Cash and cash equivalents | $ | 1,255.5 | $ | 484.2 | |||
Receivables - trade and other | 301.3 | 410.5 | |||||
Prepaid expenses and other current assets | 23.5 | 26.6 | |||||
Total current assets | 1,580.3 | 921.3 | |||||
PROPERTY AND EQUIPMENT: | |||||||
Drilling equipment | 8,965.3 | 8,930.4 | |||||
Other property and equipment | 135.5 | 137.7 | |||||
Property and equipment - gross | 9,100.8 | 9,068.1 | |||||
Less accumulated depreciation and amortization | 2,040.8 | 1,662.3 | |||||
Property and equipment - net | 7,060.0 | 7,405.8 | |||||
Other assets | 35.3 | 20.2 | |||||
$ | 8,675.6 | $ | 8,347.3 | ||||
LIABILITIES AND SHAREHOLDERS' EQUITY | |||||||
CURRENT LIABILITIES: | |||||||
Current portion of long-term debt | $ | 126.8 | $ | — | |||
Accounts payable - trade | 94.3 | 109.6 | |||||
Deferred revenues | 103.9 | 33.1 | |||||
Accrued liabilities | 158.8 | 186.0 | |||||
Total current liabilities | 483.8 | 328.7 | |||||
Long-term debt, less current portion | 2,553.4 | 2,692.4 | |||||
Other liabilities | 338.8 | 357.9 | |||||
Deferred income taxes - net | 185.7 | 195.8 | |||||
Commitments and contingent liabilities (Note 8) | |||||||
SHAREHOLDERS' EQUITY: | |||||||
Class A Ordinary Shares, $0.125 par value; 128.0 and 125.9 shares issued, respectively; 125.5 and 124.8 shares outstanding, respectively | 16.0 | 15.7 | |||||
Additional paid-in capital | 1,471.7 | 1,458.5 | |||||
Retained earnings | 3,830.4 | 3,509.8 | |||||
Cost of 2.5 and 1.1 treasury shares at December 31, 2016 and 2015, respectively | (7.2 | ) | (12.2 | ) | |||
Accumulated other comprehensive loss | (197.0 | ) | (199.3 | ) | |||
Total shareholders' equity | 5,113.9 | 4,772.5 | |||||
$ | 8,675.6 | $ | 8,347.3 | ||||
See Notes to Consolidated Financial Statements.
47
ROWAN COMPANIES PLC AND SUBSIDIARIES
CONSOLIDATED STATEMENTS OF CHANGES IN SHAREHOLDERS’ EQUITY
(In millions)
Shares outstanding | Class A Ordinary Shares/ Common stock | Additional paid-in capital | Retained earnings | Treasury shares | Accumulated other comprehensive income (loss) | Total shareholders' equity | ||||||||||||||||||||
Balance, January 1, 2014 | 124.3 | $ | 15.6 | $ | 1,407.0 | $ | 3,619.6 | $ | (6.0 | ) | $ | (142.4 | ) | $ | 4,893.8 | |||||||||||
Net shares issued (acquired) under share-based compensation plans | 0.3 | — | 1.6 | — | (2.0 | ) | — | (0.4 | ) | |||||||||||||||||
Share-based compensation | — | — | 28.4 | — | — | — | 28.4 | |||||||||||||||||||
Excess tax deficit from share-based awards | — | — | (0.1 | ) | — | — | — | (0.1 | ) | |||||||||||||||||
Retirement benefit adjustments, net of tax benefit of $41.7 | — | — | — | — | — | (77.5 | ) | (77.5 | ) | |||||||||||||||||
Dividends | — | — | — | (37.7 | ) | — | — | (37.7 | ) | |||||||||||||||||
Other | — | — | — | — | — | (0.2 | ) | (0.2 | ) | |||||||||||||||||
Net loss | — | — | — | (114.9 | ) | — | — | (114.9 | ) | |||||||||||||||||
Balance, December 31, 2014 | 124.6 | 15.6 | 1,436.9 | 3,467.0 | (8.0 | ) | (220.1 | ) | 4,691.4 | |||||||||||||||||
Net shares issued (acquired) under share-based compensation plans | 0.2 | 0.1 | 0.4 | — | (4.2 | ) | — | (3.7 | ) | |||||||||||||||||
Share-based compensation | — | — | 23.8 | — | — | — | 23.8 | |||||||||||||||||||
Excess tax deficit from share-based awards | — | — | (2.6 | ) | — | — | — | (2.6 | ) | |||||||||||||||||
Retirement benefit adjustments, net of tax expense of $10.8 | — | — | — | — | — | 20.8 | 20.8 | |||||||||||||||||||
Dividends | — | — | — | (50.5 | ) | — | — | (50.5 | ) | |||||||||||||||||
Net income | — | — | — | 93.3 | — | — | 93.3 | |||||||||||||||||||
Balance, December 31, 2015 | 124.8 | 15.7 | 1,458.5 | 3,509.8 | (12.2 | ) | (199.3 | ) | 4,772.5 | |||||||||||||||||
Net shares issued (acquired) under share-based compensation plans | 0.7 | 0.3 | (9.8 | ) | — | 5.0 | — | (4.5 | ) | |||||||||||||||||
Share-based compensation | — | — | 20.4 | — | — | — | 20.4 | |||||||||||||||||||
Excess tax benefit from share-based awards | — | — | 2.6 | — | — | — | 2.6 | |||||||||||||||||||
Retirement benefit adjustments, net of tax expense of $1.0 | — | — | — | — | — | 2.3 | 2.3 | |||||||||||||||||||
Net income | — | — | — | 320.6 | — | — | 320.6 | |||||||||||||||||||
Balance, December 31, 2016 | 125.5 | $ | 16.0 | $ | 1,471.7 | $ | 3,830.4 | $ | (7.2 | ) | $ | (197.0 | ) | $ | 5,113.9 | |||||||||||
See Notes to Consolidated Financial Statements.
48
ROWAN COMPANIES PLC AND SUBSIDIARIES
CONSOLIDATED STATEMENTS OF CASH FLOWS
(In millions)
Years ended December 31, | |||||||||||
2016 | 2015 | 2014 | |||||||||
CASH FLOWS FROM OPERATING ACTIVITIES: | |||||||||||
Net income (loss) | $ | 320.6 | $ | 93.3 | $ | (114.9 | ) | ||||
Adjustments to reconcile net income (loss) to net cash provided by operations: | |||||||||||
Depreciation and amortization | 402.9 | 392.7 | 322.6 | ||||||||
Provision for pension and postretirement benefits | 15.0 | 34.0 | 25.1 | ||||||||
Share-based compensation expense | 34.6 | 33.6 | 34.5 | ||||||||
(Gain) loss on disposals of property and equipment | 8.7 | (7.7 | ) | (3.7 | ) | ||||||
Deferred income taxes | (37.9 | ) | (1.1 | ) | (182.5 | ) | |||||
Contingent payment derivative | (6.1 | ) | — | — | |||||||
Asset impairment charges | 34.3 | 329.8 | 574.0 | ||||||||
Other | 3.7 | 0.5 | — | ||||||||
Changes in current assets and liabilities: | |||||||||||
Receivables - trade and other | 109.2 | 134.7 | (200.6 | ) | |||||||
Prepaid expenses and other current assets | 9.2 | 0.6 | 16.3 | ||||||||
Accounts payable | (4.0 | ) | 23.2 | (20.6 | ) | ||||||
Accrued income taxes | (3.4 | ) | 10.6 | 4.9 | |||||||
Other current liabilities | (32.2 | ) | (13.1 | ) | 72.9 | ||||||
Other postretirement benefit claims paid | (7.9 | ) | (4.4 | ) | (4.1 | ) | |||||
Contributions to pension plans | (22.5 | ) | (11.4 | ) | (54.8 | ) | |||||
Deferred revenues | 63.7 | (3.1 | ) | (18.3 | ) | ||||||
Net changes in other noncurrent assets and liabilities | 12.7 | (15.3 | ) | (27.8 | ) | ||||||
Net cash provided by operations | 900.6 | 996.9 | 423.0 | ||||||||
CASH FLOWS FROM INVESTING ACTIVITIES: | |||||||||||
Capital expenditures | (117.6 | ) | (722.9 | ) | (1,958.2 | ) | |||||
Proceeds from disposals of property and equipment | 6.2 | 19.4 | 22.0 | ||||||||
Net cash used in investing activities | (111.4 | ) | (703.5 | ) | (1,936.2 | ) | |||||
CASH FLOWS FROM FINANCING ACTIVITIES: | |||||||||||
Proceeds from borrowings | 500.0 | 220.0 | 793.4 | ||||||||
Reduction of long-term debt | (511.8 | ) | (317.9 | ) | — | ||||||
Dividends paid | — | (50.5 | ) | (37.7 | ) | ||||||
Debt issue costs | (8.7 | ) | — | (0.7 | ) | ||||||
Proceeds from exercise of share options | — | — | 4.7 | ||||||||
Excess tax benefits from share-based compensation | 2.6 | — | (0.1 | ) | |||||||
Net cash provided by (used in) financing activities | (17.9 | ) | (148.4 | ) | 759.6 | ||||||
INCREASE (DECREASE) IN CASH AND CASH EQUIVALENTS | 771.3 | 145.0 | (753.6 | ) | |||||||
CASH AND CASH EQUIVALENTS, BEGINNING OF PERIOD | 484.2 | 339.2 | 1,092.8 | ||||||||
CASH AND CASH EQUIVALENTS, END OF PERIOD | $ | 1,255.5 | $ | 484.2 | $ | 339.2 | |||||
See Notes to Consolidated Financial Statements.
49
NOTE 1 – NATURE OF OPERATIONS AND BASIS OF PRESENTATION
Rowan Companies plc, a public limited company incorporated under the laws of England and Wales, is a global provider of offshore contract drilling services to the international oil and gas industry. Our fleet currently consists of 29 mobile offshore drilling units, including 25 self-elevating jack-up drilling units and four ultra-deepwater drillships. We contract our drilling rigs, related equipment and work crews primarily on a day-rate basis in markets throughout the world, currently including the United States Gulf of Mexico (US GOM), United Kingdom (U.K.) and Norwegian sectors of the North Sea, the Middle East and Trinidad.
The consolidated financial statements included herein are presented in United States (U.S.) dollars and include the accounts of Rowan Companies plc (“Rowan plc”) and its direct and indirect subsidiaries. Unless the context otherwise requires, the terms “Rowan,” “Company,” “we,” “us” and “our” are used to refer to Rowan plc and its consolidated subsidiaries. Intercompany balances and transactions have been eliminated in consolidation.
The financial information presented in this report does not constitute the Company's statutory accounts within the meaning of the U.K. Companies Act 2006 for the years ended December 31, 2016 or 2015. The audit of the statutory accounts for the year ended December 31, 2016, was not complete as of February 24, 2017. These accounts will be finalized by the directors on the basis of the financial information presented herein and will be delivered to the Registrar of Companies in the U.K.
Customer Contract Termination and Settlement
On May 23, 2016, the Company reached an agreement with Freeport-McMoRan Oil and Gas LLC (“FMOG”) and its parent company, Freeport-McMoRan Inc. (“FCX”) in connection with the drilling contract for the drillship Rowan Relentless (“FMOG Agreement”), which was scheduled to terminate in June 2017. The FMOG Agreement provided that the drilling contract be terminated immediately, and that FCX pay the Company $215 million to settle outstanding receivables and early termination of the contract, which was received in 2016. In addition, the Company signed rights to receive two additional contingent payments from FCX, payable on September 30, 2017, of $10 million and $20 million depending on the average price of West Texas Intermediate (“WTI”) crude oil over a 12-month period beginning June 30, 2016. The $10 million payment will be due if the average price over the period is greater than $50 per barrel and the additional $20 million payment will be due if the average price over the period is greater than $65 per barrel (“FMOG Provision”) (see Note 6). The Company warm-stacked the Rowan Relentless in order to reduce costs. During the quarter ended June 30, 2016, the Company recognized $173.2 million in revenue for the Rowan Relentless, including $130.9 million for the cancelled contract value, $6.2 million for the fair value of the derivative associated with the FMOG Provision (see Note 6), $5.6 million for previously deferred revenue related to the contract, and $30.5 million for operations through May 22, 2016. In January 2017, the Company and FCX settled the $10 million contingent payment provision with a $6.0 million payment received by the Company.
Customer Contract Amendment
On September 15, 2016, the Company amended its contract with Cobalt International Energy, L.P. (“Cobalt”), for the drillship Rowan Reliance, which was scheduled to conclude on February 1, 2018. The amendment provided cash settlement payments to the Company totaling $95.9 million, that the drillship remains at its current day rate of approximately $582,000 and that the drilling contract may be terminated as early as March 31, 2017. The Company received cash payments totaling $76.3 million in 2016 and expects to receive a final cash payment of $19.6 million on or before March 31, 2017. In addition, if Cobalt continues its operations with the Rowan Reliance after March 31, 2017, the day rate will be reduced to approximately $262,000 per day for the remaining operating days through February 1, 2018 (subject to further adjustment thereafter). Cobalt International Energy, Inc., the parent of Cobalt, also committed to use the Company as its exclusive provider of comparable drilling services for a period of five years. As the Company has the obligation and intent to have the drillship or a substitute available through the pre-amended contract scheduled end date, in certain circumstances, the $95.9 million settlement was recorded as a deferred revenue liability. As of December 31, 2016, $86.5 million and $9.4 million of the deferred revenue liability is classified as current and noncurrent, respectively, and is included in Deferred Revenue, and Other Liabilities, respectively, in the Consolidated Balance Sheet. Amortization of deferred revenue will begin on April 1, 2017 and extend no further than the pre-amended contract scheduled end date.
Joint Venture
On November 21, 2016, Rowan and the Saudi Arabian Oil Company (“Saudi Aramco”), through their subsidiaries, entered into a Shareholders’ Agreement to create a 50/50 joint venture to own, manage and operate offshore drilling units in Saudi Arabia. The new entity is anticipated to commence operations in the second quarter of 2017.
50
At formation of the new company, each of Rowan and Saudi Aramco will contribute $25 million to be used for working capital needs. The Asset Contribution and Transfer Agreements provide that at commencement of operations, Rowan will contribute three rigs and its local shore based operations, and Saudi Aramco will contribute two rigs and cash to maintain equal equity ownership in the new company. Rowan will then contribute two more rigs in late 2018 when those rigs complete their current contracts, and Saudi Aramco will make a matching cash contribution at that time. At the various asset contribution dates, excess cash is expected to be distributed in equal parts to the shareholders. Rigs contributed will receive contracts for an aggregate 15 years, renewed and re-priced every three years, provided that the rigs meet the technical and operational requirements of Saudi Aramco.
Rowan rigs in Saudi Arabia not selected for contribution will be managed by the new company until the end of their current contracts pursuant to a management services agreement that provides for a management fee equal to a percentage of revenue to cover overhead costs. After the management period ends, such rigs may be selected for contribution, lease, or they will be required to relocate outside of the Kingdom.
Each of Rowan and Saudi Aramco will be obligated to fund their portion of the purchase of up to 20 new build jack-up rigs ratably over 10 years. The first rig is expected to be delivered as early as 2021. The partners intend that the newbuild jack-up rigs will be financed out of available cash from operations and/or funds available from third party debt financing. Saudi Aramco as a customer will provide drilling contracts to support the new company in the acquisition of the new rigs. If cash from operations or financing is not available to fund the cost of the newbuild jack-up rig, each partner is obligated to contribute funds to purchase such rigs, up to a maximum amount of $1.25 billion per partner in the aggregate for all 20 newbuild jack-up rigs.
NOTE 2 – SUMMARY OF SIGNIFICANT ACCOUNTING POLICIES
Use of Estimates
The preparation of financial statements in conformity with US GAAP requires management to make estimates and assumptions that affect the reported amounts of assets and liabilities and disclosure of contingent assets and liabilities at the date of the financial statements and the reported amounts of revenues and expenses during the reporting period. Actual results could differ from those estimates.
Revenue and Expense Recognition
Our drilling contracts generally provide for payment on a daily rate basis, and revenues are recognized as the work progresses with the passage of time. We occasionally receive lump-sum payments at the outset of a drilling assignment for equipment moves or modifications. Lump-sum fees received for equipment moves (and related costs) and fees received for equipment modifications or upgrades are initially deferred and amortized on a straight-line basis over the primary term of the drilling contract. The costs of contractual equipment modifications or upgrades and the costs of the initial move of newly acquired rigs are capitalized and depreciated in accordance with the Company’s fixed asset capitalization policy. The costs of moving equipment while not under contract are expensed as incurred. The following table sets forth deferred revenue (revenues received but unearned) and deferred contracts costs on the Consolidated Balance Sheets at December 31 (in millions):
Balance Sheet Classification | 2016 | 2015 | |||||||
Deferred revenue (1) | |||||||||
Current | Deferred Revenue | $ | 103.9 | $ | 33.1 | ||||
Noncurrent | Other Liabilities | 10.5 | 17.7 | ||||||
$ | 114.4 | $ | 50.8 | ||||||
Deferred contract costs | |||||||||
Current | Prepaid Expenses and Other Current Assets | $ | 2.0 | $ | 3.2 | ||||
Noncurrent | Other Assets | 0.2 | 1.2 | ||||||
$ | 2.2 | $ | 4.4 | ||||||
(1) 2016 Deferred revenue includes $95.9 million ($86.5 million and $9.4 million, current and noncurrent, respectively) related to the Cobalt contract amendment (see Note 1). | |||||||||
We recognize revenue for certain reimbursable costs. Each reimbursable item and amount is stipulated in the Company’s contract with the customer, and such items and amounts frequently vary between contracts. We recognize reimbursable costs on the gross basis, as both revenues and expenses, because we are the primary obligor in the arrangement, have discretion in supplier selection, are involved in determining product or service specifications and assume full credit risk related to the reimbursable costs.
51
Cash Equivalents
Cash equivalents consist of highly liquid temporary cash investments with maturities no greater than three months at the time of purchase.
Accounts Receivable and Allowance for Doubtful Accounts
The Company's accounts receivable is stated at historical carrying value net of write-offs and allowance for doubtful accounts. The Company assesses the collectability of receivables and records adjustments to an allowance for doubtful accounts, which is recorded as an offset to accounts receivable, to cover the risk of credit losses. Any allowance is based on historical and other factors that predict collectability, including write-offs, recoveries and the evaluation and monitoring of credit quality. No allowance for doubtful accounts was required at December 31, 2016 or 2015.
The following table sets forth the components of Receivables - Trade and Other at December 31 (in millions):
2016 | 2015 | ||||||
Trade | $ | 286.2 | $ | 395.7 | |||
Income tax | 7.7 | 4.5 | |||||
Other | 7.4 | 10.3 | |||||
Total receivables - trade and other | $ | 301.3 | $ | 410.5 | |||
Property and Depreciation
We provide depreciation for financial reporting purposes under the straight-line method over the asset’s estimated useful life from the date the asset is placed into service until it is sold or becomes fully depreciated. In 2014, we reduced salvage values for our jack-up rigs from 20 percent to 10 percent of historical cost effective December 31, 2014, in connection with the completion of our asset impairment test. Estimated useful lives and salvage values are presented below:
Life (in years) | Salvage Value | |||
Jack-up drilling rigs: | ||||
Hulls | 25 to 35 | 10 | % | |
Legs | 25 to 30 | 10 | % | |
Quarters | 25 | 10 | % | |
Drilling equipment | 2 to 25 | 0% to 10% | ||
Drillships: | ||||
Hulls | 35 | 10 | % | |
Drilling equipment | 2 to 25 | 0% to 10% | ||
Drill pipe and tubular equipment | 4 | 10 | % | |
Other property and equipment | 3 to 30 | various | ||
Expenditures for new property or enhancements to existing property are capitalized and depreciated over the asset’s estimated useful life. As assets are sold or retired, property cost and related accumulated depreciation are removed from the accounts, and any resulting gain or loss is included in results of operations. The Company capitalized a portion of interest cost incurred during the drillship construction period, which ended in 2015 with the completion of the drillship construction program. We capitalized interest in the amount of $16.2 million in 2015 and $57.6 million in 2014. We did not capitalize interest in 2016.
Expenditures for maintenance and repairs are charged to expense as incurred and totaled $118 million in 2016, $129 million in 2015 and $161 million in 2014.
Impairment of Long-lived Assets
We review the carrying values of long-lived assets for impairment whenever events or changes in circumstances indicate their carrying amounts may not be recoverable. For assets held and used, we determine recoverability by evaluating the undiscounted estimated future net cash flows based on projected day rates, operating costs, capital requirements and utilization of the asset under review. When the impairment of an asset is indicated, we measure the amount of impairment as the amount by which the asset’s
52
carrying amount exceeds its estimated fair value. We measure fair value by estimating discounted future net cash flows under various operating scenarios (an income approach) and by assigning probabilities to each scenario in order to determine an expected value. The lowest level of inputs we use to value assets held and used in the business are categorized as “significant unobservable inputs,” which are Level 3 inputs in the fair value hierarchy. For assets held for sale, we measure fair value based on equipment broker quotes, less anticipated selling costs, which are considered Level 3 inputs in the fair value hierarchy.
In 2016, we conducted an impairment test of our assets and determined that the carrying values for five of our jack-up drilling units aggregating $43.6 million were not recoverable and as a result, we recognized a non-cash impairment charge of $34.3 million in 2016. In 2015, we conducted an impairment test of our assets and determined that the carrying values for ten of our jack-up drilling units aggregating $457.8 million were not recoverable, and as a result, we recognized a non-cash impairment charge of $329.8 million in 2015. In 2014, we conducted an impairment test and determined that the carrying values for twelve of our jack-ups aggregating $840.8 million were not recoverable, and as a result, we recognized a non-cash impairment charge of $565.7 million in 2014. We measured fair values using the income approach described above. Our fair value estimates required us to use significant unobservable inputs, which are internally developed assumptions not observable in the market, including assumptions related to future demand for drilling services, estimated availability of rigs and future day rates, among others. The impairments recognized in 2016, 2015 and 2014 on our jack-up rigs are included in jack-up operations in the segment information in Note 13.
Additionally, in 2014, we recognized an $8.3 million non-cash impairment charge for the carrying value of a Company aircraft, which was used to support operations. We sold the aircraft later in 2014 and recognized an immaterial loss on sale. The asset had a carrying value of $12.7 million prior to the write-down. The amount of the impairment was based on actual sales prices for similar equipment obtained from a third-party dealer of such equipment. Quoted prices in active markets for similar equipment are considered a Level 2 input in the fair value hierarchy. The impairment recognized on the Company aircraft in 2014 is included in "Unallocated costs and other" of the segment information in Note 13.
Impairment charges are included in Material Charges and Other Operating Items on the Consolidated Statements of Operations.
Share-based Compensation
We recognize compensation cost for employee share-based awards on a straight-line basis over a 36-month service period. For employees who are retirement-eligible at the grant date or who will become retirement-eligible within six months of the grant date, compensation cost is recognized over a minimum period of six months. Compensation cost for employees who become retirement eligible after six months following the grant date but before the 36-month maximum service period is amortized over the period from the grant date to the date the employee meets the retirement eligibility requirements.
Fair value of restricted shares and restricted share units awarded to employees is based on the market price of the shares on the date of grant. Compensation cost is recognized for awards that are expected to vest and is adjusted in subsequent periods if actual forfeitures differ from estimates.
Non-employee directors may annually elect to receive either deferred or non-deferred annual equity awards. Both deferred and non-deferred awards granted to non-employee directors vest at the earlier of the first anniversary of the grant date or the next annual meeting of shareholders following the grant date but deferred awards are not settled (in cash or shares at the discretion of the Compensation Committee) until the director terminates service from the Board and non-deferred awards are settled upon vesting (in shares for awards made in 2016). Compensation cost for both deferred and non-deferred awards are recognized over the service period which is up to one year. Deferred awards (“Director RSUs”) are accounted for under the liability method of accounting, the fair value is based on the market price of the underlying shares on the grant date, and compensation expense is adjusted for changes in fair value at each report date through the settlement date. Non-deferred awards (“Director RSAs”) are accounted for as equity awards and the fair value is based on the market price of the underlying shares on the grant date.
Performance-based awards consist of Performance Units (“P-Units”), in which the payment is contingent on the Company's total shareholder return relative to the selected industry peer group. Fair value of P-Units is determined using a Monte-Carlo simulation model. P-Units granted prior to 2016 are settled in cash and P-Units granted in 2016 or after may be settled in cash or shares at the Compensation Committee's discretion. All P-Units are accounted for under the liability method of accounting. Compensation cost is recognized on a straight-line basis over the service period and is adjusted for changes in fair value at each report date through the end of the performance period.
Fair value of share appreciation rights (“SARs”) is determined using the Black-Scholes option pricing model. The Company uses the simplified method for determining the expected life of SARs, because it does not have sufficient historical exercise data to provide a reasonable basis on which to estimate expected term, as permitted under US GAAP. The Company has not granted any SARs since 2013. The Company intends to share-settle SARs that are exercised and has therefore accounted for them as equity awards.
53
Foreign Currency Transactions
A substantial majority of our revenues are received in U.S. dollars, which is our functional currency. However, in certain countries in which we operate, local laws or contracts may require us to receive some payment in the local currency. We are exposed to foreign currency exchange risk to the extent the amount of our monetary assets denominated in the foreign currency differs from our obligations in that foreign currency. In order to mitigate the effect of exchange rate risk, we attempt to limit foreign currency holdings to the extent they are needed to pay liabilities in the local currency. Prior to 2016, we entered into spot purchases or short-term derivative transactions, such as forward exchange contracts, with one-month durations. We did not enter into such transactions for the purpose of speculation, trading or investing in the market and we believe that our use of forward exchange contracts has not exposed us to material credit risk or other material market risk. Although our risk policy allows us to enter into such forward exchange contracts, we do not currently anticipate entering into such transactions in the future and had no such contracts outstanding as of December 31, 2016.
At December 31, 2016 and 2015, we held Egyptian pounds in the amount of $5.1 million and $13.5 million, respectively, of which $4.2 million and $13.5 million are classified as Other Assets on the Consolidated Balance Sheets. We ceased drilling operations in Egypt in 2014, and are currently working to obtain access to the funds for use outside Egypt to the extent they are not utilized. We can provide no assurance we will be able to convert or utilize such funds in the future.
Non-U.S. dollar transaction gains and losses are recognized in “other - net” on the Consolidated Statements of Income. The Company recognized net currency exchange losses of $9.7 million, $3.9 million and $0.05 million in 2016, 2015 and 2014, respectively. In 2016, the exchange loss was primarily due to the devaluation of the Egyptian pound.
Income Taxes
Rowan recognizes deferred income tax assets and liabilities for the estimated future tax consequences of differences between the financial statement and tax bases of assets and liabilities. Valuation allowances are provided against deferred tax assets that are not likely to be realized. Interest and penalties related to income taxes are included in income tax expense.
The Company has not provided deferred income taxes on certain undistributed earnings of its non-U.K. subsidiaries. Generally, earnings of non-U.K. subsidiaries in which Rowan Companies Inc. (RCI) does not have a direct or indirect ownership interest can be distributed to Rowan plc without the imposition of either U.K. or local country tax. It is generally the Company’s policy and intention to permanently reinvest earnings of non-U.S. subsidiaries of RCI outside the U.S. However, we have recognized taxes related to the earnings of certain subsidiaries that are not permanently reinvested or that will not be permanently reinvested in the future. See Note 12 for further information regarding the Company’s income taxes.
Income (Loss) Per Common Share
Basic income (loss) per share is computed by dividing income (loss) available to common shareholders by the weighted-average number of common shares outstanding during the period. Diluted income per share includes the additional effect of all potentially dilutive securities outstanding during the period, which includes nonvested restricted stock, restricted stock units, P-Units, share options and share appreciation rights granted under share-based compensation plans. The effect of share equivalents is not included in the computation for periods in which a net loss occurs because to do so would be anti-dilutive.
A reconciliation of income (loss) from continuing operations for basic and diluted income per share is set forth below (in millions):
2016 | 2015 | 2014 | |||||||||
Income (loss) from continuing operations | $ | 320.6 | $ | 93.3 | $ | (118.9 | ) | ||||
Income from continuing operations allocated to non-vested share awards | 1.5 | — | — | ||||||||
Income (loss) from continuing operations available to shareholders | $ | 322.1 | $ | 93.3 | $ | (118.9 | ) | ||||
A reconciliation of shares for basic and diluted income per share is set forth below (in millions):
2016 | 2015 | 2014 | ||||||
Average common shares outstanding | 125.3 | 124.5 | 124.1 | |||||
Effect of dilutive securities - share based compensation | 1.0 | 0.7 | — | |||||
Average shares for diluted computations | 126.3 | 125.2 | 124.1 | |||||
54
Share options, share appreciation rights, nonvested restricted stock, P-Units and restricted share units granted under share-based compensation plans are anti-dilutive and excluded from diluted earnings per share when the hypothetical number of shares that could be repurchased under the treasury stock method exceeds the number of shares that can be exercised, or when the Company reports a net loss from continuing operations. Anti-dilutive shares, which could potentially dilute earnings per share in the future, are set forth below (in millions):
2016 | 2015 | 2014 | |||||||||
Share options and appreciation rights | $ | 1.6 | $ | 1.2 | $ | 2.2 | |||||
Nonvested restricted shares and restricted share units | 0.9 | 1.1 | 0.6 | ||||||||
Total potentially dilutive shares | $ | 2.5 | $ | 2.3 | $ | 2.8 | |||||
Recent Accounting Pronouncements
In May 2014, the Financial Accounting Standards Board (FASB) issued Accounting Standards Update (ASU) No. 2014-09, Revenue from Contracts with Customers (ASC 606), which sets forth a global standard for revenue recognition and replaces most existing industry-specific guidance. We will be required to adopt the new standard in annual and interim periods beginning January 1, 2018. ASC 606 requires an entity to recognize revenue to depict the transfer of promised goods or services to customers in an amount that reflects the consideration to which the entity expects to be entitled in exchange for those goods or services. We will adopt ASC 606, effective January 1, 2018 concurrently with ASU No. 2016-02, Leases (ASC 842) as discussed below. We are currently evaluating the impact ASC 606 will have on our consolidated financial statements and to complete that evaluation, we have completed training on the ASU, formed an implementation team and have started the review and documentation of contracts.
In November 2015, the FASB issued ASU No. 2015-17, Balance Sheet Classification of Deferred Taxes, which requires entities to present deferred tax assets and deferred tax liabilities in balance sheets as noncurrent. We will be required to adopt the new standard in annual and interim periods beginning January 1, 2017. The amendments in this ASU may be applied either prospectively to all deferred tax liabilities and assets or retrospectively to all periods presented. In order to simplify accounting for deferred tax assets and liabilities, the Company has adopted the accounting standard in the beginning of the fourth quarter of fiscal 2016. The change in accounting standard has been applied retrospectively with no impact to the prior period consolidated financial statements.
In February 2016, the FASB issued ASU No. 2016-02, Leases (ASC 842): Amendments to the FASB Accounting Standards Codification, which requires an entity to recognize lease assets and lease liabilities on the balance sheet and to disclose key qualitative and quantitative information about the entity's leasing arrangements. Lessees and lessors will be required to recognize and measure leases at the beginning of the earliest period presented using a modified retrospective approach, including a number of optional practical expedients that entities may elect to apply. ASC 842 is effective for annual and interim periods beginning after December 15, 2018, with early adoption permitted. Under the updated accounting standards, we have preliminarily determined that our drilling contracts contain a lease component, and our adoption, therefore, will require that we separately recognize revenues associated with the lease and services components. Our adoption, and the ultimate effect on our consolidated financial statements, will be based on an evaluation of the contract-specific facts and circumstances, and such effect could result in differences in the timing of our revenue recognition relative to current accounting standards. Due to the interaction with the issued accounting standard on revenue recognition, we expect to adopt ASC 842 effective January 1, 2018 concurrently with ASC 606. Our adoption will have an impact on how our consolidated balance sheets, statements of income, cash flows and on the disclosures contained in our notes to consolidated financial statements will be presented. We are currently evaluating the impact ASC 842 will have on our consolidated financial statements and to complete that evaluation, we have completed training on the ASU, formed an implementation team and have started the review and documentation of contracts.
In March 2016, the FASB issued ASU No. 2016-09, Improvements to Employee Share-based Payment Accounting, which simplifies several aspects of accounting for employee share-based payment awards, including the accounting for income taxes, withholding taxes and forfeitures, as well as classification on the statement of cash flows. We will adopt this ASU as of January 1, 2017 and we expect that its impact will not be material to our consolidated financial statements and disclosures.
In June 2016, the FASB issued ASU No. 2016-13, Financial Instruments - Credit Losses (Topic 326): Measurement of Credit Losses on Financial Instruments, which amends the FASB's guidance on the impairment of financial instruments. The ASU adds to US GAAP an impairment model that is based on expected losses rather than incurred losses. Under the new guidance, an entity recognizes as an allowance its estimate of expected credit losses. We will be required to adopt the amended guidance in annual and interim reports beginning January 1, 2020, with early adoption permitted for fiscal years beginning after December 15, 2018. We are in the process of evaluating the impact this amendment will have on our consolidated financial statements.
In August 2016, the FASB issued ASU No. 2016-15, Statement of Cash Flows (Topic 230): Classification of Certain Cash Receipts and Cash Payments, which provides guidance on eight cash flow classification issues with the objective of reducing differences
55
in practice. We will be required to adopt the amendments in this ASU in annual and interim periods beginning January 1, 2018, with early adoption permitted. Adoption is required to be on a retrospective basis, unless impracticable for any of the amendments, in which case a prospective application is permitted. We are in the process of evaluating the impact these amendments will have on our consolidated financial statements.
In October 2016, the FASB issued ASU 2016-16, Income Taxes (Topic 740): Intra-Entity Transfers of Assets Other than Inventory, which eliminates the exception that prohibits the recognition of current and deferred income tax effects for intra-entity transfers of assets other than inventory until the asset has been sold to an outside party. We will be required to adopt the amendments in this ASU in the annual and interim periods beginning January 1, 2018, with early adoption permitted at the beginning of an annual reporting period for which financial statements (interim or annual) have not been issued or made available for issuance. The application of the amendments will require the use of a modified retrospective basis through a cumulative-effect adjustment to retained earnings as of the beginning of the period of adoption. We are evaluating the standard for potential early adoption in our first quarter of 2017 and estimate a $205 - $211 million increase to retained earnings for the remaining unamortized deferred tax liability resulting from intra-entity transactions.
In January 2017, the FASB issued ASU 2017-01, Business Combinations (Topic 805): Clarifying the Definition of a Business, which clarifies the definition of a business with the objective of adding guidance to assist entities with evaluating whether transactions should be accounted for as acquisitions (or disposals) of assets or businesses. We will be required to adopt the amendments in this ASU in annual and interim periods beginning January 1, 2018, with early adoption permitted. Adoption is required to be applied on a prospective basis on or after the effective date. We are in the process of evaluating the impact these amendments will have on our consolidated financial statements.
NOTE 3 – DISCONTINUED OPERATIONS
In 2014 we sold a land rig that was retained in connection with the 2011 sale of the Company's manufacturing business. The Company received $6.0 million in cash resulting in a $4.0 million gain, net of a $2.1 million income tax benefit. The net gain on sale is classified as discontinued operations.
NOTE 4 – ACCRUED LIABILITIES
Accrued liabilities at December 31 consisted of the following (in millions):
2016 | 2015 | ||||||
Pension and other postretirement benefits | $ | 32.1 | $ | 31.4 | |||
Compensation and related employee costs | 62.4 | 73.6 | |||||
Interest | 33.6 | 44.3 | |||||
Income taxes | 18.3 | 23.9 | |||||
Other | 12.4 | 12.8 | |||||
Total accrued liabilities | $ | 158.8 | $ | 186.0 | |||
56
NOTE 5 – LONG-TERM DEBT
Long-term debt at December 31 consisted of the following (in millions):
2016 | 2015 | ||||||
5% Senior Notes, due September 2017 ($92.2 million and $366.6 million principal amount, respectively; 5.2% effective rate) | $ | 92.0 | $ | 365.5 | |||
7.875% Senior Notes, due August 2019 ($209.8 million and $435.5 million principal amount, respectively; 8.0% effective rate) | 208.9 | 432.9 | |||||
4.875% Senior Notes, due June 2022 ($690.2 million and $700 million principal amount, respectively; 4.7% effective rate) | 695.4 | 706.2 | |||||
4.75% Senior Notes, due January 2024 ($398.1 million and $400 million principal amount, respectively; 4.8% effective rate) | 395.6 | 397.1 | |||||
7.375% Senior Notes, due June 2025 ($500 million principal amount; 7.4% effective rate) | 497.2 | — | |||||
5.4% Senior Notes, due December 2042 ($400 million principal amount; 5.4% effective rate) | 394.9 | 394.7 | |||||
5.85% Senior Notes, due January 2044 ($400 million principal amount; 5.9% effective rate) | 396.2 | 396.0 | |||||
Total carrying value | 2,680.2 | 2,692.4 | |||||
Current portion (1) | 126.8 | — | |||||
Carrying value, less current portion | $ | 2,553.4 | $ | 2,692.4 | |||
(1) Current portion of long-term debt includes the 5% Senior Notes due 2017, as well as the portion of 7.875% Senior Notes due 2019 and 4.875% Senior Notes due 2022 tendered in December 2016 but not settled until January 2017. | |||||||
The following is a summary of scheduled long-term debt maturities by year, as of December 31, 2016 (in millions):
2017 | $ | 92.2 | |
2018 | — | ||
2019 | 209.8 | ||
2020 | — | ||
2021 | — | ||
Thereafter | 2,388.3 | ||
$ | 2,690.3 | ||
In January 2014, Rowan plc, as guarantor, and its 100% owned subsidiary, RCI, as issuer, completed the issuance and sale in a public offering of $400 million aggregate principal amount of its 4.75% Senior Notes due 2024 (the "2024 Notes") at a price to the public of 99.898% of the principal amount and $400 million aggregate principal amount of its 5.85% Senior Notes due 2044 ("the 2044 Notes") at a price to the public of 99.972% of the principal amount. Net proceeds of the offering were approximately $792 million, which the Company used in its rig construction program and for general corporate purposes.
In May 2015, the Company amended and restated its revolving credit agreement to increase the borrowing capacity under the facility from $1 billion to $1.5 billion and to extend the maturity date by one year to January 2020. In January 2016, the Company further amended the revolving credit agreement to extend the maturity date by one year to January 2021. Availability under the facility is $1.5 billion through January 23, 2019, declining to $1.44 billion through January 23, 2020, and to approximately $1.29 billion through the maturity in 2021. There were no amounts drawn under the revolving credit agreement at December 31, 2016.
Advances under the revolving credit agreement bear interest at LIBOR or Base Rate plus an applicable margin, which is dependent upon the Company's credit ratings. The applicable margins for LIBOR and Base Rate advances range from 1.125% - 2.0% and 0.125% - 1.0%, respectively. The Company is also required to pay a commitment fee on undrawn amounts of the credit agreement, which ranges from 0.125% to 0.35%, depending on the Company's credit ratings.
The revolving credit agreement requires the Company to maintain a total debt-to-capitalization ratio of less than or equal to 60%. Additionally, the credit agreement has customary restrictive covenants that, including others, restrict the Company's ability to incur certain debt and liens, enter into certain merger and acquisition agreements, sell, transfer, lease or otherwise dispose of all or substantially all of the Company's assets and substantially change the character of the Company's business from contract drilling.
57
During 2015, the Company paid $101.1 million in cash to retire $97.9 million aggregate principal amount of 5% Senior Notes due 2017 (the “2017 Notes”) and 7.875% Senior Notes due 2019 (the “2019 Notes”), plus accrued interest, and recognized a $1.5 million loss on early extinguishment of debt.
During the first half of 2016, the Company paid $45.2 million in cash to retire $47.9 million aggregate principal amount of the 2017 Notes and the 2019 Notes, and recognized a $2.4 million gain on early extinguishment of debt.
In December 2016, the Company commenced cash tender offers for $750 million aggregate principal amount of certain Senior Notes (as defined below) issued by the Company, which such tender offers expired on January 3, 2017. Senior Notes validly tendered and accepted for purchase prior to the early tender expiration time on December 16, 2016, received tender offer consideration plus an early tender premium. As a result of the tender offers, in December 2016, the Company paid $490.5 million to redeem $463.9 million aggregate principal amount of outstanding Senior Notes, consisting of $265.5 million of the 2017 Notes, $186.7 million of the 2019 Notes, $9.8 million of 4.875% Senior Notes due 2022 ("the 2022 Notes") and $1.9 million of the 2024 Notes, and recognized a $33.6 million loss on the early extinguishment of debt which included approximately $5.9 million of bank and legal fees.
On December 19, 2016, Rowan plc, as guarantor, and its 100% owned subsidiary, RCI, as issuer, completed the issuance of $500 million aggregate principal amount of its 7.375% Senior Notes due 2025 (the "2025 Notes") at a price of 100% of the principal amount. The Company used the net proceeds of the offering, approximately $492 million, along with cash on hand, to fund the redemption of Senior Notes related to the tender offers. $5.3 million of the cash paid to the underwriting banks in the form of the underwriters discount and structuring fee was expensed and included in the $33.6 million loss on early extinguishment of debt related to the December 2016 tender offers. Interest on the 2025 Notes is payable on June 15 and December 15 of each year, beginning on June 15, 2017. The 2025 Notes contain a provision whereby upon a change of control repurchase event, as defined in the indenture governing the 2025 Notes, the Company may be required to make an offer to repurchase all outstanding notes at a price in cash equal to 101% of the aggregate principal amount of the notes repurchased, plus any accrued and unpaid interest to the repurchase date. Otherwise, the 2025 Notes contain substantially the same provisions as the Company’s other Senior Notes.
In January 2017, at the expiration of the tender offers, the Company paid $32.8 million to redeem $34.6 million aggregate principal amount of outstanding Senior Notes, consisting of $0.1 million of the 2017 Notes, $0.9 million of the 2019 Notes and $33.6 million of the 2022 Notes.
On January 9, 2017, the Company called for redemption $92.1 million aggregate principal amount of the 2017 Notes that remained outstanding and on February 8, 2017, the Company paid $94.0 million to redeem such notes.
The 2017 Notes, 2019 Notes, 2022 Notes, 2024 Notes, 2025 Notes, 5.4% Senior Notes due 2042, and 2044 Notes (together, the “Senior Notes”) are RCI’s senior unsecured obligations and rank senior in right of payment to all of its subordinated indebtedness and pari passu in right of payment with any of RCI’s future senior indebtedness, including any indebtedness under RCI’s senior revolving credit facility. The Senior Notes rank effectively junior to RCI’s future secured indebtedness, if any, to the extent of the value of its assets constituting collateral securing that indebtedness and to all existing and future indebtedness of its subsidiaries (other than indebtedness and liabilities owed to RCI).
All or part of the Senior Notes may be redeemed at any time for an amount equal to 100% of the principal amount plus accrued and unpaid interest to the redemption date plus the applicable make-whole premium, if any.
The Senior Notes are fully and unconditionally guaranteed on a senior and unsecured basis by Rowan plc (see Note 16).
Restrictive provisions in the Company’s bank credit facility agreement limit consolidated debt to 60% of book capitalization. Our consolidated debt to total capitalization ratio at December 31, 2016, was 34%.
Other provisions of the Company's debt agreements limit the ability of the Company to create liens that secure debt, engage in sale and leaseback transactions, merge or consolidate with another company and, in the event of noncompliance, restrict investment activities and asset purchases and sales, among other things. The Company was in compliance with its debt covenants at December 31, 2016.
NOTE 6 – DERIVATIVES
The Company determined that the FMOG Provision of the FMOG Agreement is a freestanding financial instrument and that it met the criteria of a derivative instrument (“Contingent Payment Derivative”). The Contingent Payment Derivative was initially recorded to revenue at a fair value of $6.2 million on May 23, 2016, and will be revalued at each reporting date with changes in the fair value reported as non-operating income or expense. The fair value of the Contingent Payment Derivative was determined using a Monte Carlo simulation (see Note 7). In January 2017, the Company and FCX settled a portion of the derivative instrument
58
with a $6.0 million payment received by the Company (see Note 1).
The following table provides the fair value of the Company’s derivative as reflected in the Consolidated Balance Sheet at December 31, 2016 (in millions):
Balance sheet classification | Fair value | |||
Derivative: | ||||
Contingent Payment Derivative | ||||
Prepaid expenses and other current assets | $ | 6.1 | ||
The following table provides the revaluation effect of the Company’s derivative on the Consolidated Statement of Operations for the year ended December 31, 2016 (in millions):
Derivative | Classification of gain (loss) recognized in income (loss) | Amount of gain (loss) recognized in income (loss) | ||||
Contingent Payment Derivative | Other - net | $ | (0.1 | ) | ||
NOTE 7 – FAIR VALUE MEASUREMENTS
Fair value is defined as the exchange price that would be received for an asset or paid to transfer a liability (an exit price) in the principal or most advantageous market for the asset or liability in an orderly transaction between market participants on the measurement date. The fair value hierarchy prescribed by US GAAP requires an entity to maximize the use of observable inputs and minimize the use of unobservable inputs when measuring fair value. The three levels of inputs that may be used to measure fair value are:
• | Level 1 – Quoted prices for identical instruments in active markets; |
• | Level 2 – Quoted market prices for similar instruments in active markets; quoted prices for identical instruments in markets that are not active, and model-derived valuations in which all significant inputs and significant value drivers are observable in active markets; and |
• | Level 3 – Valuations derived from valuation techniques in which one or more significant inputs or significant value drivers are unobservable, such as those used in pricing models or discounted cash flow methodologies, for example. |
The applicable level within the fair value hierarchy is the lowest level of any input that is significant to the fair value measurement.
Derivative
The fair value of the Contingent Payment Derivative (Level 3) was estimated using a Monte Carlo simulation model, which calculates the probabilities of the daily closing WTI spot price exceeding the $50 price target and the $65 price target (“Price Targets”), respectively, on a daily averaging basis during the 12-month payment measurement period ending on June 30, 2017. The probabilities are applied to the payout at each Price Target to calculate the probability-weighted expected payout. The following are the significant inputs used in the valuation of the Contingent Payment Derivative: the WTI Spot Price on the valuation date, the expected volatility, and the risk-free interest rate, and the slope of the WTI forward curve, which were $47.48, 37.5%, 0.765% and 5.5% at May 23, 2016, respectively, and $53.72, 28.557%, 0.734%, and 11.205% at December 31, 2016, respectively. The expected volatility was estimated from the implied volatility rates of WTI Crude Futures. The risk-free rate was based on yields of U.S. Treasury securities commensurate with the remaining term of the Contingent Payment Derivative. In January 2017, the Company and FCX settled a portion of the derivative instrument with a $6.0 million payment received by the Company (see Note 1).
59
Assets and Liabilities Measured at Fair Value on a Recurring Basis
Assets and liabilities measured at fair value on a recurring basis at December 31 are presented below (in millions):
Estimated fair value measurements | |||||||||||||||
Fair value | Quoted prices in active markets (Level 1) | Significant other observable inputs (Level 2) | Significant unobservable inputs (Level 3) | ||||||||||||
December 31, 2016: | |||||||||||||||
Assets - cash equivalents | $ | 1,242.3 | $ | 1,242.3 | $ | — | $ | — | |||||||
Derivative | 6.1 | — | — | 6.1 | |||||||||||
Other assets (Egyptian Pounds) | 4.2 | 4.2 | — | — | |||||||||||
December 31, 2015: | |||||||||||||||
Assets - cash equivalents | $ | 465.4 | $ | 465.4 | $ | — | $ | — | |||||||
Other assets (Egyptian Pounds) | 13.5 | 13.5 | — | — | |||||||||||
At December 31, 2016, the Company held a Contingent Payment Derivative in the amount of $6.1 million, which is classified as Prepaid Expenses and Other Current Assets on the Consolidated Balance Sheet.
At December 31, 2016 and 2015, we held Egyptian pounds in the amount of $4.2 million and $13.5 million, respectively, that are classified as Other Assets on the Consolidated Balance Sheets. We ceased drilling operations in Egypt in 2014, and are currently working to obtain access to the funds for use outside Egypt to the extent they are not utilized. We can provide no assurance we will be able to convert or utilize such funds in the future.
Trade receivables and trade payables, which are required to be measured at fair value, have carrying values that approximate their fair values due to their short maturities.
Assets Measured at Fair Value on a Nonrecurring Basis
Assets measured at fair value on a nonrecurring basis and whose carrying values were remeasured during the year ended December 31 are set forth below (in millions):
Estimated fair value measurements | |||||||||||||||||||
Fair value | Quoted prices in active markets (Level 1) | Significant other observable inputs (Level 2) | Significant unobservable inputs (Level 3) | Total gains (losses) | |||||||||||||||
2016: | |||||||||||||||||||
Property and equipment, net (1) | $ | 9.3 | $ | — | $ | — | $ | 9.3 | $ | (34.3 | ) | ||||||||
2015: | |||||||||||||||||||
Property and equipment, net (2) | $ | 128.0 | $ | — | $ | — | $ | 128.0 | $ | (329.8 | ) | ||||||||
2014: | |||||||||||||||||||
Property and equipment, net (3) | $ | 275.1 | $ | — | $ | — | $ | 275.1 | $ | (565.7 | ) | ||||||||
(1) This represents a non-recurring fair value measurement made at September 30, 2016 for five of our jack-up drilling units. | |||||||||||||||||||
(2) This represents a non-recurring fair value measurement made at September 30, 2015 for ten of our jack-up drilling units. | |||||||||||||||||||
(3) This represents a non-recurring fair value measurement made at December 31, 2014 for twelve of our jack-up drilling units. | |||||||||||||||||||
In 2016, we recognized non-cash asset impairment charges aggregating $34.3 million on five of the Company's jack-up drilling units having an aggregate net carrying value of $43.6 million prior to the write-downs. Two of these jack-up drilling units were sold in the fourth quarter of 2016 for gross proceeds of approximately $5.0 million and the Company recognized a net loss on sale of $1.2 million. In 2015, we recognized non-cash asset impairment charges aggregating $329.8 million on ten of the Company's jack-up drilling units having an aggregate net carrying value of $457.8 million prior to the write-down. In 2014, we recognized
60
asset impairment charges totaling $565.7 million on twelve jack-up drilling units having an aggregate net carrying value of $840.8 million prior to the write-down. Impairment charges are included in Material Charges and Other Operating Items on the Consolidated Statements of Operations (see "Impairment of Long-lived Assets" in Note 2). The financial information for these rigs has been reported as part of the jack-ups segment.
Other Fair Value Measurements
Financial instruments not required to be measured at fair value consist of the Company’s publicly traded debt securities. Our publicly traded debt securities had a carrying value of $2.680 billion at December 31, 2016, and an estimated fair value at that date aggregating $2.448 billion, compared to a carrying and fair value of $2.692 billion and $2.072 billion, respectively, at December 31, 2015. Fair values of our publicly traded debt securities were provided by a broker who makes a market in such securities and were measured using a market-approach valuation technique, which is a Level 2 fair value measurement.
Concentrations of Credit Risk
We invest our excess cash primarily in time deposits and high-quality money market accounts at several large commercial banks with strong credit ratings, and therefore believe that our risk of loss is minimal.
The Company’s customers largely consist of major international oil companies, national oil companies and large investment-grade exploration and production companies. We routinely evaluate and monitor the credit quality of potential and current customers. Five customers, Saudi Aramco, Freeport-McMoRan, Cobalt International, Repsol and ConocoPhillips accounted for 20%, 12%, 12%, 12% and 11%, respectively, of consolidated revenues in 2016 and 32%, 0%, 19%, 12% and 8%, respectively, of the consolidated trade receivable balance at December 31, 2016. Saudi Aramco and ConocoPhillips revenue was derived from our jack-up segment, and Repsol and Cobalt International revenue, as well as nearly all of Freeport-McMoRan revenue, was derived from our deepwater segment. Three customers, Saudi Aramco, ConocoPhillips, and Anadarko accounted for 19%, 13% and 10%, respectively, of consolidated revenues in 2015 and 34%, 12% and 9% respectively, of the consolidated trade receivable balance at December 31, 2015. In 2014, one customer accounted for 24% of consolidated revenues. The Company maintains reserves for credit losses when necessary and actual losses have been within management’s expectations.
NOTE 8 – COMMITMENTS AND CONTINGENT LIABILITIES
The Company has operating leases covering office space and equipment. Certain of the leases are subject to escalations based on increases in building operating costs. Rental expense attributable to continuing operations was $10.6 million, $13.2 million and $13.8 million in 2016, 2015 and 2014, respectively.
At December 31, 2016, future minimum payments to be made under noncancelable operating leases were as follows (in millions):
2017 | $ | 7.2 | |
2018 | 6.4 | ||
2019 | 5.7 | ||
2020 | 4.0 | ||
2021 | 1.2 | ||
Later years | 10.7 | ||
$ | 35.2 | ||
We had commitments for purchase obligations totaling $62 million at December 31, 2016.
We periodically employ letters of credit in the normal course of our business, and had outstanding letters of credit of approximately $2.9 million at December 31, 2016.
If the new joint venture company has insufficient cash from operations or financing is not available to fund the cost of the newbuild jack-up rigs, Rowan will be obligated to contribute funds to purchase such rigs, up to a maximum amount of $1.25 billion for all 20 newbuild jack-up rigs (see Note 1).
Uncertain tax positions – We have been advised by the U.S. Internal Revenue Service (IRS) of proposed unfavorable tax adjustments of $85 million including applicable penalties for the open tax years 2009 through 2012. The unfavorable tax adjustments primarily related to the following items: 2009 tax benefits recognized as a result of applying the facts of a third-party tax case that provided favorable tax treatment for certain foreign contracts entered into in prior years to the Company’s situation; transfer pricing; and domestic production activity deduction. The IRS does not agree with our protest and they have submitted the proposed
61
unfavorable tax adjustments to be reviewed by the IRS Appeals group. In years subsequent to 2012, we have similar positions that could be subject to adjustments for the open years. We have provided for amounts that we believe will be ultimately payable under the proposed adjustments and intend to vigorously defend our positions; however, if we determine the provisions for these matters to be inadequate due to new information or we are required to pay a significant amount of additional U.S. taxes and applicable penalties and interest in excess of amounts that have been provided for these matters, our consolidated results of operations and cash flows could be materially and adversely affected.
The gross unrecognized tax benefits excluding penalties and interest are $120 million and $65 million as of December 31, 2016 and 2015, respectively. The increase to gross unrecognized tax benefits was primarily due to tax positions taken of $11 million related to current year-to-date anticipated transfer pricing positions and $42 million related to prior year U.S. interest deductions. Reversal of net unrecognized tax benefits excluding penalties and interest would impact our tax by $59 million.
It is reasonable that the existing liabilities for the unrecognized tax benefits may increase or decrease over the next 12 months as a result of audit closures and statute expirations, however, the ultimate timing of the resolution and/or closure of audits is highly uncertain.
Pending or threatened litigation – We are involved in various legal proceedings incidental to our businesses and are vigorously defending our position in all such matters. Although the outcome of such proceedings cannot be predicted with certainty, the Company believes that there are no known contingencies, claims or lawsuits that will have a material effect on its financial position, results of operations or cash flows.
NOTE 9 – SHARE-BASED COMPENSATION PLANS
Under the 2013 Rowan Companies plc Incentive Plan (the Plan), as amended in 2016, the Compensation Committee is authorized to grant employees and non-employee directors incentive awards up to 15,300,000 of our ordinary shares. The awards may be in the form of restricted share awards, restricted share units, options and share appreciation rights. In addition, the Compensation Committee may grant performance-based awards under the Plan (such as P-Units which may be settled in shares or cash, at the discretion of the Compensation Committee), for which the amount earned is dependent on the achievement of certain market or performance conditions over a specified period. As of December 31, 2016, there were 8,950,686 shares available for future grant under the Plan. Shares issued to satisfy awards to employees are issued from our employee benefit trust which are deemed treasury shares, while shares issued to satisfy awards to non-employee directors are newly issued shares.
Compensation cost charged to expense under all share-based incentive awards is presented below (in millions):
2016 | 2015 | 2014 | |||||||||
Restricted shares and restricted share units | $ | 21.8 | $ | 22.5 | $ | 23.6 | |||||
Share appreciation rights | 0.2 | 1.1 | 3.7 | ||||||||
Performance-based awards | 12.6 | 10.0 | 7.2 | ||||||||
Total compensation cost | $ | 34.6 | $ | 33.6 | $ | 34.5 | |||||
As of December 31, 2016, unrecognized compensation cost related to nonvested share-based compensation arrangements totaled $29.7 million, which is expected to be recognized over a weighted-average period of 1.5 years.
Restricted Shares (Employees and Non-employee Directors) – A restricted share represents an ordinary share subject to a vesting period that restricts its sale or transfer until the vesting period ends. In general, the restricted shares granted to employees vested and the restrictions lapsed in one-third increments each year over a three-year service period, or in some cases, cliff vested at the end of a three-year service period. The Company discontinued granting restricted shares as annual awards to employees beginning in 2013 and all restricted shares granted to employees were vested as of December 31, 2016.
Non-employee directors may annually elect to receive either deferred or non-deferred annual equity awards. Both deferred awards (in 2016, in the form of Director RSUs discussed in Note 2 and below) and non-deferred awards (in 2016, in the form of Director RSAs) vest at the earlier of the first anniversary of the grant date or the next annual meeting of shareholders following the grant date. Non-deferred awards (in the form of Director RSAs) are settled in shares upon vesting. In 2016, the Company granted an aggregate 54 thousand Director RSAs. Restricted share activity for the year ended December 31, 2016, is summarized below:
62
Number of Shares | Weighted-average grant-date fair value per share | |||||
(in thousands) | ||||||
Nonvested at January 1, 2016 | 3 | $ | 33.88 | |||
Granted | 54 | 18.60 | ||||
Vested | (3 | ) | 33.88 | |||
Forfeited | — | — | ||||
Nonvested at December 31, 2016 | 54 | $ | 18.60 | |||
The weighted-average grant date fair value of restricted shares granted in 2016 was $18.60. No restricted shares were granted in 2015 and 2014. The aggregate fair value of restricted shares that vested in 2016, 2015 and 2014 was $37 thousand, $4.1 million and $10.9 million, respectively, based on share prices on the vesting dates.
Employee Restricted Share Units – Restricted share units (RSUs) are rights to receive a specified number of ordinary shares upon vesting. RSUs granted to employees typically vest in one-third increments over a three-year service period or in some cases, cliff vest at the end of three years. Employee RSU activity for the year ended December 31, 2016, follows:
Number of Shares | Weighted-average grant-date fair value per share | |||||
(in thousands) | ||||||
Nonvested at January 1, 2016 | 1,744 | $ | 25.42 | |||
Granted | 1,722 | 11.62 | ||||
Vested | (919 | ) | 26.50 | |||
Forfeited | (304 | ) | 16.47 | |||
Nonvested at December 31, 2016 | 2,243 | $ | 15.59 | |||
The weighted-average grant date fair value of employee RSUs granted in 2016, 2015 and 2014 was $11.62, $21.11 and $32.45, respectively. The aggregate fair value of employee RSUs that vested in 2016, 2015 and 2014 was $14.6 million, $8.9 million and $8.5 million, respectively.
Non-employee Director Restricted Share Units – As noted above, non-employee directors may annually elect to receive either deferred or non-deferred annual equity awards. Like non-deferred awards, the deferred awards (in 2016, in the form of Director RSUs) vest at the earlier of the first anniversary of the grant date or the next annual meeting of shareholders following the grant date but deferred awards are not settled (in cash, shares or a combination thereof at the discretion of the Compensation Committee) until the director terminates service from the Board.
Director RSU activity for the year ended December 31, 2016, follows:
Number of shares | Weighted-average grant-date fair value per share | |||||
(in thousands) | ||||||
Outstanding at January 1, 2016 | 300 | $ | 29.51 | |||
Granted | 41 | 17.43 | ||||
Settled | (54 | ) | 30.64 | |||
Outstanding at December 31, 2016 | 287 | $ | 27.78 | |||
Vested at December 31, 2016 | 246 | $ | 29.51 | |||
The weighted-average grant date fair value of non-employee RSUs granted in 2016, 2015 and 2014 was $17.43, $20.96 and $31.10, respectively. The number and aggregate settlement-date fair value of Director RSUs settled during the year were as follows: 2016 – 54 thousand RSUs at $1.0 million; 2015 – 44 thousand RSUs at $0.9 million; 2014 – 37 thousand RSUs at $1.2 million.
Director RSUs are accounted for under the liability method. Accordingly, other long-term liabilities at December 31, 2016 and 2015, included $5.2 million and $4.7 million, respectively, related to such awards.
63
Performance-based Awards – The Compensation Committee may grant awards in which payment is contingent upon the achievement of certain market or performance-based conditions over a period of time specified by the Committee. Payment of such awards may be in ordinary shares or in cash as determined by the Committee.
During 2014, 2015 and 2016, the Company granted to certain members of management P-Units that have a target value of $100 per unit. The amount ultimately earned with respect to the P-Units is determined by the Company’s total shareholder return (TSR) relative to a selected group of peer companies, as defined in the award agreements, over a three-year period ending December 31, 2016, 2017 and 2018 for the 2014, 2015 and 2016 grants, respectively. The amount earned can range from zero to $200 per unit depending on performance. Twenty-five percent of the P-Units’ value is determined by the Company’s relative TSR ranking for each one-year period ended December 31 and 25% of the P-Units’ value is determined by the relative TSR ranking for the three-year period ended December 31. P-Units cliff vest and payment is made, if any, on the third anniversary following the grant date. Any employee who terminates employment with the Company prior to the third anniversary for any reason other than retirement will not receive any payment with respect to P-Units unless approved by the Compensation Committee. Settlement of the P-Units granted in 2016 may be in cash or shares at the Compensation Committee's discretion. The Compensation Committee has previously determined that any amount earned with respect to P-Units granted in 2014 and 2015 would be settled in cash.
The grant-date fair value of P-Units granted in 2016 and 2015 was estimated to be $8.6 million and $9.0 million, respectively. Fair value was estimated using the Monte Carlo simulation model, which considers the probabilities of the Company’s TSR ranking at the end of each performance period, and the amount of the payout at each rank to determine the probability-weighted expected payout. The Company uses liability accounting to account for the P-Units. Compensation is recognized on a straight-line basis over a maximum period of three years from the grant date and is adjusted for changes in fair value through the end of the performance period.
Liabilities for estimated P-Unit obligations at December 31, 2016, included $10.9 million and $12.8 million classified as current and noncurrent, respectively, compared to $7.6 million and $11.4 million classified as current and noncurrent, respectively, at December 31, 2015. Current and noncurrent estimated P-Unit liabilities are included in Accrued Liabilities, and Other Liabilities, respectively, in the Consolidated Balance Sheets.
In 2016 and 2015, we paid $7.9 million and $2.7 million, respectively, in cash to settle P-Units that vested during the year. No performance-based awards vested or settled in 2014.
Share Appreciation Rights – Share appreciation rights (SARs) give the holder the right to receive ordinary shares at no cost to the employee, or cash at the discretion of the Committee, equal in value to the excess of the market price of a share on the date of exercise over the exercise price. All SARs granted have exercise prices equal to the market price of the underlying shares on the date of grant. SARs become exercisable in one-third annual increments over a three-year service period and expire ten years following the grant date. The Company intends to share-settle any exercises of SARs and has therefore accounted for SARs as equity awards.
No SARs have been granted since 2013.
SARs activity for the year ended December 31, 2016, is summarized below:
Number of shares under SARs | Weighted-average exercise price | Weighted-average remaining contractual term (in years) | Aggregate intrinsic value | |||||||||
(in thousands) | (in millions) | |||||||||||
Outstanding at January 1, 2016 | 1,615 | $ | 30.66 | |||||||||
Forfeited or expired | (71 | ) | 30.53 | |||||||||
Outstanding at December 31, 2016 | 1,544 | $ | 30.67 | 3.1 | $ | 0.7 | ||||||
Exercisable at December 31, 2016 | 1,544 | $ | 30.67 | 3.1 | $ | 0.7 | ||||||
The aggregate intrinsic value of SARs exercised in 2014 was $0.9 million. No SARs were exercised in 2016 and 2015.
Share Options – Share options granted to employees generally became exercisable in one-third or one-quarter annual increments over a three- or four-year service period at a price generally equal to the market price of the Company’s common shares on the date of grant. The Company has not granted share options since 2008. Unexercised options expire ten years after the grant date.
64
Share option activity for the year ended December 31, 2016, is summarized below:
Number of shares under option | Weighted-average exercise price | Weighted-average remaining contractual term (in years) | Aggregate intrinsic value | |||||||||
(in thousands) | (in millions) | |||||||||||
Outstanding at January 1, 2016 | 125 | $ | 21.02 | |||||||||
Forfeited or expired | (25 | ) | 43.85 | |||||||||
Outstanding at December 31, 2016 | 100 | $ | 15.31 | 1.9 | $ | 0.4 | ||||||
Exercisable at December 31, 2016 | 100 | $ | 15.31 | 1.9 | $ | 0.4 | ||||||
No options were exercised in 2016 or 2015. The aggregate intrinsic value of options exercised in 2014 was $1.4 million.
Award modifications – In 2014, the Company accelerated the vesting of share-based awards and extended the exercise period for vested SARs held by two retiring employees whose awards would otherwise have been forfeited upon retirement. As a result of the modifications, the Company recognized additional compensation expense in 2014 in the amount of $1.7 million, net of forfeitures, which is included in selling, general and administrative expense. The Company valued the modified SARs assuming they are to be outstanding near or until such time as they expire.
NOTE 10 – PENSION AND OTHER POSTRETIREMENT BENEFIT PLANS
The Company provides defined-benefit pension, health care and life insurance benefits upon retirement for certain full-time employees. Pension benefits are provided under The Rowan Pension Plan and the Restoration Plan of Rowan Companies, Inc. (the “Rowan SERP”), and health care and life insurance benefits are provided under the Retiree Life & Medical Supplemental Plan of Rowan Companies, Inc. (the “Retiree Medical Plan”).
65
The following table presents the changes in benefit obligations and plan assets for the years ended December 31 and the funded status and weighted-average assumptions used to determine the benefit obligation at each year end (dollars in millions):
2016 | 2015 | ||||||||||||||||||||||
Pension benefits | Other benefits | Total | Pension benefits | Other benefits | Total | ||||||||||||||||||
Projected benefit obligations: | |||||||||||||||||||||||
Balance, January 1 | $ | 760.0 | $ | 66.7 | $ | 826.7 | $ | 808.0 | $ | 73.6 | $ | 881.6 | |||||||||||
Interest cost | 26.3 | 1.6 | 27.9 | 31.9 | 2.9 | 34.8 | |||||||||||||||||
Service cost | 16.3 | 0.3 | 16.6 | 18.3 | 1.3 | 19.6 | |||||||||||||||||
Actuarial (gain) loss | 32.8 | 9.2 | 42.0 | (40.3 | ) | 0.5 | (39.8 | ) | |||||||||||||||
Plan amendments | — | (39.9 | ) | (39.9 | ) | (4.9 | ) | (7.2 | ) | (12.1 | ) | ||||||||||||
Plan settlements | (2.5 | ) | (2.6 | ) | (5.1 | ) | — | — | — | ||||||||||||||
Plan curtailments | (1.0 | ) | — | (1.0 | ) | — | — | — | |||||||||||||||
Exchange rate changes | 0.1 | — | 0.1 | (1.1 | ) | — | (1.1 | ) | |||||||||||||||
Benefits paid | (59.9 | ) | (5.4 | ) | (65.3 | ) | (51.9 | ) | (4.4 | ) | (56.3 | ) | |||||||||||
Balance, December 31 | 772.1 | 29.9 | 802.0 | 760.0 | 66.7 | 826.7 | |||||||||||||||||
Plan assets: | |||||||||||||||||||||||
Fair value, January 1 | 550.7 | — | 550.7 | 592.0 | — | 592.0 | |||||||||||||||||
Actual return | 33.8 | — | 33.8 | (0.1 | ) | — | (0.1 | ) | |||||||||||||||
Employer contributions | 22.5 | — | 22.5 | 11.3 | — | 11.3 | |||||||||||||||||
Plan settlements | (2.5 | ) | — | (2.5 | ) | — | — | — | |||||||||||||||
Exchange rate changes | — | — | — | (0.6 | ) | — | (0.6 | ) | |||||||||||||||
Benefits paid | (59.9 | ) | — | (59.9 | ) | (51.9 | ) | — | (51.9 | ) | |||||||||||||
Fair value, December 31 | 544.6 | — | 544.6 | 550.7 | — | 550.7 | |||||||||||||||||
Net benefit liabilities | $ | (227.5 | ) | $ | (29.9 | ) | $ | (257.4 | ) | $ | (209.3 | ) | $ | (66.7 | ) | $ | (276.0 | ) | |||||
Amounts recognized in Consolidated Balance Sheet: | |||||||||||||||||||||||
Accrued liabilities | $ | (29.7 | ) | $ | (2.4 | ) | $ | (32.1 | ) | $ | (22.2 | ) | $ | (9.2 | ) | $ | (31.4 | ) | |||||
Other liabilities (long-term) | (197.8 | ) | (27.5 | ) | (225.3 | ) | (187.1 | ) | (57.5 | ) | (244.6 | ) | |||||||||||
Net benefit liabilities | $ | (227.5 | ) | $ | (29.9 | ) | $ | (257.4 | ) | $ | (209.3 | ) | $ | (66.7 | ) | $ | (276.0 | ) | |||||
Accumulated contributions in excess of (less than) net periodic benefit cost | $ | 109.4 | $ | (63.3 | ) | $ | 46.1 | $ | 106.1 | $ | (75.3 | ) | $ | 30.8 | |||||||||
Amounts not yet reflected in net periodic benefit cost: | |||||||||||||||||||||||
Actuarial (loss) gain | (353.8 | ) | (7.3 | ) | (361.1 | ) | (336.7 | ) | 1.4 | (335.3 | ) | ||||||||||||
Prior service credit | 16.9 | 40.7 | 57.6 | 21.3 | 7.2 | 28.5 | |||||||||||||||||
Total accumulated other comprehensive income (loss) | (336.9 | ) | 33.4 | (303.5 | ) | (315.4 | ) | 8.6 | (306.8 | ) | |||||||||||||
Net benefit liabilities | $ | (227.5 | ) | $ | (29.9 | ) | $ | (257.4 | ) | $ | (209.3 | ) | $ | (66.7 | ) | $ | (276.0 | ) | |||||
Weighted-average assumptions: | |||||||||||||||||||||||
Discount rate | 4.29 | % | 3.94 | % | 4.54 | % | 4.18 | % | |||||||||||||||
Rate of compensation increase | 4.14 | % | 4.15 | % | |||||||||||||||||||
66
The projected benefit obligations for pension benefits in the preceding table reflect the actuarial present value of benefits accrued based on services rendered to date and include the estimated effect of future salary increases. The accumulated benefit obligations, which are presented below for all plans in the aggregate at December 31, are based on services rendered to date, but exclude the effect of future salary increases (in millions):
2016 | 2015 | ||||||
Accumulated benefit obligation | $ | 764.8 | $ | 755.1 | |||
On August 10, 2016, the Company communicated changes to the participants of its postretirement benefits plan that was previously frozen to new entrants in 2008. Based on these changes, effective as of January 1, 2017, eligible participants will now receive a health reimbursement account that provides a fixed dollar benefit per year. The impact of these changes to the plan and related, as of August 10, 2016, are presented in the table below (in millions):
Liability increase (decrease) | Accumulated other comprehensive income (loss) | Deferred tax liability increase (decrease) | |||||||||
Plan change benefit | $ | (39.9 | ) | $ | 25.9 | $ | 14.0 | ||||
Remeasurement loss | 5.2 | (3.4 | ) | (1.8 | ) | ||||||
Actuarial loss | 5.2 | (3.3 | ) | (1.9 | ) | ||||||
Total | $ | (29.5 | ) | $ | 19.2 | $ | 10.3 | ||||
During 2016, the Rowan SERP had a one-time settlement charge recognized in net periodic pension costs under US GAAP of $0.5 million as of December 31, 2016, attributable to lump sum payments during 2016 which exceeded the sum of the service cost and interest cost, the threshold that requires recognition of a settlement loss.
In 2016, the Norwegian Onshore and Offshore pension plans both experienced plan curtailments. Across Rowan Norway Limited, which employs participants of both the Onshore and Offshore pension plans, there was an employment reduction resulting in an approximate 50% reduction in active participants of the plans in early 2017. Since Rowan provided affected employees redundancy letters in November 2016, the curtailment was recognized effective December 31, 2016. The Company recognized a $0.4 million curtailment gain in net periodic pension costs for 2016.
During 2015, we amended the eligibility requirement with respect to the Retiree Medical Plan to exclude any participant that was previously eligible and was under the age of 50 as of January 1, 2016. The effect of the change was to reduce the projected benefit obligation by $7.2 million, which was net of an estimated $4.4 million payment to be made in early 2016 to the affected participants. The actual payment made in 2016 was $2.6 million and the Company recognized a related $0.1 million settlement loss.
Effective January 1, 2016, the Company changed its estimate of the service and interest cost components of net periodic benefit costs for its significant defined benefit pension and other postretirement benefit plans. Previously, the Company estimated the service and interest cost components utilizing a single weighted-average discount rate derived from the yield curve used to measure the benefit obligation. The new estimate utilizes a full yield curve approach in the estimation of these components by applying the specific spot rates along the yield curve used in the determination of the benefit obligation to their underlying projected cash flows. The new estimate provides a more precise measurement of service and interest costs by improving the correlation between projected benefit cash flows and their corresponding spot rates. While the benefit obligation measured under this approach is unchanged, more granular application of the spot rates reduced the service and interest cost for fiscal 2016.
Each of the Company’s pension plans has a benefit obligation that exceeds the fair value of plan assets.
The Company estimates the following amounts, which are classified in accumulated other comprehensive loss, a component of shareholders’ equity, will be recognized as net periodic benefit cost in 2017 (in millions):
Pension benefits | Other retirement benefits | Total | |||||||||
Actuarial (loss) gain | $ | (23.1 | ) | $ | (0.7 | ) | $ | (23.8 | ) | ||
Prior service credit | 5.0 | 13.3 | 18.3 | ||||||||
Total amortization | $ | (18.1 | ) | $ | 12.6 | $ | (5.5 | ) | |||
67
The components of net periodic pension cost and the weighted-average assumptions used to determine net cost were as follows (dollars in millions):
2016 | 2015 | 2014 | |||||||||
Service cost | $ | 16.3 | $ | 18.3 | $ | 14.6 | |||||
Interest cost | 26.3 | 31.9 | 32.7 | ||||||||
Expected return on plan assets | (39.6 | ) | (41.6 | ) | (41.6 | ) | |||||
Recognized actuarial loss | 21.0 | 25.7 | 19.9 | ||||||||
Amortization of prior service cost | (5.0 | ) | (4.5 | ) | (4.5 | ) | |||||
Curtailment gain recognized | (0.4 | ) | — | — | |||||||
Settlement loss recognized | 0.5 | — | — | ||||||||
Net periodic pension cost | $ | 19.1 | $ | 29.8 | $ | 21.1 | |||||
Discount rate | 4.53 | % | 3.97 | % | 4.83 | % | |||||
Expected return on plan assets | 7.28 | % | 7.45 | % | 8.00 | % | |||||
Rate of compensation increase | 4.14 | % | 4.15 | % | 4.15 | % | |||||
The components of net periodic cost of other postretirement benefits and the weighted average discount rate used to determine net cost were as follows (dollars in millions):
2016 | 2015 | 2014 | |||||||||
Service cost | $ | 0.3 | $ | 1.3 | $ | 1.1 | |||||
Interest cost | 1.6 | 2.9 | 3.0 | ||||||||
Amortization of prior service credit | (6.4 | ) | — | — | |||||||
Amortization of net (gain) loss | 0.3 | — | (0.3 | ) | |||||||
Settlement loss | 0.1 | — | — | ||||||||
Net periodic cost of other postretirement benefits | $ | (4.1 | ) | $ | 4.2 | $ | 3.8 | ||||
Discount rate | 4.18 | % | 3.95 | % | 4.74 | % | |||||
The assumed health care cost trend rates used to measure the expected cost of retirement health benefits was 6.9% for 2016, gradually decreasing to 4.5% for 2038 and thereafter. A one-percentage-point change in the assumed health care cost trend rates would change the reported amounts as follows (in millions):
One-percentage-point change | |||||||
Increase | Decrease | ||||||
Effect on total service and interest cost components for the year | $ | — | $ | — | |||
Effect on postretirement benefit obligation at year-end | N/A | N/A | |||||
The pension plans’ investment objectives for fund assets are: to achieve over the life of the plans a return equal to the plans’ expected investment return or the inflation rate plus 3%, whichever is greater; to invest assets in a manner such that contributions are minimized and future assets are available to fund liabilities; to maintain liquidity sufficient to pay benefits when due; and to diversify among asset classes so that assets earn a reasonable return with an acceptable level of risk. The plans employ several active managers with proven long-term records in their specific investment discipline.
68
Target allocations among asset categories and the fair values of each category of plan assets as of December 31, 2016 and 2015, classified by level within the US GAAP fair value hierarchy is presented below. The plans will periodically reallocate assets in accordance with the allocation targets, after giving consideration to the expected level of cash required to pay current benefits and plan expenses (dollars in millions):
Target range | Total | Quoted prices in active markets for identical assets (Level 1) | Significant observable inputs (Level 2) | Significant unobservable inputs (Level 3) | |||||||||||||
December 31, 2016: | |||||||||||||||||
Equities: | 53% to 69% | ||||||||||||||||
U.S. large cap | 22% to 28% | $ | 141.6 | $ | — | $ | 141.6 | $ | — | ||||||||
U.S. small cap | 4% to 10% | 41.5 | — | 41.5 | — | ||||||||||||
International all cap | 21% to 29% | 134.4 | — | 134.4 | — | ||||||||||||
International small cap | 2% to 8% | 27.4 | — | 27.4 | — | ||||||||||||
Real estate equities | 0% to 13% | 47.1 | — | 47.1 | — | ||||||||||||
Fixed income: | 25% to 35% | ||||||||||||||||
Cash and equivalents | 0% to 10% | 4.6 | — | 4.6 | — | ||||||||||||
Aggregate | 9% to 19% | 72.4 | — | 72.4 | — | ||||||||||||
Core plus | 9% to 19% | 73.0 | 73.0 | — | — | ||||||||||||
Group annuity contracts | 2.6 | — | 2.6 | — | |||||||||||||
Total | $ | 544.6 | $ | 73.0 | $ | 471.6 | $ | — | |||||||||
December 31, 2015: | |||||||||||||||||
Equities: | 53% to 69% | ||||||||||||||||
U.S. large cap | 22% to 28% | $ | 135.7 | $ | — | $ | 135.7 | $ | — | ||||||||
U.S. small cap | 4% to 10% | 36.4 | — | 36.4 | — | ||||||||||||
International all cap | 21% to 29% | 128.4 | — | 128.4 | — | ||||||||||||
International small cap | 2% to 8% | 33.1 | — | 33.1 | — | ||||||||||||
Real estate equities | 0% to 13% | 49.9 | — | 49.9 | — | ||||||||||||
Fixed income: | 25% to 35% | ||||||||||||||||
Cash and equivalents | 0% to 10% | 11.9 | — | 11.9 | — | ||||||||||||
Aggregate | 9% to 19% | 75.9 | — | 75.9 | — | ||||||||||||
Core plus | 9% to 19% | 76.1 | 76.1 | — | — | ||||||||||||
Group annuity contracts | 3.3 | — | 3.3 | — | |||||||||||||
Total | $ | 550.7 | $ | 76.1 | $ | 474.6 | $ | — | |||||||||
Assets in the U.S. equities category include investments in common and preferred stocks (and equivalents such as American Depository Receipts and convertible bonds) and may be held through separate accounts, commingled funds or an institutional mutual fund. Assets in the international equities category include investments in a broad range of international equity securities, including both developed and emerging markets, and may be held through a commingled or institutional mutual fund. The real estate category includes investments in pooled and commingled funds whose objectives are diversified equity investments in income-producing properties. Each real estate fund is intended to provide broad exposure to the real estate market by property type, geographic location and size and may invest internationally. Securities in both the aggregate and core plus fixed income categories include U.S. government, corporate, mortgage- and asset-backed securities and Yankee bonds, and both categories target an average credit rating of “A” or better at all times. Individual securities in the aggregate fixed income category must be investment grade or above at the time of purchase, whereas securities in the core plus category may have a rating of “B” or above. Additionally, the core plus category may invest in non-U.S. securities. Assets in the aggregate and core plus fixed income categories are held primarily through a commingled fund and an institutional mutual fund, respectively. Group annuity contracts are invested in a combination of equity, real estate, bond and other investments in connection with a pension plan in Norway.
69
The following is a description of the valuation methodologies used for the pension plan assets at December 31, 2016, and 2015:
• | Fair values of all U.S. equity securities, the international all cap equity securities and aggregate fixed income securities categorized as Level 2 were held in commingled funds which were valued daily based on a net asset value. |
• | Fair value of international small cap equity securities categorized as Level 2 were held in a limited partnership fund which was valued monthly based on a net asset value. |
• | The real estate categorized as Level 2 was held in two accounts (a commingled fund and a limited partnership). The assets in the commingled fund were valued monthly based on a net asset value and the assets in the limited partnership were valued quarterly based on a net asset value. |
• | Cash and equivalents categorized as Level 2 were valued at cost, which approximates fair value. |
• | Fair value of mutual fund investments in core plus fixed income securities categorized as Level 1 were based on quoted market prices which represent the net asset value of shares held. |
To develop the expected long-term rate of return on assets assumption, the Company considered the current level of expected returns on risk-free investments (primarily government bonds), the historical level of the risk premium associated with the plans’ other asset classes and the expectations for future returns of each asset class. The expected return for each asset class was then weighted based upon the current asset allocation to develop the expected long-term rate of return on assets assumption for the plans, which was reduced to 7.15% at December 31, 2016, from 7.30% at December 31, 2015.
Our estimates for our net benefit expense (income) are partially based on the expected return on pension plan assets. We use a market-related value of plan assets to determine the expected return on pension plan assets. In determining the market-related value of plan assets, differences between expected and actual asset returns are deferred and recognized over two years. If we used the fair value of our plan assets instead of the market-related value of plan assets in determining the expected return on pension plan assets, our net benefit expense would have been $5.5 million higher for the year ended December 31, 2016.
We base our determination of the asset return component of pension expense on a market-related valuation of assets, which reduces year-to-year volatility. This market-related valuation recognizes investment gains or losses over a two-year period from the year in which they occur. Investment gains or losses for this purpose are the difference between the expected return calculated using the market-related value of assets and the actual return based on the fair value of assets. Since the market-related value of assets recognizes gains or losses over a two-year period, the future value of assets will be impacted as previously deferred gains or losses are recorded. As of January 1, 2017, cumulative asset losses of approximately $17.2 million remained to be recognized in the calculation of the market-related value of assets.
The Company currently expects to contribute approximately $30 million to its pension plans in 2017 and to directly pay other postretirement benefits of approximately $2 million.
Estimated future annual benefit payments from plan assets are presented below. Such amounts are based on existing benefit formulas and include the effect of future service (in millions):
Pension benefits | Other postretirement benefits | ||||||
Year ended December 31, | |||||||
2017 | $ | 82.2 | $ | 2.4 | |||
2018 | 43.5 | 2.3 | |||||
2019 | 45.4 | 2.3 | |||||
2020 | 46.9 | 2.2 | |||||
2021 | 47.7 | 2.1 | |||||
2022 through 2026 | 245.1 | 10.2 | |||||
The Company sponsors defined contribution plans covering substantially all employees. Employer contributions to such plans are expensed as incurred and totaled $16.7 million in 2016, $20.0 million in 2015 and $19.0 million in 2014.
70
NOTE 11 – SHAREHOLDERS’ EQUITY
Reclassifications from Accumulated Other Comprehensive Loss
The following table sets forth the significant amounts reclassified out of each component of accumulated other comprehensive loss and their effect on net income (loss) for the period (in millions):
2016 | 2015 | 2014 | |||||||||
Amounts recognized as a component of net periodic pension and other postretirement benefit cost: | |||||||||||
Amortization of net loss | $ | (21.9 | ) | $ | (25.7 | ) | $ | (19.6 | ) | ||
Amortization of prior service credit | 10.7 | 4.5 | 4.5 | ||||||||
Total before income taxes | (11.2 | ) | (21.2 | ) | (15.1 | ) | |||||
Income tax benefit | 3.8 | 7.4 | 5.3 | ||||||||
Total reclassifications for the period, net of income taxes | $ | (7.4 | ) | $ | (13.8 | ) | $ | (9.8 | ) | ||
The Company records unrealized gains and losses related to net periodic pension and other postretirement benefit cost net of estimated taxes in Accumulated other comprehensive income (loss). The Company has a valuation allowance against its net U.S. deferred tax asset that is not expected to be realized. A portion of this valuation allowance is related to deferred tax benefits or expense as recorded in Accumulated other comprehensive income (loss).
Cash Dividends
In January 2016, the Company announced that it had discontinued its quarterly dividend.
During 2015, the Board of Directors approved quarterly cash dividends of $0.10 per Class A ordinary share, which were paid on March 3, May 26, August 25, and November 23, 2015, to shareholders of record at the close of business on February 9, May 12, August 11, and November 9, 2015, respectively.
During 2014, the Board of Directors approved quarterly cash dividends of $0.10 per share, which were paid on May 20, August 26, and November 25, 2014, to shareholders of record at the close of business on May 5, August 11, and November 11, 2014, respectively.
NOTE 12 – INCOME TAXES
Rowan plc, the parent company, is domiciled in the U.K. and is subject to the U.K. statutory rate of 23% for the period January 1 through March 31, 2014; 21% for the financial year beginning April 1, 2014; 20% for the financial year beginning April 1, 2015; and 19% for the financial year beginning April 1, 2017. On September 15, 2016, the U.K. enacted tax law to reduce the tax rate to 17% for the financial year beginning April 1, 2020. The U.K. statutory tax rate for 2016 is 20%.
The significant components of income taxes attributable to continuing operations are presented below (in millions):
2016 | 2015 | 2014 | |||||||||
Current: | |||||||||||
U.S. | $ | 10.0 | $ | 7.4 | $ | (62.3 | ) | ||||
Non - U.S. | 32.9 | 50.8 | 53.5 | ||||||||
State | — | 0.1 | 0.1 | ||||||||
Current expense (benefit) | 42.9 | 58.3 | (8.7 | ) | |||||||
Deferred: | |||||||||||
U.S. | (20.9 | ) | (6.3 | ) | (140.3 | ) | |||||
Non - U.S. | (17.0 | ) | 12.4 | (1.7 | ) | ||||||
Deferred provision (benefit) | (37.9 | ) | 6.1 | (142.0 | ) | ||||||
Total provision (benefit) | $ | 5.0 | $ | 64.4 | $ | (150.7 | ) | ||||
71
Differences between our provision for income taxes and the amount determined by applying the U.K. statutory rate to income before income taxes are set forth below (dollars in millions):
2016 | 2015 | 2014 | |||||||||
U.K. statutory rate | 20.00 | % | 20.25 | % | 21.50 | % | |||||
Tax at statutory rate | $ | 65.1 | $ | 31.9 | $ | (58.0 | ) | ||||
Increase (decrease) due to: | |||||||||||
Capitalized interest transactions | — | (5.7 | ) | (20.1 | ) | ||||||
Tax audit settlements | — | — | 10.4 | ||||||||
Foreign rate differential | (92.7 | ) | (30.0 | ) | 38.2 | ||||||
Deferred intercompany gain/loss | (20.1 | ) | (33.8 | ) | (86.6 | ) | |||||
Foreign asset basis difference | 405.9 | — | — | ||||||||
Luxembourg restructuring operating loss | (1,180.2 | ) | — | — | |||||||
Change in valuation allowance | 814.7 | 106.0 | (3.6 | ) | |||||||
Prior period adjustments | (4.1 | ) | (6.9 | ) | 7.5 | ||||||
Unrecognized tax benefits | 7.1 | 9.7 | (35.8 | ) | |||||||
U.S. tax on RCI non-U.S. subsidiaries | 6.3 | — | — | ||||||||
Termination of local country activity | — | (6.3 | ) | — | |||||||
Foreign tax credits/deductions | (1.5 | ) | (2.2 | ) | (4.9 | ) | |||||
Other, net | 4.5 | 1.7 | 2.2 | ||||||||
Total provision (benefit) | $ | 5.0 | $ | 64.4 | $ | (150.7 | ) | ||||
72
In 2016, organizational restructuring resulted in a Luxembourg net operating loss of $4,534 million resulting in a deferred tax asset of $1,180 million with an offsetting deferred tax liability for book over tax asset basis difference of $409 million and a valuation allowance of $747 million for the net deferred tax asset that is not expected to be realized.
Temporary differences and carryforwards which gave rise to deferred tax assets and liabilities at December 31 were as follows (in millions):
2016 | 2015 | ||||||
Deferred tax assets: | |||||||
Accrued employee benefit plan costs | $ | 81.1 | $ | 137.9 | |||
U.S. net operating loss | 111.2 | 27.5 | |||||
U.K. net operating loss | 2.8 | 2.8 | |||||
Trinidad net operating loss | 6.5 | 7.7 | |||||
Luxembourg net operating loss | 1,180.2 | — | |||||
Suriname net operating loss | 3.9 | — | |||||
Interest expense limitation carryforward | — | 42.1 | |||||
Other NOLs and tax credit carryforwards | 36.8 | 33.1 | |||||
Other | 31.2 | 30.6 | |||||
Total deferred tax assets | 1,453.7 | 281.7 | |||||
Less: valuation allowance | (889.8 | ) | (128.3 | ) | |||
Deferred tax assets, net of valuation allowance | 563.9 | 153.4 | |||||
Deferred tax liabilities: | |||||||
Property and equipment | 712.8 | 296.6 | |||||
Other | 12.3 | 52.6 | |||||
Total deferred tax liabilities | 725.1 | 349.2 | |||||
Net deferred tax asset (liability) | $ | (161.2 | ) | $ | (195.8 | ) | |
Management assesses the available positive and negative evidence to estimate if sufficient future taxable income will be generated to use the existing deferred tax assets. The significant negative evidence evaluated was the limited Luxembourg forecasted taxable income based on information as of December 31, 2016. Such evidence limits our ability to consider other positive evidence. On the basis of this evaluation, as of December 31, 2016, a valuation allowance of $747 million was established against the Luxembourg deferred tax assets created in the current period.
Management continues to assess positive and negative evidence that the U.S. deferred tax assets will be realized. There have been no changes on the prior assessment of the realization of the deferred tax assets and the U.S. will continue to have a valuation allowance for the period ended December 31, 2016. During the period ended December 31, 2016, we increased our valuation allowance on U.S. deferred tax assets by $12 million to $132 million, primarily due to the changes in the deferred tax assets related to net operating loss, interest limitations and depreciation.
As of December 31, 2015, an additional valuation allowance of $62 million on the U.S. 2014 and prior years’ deferred tax assets and an additional valuation allowance of $43 million on the U.S. deferred tax asset was recorded in 2015 to recognize only the portion of the deferred tax assets that is more likely to be realized.
The amount of the deferred tax assets considered realizable, however, could be adjusted if estimates of future taxable income during the carryforward period are reduced or increased or if negative evidence in the form of cumulative losses is no longer present, and additional weight may be given to evidence such as our projections for growth. As of each reporting date, the Company’s management considers new evidence, both positive and negative, that could impact management’s view with regard to future realization of deferred tax assets.
At December 31, 2016, the Company had approximately $428 million of net operating loss carryforwards (NOLs) in the U.S., which expire at various times between 2034 and 2041 and which is subject to a valuation allowance as discussed in the preceding paragraphs; $49 million of NOLs in the U.S. attributable to the Company’s non-U.S. subsidiaries expiring in 2032 and which is subject to a valuation allowance of $36 million at December 31, 2016; $4.5 billion of non-expiring NOLs in Luxembourg of which $2.9 billion is subject to a valuation allowance; $17 million of non-expiring NOLs in the U.K., of which $17 million is subject to
73
a valuation allowance; and $26 million of non-expiring NOLs in Trinidad, of which $14 million is subject to a valuation allowance. In addition, at December 31, 2016, the Company had $15 million of non-expiring NOLs in other foreign jurisdictions, of which $15 million is subject to a valuation allowance. The U.S. foreign tax credit of $29 million is intended to be carried back and does not have a valuation allowance. Due to the uncertainty of realization, we have a tax-effected valuation allowance as of December 31, 2016, in the amount of $890 million against our foreign tax credits, NOL carryforwards, and other deferred tax assets that may not be realizable, primarily relating to countries where we no longer operate or do not expect to generate sufficient future taxable income. Management has determined that no other valuation allowances were necessary at December 31, 2016, as anticipated future tax benefits relating to all recognized deferred income tax assets are expected to be fully realized when measured against a more likely than not standard.
The federal and foreign NOL carryforwards included unrecognized tax benefits taken in prior years. The NOLs for which a deferred tax asset is recognized for financial statement purposes in accordance with ASC 740 are presented net of these unrecognized tax benefits.
The Company has not provided deferred income taxes on certain undistributed earnings of its non-U.K. subsidiaries. Generally, the earnings of non-U.K. subsidiaries in which RCI does not have a direct or indirect ownership interest can be distributed to Rowan plc without the imposition of either U.K. or local country tax. It is generally the Company’s policy and intention to permanently reinvest earnings of non-U.S. subsidiaries of RCI outside the U.S. However, we have recognized taxes related to the earnings of certain subsidiaries that are not permanently reinvested or that will not be permanently reinvested in the future.
As of December 31, 2016, RCI's portion of the unremitted earnings of its non-U.S. subsidiaries that could be includable in taxable income of RCI, if distributed, was approximately $376 million. If facts and circumstances cause us to change our expectations regarding future tax consequences, the resulting tax impact could have a material effect on our consolidated financial statements. Should the non-U.S. subsidiaries of RCI make a distribution from these earnings, we may be subject to additional income taxes. It is not practicable to estimate the amount of deferred tax liability related to the undistributed earnings, and RCI's non-U.S. subsidiaries have no plan to distribute earnings in a manner that would cause them to be subject to U.S., U.K., or other local country taxation.
At December 31, 2016, 2015 and 2014, we had approximately $59 million, $62 million and $48 million, respectively, of net unrecognized tax benefits attributable to continuing operations. At December 31, 2016, $59 million would reduce the Company’s income tax provision if recognized.
The following table sets forth the changes in the Company’s gross unrecognized tax benefits for the years ended December 31 (in millions):
2016 | 2015 | 2014 | |||||||||
Gross unrecognized tax benefits - beginning of year | $ | 65.1 | $ | 54.7 | $ | 81.9 | |||||
Gross increases - tax positions in prior period | 46.2 | 4.4 | 19.9 | ||||||||
Gross decreases - tax positions in prior period | (0.6 | ) | (3.7 | ) | (10.6 | ) | |||||
Gross increases - current period tax positions | 10.9 | 9.7 | 9.5 | ||||||||
Settlements | (1.5 | ) | — | (37.8 | ) | ||||||
Lapse of statute of limitations | — | — | (8.2 | ) | |||||||
Gross unrecognized tax benefit - end of year | $ | 120.1 | $ | 65.1 | $ | 54.7 | |||||
Interest and penalties relating to income taxes are included in income tax expense. At December 31, 2016, 2015 and 2014, accrued interest was $11.8 million, $7.9 million and $5.5 million, respectively, and accrued penalties were $3.1 million, $2.8 million and $2.6 million, respectively. Accrued interest and penalties relating to uncertain tax positions that are not actually assessed will be reversed in the year of the resolution.
We have been advised by the U.S. Internal Revenue Service of proposed unfavorable tax adjustments of $85 million including applicable penalties for the open tax years 2009 through 2012. The unfavorable tax adjustments primarily related to the following items: 2009 tax benefits recognized as a result of applying the facts of a third-party tax case that provided favorable tax treatment for certain foreign contracts entered into in prior years to the Company’s situation; transfer pricing; and domestic production activity deduction. The IRS does not agree with our protest and they have submitted the proposed unfavorable tax adjustments to be reviewed by the IRS Appeals group. In years subsequent to 2012, we have similar positions that could be subject to adjustments for the open years. We have provided for amounts that we believe will be ultimately payable under the proposed adjustments and intend to vigorously defend our positions; however, if we determine the provisions for these matters to be inadequate due to new information or we are required to pay a significant amount of additional U.S. taxes and applicable penalties and interest in excess of amounts that have been provided for these matters, our consolidated results of operations and cash flows could be materially and adversely affected.
74
The Company’s U.S. federal tax returns for 2009 through 2012 are currently under audit by the IRS. Various state tax returns for 2009 and subsequent years remain open for examination. In the Company’s non-U.S. tax jurisdictions, returns for 2006 and subsequent years remain open for examination. We are undergoing other routine tax examinations in various U.S. and non-U.S. taxing jurisdictions in which the Company has operated. These examinations cover various tax years and are in various stages of finalization. The Company believes that any income taxes ultimately assessed by any taxing authorities will not materially exceed amounts for which the Company has already provided.
The components of income (loss) from continuing operations before income taxes were as follows (in millions):
2016 | 2015 | 2014 | |||||||||
U.S. | $ | (180.2 | ) | $ | (174.1 | ) | $ | (198.3 | ) | ||
Non-U.S. | 505.8 | 331.8 | (71.3 | ) | |||||||
Total | $ | 325.6 | $ | 157.7 | $ | (269.6 | ) | ||||
NOTE 13 – SEGMENT AND GEOGRAPHIC AREA INFORMATION
Prior to 2015, we reported our results as one operating segment, contract drilling. In 2015, we reevaluated our operating segments in light of our management structure, which is now organized along the differences in the markets served by our drillships and jack-up rigs. As a result, we determined we operate in two principal operating segments – deepwater, which consists of our drillship operations, and jack-ups. Both segments provide one service – contract drilling. The Company evaluates performance primarily based on income from operations.
The segment data which appears below is presented as though we operated in the two operating segments for each year presented. Depreciation and amortization and selling, general and administrative expenses related to our corporate function and other administrative offices have not been allocated to our operating segments for purposes of measuring segment operating income and are included in "Unallocated costs and other." "Other operating items" consists of, to the extent applicable, non-cash impairment charges, gains and losses on equipment sales and litigation and related items:
75
Years ended December 31, | |||||||||||
2016 | 2015 | 2014 | |||||||||
(In millions) | |||||||||||
Deepwater: | |||||||||||
Revenues | $ | 827.5 | $ | 747.8 | $ | 179.8 | |||||
Operating expenses: | |||||||||||
Direct operating costs (excluding items below) | 222.0 | 276.6 | 87.8 | ||||||||
Depreciation and amortization | 115.0 | 94.6 | 24.4 | ||||||||
Selling, general and administrative | — | — | — | ||||||||
Other operating items | 0.1 | — | — | ||||||||
Income from operations | $ | 490.4 | $ | 376.6 | $ | 67.6 | |||||
Capital expenditures | $ | 31.5 | $ | 555.1 | $ | 1,577.2 | |||||
Total assets (at end of year) | $ | 3,037.7 | $ | 3,100.1 | $ | 2,665.1 | |||||
Jack-ups: | |||||||||||
Revenues | $ | 1,015.7 | $ | 1,389.2 | $ | 1,644.6 | |||||
Operating expenses: | |||||||||||
Direct operating costs (excluding items below) | 556.2 | 716.5 | 903.5 | ||||||||
Depreciation and amortization | 282.6 | 283.9 | 283.5 | ||||||||
Selling, general and administrative | — | — | — | ||||||||
Other operating items | 40.9 | 328.8 | 544.9 | ||||||||
Income (loss) from operations | $ | 136.0 | $ | 60.0 | $ | (87.3 | ) | ||||
Capital expenditures | $ | 84.3 | $ | 128.8 | $ | 345.3 | |||||
Total assets (at end of year) | $ | 4,285.8 | $ | 4,437.9 | $ | 5,163.0 | |||||
Unallocated costs and other: | |||||||||||
Revenues | $ | — | $ | — | $ | — | |||||
Operating expenses: | |||||||||||
Direct operating costs (excluding items below) | — | — | — | ||||||||
Depreciation and amortization | 5.3 | 12.9 | 14.7 | ||||||||
Selling, general and administrative | 102.1 | 115.8 | 125.8 | ||||||||
Other operating items | 0.6 | 0.8 | 6.5 | ||||||||
Loss from operations | $ | (108.0 | ) | $ | (129.5 | ) | $ | (147.0 | ) | ||
Capital expenditures | $ | 1.8 | $ | 39.0 | $ | 35.7 | |||||
Total assets (at end of year) | $ | 1,352.1 | $ | 809.3 | $ | 564.2 | |||||
Consolidated: | |||||||||||
Revenues | $ | 1,843.2 | $ | 2,137.0 | $ | 1,824.4 | |||||
Operating expenses: | |||||||||||
Direct operating costs (excluding items below) | 778.2 | 993.1 | 991.3 | ||||||||
Depreciation and amortization | 402.9 | 391.4 | 322.6 | ||||||||
Selling, general and administrative | 102.1 | 115.8 | 125.8 | ||||||||
Other operating items | 41.6 | 329.6 | 551.4 | ||||||||
Income (loss) from operations | $ | 518.4 | $ | 307.1 | $ | (166.7 | ) | ||||
Capital expenditures | $ | 117.6 | $ | 722.9 | $ | 1,958.2 | |||||
Total assets (at end of year) | $ | 8,675.6 | $ | 8,347.3 | $ | 8,392.3 | |||||
76
The classifications of revenues and assets among geographic areas in the tables which follow were determined based on the physical location of assets. Because the Company’s offshore drilling rigs are mobile, classifications by area are dependent on the rigs’ location at the time revenues are earned, and may vary from one period to the next.
Years ended December 31, | |||||||||||
2016 | 2015 | 2014 | |||||||||
(In millions) | |||||||||||
Revenues: | |||||||||||
United States | $ | 852.8 | $ | 704.6 | $ | 283.8 | |||||
Saudi Arabia | 363.9 | 408.7 | 443.9 | ||||||||
Norway | 312.6 | 403.6 | 213.4 | ||||||||
United Kingdom | 120.6 | 163.0 | 288.2 | ||||||||
Other (1) | 193.3 | 457.1 | 595.1 | ||||||||
Total | $ | 1,843.2 | $ | 2,137.0 | $ | 1,824.4 | |||||
December 31, | |||||||
2016 | 2015 | ||||||
(In millions) | |||||||
Long-lived assets: | |||||||
United States | $ | 3,199.5 | $ | 3,522.7 | |||
United Kingdom | 1,229.9 | 827.5 | |||||
Saudi Arabia | 818.4 | 896.8 | |||||
Norway | 813.7 | 1,330.0 | |||||
Other (1) | 998.5 | 828.8 | |||||
Total | $ | 7,060.0 | $ | 7,405.8 | |||
(1) Other represents countries in which the Company operates that individually had revenues and long-lived assets representing less than 10% of total revenues or long-lived assets. | |||||||
NOTE 14 – MATERIAL CHARGES AND OTHER OPERATING ITEMS
Operating expenses for 2016 include (i) non-cash asset impairment charges totaling $34.3 million on five jack-up drilling units (see Note 7) and (ii) a $1.4 million reversal of an estimated liability for settlement of a withholding tax matter during a tax amnesty period which was related to a legal settlement for a 2014 termination of a contract for refurbishment work on the Rowan Gorilla III, as noted below in the 2015 period. Payment of such withholding taxes during the tax amnesty period resulted in the waiver of applicable penalties and interest.
Operating expenses for 2015 include non-cash asset impairment charges totaling $329.8 million on ten jack-up drilling units (see Note 7) and an adjustment of $7.6 million to an estimated liability for the 2014 contract termination in connection with refurbishment work on the Rowan Gorilla III. A settlement agreement for this matter was signed during the third quarter of 2015.
Operating expenses for 2014 include non-cash asset impairment charges aggregating $574.0 million, including $565.7 million in connection with twelve of the Company's oldest jack-up drilling units (see Note 7) and $8.3 million for a Company aircraft, which we sold later in 2014 at an immaterial loss.
NOTE 15 – SUPPLEMENTAL CASH FLOW INFORMATION
Non-cash investing and financing activities and other supplemental cash flow information follows (in millions):
2016 | 2015 | 2014 | |||||||||
Accrued but unpaid additions to property and equipment at December 31 | $ | 21.0 | $ | 32.2 | $ | 48.6 | |||||
Cash interest payments in excess of interest capitalized | 159.2 | 143.8 | 78.7 | ||||||||
Income tax payments (refunds), net | 38.1 | 37.5 | 8.5 | ||||||||
77
NOTE 16 – GUARANTEES OF REGISTERED SECURITIES
Rowan plc and its 100%-owned subsidiary, RCI, have entered into agreements providing for, among other things, the full, unconditional and irrevocable guarantee by Rowan plc of the prompt payment, when due, of any amount owed to the holders of RCI's Senior Notes and amounts outstanding under RCI’s revolving credit facility, if any.
The condensed consolidating financial information that follows is presented on the equity method of accounting in accordance with Rule 3-10 of Regulation S-X in connection with Rowan plc’s guarantee of the Senior Notes and reflects the corporate ownership structure as of December 31, 2016. Financial information as of December 31, 2015, and for the years ended December 31, 2015 and 2014 has been recast to reflect changes to the corporate ownership structure that occurred in 2016 and is presented as though the structure at December 31, 2016, was in place at January 1, 2014.
Subsequent to the issuance of the Company’s Annual Report on Form 10-K for the year ended December 31, 2015, the Company’s management identified immaterial errors in its condensed consolidating balance sheet as of December 31, 2015, resulting in the understatement of RCI deferred income taxes - net by $22.2 million and the overstatement of RCI shareholders’ equity by the same amount. The prior period amounts within the Company’s condensed consolidating balance sheet as of December 31, 2015 have been revised to reflect the correct balances. These errors had no impact on our consolidated financial statements.
78
Rowan Companies plc and Subsidiaries
Condensed Consolidating Statements of Operations
Year ended December 31, 2016
(In millions)
Rowan plc (Parent) | RCI (Issuer) | Non-guarantor subsidiaries | Consolidating adjustments | Consolidated | |||||||||||||||
REVENUES | $ | — | $ | 40.4 | $ | 1,836.9 | $ | (34.1 | ) | $ | 1,843.2 | ||||||||
COSTS AND EXPENSES: | |||||||||||||||||||
Direct operating costs (excluding items below) | — | 12.2 | 795.1 | (29.1 | ) | 778.2 | |||||||||||||
Depreciation and amortization | — | 19.2 | 382.7 | 1.0 | 402.9 | ||||||||||||||
Selling, general and administrative | 28.5 | 5.4 | 74.2 | (6.0 | ) | 102.1 | |||||||||||||
Loss on disposals of property and equipment | — | 0.9 | 7.8 | — | 8.7 | ||||||||||||||
Material charges and other operating items | — | — | 32.9 | — | 32.9 | ||||||||||||||
Total costs and expenses | 28.5 | 37.7 | 1,292.7 | (34.1 | ) | 1,324.8 | |||||||||||||
INCOME (LOSS) FROM OPERATIONS | (28.5 | ) | 2.7 | 544.2 | — | 518.4 | |||||||||||||
OTHER INCOME (EXPENSE): | |||||||||||||||||||
Interest expense, net of interest capitalized | — | (155.5 | ) | (4.1 | ) | 4.1 | (155.5 | ) | |||||||||||
Interest income | — | 5.1 | 2.8 | (4.1 | ) | 3.8 | |||||||||||||
Loss on extinguishment of debt | — | (31.2 | ) | — | — | (31.2 | ) | ||||||||||||
Other - net | 21.2 | (21.2 | ) | (9.9 | ) | — | (9.9 | ) | |||||||||||
Total other income (expense) - net | 21.2 | (202.8 | ) | (11.2 | ) | — | (192.8 | ) | |||||||||||
INCOME (LOSS) FROM CONTINUING OPERATIONS BEFORE INCOME TAXES | (7.3 | ) | (200.1 | ) | 533.0 | — | 325.6 | ||||||||||||
Provision for income taxes | — | 66.3 | (6.7 | ) | (54.6 | ) | 5.0 | ||||||||||||
INCOME (LOSS) FROM CONTINUING OPERATIONS | (7.3 | ) | (266.4 | ) | 539.7 | 54.6 | 320.6 | ||||||||||||
DISCONTINUED OPERATIONS, NET OF TAX | — | — | — | — | — | ||||||||||||||
EQUITY IN EARNINGS OF SUBSIDIARIES, NET OF TAX | 327.9 | 33.9 | — | (361.8 | ) | — | |||||||||||||
NET INCOME (LOSS) | $ | 320.6 | $ | (232.5 | ) | $ | 539.7 | $ | (307.2 | ) | $ | 320.6 | |||||||
79
Rowan Companies plc and Subsidiaries
Condensed Consolidating Statements of Operations
Year ended December 31, 2015
(In millions)
Rowan plc (Parent) | RCI (Issuer) | Non-guarantor subsidiaries | Consolidating adjustments | Consolidated | |||||||||||||||
REVENUES | $ | — | $ | 60.0 | $ | 2,133.4 | $ | (56.4 | ) | $ | 2,137.0 | ||||||||
COSTS AND EXPENSES: | |||||||||||||||||||
Direct operating costs (excluding items below) | — | 15.0 | 1,028.5 | (50.4 | ) | 993.1 | |||||||||||||
Depreciation and amortization | — | 19.5 | 370.4 | 1.5 | 391.4 | ||||||||||||||
Selling, general and administrative | 26.2 | 5.4 | 91.7 | (7.5 | ) | 115.8 | |||||||||||||
(Gain) loss on disposals of property and equipment | — | 0.9 | (8.6 | ) | — | (7.7 | ) | ||||||||||||
Material charges and other operating items | — | — | 337.3 | — | 337.3 | ||||||||||||||
Total costs and expenses | 26.2 | 40.8 | 1,819.3 | (56.4 | ) | 1,829.9 | |||||||||||||
INCOME (LOSS) FROM OPERATIONS | (26.2 | ) | 19.2 | 314.1 | — | 307.1 | |||||||||||||
OTHER INCOME (EXPENSE): | |||||||||||||||||||
Interest expense, net of interest capitalized | — | (145.3 | ) | (22.8 | ) | 22.8 | (145.3 | ) | |||||||||||
Interest income | 0.8 | 22.1 | 1.0 | (22.8 | ) | 1.1 | |||||||||||||
Loss on extinguishment of debt | — | (1.5 | ) | — | — | (1.5 | ) | ||||||||||||
Other - net | 22.3 | (22.0 | ) | (4.0 | ) | — | (3.7 | ) | |||||||||||
Total other income (expense) - net | 23.1 | (146.7 | ) | (25.8 | ) | — | (149.4 | ) | |||||||||||
INCOME (LOSS) FROM CONTINUING OPERATIONS BEFORE INCOME TAXES | (3.1 | ) | (127.5 | ) | 288.3 | — | 157.7 | ||||||||||||
Provision for income taxes | — | 29.7 | 48.6 | (13.9 | ) | 64.4 | |||||||||||||
INCOME (LOSS) FROM CONTINUING OPERATIONS | (3.1 | ) | (157.2 | ) | 239.7 | 13.9 | 93.3 | ||||||||||||
DISCONTINUED OPERATIONS, NET OF TAX | — | — | — | — | — | ||||||||||||||
EQUITY IN EARNINGS (LOSSES) OF SUBSIDIARIES, NET OF TAX | 96.4 | (136.4 | ) | — | 40.0 | — | |||||||||||||
NET INCOME (LOSS) | $ | 93.3 | $ | (293.6 | ) | $ | 239.7 | $ | 53.9 | $ | 93.3 | ||||||||
80
Rowan Companies plc and Subsidiaries
Condensed Consolidating Statements of Operations
Year ended December 31, 2014
(In millions)
Rowan plc (Parent) | RCI (Issuer) | Non-guarantor subsidiaries | Consolidating adjustments | Consolidated | |||||||||||||||
REVENUES | $ | — | $ | 63.8 | $ | 1,824.6 | $ | (64.0 | ) | $ | 1,824.4 | ||||||||
COSTS AND EXPENSES: | |||||||||||||||||||
Direct operating costs (excluding items below) | — | 3.7 | 1,048.2 | (60.6 | ) | 991.3 | |||||||||||||
Depreciation and amortization | — | 13.7 | 307.7 | 1.2 | 322.6 | ||||||||||||||
Selling, general and administrative | 26.3 | — | 104.1 | (4.6 | ) | 125.8 | |||||||||||||
(Gain) loss on disposals of property and equipment | — | (4.9 | ) | 3.2 | — | (1.7 | ) | ||||||||||||
Gain on litigation settlement | — | — | (20.9 | ) | — | (20.9 | ) | ||||||||||||
Material charges and other operating items | — | 12.2 | 561.8 | — | 574.0 | ||||||||||||||
Total costs and expenses | 26.3 | 24.7 | 2,004.1 | (64.0 | ) | 1,991.1 | |||||||||||||
INCOME (LOSS) FROM OPERATIONS | (26.3 | ) | 39.1 | (179.5 | ) | — | (166.7 | ) | |||||||||||
OTHER INCOME (EXPENSE): | |||||||||||||||||||
Interest expense, net of interest capitalized | — | (103.9 | ) | (3.1 | ) | 3.1 | (103.9 | ) | |||||||||||
Interest income | 0.3 | 3.5 | 1.1 | (3.1 | ) | 1.8 | |||||||||||||
Other - net | 22.4 | (22.3 | ) | (0.9 | ) | — | (0.8 | ) | |||||||||||
Total other income (expense) - net | 22.7 | (122.7 | ) | (2.9 | ) | — | (102.9 | ) | |||||||||||
LOSS FROM CONTINUING OPERATIONS BEFORE INCOME TAXES | (3.6 | ) | (83.6 | ) | (182.4 | ) | — | (269.6 | ) | ||||||||||
Benefit for income taxes | — | (116.6 | ) | (36.2 | ) | 2.1 | (150.7 | ) | |||||||||||
INCOME (LOSS) FROM CONTINUING OPERATIONS | (3.6 | ) | 33.0 | (146.2 | ) | (2.1 | ) | (118.9 | ) | ||||||||||
DISCONTINUED OPERATIONS, NET OF TAX | — | 4.0 | — | — | 4.0 | ||||||||||||||
EQUITY IN LOSSES OF SUBSIDIARIES, NET OF TAX | (111.3 | ) | (141.7 | ) | — | 253.0 | — | ||||||||||||
NET LOSS | $ | (114.9 | ) | $ | (104.7 | ) | $ | (146.2 | ) | $ | 250.9 | $ | (114.9 | ) | |||||
81
Rowan Companies plc and Subsidiaries
Condensed Consolidating Statements of Comprehensive Income (Loss)
Year ended December 31, 2016
(In millions)
Rowan plc (Parent) | RCI (Issuer) | Non-guarantor subsidiaries | Consolidating adjustments | Consolidated | |||||||||||||||
NET INCOME (LOSS) | $ | 320.6 | $ | (232.5 | ) | $ | 539.7 | $ | (307.2 | ) | $ | 320.6 | |||||||
OTHER COMPREHENSIVE INCOME: | |||||||||||||||||||
Net changes in pension and other postretirement plan assets and benefit obligations recognized in other comprehensive income, net of income taxes | (5.1 | ) | (5.1 | ) | — | 5.1 | (5.1 | ) | |||||||||||
Net reclassification adjustments for amount recognized in net income (loss) as a component of net periodic benefit cost, net of income taxes | 7.4 | 7.4 | — | (7.4 | ) | 7.4 | |||||||||||||
— | |||||||||||||||||||
2.3 | 2.3 | — | (2.3 | ) | 2.3 | ||||||||||||||
COMPREHENSIVE INCOME (LOSS) | $ | 322.9 | $ | (230.2 | ) | $ | 539.7 | $ | (309.5 | ) | $ | 322.9 | |||||||
Rowan Companies plc and Subsidiaries
Condensed Consolidating Statements of Comprehensive Income (Loss)
Year ended December 31, 2015
(In millions)
Rowan plc (Parent) | RCI (Issuer) | Non-guarantor subsidiaries | Consolidating adjustments | Consolidated | |||||||||||||||
NET INCOME (LOSS) | $ | 93.3 | $ | (293.6 | ) | $ | 239.7 | $ | 53.9 | $ | 93.3 | ||||||||
OTHER COMPREHENSIVE INCOME: | |||||||||||||||||||
Net changes in pension and other postretirement plan assets and benefit obligations recognized in other comprehensive income, net of income taxes | 7.0 | 7.0 | — | (7.0 | ) | 7.0 | |||||||||||||
Net reclassification adjustments for amount recognized in net income (loss) as a component of net periodic benefit cost, net of income taxes | 13.8 | 13.8 | — | (13.8 | ) | 13.8 | |||||||||||||
20.8 | 20.8 | — | (20.8 | ) | 20.8 | ||||||||||||||
COMPREHENSIVE INCOME (LOSS) | $ | 114.1 | $ | (272.8 | ) | $ | 239.7 | $ | 33.1 | $ | 114.1 | ||||||||
82
Rowan Companies plc and Subsidiaries
Condensed Consolidating Statements of Comprehensive Income (Loss)
Year ended December 31, 2014
(In millions)
Rowan plc (Parent) | RCI (Issuer) | Non-guarantor subsidiaries | Consolidating adjustments | Consolidated | |||||||||||||||
NET LOSS | $ | (114.9 | ) | $ | (104.7 | ) | $ | (146.2 | ) | $ | 250.9 | $ | (114.9 | ) | |||||
OTHER COMPREHENSIVE INCOME (LOSS): | |||||||||||||||||||
Net changes in pension and other postretirement plan assets and benefit obligations recognized in other comprehensive income, net of income taxes | (87.3 | ) | (87.3 | ) | — | 87.3 | (87.3 | ) | |||||||||||
Net reclassification adjustments for amount recognized in net loss as a component of net periodic benefit cost, net of income taxes | 9.8 | 9.8 | — | (9.8 | ) | 9.8 | |||||||||||||
(77.5 | ) | (77.5 | ) | — | 77.5 | (77.5 | ) | ||||||||||||
COMPREHENSIVE LOSS | $ | (192.4 | ) | $ | (182.2 | ) | $ | (146.2 | ) | $ | 328.4 | $ | (192.4 | ) | |||||
83
Rowan Companies plc and Subsidiaries
Condensed Consolidating Balance Sheets
December 31, 2016
(In millions)
Rowan plc (Parent) | RCI (Issuer) | Non-guarantor subsidiaries | Consolidating adjustments | Consolidated | |||||||||||||||
CURRENT ASSETS: | |||||||||||||||||||
Cash and cash equivalents | $ | 3.7 | $ | 532.0 | $ | 719.8 | $ | — | $ | 1,255.5 | |||||||||
Receivables - trade and other | — | 1.8 | 299.5 | — | 301.3 | ||||||||||||||
Prepaid expenses and other current assets | 0.3 | 12.9 | 10.3 | — | 23.5 | ||||||||||||||
Total current assets | 4.0 | 546.7 | 1,029.6 | — | 1,580.3 | ||||||||||||||
Property and equipment - gross | — | 631.0 | 8,469.8 | — | 9,100.8 | ||||||||||||||
Less accumulated depreciation and amortization | — | 273.8 | 1,767.0 | — | 2,040.8 | ||||||||||||||
Property and equipment - net | — | 357.2 | 6,702.8 | — | 7,060.0 | ||||||||||||||
Investments in subsidiaries | 5,115.8 | 6,097.9 | — | (11,213.7 | ) | — | |||||||||||||
Due from affiliates | 0.4 | 437.2 | 64.2 | (501.8 | ) | — | |||||||||||||
Other assets | — | 5.6 | 29.7 | — | 35.3 | ||||||||||||||
$ | 5,120.2 | $ | 7,444.6 | $ | 7,826.3 | $ | (11,715.5 | ) | $ | 8,675.6 | |||||||||
CURRENT LIABILITIES: | |||||||||||||||||||
Current portion of long-term debt | $ | — | $ | 126.8 | $ | — | $ | — | $ | 126.8 | |||||||||
Accounts payable - trade | 0.4 | 22.4 | 71.5 | — | 94.3 | ||||||||||||||
Deferred revenues | — | 0.1 | 103.8 | — | 103.9 | ||||||||||||||
Accrued liabilities | 0.3 | 107.4 | 51.1 | — | 158.8 | ||||||||||||||
Total current liabilities | 0.7 | 256.7 | 226.4 | — | 483.8 | ||||||||||||||
Long-term debt, less current portion | — | 2,553.4 | — | — | 2,553.4 | ||||||||||||||
Due to affiliates | 0.4 | 63.9 | 437.5 | (501.8 | ) | — | |||||||||||||
Other liabilities | 5.2 | 283.9 | 49.7 | — | 338.8 | ||||||||||||||
Deferred income taxes - net | — | 598.3 | 139.3 | (551.9 | ) | 185.7 | |||||||||||||
Shareholders' equity | 5,113.9 | 3,688.4 | 6,973.4 | (10,661.8 | ) | 5,113.9 | |||||||||||||
$ | 5,120.2 | $ | 7,444.6 | $ | 7,826.3 | $ | (11,715.5 | ) | $ | 8,675.6 | |||||||||
84
Rowan Companies plc and Subsidiaries
Condensed Consolidating Balance Sheets
December 31, 2015
(In millions)
Rowan plc (Parent) | RCI (Issuer) | Non-guarantor subsidiaries | Consolidating adjustments | Consolidated | |||||||||||||||
CURRENT ASSETS: | |||||||||||||||||||
Cash and cash equivalents | $ | 17.3 | $ | 9.5 | $ | 457.4 | $ | — | $ | 484.2 | |||||||||
Receivables - trade and other | 0.1 | 1.4 | 409.0 | — | 410.5 | ||||||||||||||
Prepaid expenses and other current assets | 0.4 | 19.3 | 6.9 | — | 26.6 | ||||||||||||||
Total current assets | 17.8 | 30.2 | 873.3 | — | 921.3 | ||||||||||||||
Property and equipment - gross | — | 592.8 | 8,475.3 | — | 9,068.1 | ||||||||||||||
Less accumulated depreciation and amortization | — | 242.7 | 1,419.6 | — | 1,662.3 | ||||||||||||||
Property and equipment - net | — | 350.1 | 7,055.7 | — | 7,405.8 | ||||||||||||||
Investments in subsidiaries | 4,763.3 | 6,026.5 | — | (10,789.8 | ) | — | |||||||||||||
Due from affiliates | 0.6 | 1,218.2 | 55.8 | (1,274.6 | ) | — | |||||||||||||
Other assets | — | 5.0 | 15.2 | — | 20.2 | ||||||||||||||
4,781.7 | 7,630.0 | 8,000.0 | (12,064.4 | ) | 8,347.3 | ||||||||||||||
CURRENT LIABILITIES: | |||||||||||||||||||
Current portion of long-term debt | — | — | — | — | — | ||||||||||||||
Accounts payable - trade | 1.0 | 19.1 | 89.5 | — | 109.6 | ||||||||||||||
Deferred revenues | — | — | 33.1 | — | 33.1 | ||||||||||||||
Accrued liabilities | 0.7 | 119.4 | 65.9 | — | 186.0 | ||||||||||||||
Total current liabilities | 1.7 | 138.5 | 188.5 | — | 328.7 | ||||||||||||||
Long-term debt, less current portion | — | 2,692.4 | — | — | 2,692.4 | ||||||||||||||
Due to affiliates | 2.9 | 55.8 | 1,215.9 | (1,274.6 | ) | — | |||||||||||||
Other liabilities | 4.6 | 304.7 | 48.6 | — | 357.9 | ||||||||||||||
Deferred income taxes - net | — | 544.5 | 150.8 | (499.5 | ) | 195.8 | |||||||||||||
Shareholders' equity | 4,772.5 | 3,894.1 | 6,396.2 | (10,290.3 | ) | 4,772.5 | |||||||||||||
$ | 4,781.7 | $ | 7,630.0 | $ | 8,000.0 | $ | (12,064.4 | ) | $ | 8,347.3 | |||||||||
85
Rowan Companies plc and Subsidiaries
Condensed Consolidating Statements of Cash Flows
Year ended December 31, 2016
(In millions)
Rowan plc (Parent) | RCI (Issuer) | Non-guarantor subsidiaries | Consolidating adjustments | Consolidated | |||||||||||||||
NET CASH PROVIDED BY (USED IN) OPERATIONS | $ | (11.4 | ) | $ | (82.8 | ) | $ | 1,101.3 | $ | (106.5 | ) | $ | 900.6 | ||||||
CASH FLOWS FROM INVESTING ACTIVITIES: | |||||||||||||||||||
Capital expenditures | — | (44.5 | ) | (73.1 | ) | — | (117.6 | ) | |||||||||||
Proceeds from disposals of property and equipment | — | 0.4 | 5.8 | — | 6.2 | ||||||||||||||
Collections on subsidiary note receivable | — | 689.7 | — | (689.7 | ) | — | |||||||||||||
Investments in consolidated subsidiaries | (0.2 | ) | (80.6 | ) | — | 80.8 | — | ||||||||||||
Net cash provided by (used in) investing activities | (0.2 | ) | 565.0 | (67.3 | ) | (608.9 | ) | (111.4 | ) | ||||||||||
CASH FLOWS FROM FINANCING ACTIVITIES: | |||||||||||||||||||
Advances (to) from affiliates | (2.0 | ) | 58.2 | (53.0 | ) | (3.2 | ) | — | |||||||||||
Contributions from issuer | — | — | 80.8 | (80.8 | ) | — | |||||||||||||
Proceeds from borrowings | — | 500.0 | — | — | 500.0 | ||||||||||||||
Repayments of borrowings | — | (511.8 | ) | (689.7 | ) | 689.7 | (511.8 | ) | |||||||||||
Dividends paid | — | — | (109.7 | ) | 109.7 | — | |||||||||||||
Debt issue costs | — | (8.7 | ) | — | — | (8.7 | ) | ||||||||||||
Excess tax benefits from share-based compensation | — | 2.6 | — | — | 2.6 | ||||||||||||||
Net cash provided by (used in) financing activities | (2.0 | ) | 40.3 | (771.6 | ) | 715.4 | (17.9 | ) | |||||||||||
INCREASE (DECREASE) IN CASH AND CASH EQUIVALENTS | (13.6 | ) | 522.5 | 262.4 | — | 771.3 | |||||||||||||
CASH AND CASH EQUIVALENTS, BEGINNING OF PERIOD | 17.3 | 9.5 | 457.4 | — | 484.2 | ||||||||||||||
CASH AND CASH EQUIVALENTS, END OF PERIOD | $ | 3.7 | $ | 532.0 | $ | 719.8 | $ | — | $ | 1,255.5 | |||||||||
86
Rowan Companies plc and Subsidiaries
Condensed Consolidating Statements of Cash Flows
Year ended December 31, 2015
(In millions)
Rowan plc (Parent) | RCI (Issuer) | Non-guarantor subsidiaries | Consolidating adjustments | Consolidated | |||||||||||||||
NET CASH PROVIDED BY (USED IN) OPERATIONS | $ | (7.5 | ) | $ | 4.7 | $ | 1,047.1 | $ | (47.4 | ) | $ | 996.9 | |||||||
CASH FLOWS FROM INVESTING ACTIVITIES: | |||||||||||||||||||
Capital expenditures | — | (23.2 | ) | (699.7 | ) | — | (722.9 | ) | |||||||||||
Proceeds from disposals of property and equipment | — | 2.9 | 16.5 | — | 19.4 | ||||||||||||||
Advances on subsidiary note receivable | — | (481.3 | ) | — | 481.3 | — | |||||||||||||
Collections on subsidiary note receivable | 36.6 | 503.5 | — | (540.1 | ) | — | |||||||||||||
Investments in consolidated subsidiaries | 0.2 | (37.7 | ) | — | 37.5 | — | |||||||||||||
Net cash provided by (used in) investing activities | 36.8 | (35.8 | ) | (683.2 | ) | (21.3 | ) | (703.5 | ) | ||||||||||
CASH FLOWS FROM FINANCING ACTIVITES: | |||||||||||||||||||
Advances (to) from affiliates | (7.4 | ) | 89.9 | (80.9 | ) | (1.6 | ) | — | |||||||||||
Contributions from issuer | — | — | 37.5 | (37.5 | ) | — | |||||||||||||
Proceeds from borrowings | — | 220.0 | 481.3 | (481.3 | ) | 220.0 | |||||||||||||
Repayments of borrowings | — | (317.9 | ) | (540.1 | ) | 540.1 | (317.9 | ) | |||||||||||
Dividends paid | (50.5 | ) | — | (49.0 | ) | 49.0 | (50.5 | ) | |||||||||||
Net cash used in financing activities | (57.9 | ) | (8.0 | ) | (151.2 | ) | 68.7 | (148.4 | ) | ||||||||||
INCREASE (DECREASE) IN CASH AND CASH EQUIVALENTS | (28.6 | ) | (39.1 | ) | 212.7 | — | 145.0 | ||||||||||||
CASH AND CASH EQUIVALENTS, BEGINNING OF PERIOD | 45.9 | 48.6 | 244.7 | — | 339.2 | ||||||||||||||
CASH AND CASH EQUIVALENTS, END OF PERIOD | $ | 17.3 | $ | 9.5 | $ | 457.4 | $ | — | $ | 484.2 | |||||||||
87
Rowan Companies plc and Subsidiaries
Condensed Consolidating Statements of Cash Flows
Year ended December 31, 2014
(In millions)
Rowan plc (Parent) | RCI (Issuer) | Non-guarantor subsidiaries | Consolidating adjustments | Consolidated | |||||||||||||||
NET CASH PROVIDED BY OPERATIONS | $ | 63.8 | $ | 82.5 | $ | 452.9 | $ | (176.2 | ) | $ | 423.0 | ||||||||
CASH FLOWS FROM INVESTING ACTIVITIES: | |||||||||||||||||||
Capital expenditures | — | (21.1 | ) | (1,937.1 | ) | — | (1,958.2 | ) | |||||||||||
Proceeds from disposals of property and equipment | — | 14.6 | 7.4 | — | 22.0 | ||||||||||||||
Investments in consolidated subsidiaries | — | (105.3 | ) | — | 105.3 | — | |||||||||||||
Net cash used in investing activities | — | (111.8 | ) | (1,929.7 | ) | 105.3 | (1,936.2 | ) | |||||||||||
CASH FLOWS FROM FINANCING ACTIVITIES: | |||||||||||||||||||
Advances (to) from affiliates | (49.2 | ) | (731.8 | ) | 782.2 | (1.2 | ) | — | |||||||||||
Contributions from issuer | — | — | 105.3 | (105.3 | ) | — | |||||||||||||
Proceeds from borrowings | — | 793.4 | — | — | 793.4 | ||||||||||||||
Dividends paid | (37.7 | ) | (75.0 | ) | (102.4 | ) | 177.4 | (37.7 | ) | ||||||||||
Debt issue costs | — | (0.7 | ) | — | — | (0.7 | ) | ||||||||||||
Proceeds from exercise of share options | 4.7 | — | — | — | 4.7 | ||||||||||||||
Excess tax benefits from share-based compensation | — | (0.1 | ) | — | — | (0.1 | ) | ||||||||||||
Net cash provided by (used in) financing activities | (82.2 | ) | (14.2 | ) | 785.1 | 70.9 | 759.6 | ||||||||||||
DECREASE IN CASH AND CASH EQUIVALENTS | (18.4 | ) | (43.5 | ) | (691.7 | ) | — | (753.6 | ) | ||||||||||
CASH AND CASH EQUIVALENTS, BEGINNING OF PERIOD | 64.3 | 92.1 | 936.4 | — | 1,092.8 | ||||||||||||||
CASH AND CASH EQUIVALENTS, END OF PERIOD | $ | 45.9 | $ | 48.6 | $ | 244.7 | $ | — | $ | 339.2 | |||||||||
NOTE 17 – RELATED PARTIES
On August 22, 2016, at the request of Blue Harbour Group, LP ("Blue Harbour"), one of the Company's largest shareholders, the Board of Directors agreed to appoint Mr. Charles L. Szews to the Board, and the Company and Blue Harbour entered into a Nomination and Support Agreement (“Support Agreement") that the Company would nominate Mr. Szews for election at the next annual meeting of shareholders, and in exchange, Blue Harbour would not initiate, take, encourage, or participate in any action to obtain representation on the Board of Directors (the "Board") or alter the composition of the Board or management during the Support Period (as defined in the Support Agreement). If the Board determines to nominate Mr. Szews for re-election at the 2018 annual general meeting of shareholders, the Support Period is extended for another year.
Mr. Tore Sandvold is a director of the Company and a director of Schlumberger, a provider of equipment and services to the Company. The Company has engaged in transactions in the ordinary course of business with Schlumberger totaling $28.4
88
million in 2016 for the purchase of equipment and services. These transactions were on an arm’s-length basis and Mr. Sandvold was not involved in such transactions in any way.
89
SELECTED QUARTERLY FINANCIAL DATA (UNAUDITED)
Unaudited quarterly financial data for each full quarter within the two most recent years follows (in millions except per share amounts):
First Quarter | Second Quarter | Third Quarter | Fourth Quarter | |||||||||||||
2016: | ||||||||||||||||
Revenues | $ | 500.2 | $ | 611.9 | $ | 379.4 | $ | 351.8 | ||||||||
Income (loss) from operations | 167.4 | 276.2 | 33.6 | 41.2 | ||||||||||||
Net income (loss) | 122.8 | 216.7 | 5.5 | (24.4 | ) | |||||||||||
Basic earnings (loss) per share | 0.98 | 1.73 | 0.04 | (0.19 | ) | |||||||||||
Diluted earnings (loss) per share | 0.98 | 1.72 | 0.04 | (0.19 | ) | |||||||||||
2015: | ||||||||||||||||
Revenues | $ | 547.0 | $ | 508.7 | $ | 545.4 | $ | 535.8 | ||||||||
Income (loss) from operations | 174.5 | 122.9 | (170.6 | ) | 180.2 | |||||||||||
Net income (loss) | 123.7 | 84.7 | (239.4 | ) | 124.4 | |||||||||||
Basic earnings (loss) per share | 0.99 | 0.68 | (1.92 | ) | 1.00 | |||||||||||
Diluted earnings (loss) per share | 0.99 | 0.68 | (1.92 | ) | 0.99 | |||||||||||
The sum of the per-share amounts for the quarters may not equal the per-share amounts for the full year due to differences in the computation of weighted average shares for the quarters and full year.
Income from operations in the third quarter 2016 included a $34.3 million noncash impairment charge to reduce the carrying values of five of our jack-up drilling units, partially offset by a $1.4 million reversal of an estimated liability for settlement of a withholding tax matter during a tax amnesty period which was related to a legal settlement for a 2014 termination of a contract for refurbishment work on the Rowan Gorilla III, as noted below in the 2015 periods. Payment of such withholding taxes during the tax amnesty period resulted in the waiver of applicable penalties and interest.
Income (loss) from operations in the second and third quarters of 2015 included a $5.0 million and a $2.6 million adjustment, respectively, to an estimated liability for the 2014 termination of a contract in connection with refurbishment work on the Rowan Gorilla III. A settlement agreement for this matter was signed during the third quarter of 2015. In addition, in the third quarter of 2015, we recognized non-cash asset impairment charges totaling $329.8 million.
ITEM 9. CHANGES IN AND DISAGREEMENTS WITH ACCOUNTANTS ON ACCOUNTING AND FINANCIAL DISCLOSURE
None
ITEM 9A. CONTROLS AND PROCEDURES
Evaluation of Disclosure Controls and Procedures
The Company’s management has evaluated, with the participation of the Company’s Chief Executive Officer and Chief Financial Officer, the effectiveness of the Company’s disclosure controls and procedures, as of the end of the period covered by this report, pursuant to Exchange Act Rule 13a-15. Based upon that evaluation, the Company’s Chief Executive Officer and Chief Financial Officer concluded that the Company’s disclosure controls and procedures were effective as of December 31, 2016.
Management's Report on Internal Control Over Financial Reporting
Our management is responsible for establishing and maintaining internal control over financial reporting as defined in Rules 13a-15(f) and 15d-15(f) under the Exchange Act (ICFR). Our internal control system was designed to provide reasonable assurance to the Company’s management and Board of Directors regarding the preparation and fair presentation of published financial statements. All internal control systems, no matter how well designed, have inherent limitations, and therefore can only provide reasonable assurance with respect to financial statement preparation and presentation.
90
Our management’s assessment is that the Company did maintain effective ICFR as of December 31, 2016, within the context of the Internal Control - Integrated Framework (2013) established by the Committee of Sponsoring Organizations of the Treadway Commission (COSO), and that the Company did not have a material change in ICFR during the fourth quarter of 2016.
See “Management’s Report on Internal Control over Financial Reporting” included in Item 8 of this Form 10-K.
Changes in Internal Control Over Financial Reporting
There have been no changes to our internal controls over financial reporting (as defined in Rule 13a-15(f) under the Exchange Act) during the quarter ended December 31, 2016 that have materially affected, or that are reasonably likely to materially affect, our internal control over financial reporting.
ITEM 9B. OTHER INFORMATION
Not applicable
PART III
ITEM 10. DIRECTORS, EXECUTIVE OFFICERS AND CORPORATE GOVERNANCE
Information concerning our directors will appear in our proxy statement for the 2017 annual general meeting of shareholders to be filed pursuant to Regulation 14A of the Exchange Act (Regulation 14A) on or before May 1, 2017 under the caption “Election of Directors.” Such information is incorporated herein by reference.
Information concerning our executive officers appears in Part I under the caption “Executive Officers of the Registrant” of this Form 10-K and is incorporated by reference.
Information concerning our Audit, Compensation and Nominating Committees will appear in our proxy statement for the 2017 annual general meeting of shareholders under the caption “Board of Directors Information.” Such information is incorporated herein by reference. Our committee charters and corporate governance guidelines are available on our website, www.rowan.com.
Information concerning compliance with Section 16(a) of the Securities Exchange Act will appear in our proxy statement for the 2017 annual general meeting of shareholders under the caption “Additional Information - Section 16(a) Beneficial Ownership Reporting Compliance.” Such information is incorporated herein by reference.
We have adopted a code of ethics that applies to the Company’s directors, officers and employees, including the Chief Executive Officer, Chief Financial Officer, Chief Accounting Officer and other persons performing similar functions. Our code of ethics is available on our website, www.rowan.com. We will disclose on our website any amendment to or waiver from our code of ethics on behalf of any of our executive officers or directors.
ITEM 11. EXECUTIVE COMPENSATION
Information concerning director and executive compensation will appear in our proxy statement for the 2017 annual general meeting of shareholders under the captions “Non-Executive Director Compensation,” “Compensation Discussion and Analysis,” and “Executive Compensation.” Such information is incorporated herein by reference.
ITEM 12. SECURITY OWNERSHIP OF CERTAIN BENEFICIAL OWNERS AND MANAGEMENT AND RELATED STOCKHOLDER MATTERS
Information concerning the security ownership of management will appear in our proxy statement for the 2017 annual general meeting of shareholders under the caption “Security Ownership of Management and Certain Beneficial Owners.” Such information is incorporated herein by reference.
The business address of all directors is the principal executive offices of the Company as set forth on the cover page of this Form 10-K.
91
Equity Compensation Plan Information
The following table provides information about our ordinary shares that may be issued under equity compensation plans as of December 31, 2016.
Number of securities to be issued upon exercise of outstanding options, warrants and rights (1) (a) | Weighted-average exercise price of outstanding options, warrants and rights (2) (b) | Number of securities remaining available for future issuance under equity compensation plans (excluding securities reflected in column (a)) (c) | ||
Equity compensation plans approved by security holders | 129,566 | $15.78 | 8,950,686 | |
Equity compensation plans not approved by security holders | — | — | — | |
Total | 129,566 | $15.78 | 8,950,686 | |
(1) | The number of securities to be issued includes (i) 100,000 options and 29,566 shares issuable under outstanding SARs (see note (2) below). |
(2) | The weighted-average exercise price in column (b) is based on (i) 100,000 shares under outstanding options with a weighted average exercise price of $15.31 per share, and (ii) 29,566 shares of stock that would be issuable in connection with 1,543,665 stock appreciation rights (SARs) outstanding at December 31, 2016. The number of shares issuable under SARs is equal in value to the excess of the Company’s share price on the date of exercise over the exercise price. The number of shares issuable under SARs included in column (a) was based on a December 31, 2016 closing stock price of $18.89 and a weighted-average exercise price of $30.67 per share. |
ITEM 13. CERTAIN RELATIONSHIPS AND RELATED TRANSACTIONS, AND DIRECTOR INDEPENDENCE
Information concerning director and executive related party transactions will appear in our proxy statement for the 2017 annual general meeting of shareholders within the section and under the captions “Corporate Governance - Director Independence” and “Corporate Governance - Related Party Transaction Policy.” Such information is incorporated herein by reference.
ITEM 14. PRINCIPAL ACCOUNTING FEES AND SERVICES
Information required by this Item is included in the proxy statement for the 2017 annual general meeting of shareholders under the caption “Audit Committee Report - Approval of Fees.” Such information is incorporated herein by reference.
PART IV
ITEM 15. EXHIBITS AND FINANCIAL STATEMENT SCHEDULES
(a) Index to Financial Statements, Financial Statement Schedules and Exhibits
(1) Financial Statements
See Part II, Item 8, “Financial Statements and Supplementary Data,” beginning on page 41 of this Form 10-K for a list of financial statements filed as a part of this report.
92
(2) Financial Statement Schedules
SCHEDULE II | ||||||||||||||||||||
ROWAN COMPANIES PLC AND SUBSIDIARIES | ||||||||||||||||||||
VALUATION AND QUALIFYING ACCOUNTS AND ALLOWANCES | ||||||||||||||||||||
FOR THE THREE YEARS ENDED DECEMBER 31, 2016 | ||||||||||||||||||||
Additions | ||||||||||||||||||||
Balance at | Balance at | |||||||||||||||||||
Beginning | Charged to | End of | ||||||||||||||||||
Description | of Period | Expense, Net | Adjustments | Deductions | Period | |||||||||||||||
(In millions) | ||||||||||||||||||||
Year Ended December 31, 2016: | ||||||||||||||||||||
Valuation allowance of deferred tax assets | $ | 128.3 | $ | 761.5 | $ | — | $ | — | $ | 889.8 | ||||||||||
Year Ended December 31, 2015: | ||||||||||||||||||||
Valuation allowance of deferred tax assets | $ | 22.3 | $ | 106.0 | $ | — | $ | — | $ | 128.3 | ||||||||||
Year Ended December 31, 2014: | ||||||||||||||||||||
Valuation allowance of deferred tax assets | $ | 25.9 | $ | (3.6 | ) | $ | — | $ | — | $ | 22.3 | |||||||||
For the year ended December 31, 2016, management assessed negative and positive evidence and determined the need to establish a valuation allowance against the Luxembourg deferred tax assets of $747 million as discussed in Note 12 of Notes to Consolidated Financial Statements in Part II, Item 8 of this Form 10-K.
For the December 31, 2015, an additional valuation allowance of $62 million on the U.S. 2014 and prior years’ deferred tax assets and an additional valuation allowance of $43 million on the U.S. 2015 deferred tax assets has been recorded in 2015 to recognize only the portion of the deferred tax assets that is more likely to be realized.
Financial Statement Schedules I, III, IV, and V are not included in this Form 10-K because such schedules are not required, the required information is not significant, or the information is presented elsewhere in the financial statements.
(3) Exhibits
Unless otherwise indicated below as being incorporated by reference to another filing of the Company with the Securities and Exchange Commission, each of the following exhibits is filed herewith:
²vª 2.1 | Rowan Asset Transfer and Contribution Agreement dated November 21, 2016 between Rowan Rex Limited and Saudi Aramco Development Company. | ||
²vª 2.2 | Saudi Aramco Asset Transfer and Contribution Agreement dated November 21, 2016 between Rowan Rex Limited and Saudi Aramco Development Company. | ||
3.1 | Articles of Association of the Company, incorporated by reference to Exhibit 3.1 of Rowan Companies, Inc.’s Current Report on Form 8-K filed on May 4, 2012 (File No. 1-5491). | ||
4.1 | Form of Share Certificate for the Company, incorporated by reference to Exhibit 4.5 of the Company’s Current Report on Form 8-K filed on May 4, 2012 (File No. 1-5491). | ||
4.2 | Indenture for Senior Debt Securities dated as of July 21, 2009, between Rowan Companies, Inc. and U.S. Bank National Association, as trustee, incorporated by reference to Exhibit 4.1 of the Company’s Current Report on Form 8-K filed on July 21, 2009 (File No. 1-5491). | ||
4.3 | First Supplemental Indenture dated as of July 21, 2009, between Rowan Companies, Inc. and U.S. Bank National Association, as trustee, incorporated by reference to Exhibit 4.2 of the Company’s Current Report on Form 8-K filed on July 21, 2009 (File No. 1-5491). | ||
4.4 | Form of 7.875% Senior Note due 2019, incorporated by reference to Exhibit 4.2 of the Company’s Current Report on Form 8-K filed on July 21, 2009 (File No. 1-5491). | ||
93
4.5 | Second Supplemental Indenture dated as of August 30, 2010, between Rowan Companies, Inc. and U.S. Bank National Association, as trustee, incorporated by reference to Exhibit 4.2 of the Company’s Current Report on Form 8-K filed on August 30, 2010 (File No. 1-5491). | ||
4.6 | Form of 5% Senior Note due 2017, incorporated by reference to Exhibit 4.2 of the Company’s Current Report on Form 8-K filed on August 30, 2010 (File No. 1-5491). | ||
4.7 | Third Supplemental Indenture dated as of May 4, 2012, among Rowan Companies, Inc., the Company and U.S. Bank National Association, as trustee, incorporated by reference to Exhibit 4.4 to the Company's Current Report on Form 8-K filed on May 4, 2012 (File No. 1-5491). | ||
4.8 | Fourth Supplemental Indenture dated as of May 21, 2012, among Rowan Companies, Inc., the Company and U.S. Bank National Association, as trustee, incorporated by reference to Exhibit 4.2 to the Company's Current Report on Form 8-K filed on May 21, 2012 (File No. 1-5491). | ||
4.9 | Form of 4.875% Senior Note due 2022, incorporated by reference to Exhibit 4.2 to the Company's Current Report on Form 8-K filed on May 21, 2012 (File No. 1-5491). | ||
4.10 | Fifth Supplemental Indenture dated as of December 11, 2012, among Rowan Companies, Inc., the Company and U.S. Bank National Association, as trustee, incorporated by reference to Exhibit 4.3 to the Company’s Current Report on Form 8-K filed on December 11, 2012 (File No. 1-5491). | ||
4.11 | Form of 5.4% Senior Note due 2042, incorporated by reference to Exhibit 4.3 to the Company's Current Report on Form 8-K filed on December 11, 2012 (File No. 1-5491). | ||
4.12 | Sixth Supplemental Indenture dated as of January 15, 2014, among Rowan Companies, Inc., Rowan Companies plc and U.S. Bank National Association, as trustee, incorporated by reference to Exhibit 4.2 of the Company’s Current Report on Form 8-K filed on January 15, 2014 (File No. 1-5491). | ||
4.13 | Form of 4.75% Senior Note due 2024, incorporated by reference to Exhibit 4.2 of the Company’s Current Report on Form 8-K filed on January 15, 2014 (File No. 1-5491). | ||
4.14 | Seventh Supplemental Indenture dated as of January 15, 2014, among Rowan Companies, Inc., Rowan Companies plc and U.S. Bank National Association, as trustee, incorporated by reference to Exhibit 4.3 of the Company’s Current Report on Form 8-K filed on January 15, 2014 (File No. 1-5491). | ||
4.15 | Form of 5.85% Senior Note due 2044, incorporated by reference to Exhibit 4.3 of the Company’s Current Report on Form 8-K filed on January 15, 2014 (File No. 1-5491). | ||
4.16 | Eighth Supplemental Indenture dated as of December 19, 2016, among Rowan Companies, Inc., Rowan Companies plc and U.S. Bank National Association, as trustee, incorporated by reference to Exhibit 4.2 of the Company’s Current Report on Form 8-K filed on December 19, 2016 (File No. 1-5491). | ||
4.17 | Form of 7.375% Senior Note due 2025, incorporated by reference to Exhibit 4.2 of the Company’s Current Report on Form 8-K filed on December 19, 2016 (File No. 1-5491). | ||
9 | Nomination and Support Agreement between Rowan Companies plc and Blue Harbour Group LP and Blue Barbour Holdings, LLC, dated August 22, 2016, incorporated by reference to Exhibit 99.2 to the Company's Current Report on Form 8-K filed on August 23, 2016 (File No. 1-5491). | ||
*10.4 | 2005 Rowan Companies, Inc. Long-Term Incentive Plan, incorporated by reference to Exhibit 10.1 to Form 8-K filed May 10, 2005 (File No. 1-5491) and Form of Non-Employee Director 2005 Restricted Stock Unit Grant, Form of Non-Employee Director 2006 Restricted Stock Unit Grant, Form of 2005 Nonqualified Stock Option Agreement related thereto, each incorporated by reference to Exhibits 10c, 10d, 10e, 10f and 10g, respectively, to Form 10-Q for the quarterly period ended June 30, 2005 (File No. 1-5491). | ||
*10.5 | Form of Change in Control Agreement and Form of Change in Control Supplement, incorporated by reference to Exhibits 10.1 and 10.2 to Form 8-K filed December 21, 2007 (File 1-5491). | ||
10.6 | Form of Indemnification Agreement between Rowan Companies, Inc. and each of its directors and certain officers, incorporated by reference to Exhibit 10.1 of the Company’s Current Report on Form 8-K dated November 2, 2009 (File No. 1-5491). | ||
²*10.7 | Restoration Plan of Rowan Companies, Inc. (as amended and restated effective January 1, 2013). | ||
10.8 | Share Purchase Agreement dated July 1, 2010, among Rowan Companies, Inc., Skeie Technology AS, Skeie Tech Invest AS and Wideluck Enterprises Limited and Pre-Acceptance Letters from Skeie Holding AS and Trafalgar AS, each relating to the purchase of shares of common stock of Skeie Drilling & Production ASA, incorporated by reference to Exhibit 10.1 of the Company’s Current Report on Form 8-K filed on August 19, 2010 (File No. 1-5491). | ||
10.9 | Amended and Restated Credit Agreement dated January 23, 2014 among Rowan Companies, Inc., as Borrower, Rowan Companies plc, as Parent, the Lenders named therein, Wells Fargo Bank, National Association, as Administrative Agent, Issuing Lender and Swingline Lender and Citibank, N.A., DnB Bank ASA, New York Branch, Royal Bank of Canada, Bank of America, N.A., Barclays Bank PLC and Goldman Sachs Bank USA, as Co-Syndication Agents), incorporated by reference to Exhibit 10.1 of the Company’s Current Report on Form 8-K filed on January 28, 2014 (File No. 1-5491). | ||
94
10.10 | Amended and Restated Parent Guaranty dated as of January 23, 2014, by the Company, as Guarantor, in favor of Wells Fargo Bank, National Association, as Administrative Agent, incorporated by reference to Exhibit 10.12 to the Company's Annual Report on Form 10-K for the year ended December 31, 2013 (File No. 1-5491). | ||
10.11 | Stock Purchase Agreement dated May 13, 2011, between Rowan Companies, Inc., as seller, and Joy Global Inc., as buyer, relating to the sale of all the outstanding equity interests in LeTourneau Technologies, Inc., a wholly owned subsidiary of the Company, incorporated by reference to Exhibit 2.1 of the Company’s Current Report on Form 8-K filed on May 18, 2011 (File No. 1-5491). | ||
10.12 | Purchase and Sale Agreement dated July 19, 2011, among Rowan Companies, Inc., as seller, and Ensign United States Drilling (S.W.) Inc., as buyer, and Ensign Energy Services Inc., as guarantor of the buyer’s performance under the agreement, relating to the sale of all the outstanding equity interests in Rowan Drilling Company LLC, a wholly owned subsidiary of the Company, incorporated by reference to Exhibit 2.1 of the Company’s Current Report on Form 8-K filed on July 20, 2011 (File No. 1-5491). | ||
*10.15 | Amendment to the 2005 Rowan Companies, Inc. Long-Term Incentive Plan, effective May 4, 2012, incorporated by reference to Exhibit 10.11 to the Company’s Current Report on Form 8-K filed on May 4, 2012 (File No. 1-5491). | ||
*10.16 | 2009 Rowan Companies, Inc. Incentive Plan (as Amended and Restated and as Assumed and Adopted by the Company, effective May 4, 2012), incorporated by reference to Exhibit 10.4 to the Company’s Current Report on Form 8-K filed on May 4, 2012. | ||
*10.17 | Form of Restricted Share Notice pursuant to the 2009 Rowan Companies, Inc. Incentive Plan, incorporated by reference to Exhibit 10.5 to the Company’s Current Report on Form 8-K filed on May 4, 2012 (File No. 1-5491). | ||
*10.18 | Form of Non-Employee Director Restricted Share Unit Notice pursuant to 2009 Rowan Companies, Inc. Incentive Plan, incorporated by reference to Exhibit 10.8 of the Company’s Quarterly Report on Form 10-Q for the quarterly period ended September 30, 2012 (File No. 1-5491). | ||
*10.19 | Forms of Restricted Share Unit Award Notice, Share Appreciation Right Award Notice and Performance Unit Award Notice pursuant to the 2009 Rowan Companies, Inc. Incentive Plan, incorporated by reference to Exhibit 10.1 to the Company’s Current Report on Form 8-K filed on March 8, 2013 (File No. 1-5491). | ||
*10.20 | Deed of Assumption dated May 4, 2012, executed by the Company, incorporated by reference to Exhibit 10.3 of the Company’s Current Report on Form 8-K filed on May 4, 2012 (File No. 1-5491). | ||
*10.21 | Form of Supplement to Change in Control Agreement, incorporated by reference to Exhibit 10.12 of the Company’s Current Report on Form 8-K filed on May 4, 2012 (File No. 1-5491). | ||
10.22 | Form of Deed of Indemnity of the Company, incorporated by reference to Exhibit 10.13 of the Company’s Current Report on Form 8-K filed on May 4, 2012 (File No. 1-5491). | ||
*10.23 | Retirement Agreement with William H. Wells dated September 7, 2012, incorporated by reference to Exhibit 10.14 of the Company’s Form 10-Q for the quarter ended September 30, 2012 (File No. 1-5491). | ||
*10.24 | Retirement Policy of Rowan Companies, Inc., effective March 6, 2013, incorporated by reference to Exhibit 10.2 to the Company’s Current Report on Form 8-K filed on March 8, 2013 (File No. 1-5491). | ||
*10.25 | 2013 Rowan Companies plc Incentive Plan (effective April 26, 2013), incorporated by reference to Annex A to the Company’s proxy statement filed on March 13, 2013 (File No. 1-5491). | ||
*10.26 | Form of Employee Restricted Share Unit Notice pursuant to the 2013 Rowan Companies plc Incentive Plan (effective April 26, 2013), incorporated by reference to Exhibit 10.2 to the Company’s Current Report on Form 8-K filed on April 30, 2013 (File No. 1-5491). | ||
*10.27 | Form of Share Appreciation Right Notice pursuant to the 2013 Rowan Companies plc Incentive Plan (effective April 26, 2013), incorporated by reference to Exhibit 10.3 to the Company’s Current Report on Form 8-K filed on April 30, 2013 (File No. 1-5491). | ||
*10.28 | Form of Performance Unit Award Notice pursuant to Annex 2 to the 2013 Rowan Companies plc Incentive Plan (effective April 26, 2013), incorporated by reference to Exhibit 10.4 to the Company’s Current Report on Form 8-K filed on April 30, 2013 (File No. 1-5491). | ||
*10.29 | Non-Employee Director Restricted Share Unit Notice pursuant to Annex 1 to the 2013 Rowan Companies plc Incentive Plan (effective April 26, 2013), incorporated by reference to Exhibit 10.5 to the Company’s Current Report on Form 8-K filed on April 30, 2013 (File No. 1-5491). | ||
*10.30 | Form of Change in Control Agreement entered into with executives on or after April 25, 2014, incorporated by reference to Exhibit 10.31 to the Company's Annual Report on Form 10-K for the year ended December 31, 2014 (File No. 1-5491). | ||
*10.31 | Amendment to Rowan Companies Incentive Plans, effective as of April 25, 2014, incorporated by reference to Exhibit 10.3 of the Company’s Current Report on Form 8-K filed on May 1, 2014 (File No. 1-5491). | ||
*10.32 | Form of Waiver and Release Agreement, incorporated by reference to Exhibit 10.1 of the Company’s Quarterly Report on Form 10-Q for the quarter ended September 30, 2014 (File No. 1-5491). | ||
95
10.33 | Extension Agreement and Amendment No. 2 dated effective January 25, 2016 to the Amended and Restated Credit Agreement dated January 23, 2014, as amended, incorporated by reference to Exhibit 10.1 to the Company’s Current Report on Form 8-K filed on January 29, 2016 (File No. 1-5491). | ||
²*10.34 | Summary of the Company’s Annual Incentive Plan. | ||
*10.35 | Amendment to 2013 Rowan Companies plc Incentive Plan, effective April 28, 2016, incorporated by reference to Exhibit 10.1 of the Company’s Quarterly Report on Form 10-Q filed on May 4, 2016 (File No. 1-5491). | ||
*10.36 | Form of Non-Employee Director Restricted Share Award Notice, incorporated by reference to Exhibit 10.1 to the Company's Current Report on Form 8-K filed on May 2, 2016 (File No. 1-5491). | ||
*10.37 | Retention Bonus Letter for T. Fred Brooks, incorporated by reference to Exhibit 10.1 to the Company's Current Report on Form 8-K filed on August 11, 2016 (File No. 1-5491). | ||
²v 10.38 | Shareholders’ Agreement dated 21 November 2016 (G) between Saudi Aramco Development Company and Rowan Rex Limited Relating to the Offshore Drilling Joint Venture | ||
²21 | Subsidiaries of the Registrant. | ||
²23 | Consent of Independent Registered Public Accounting Firm. | ||
²24 | Power of Attorney. | ||
²31.1 | Certification of Chief Executive Officer Pursuant to Section 302 of the Sarbanes-Oxley Act of 2002. | ||
²31.2 | Certification of Chief Financial Officer Pursuant to Section 302 of the Sarbanes-Oxley Act of 2002. | ||
²32.1 | Certification of Chief Executive Officer Pursuant to Section 906 of the Sarbanes-Oxley Act of 2002. | ||
²32.2 | Certification of Chief Financial Officer Pursuant to Section 906 of the Sarbanes-Oxley Act of 2002. | ||
²101.INS | XBRL Instance Document. | ||
²101.SCH | XBRL Taxonomy Extension Schema Document. | ||
²101.CAL | XBRL Taxonomy Extension Calculation Linkbase Document. | ||
²101.DEF | XBRL Taxonomy Extension Definition Linkbase Document. | ||
²101.LAB | XBRL Taxonomy Extension Label Linkbase Document. | ||
²101.PRE | XBRL Taxonomy Extension Presentation Linkbase Document. | ||
__________
* | Executive compensatory plan or arrangement. |
² | Filed herewith. |
v | Confidential Information has been omitted and filed separately with the Securities and Exchange Commission. Confidential treatment has been requested with respect to this omitted information. |
ª | Schedules and exhibits have been omitted pursuant to Item 601(b)(2) of Regulation S-K. The registrant agrees to furnish supplementally a copy of the omitted schedules and exhibits to the Securities and Exchange Commission upon request. |
Rowan agrees to furnish to the Commission upon request a copy of all instruments defining the rights of holders of long-term debt of the Company and its subsidiaries.
ITEM 16. FORM 10-K SUMMARY
Not applicable
96
SIGNATURES
Pursuant to the requirements of Section 13 or 15(d) of the Securities Exchange Act of 1934, the Registrant has duly caused this report to be signed on its behalf by the undersigned, thereunto duly authorized.
ROWAN COMPANIES PLC | |
(Registrant) | |
By: /s/ THOMAS P. BURKE | |
Thomas P. Burke | |
President and Chief Executive Officer | |
Date: February 24, 2017 | |
Pursuant to the requirements of the Securities Exchange Act of 1934, this report has been signed below by the following persons on behalf of the Registrant and in the capacities and on the date indicated.
Signature | Title | Date |
/s/ THOMAS P. BURKE | President and Chief Executive Officer and Director (Principal Executive Officer) | February 24, 2017 |
(Thomas P. Burke) | ||
/s/ STEPHEN M. BUTZ | Executive Vice President and Chief Financial Officer (Principal Financial Officer) | February 24, 2017 |
(Stephen M. Butz) | ||
/s/ DENNIS S. BALDWIN | Chief Accounting Officer (Principal Accounting Officer) | February 24, 2017 |
(Dennis S. Baldwin) | ||
/s/ WILLIAM E. ALBRECHT | Director | February 24, 2017 |
(William E. Albrecht) | ||
/s/ SIR GRAHAM HEARNE | Chairman of the Board | February 24, 2017 |
(Sir Graham Hearne) | ||
/s/ THOMAS R. HIX | Director | February 24, 2017 |
(Thomas R. Hix) | ||
/s/ JACK B. MOORE | Director | February 24, 2017 |
(Jack B. Moore) | ||
/s/ SUZANNE P. NIMOCKS | Director | February 24, 2017 |
(Suzanne P. Nimocks) | ||
/s/ P. DEXTER PEACOCK | Director | February 24, 2017 |
(P. Dexter Peacock) | ||
/s/ JOHN J. QUICKE | Director | February 24, 2017 |
(John J. Quicke) | ||
/s/ TORE I. SANDVOLD | Director | February 24, 2017 |
(Tore I. Sandvold) | ||
/s/ CHARLES L. SZEWS | Director | February 24, 2017 |
(Charles L. Szews) | ||
97