Attached files
| file | filename |
|---|---|
| 8-K - FORM 8-K - Bristow Group Inc | d671902d8k.htm |
 Third Quarter FY14
Earnings Presentation
Bristow Group Inc.
February 7, 2014
Exhibit 99.1 |
 2
Third quarter earnings call agenda
Introduction
CEO remarks and operational highlights
Current and future financial performance
Closing remarks
Questions and answers
Linda McNeill, Director Investor Relations
Bill Chiles, President and CEO
Jonathan Baliff, SVP and CFO
Bill Chiles, President and CEO |
 3
Forward-looking statements
This
presentation
may
contain
“forward-looking
statements”
within
the
meaning
of
the
Private
Securities
Litigation
Reform
Act
of
1995.
Forward-looking
statements
include
statements
about
our
future
business,
operations,
capital
expenditures,
fleet
composition,
capabilities
and
results;
modeling
information,
earnings
and
adjusted
earnings
growth
guidance,
expected
operating
margins,
cash
flow
stability
and
other
financial
projections;
future
dividends,
share
repurchases
and
other
uses
of
excess
cash;
plans,
strategies
and
objectives
of
our
management,
including
our
plans
and
strategies
to
grow
earnings
and
our
business,
our
general
strategy
going
forward,
our
business
model
and
our
operational
excellence
initiative;
expected
actions
by
us
and
by
third
parties,
including
our
customers,
competitors
and
regulators;
impact
of
grounding
and
the
effects
thereof;
the
valuation
of
our
company
and
its
valuation
relative
to
relevant
financial
indices;
assumptions
underlying
or
relating
to
any
of
the
foregoing,
including
assumptions
regarding
factors
impacting
our
business,
financial
results
and
industry;
expected
input
of
our
investment
in
Eastern
Airways;
and
other
matters.
Our
forward-looking
statements
reflect
our
views
and
assumptions
on
the
date
of
this
presentation
regarding
future
events
and
operating
performance.
They
involve
known
and
unknown
risks,
uncertainties
and
other
factors,
many
of
which
may
be
beyond
our
control,
that
may
cause
actual
results
to
differ
materially
from
any
future
results,
performance
or
achievements
expressed
or
implied
by
the
forward-looking
statements.
These
risks,
uncertainties
and
other
factors
include
fluctuations
in
the
demand
for
our
services;
fluctuations
in
worldwide
prices
of
and
demand
for
natural
gas
and
oil;
fluctuations
in
levels
of
natural
gas
and
oil
exploration
and
development
activities;
the
impact
of
competition;
actions
by
customers;
the
risk
of
reductions
in
spending
on
helicopter
services
by
governmental
agencies;
changes
in
tax
and
other
laws
and
regulations;
changes
in
foreign
exchange
rates
and
controls;
risks
associated
with
international
operations;
operating
risks
inherent
in
our
business,
including
the
possibility
of
declining
safety
performance;
general
economic
conditions
including
the
capital
and
credit
markets;
our
ability
to
obtain
financing;
the
risk
of
grounding
of
segments
of
our
fleet
for
extended
periods
of
time
or
indefinitely;
our
ability
to
re-deploy
our
aircraft
to
regions
with
greater
demand;
our
ability
to
acquire
additional
aircraft
and
dispose
of
older
aircraft
through
sales
into
the
aftermarket;
the
possibility
that
we
do
not
achieve
the
anticipated
benefit
of
our
fleet
investment
program;
availability
of
employees;
political
instability,
war
or
acts
of
terrorism
in
any
of
the
countries
where
we
operate;
and
those
discussed
under
the
captions
“Risk
Factors”
and
“Management’s
Discussion
and
Analysis
of
Financial
Condition
and
Results
of
Operations”
in
our
Annual
Report
on
Form
10-K
for
the
fiscal
year
ended
March
31,
2013
and
our
Quarterly
Report
on
Form
10-Q
for
the
quarter
ended
December
31,
2013.
We
do
not
undertake
any
obligation,
other
than
as
required
by
law,
to
update
or
revise
any
forward-looking
statements,
whether
as
a
result
of
new
information,
future
events
or
otherwise. |
 4
Chief Executive Officer comments
Bill
Chiles,
President
and
CEO |
 Operational safety review
* Includes consolidated commercial operations only
Total Recordable Injury Rate* per 200,000
man hours (cumulative)
Lost Work Case Rate
*
per 200,000
man hours (cumulative)
Commercial Air Accident Rate
*
per 100,000
flight hours (fiscal year)
FY13
FY14
FY13
FY14
5 |
 6
Q3 FY14 highlights
*
Adjusted
EPS
and
adjusted
EBITDAR
amounts
exclude
gains
and
losses
on
dispositions
of
assets
and
any
special
items
during
the
period.
See
reconciliation
of
these
items
to
GAAP
measures
in
the
appendix
hereto
and
in
our
earnings
release
for
the
quarter
ended
December
31,
2013.
** Please see our earnings release for more information regarding earnings
guidance. •
Q3 operating revenue of $373.6M (7.8% increase from Q3 FY13, 1.3% decrease from Q2
FY14) •
Q3
GAAP
EPS
of
$0.51
(49%
decrease
from
Q3
FY13,
83.1%
decrease
from
Q2
FY14)
•
Q3
adjusted
EPS*
of
$0.85
(27.4%
decrease
from
Q3
FY13,
33.1%
decrease
from
Q2
FY14)
•
Q3
adjusted
EBITDAR*
of
$100.7M
(7.8%
decrease
from
Q3
FY13,
7.2%
decrease
from
Q2
FY14)
•
Good top-line growth in Q3 FY14 with a decrease in adjusted EBITDAR and adjusted
EPS driven by contract start up timing, increases in maintenance
and other expenses
•
GAAP EPS of $0.51 includes the impact of a tax payment Líder made to the
Brazilian government equal to $0.34 per share; adjusted EPS is $0.85
•
Total liquidity was $617.2 million even after year-to-date ~$526.0 million
capex •
Adjusted EPS guidance for full FY14 is reaffirmed at $4.25 -
$4.55** with costs incurred
in Q3 expected to be recovered in Q4 FY14 as several a/c begin revenue service
|
 7
•
Europe contributed 44% of Bristow operating revenue
and 48% of adjusted EBITDAR* in Q3 FY14
•
Operating revenue increased to $158.5M in Q3 FY14
from $124.4M in Q3 FY13 with the net addition of
eight
LACE and an overall increase in activity under
new contracts over the comparable quarter
•
Adjusted EBITDAR increased to $56.0M in Q3 FY14
from $49.1M in Q3 FY13 but adjusted EBITDAR
margin decreased to 35.3% in Q3 FY14 from 39.5%
in Q3 FY13 due to higher maintenance and salary
costs
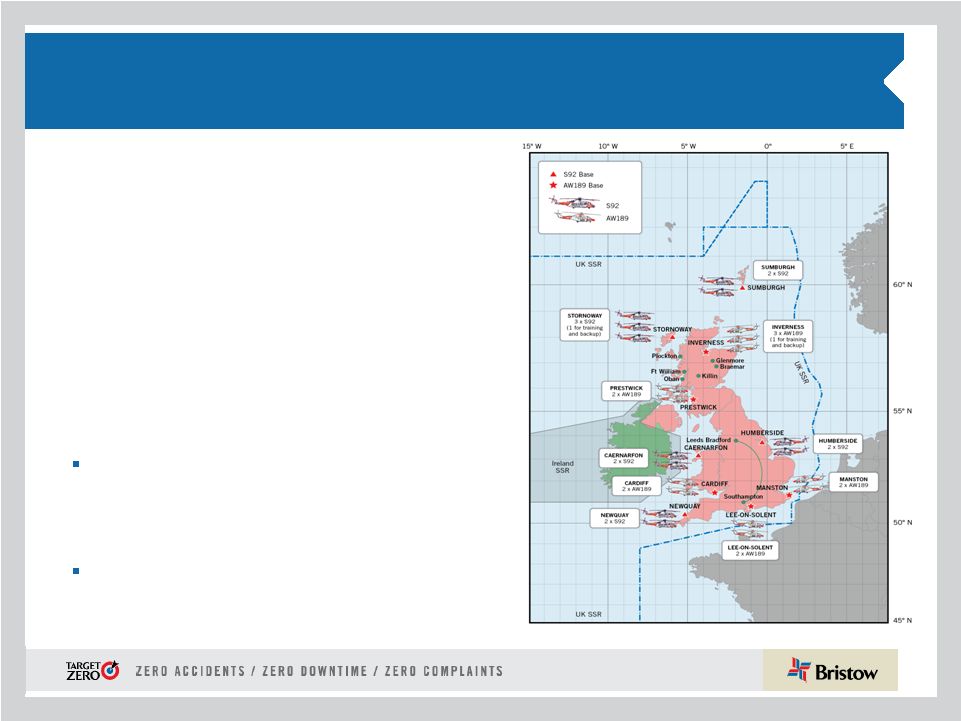
Outlook:
New oil and gas presence in Sumburgh positions us
for new growth opportunities west of Shetlands
Tenders for four LACE are ongoing in the UK and
two new technology SAR a/c in the Netherlands
expected in FY15
Industry-wide UK Parliamentary inquiry on
helicopter safety is ongoing
FY14 adjusted EBITDAR margin expected
to be ~ mid thirties
Europe (EBU)
* Operating revenue and adjusted EBITDAR percentages exclude corporate and
other |
 8
UK SAR update
•
From the start of the GAP SAR contract in
June 1, 2013 through December 31, 2013, we
have conducted 169 missions and rescued
and/or assisted 151 persons
•
Sumburgh and Stornoway bases generated
$12.1M of revenue in Q3 FY14 and $25.1M
since the beginning of the contract
•
Construction of first two UK SAR bases in
Inverness and Humberside to commence
in Q4 FY14
Outlook:
Assigned purchase contract for seven SAR
S-92s this quarter as part of completing the
leases for all 11 S-92s expected in
Q4 FY14
Expect to complete lease financing of the
remaining seven SAR a/c by Q4 FY15 |
 9
CHANGE:
Bristow
Helicopters
is
making
an
investment
in
Eastern
Airways,
a UK regional fixed-wing oil and gas focused transport company
•
Bristow Helicopters Limited (Bristow Helicopters)
purchased a 60% interest in the privately owned
Eastern Airways International Limited (Eastern
Airways)
•
Eastern Airways is a regional fixed-wing operator
with both charter and scheduled flights servicing
UK oil and gas industry transport from its main
operational hub in Aberdeen
•
Bristow Helicopters investment is £27M with a
possible £6M earn out over three years and
includes:
A 60% interest in Eastern Airways with
proportional voting and economic rights, with
the existing owners retaining the remaining
40%
30 fixed-wing aircraft
Financial results from Eastern Airways will be
consolidated within Bristow’s EBU
This investment will strengthen our ability to provide a complete suite of
point- to-point transportation services for our existing European based
passengers |
 10
Charter services
Scheduled services
Eastern Airways provides scale, stability and positive financial
impact (with less capital) for EBU
This investment expands helicopter services in certain areas like the Shetland
Islands and will create a more integrated logistics solution for our global
clients •
Bristow Helicopters and Eastern Airways are
culturally
aligned
with
shared
core
values
of
safety,
quality
and
service
•
Bristow Helicopters and Eastern Airways have a
long
standing
relationship
working
together
on
several
contracts,
including
the
IAC
Scatsta
contract
•
Bristow Helicopters and Eastern Airways
together
are
positioned
to
facilitate
and
expand
passengers’
transport
experience
from
home
to
offshore
bases,
a
market
niche
underserved
by
major
airlines
•
Eastern Airways has recently been awarded
a contract by a major oil company to provide fixed
wing services to Sumburgh to be combined with
separately awarded Bristow Helicopters contract
•
Financially
relatively
small
investment
with
expected
positive
EBITDAR,
BVA
and
EPS
impact
See
10-Q
Note
2
“Variable
interest
entities
and
other
investments
in
significant
affiliates”
for
more
information |
 11
West Africa (WASBU)
•
Nigeria contributed 22% of Bristow operating
revenue and 23% of adjusted EBITDAR* in
Q3 FY14
•
Operating revenue increased by 3.8% to $79.4M in
Q3 FY14 from $76.5M in Q3 FY13 due to improved
pricing, ad hoc flying and increased activity
•
Adjusted EBITDAR decreased slightly to $26.6M in
Q3 FY14 from $26.8M in Q3 FY13 and adjusted
EBITDAR margin decreased to 33.5% in Q3 FY14
vs. 35.0% in Q3 FY13 due to an increase in salaries
and benefits
Outlook:
New projects still on hold pending the clarification
of the Petroleum Industry Bill
Continued renewal of existing contracts
Tenders for new a/c are expected to be issued in
Q1 FY15
* Operating revenue and adjusted EBITDAR percentages exclude corporate and
other FY14 adjusted EBITDAR margin
expected to be ~ low thirties |
 12
•
North America contributed 15% of Bristow operating
revenue and 16% of adjusted EBITDAR* in Q3 FY14
•
Operating revenue decreased to $54.9M in Q3 FY14
from $59.3M in Q3 FY13 primarily due to a decline in
the number of small a/c on contract
•
Adjusted EBITDAR increased 5% to $18.2M in
Q3 FY14 vs. $17.3M in Q3 FY13 and adjusted
EBITDAR margin increased to 33.1% vs. 29.1% in
Q3 FY13 due to higher equity earnings from our
investment in Cougar
Outlook:
Expecting to exit completely out of our non-core
business in Alaska by Q2 FY15
We continue to divest small a/c as part of our
restructuring to serve clients’
deep water needs
Tender issued by major IOC for a long term
contract of two to three LACE with a start date in
Q4 FY15
FY14 adjusted EBITDAR margin
expected to be ~ low thirties
North America (NABU)
* Operating revenue and adjusted EBITDAR percentages exclude corporate and
other Bristow operated bases
Cougar operated bases |
 13
Australia (AUSBU)
•
Australia contributed 10% of Bristow operating
revenue and 4% of adjusted EBITDAR* in
Q3 FY14
•
Operating revenue decreased to $34.6M in
Q3 FY14 from $41.6M in Q3 FY13 due to the
ending of short term contracts and the negative
impact of foreign currency exchange rates
•
Adjusted EBITDAR decreased to $5.2M in
Q3 FY14 from $11.4M in Q3 FY13 and adjusted
EBITDAR margin decreased to 15.0% in Q3 FY14
from 27.3% in Q3 FY13 due to costs incurred in
anticipation of contracts that are due to start in
Q4 FY14 and FY15, including INPEX
Outlook:
Two LACE arrived in the region and have
started new work
New oil and gas SAR opportunities
Awaiting award decision for three LACE for
exploration opportunity in the Great Australian
Bight starting in January 2016
* Operating revenue and adjusted EBITDAR percentages exclude corporate and
other Great
Australian
Bight
FY14 adjusted EBITDAR margin
expected to be ~ low twenties |
 14
Other International (OIBU)
Other International (OIBU)
•
Other International contributed 9% of Bristow operating
revenue and 9% of adjusted EBITDAR* in Q3 FY14
•
Operating revenue decreased to $30.8M in Q3 FY14 vs.
$32.0M in Q3 FY13 due to a decline in aircraft on contract
in Malaysia
•
Adjusted EBITDAR decreased to $10.2M in Q3 FY14 from
$17.8M in Q3 FY13 and adjusted EBITDAR margin
decreased to 33.2% in Q3 FY14 from 55.7% in Q3 FY13
due to a decline in aircraft on contract in Malaysia, a change
in the Líder equity pickup and costs incurred in Tanzania
mobilization that will be recovered in the future periods
•
A loss in unconsolidated earnings from Líder of $17.1M in
Q3 FY14 vs. $4.2M earnings in Q3 FY13 due to a $19.3M
reduction in earnings resulting from a tax payment Líder
made to the Brazilian government
* Operating revenue and adjusted EBITDAR percentages exclude corporate and
other Consolidated in OIBU
Unconsolidated Affiliate
Outlook:
FY14 adjusted EBITDAR margin expected to be ~ low to mid forties
Additional new opportunities in North and East African markets
and Russia
Two additional AW139 a/c are being deployed to Trinidad as part of the fleet
renewal Petrobras
is
expected
to
issue
a
bid
for
two
to
four
LACE
SAR
starting
in
CY15
–
CY16
Opportunities
for
oil
and
gas
and
SAR
in
the
Falkland
Islands
starting
in
CY15
–
CY16 |
 15
Financial discussion
Jonathan
Baliff,
SVP
and
CFO |
 16
$109.2
$100.7
$3.2
$1.8
$3.5
Q3 FY13
Operations
Corporate and Other
FX Changes
Q3 FY14
Financial highlights Q3:
Adjusted EPS and adjusted EBITDAR summary
Q3 FY13 to Q3 FY14 adjusted EPS bridge
Q3 FY13 to Q3 FY14 adjusted EBITDAR bridge (in millions)
$1.17
$0.85
$0.01
$0.25
$0.08
Q3 FY13
Operations
Corporate and Other
FX Changes
Q3 FY14
* Adjusted EPS and EBITDAR amounts exclude gains and losses on dispositions of
assets and any special items during the quarter. See reconciliation of these
items to GAAP in the appendix hereto and in our earnings release for the
quarter ended December 31, 2013. |
 17
$278.0
$311.0
$33.0
$5.2
$5.2
YTD FY13
Operations
Corporate and Other
FX Changes
YTD FY14
$2.77
$3.11
$0.33
$0.11
$0.10
YTD FY13
Operations
Corporate and Other
FX Changes
YTD FY14
Financial highlights YTD:
Adjusted EPS and adjusted EBITDAR summary
YTD FY13 to YTD FY14 adjusted EPS bridge
YTD FY13 to YTD FY14 adjusted EBITDAR bridge (in millions)
* Adjusted EPS and EBITDAR amounts exclude gains and losses on dispositions of
assets and any special items during the nine months ended December 31, 2013 and 2012. See reconciliation of these items to GAAP in the appendix
hereto and in our earnings release for the quarter ended December 31, 2013.
|
 18
LACE and LACE rate continue to increase led by
new technology a/c and improved utilization/terms
FY14
average
LACE
guidance
of
160
-
164
and
average
LACE
rate
guidance
of
$8.95
-
$9.25
are
reaffirmed
* See appendix hereto for more information on LACE and LACE rate.
Consolidated commercial aircraft, LACE and LACE rate exclude Bristow Academy, affiliate a/c, aircraft
held for sale, a/c construction in progress, and reimbursable revenue.
|
 19
Combination of revenue growth and capital efficiency
drives quarterly BVA improvement
* Bristow Value Added (BVA) is calculated by taking gross cash flow less the
product of gross operating assets times a capital charge of 10.5%. Example calculation for
Q3 FY14, Q2 FY14, Q3 FY13 and Q2 FY13 can be found in the appendix hereto.
Absolute BVA* Q3 FY12 –
Q3 FY14
•
Q3 FY14 BVA is positive $12.1M, an improvement of $2.8M over Q3 FY13
•
YTD FY14 consolidated BVA is positive $36.0M, a $22.7M increase from YTD
FY13 •
Year-over-year change in BVA is driven by:
Margin improvement due to strong performance from Europe and West Africa
Benefit from FBH sale
Lider contributed $14.4M to the YTD BVA |
 20
Our progress on BVA yields stronger liquidity for
growth . . .
Net cash provided by operating activities*
*
See
10-Q
for
more
information
on
cash
flow
provided
by
operating
activities
Total liquidity
178 |
 21
…
with FY14 guidance reaffirmed
•
FY14
adjusted
EPS
guidance
reaffirmed
to
$4.25
-
$4.55,
excluding special items and a/c sales. Other specific items
include:
* Assuming FY14 revenue earned in same regions and same mix as in FY13
Long term adjusted EPS growth of 10 -
15% combined with a 20 -
30%
dividend payout policy reflects management’s commitment to deliver a
more stable, growing and predictable total return for shareholders
Average LACE
~160 - 164
Interest expense
~ $30 - $35M
Average LACE rate
~ $8.95 - $9.25M
Rent expense (a/c only)
~$85 - $90M
G & A expense (all inclusive)
~ $175 - $185M
Tax rate*
~ 20 - 24%
Depreciation expense
~ $90 - $95M
Adj. EPS guidance
$4.25 - $4.55
FY14 guidance |
 22
5 Fleet
Types
Moving forward with Operational Excellence:
The efforts have been ongoing at Bristow since 2012
•
Since
February
2012,
we
have
focused
on
an
integrated
company-wide
project
to
move
Bristow
towards
Operational
Excellence
through
standardization
and
simplification.
Our
first
efforts
include:
eFlight (Flight Operations Applications)
SAP (Business Management Applications) will replace a much older
application (IFS)
Applications integrate with our clients and original equipment manufacturers
•
These
efforts
are
primarily
meant
to
reduce
risk
and
reinforce
our
long
term
10-15%
adjusted
EPS
growth
through BVA and EPS accretion
•
Significant business transformation work is also underway
Integrated operations planning
Inventory optimization
•
Fleet rationalization and simplification:
Today
In ~ 5 Years
In ~ 10 Years
28 Fleet
Types
8 Fleet
Types |
 23
Conclusions
•
Safety continues to be our #1 core value as we strive to achieve
Target Zero and participate in industry efforts to share best
practices
•
Revenue growth continues as clients turn to Bristow as their
provider of choice due to our global reach, financial strength, and
ongoing Operational Excellence performance
•
Although the third quarter results were lower year-over-year and
sequentially, some of this was expected, which is why we have
confidence in annualized FY14 results within our guidance range
•
Bristow Helicopters’
investment in Eastern Airways expands
services in certain areas like the Shetland Islands and creates a
more integrated logistics solution for our global clients
|
 24
Appendix |
 25
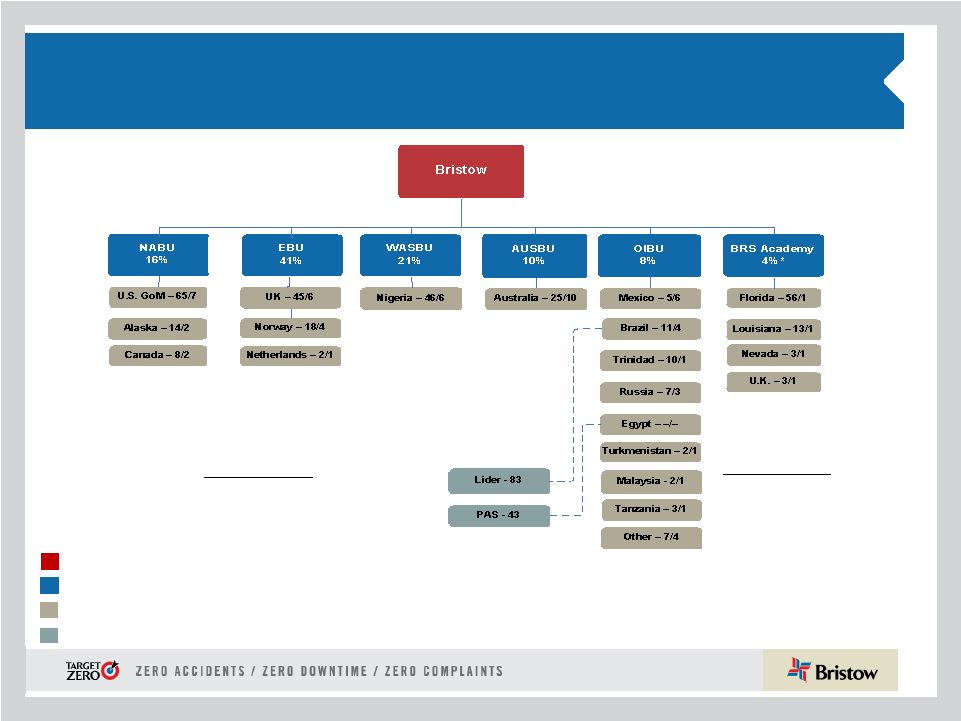
Organizational chart -
as of December 31, 2013
Business
Unit
(%
of
Q3
FY14
operating
revenue)
Corporate
Region
(
#
of
a/c
/
#
of
Locations)
Joint
Venture
(#
of
a/c)
Key
Operated Aircraft
Bristow owned and/or operated 345
aircraft as of December 31, 2013
Affiliated Aircraft
Bristow affiliates and joint
ventures operated 126 aircraft
as of December 31, 2013
* Includes corporate and other |
  26
Aircraft Fleet –
medium and large
as of December 31, 2013
Next Generation Aircraft
Medium capacity 12-16 passengers
Large capacity 16-25 passengers
Mature Aircraft
Fair
market
value
of
our
owned
fleet
is
~$1.9
billion
and
leased
fleet
is
~$900
million
Aircraft
Type
No. of PAX
Engine
Consl
Unconsl
Total
Ordered
Large Helicopters
AS332 L Super Puma
18
Twin Turbine
19
-
19
-
AW189
16
Twin Turbine
-
-
-
17
EC175
16
Twin Turbine
-
-
-
5
EC225
19
Twin Turbine
20
-
20
3
Mil MI 8
20
Twin Turbine
7
-
7
-
Sikorsky S-61
18
Twin Turbine
2
-
2
-
Sikorsky S-92
19
Twin Turbine
56
7
63
10
104
7
111
35
LACE
102
Medium Helicopters
AW139
12
Twin Turbine
14
2
16
4
Bell 212
12
Twin Turbine
-
14
14
-
Bell 412
13
Twin Turbine
28
17
45
-
EC155
13
Twin Turbine
1
-
1
-
Sikorsky S-76A/A++
12
Twin Turbine
4
5
9
-
Sikorsky S-76C/C++
12
Twin Turbine
51
34
85
-
Sikorsky S-76D
12
Twin Turbine
2
-
2
8
100
72
172
12
LACE
48 |
 27
Aircraft Fleet –
small, training and fixed
as of December 31, 2013 (continued)
Mature Aircraft
Small capacity 4-7 passengers
Training capacity 2-6 passengers
* LACE does not include held for sale, training helicopters and fixed wing
Next Generation Aircraft
Aircraft
Type
No. of PAX
Engine
Consl
Unconsl
Total
Ordered
Small Helicopters
AS350BB
4
Turbine
-
2
2
-
Bell 206B
4
Turbine
1
2
3
-
Bell 206 L Series
6
Turbine
19
6
25
-
Bell 407
6
Turbine
36
-
36
-
BK 117
7
Twin Turbine
2
-
2
-
BO-105
4
Twin Turbine
2
-
2
-
EC135
7
Twin Turbine
3
3
6
-
63
13
76
-
LACE
13
Training Helicopters
AS 355
5
Twin turbine
3
-
3
-
Bell 206B
4
Single Engine
12
-
12
-
Robinson R22
2
Piston
10
-
10
-
Robinson R44
4
Piston
5
-
5
-
Sikorsky 300CB/CBi
2
Piston
44
-
44
-
Fixed Wing
1
-
1
-
75
-
75
-
Fixed Wing
3
34
37
-
Total
345
126
471
47
TOTAL LACE (Large Aircraft Equivalent)*
162 |
 28
Operating lease strategy: lowering the cost and amount of
capital needed to grow
•
Of the 81 a/c currently leased in our fleet, 52 are commercial (39 LACE) and 29
are training
•
39 LACE a/c represent approximately 24% of our commercial fleet
•
Our
goal
is
for
commercial
fleet
operating
leases
to
account
for
approximately
30-35% of our LACE
Leased aircraft as of December 31, 2013
* The percentage of LACE leased is calculated by taking the total LACE for leased
aircraft divided by the total LACE for all aircraft we operate, including both owned and leased aircraft.
See
10-Q
Note
5
“Commitments
and
contingencies”
for
more
information
provided
on
operating
leases.
Small
Medium
Large
Total
Leased LACE
Total LACE
% Leased
EBU
-
1
21
22
22
59
37%
WASBU
-
1
1
2
2
22
7%
NABU
4
13
3
20
11
34
31%
AUSBU
2
2
4
8
6
20
28%
OIBU
-
-
-
-
-
28
-
Total
6
17
29
52
39
162
24%
* |
 29
Consolidated fleet changes and aircraft sales for
Q3 FY14
See
10-Q
Note
5
“Commitments
and
contingencies”
for
more
information
provided
on
operating
leases.
Additionally, during Q3 FY14 we sold six aircraft for $72.4M, which we subsequently
leased back. Leased aircraft in consolidated fleet
Small
Medium
Large
Training
Total
EBU
-
1
21
-
22
WASBU
-
1
1
-
2
NABU
4
13
3
-
20
AUSBU
2
2
4
-
8
OIBU
-
-
-
-
-
Academy
-
-
-
29
29
Total
6
17
29
29
81
Q1 FY14
Q2 FY14
Q3 FY14
YTD
Fleet Count Beginning
351
353
350
351
Delivered
Large
3
2
4
9
Medium
2
3
3
8
Total Delivered
5
5
7
17
Removed
Sales
(4)
(4)
(11)
(19)
Other*
1
(4)
(1)
(4)
Total Removed
(3)
(8)
(12)
(23)
353
350
345
345
* Includes lease returns and commencements
Fleet changes
Held for sale aircraft in consolidated fleet
Small
Medium
Large
Training
Total
EBU
-
-
2
-
2
WASBU
-
2
-
-
2
NABU
11
-
-
-
11
AUSBU
-
-
-
-
-
OIBU
1
3
-
-
4
Academy
-
-
-
2
2
Total
12
5
2
2
21
# of a/c Sold
Cash
received*
Q1 FY14
4
2.0
$
Q2 FY14
4
7.9
Q3 FY14
11
14.3
Total
19
24.2
$
* Amounts stated in millions |
 30
Op revenue
1
LACE
LACE rate
2,3
EBU
$452
59
$10.30
WASBU
231
22
14.17
NABU
174
34
6.75
AUSBU
108
20
7.21
OIBU
95
28
4.58
Total
$1,091
162
$8.97
Operating Revenue, LACE, and LACE rate by BU
as of December 31, 2013
Operating revenue, LACE and LACE rate by BU
4
1)
$ in millions
2)
LACE rate is annualized
3)
$ in millions per LACE
4)
Excludes Bristow Academy |
 31
Historical LACE by BU
Q1
Q2
Q3
Q4
Q1
Q2
Q3
Q4
Q1
Q2
Q3
Q4
EBU
45
45
45
42
42
43
48
46
44
46
46
45
WASBU
23
23
24
25
24
24
21
22
23
22
22
22
NABU
39
36
36
36
39
35
34
29
30
29
30
30
AUSBU
20
20
22
22
20
23
24
20
19
20
20
19
OIBU
36
34
34
35
33
33
33
38
39
38
38
34
Consolidated
163
158
161
160
157
158
159
154
154
154
155
149
Q1
Q2
Q3
Q4
Q1
Q2
Q3
EBU
47
45
51
55
57
59
59
WASBU
22
22
20
21
21
21
22
NABU
30
31
39
37
37
33
34
AUSBU
18
17
17
19
19
19
20
OIBU
32
28
27
27
27
28
28
Consolidated
147
142
154
158
161
160
162
LACE
FY11
FY12
FY10
FY13
FY14 |
  32
Historical LACE rate by BU
1) $ in millions
2) LACE rate is annualized
Q1
Q2
Q3
Q4
Q1
Q2
Q3
Q4
Q1
Q2
Q3
Q4
EBU
$8.36
$8.28
$8.40
$8.76
$8.20
$8.50
$7.90
$8.40
$9.80
$9.60
$9.63
$10.09
WASBU
9.08
8.81
8.66
8.34
9.70
9.40
10.70
9.90
9.10
10.30
11.17
11.46
NABU
5.05
5.44
5.26
5.23
5.40
6.10
6.00
6.60
5.80
6.30
5.89
5.79
AUSBU
5.38
5.56
5.59
5.67
6.80
6.00
6.00
7.50
8.60
7.10
6.96
7.78
OIBU
3.66
4.09
4.06
3.78
3.90
4.10
4.40
3.90
3.50
3.70
3.78
4.22
Consolidated
$6.31
$6.52
$6.49
$6.45
$6.70
$6.90
$6.90
$7.10
$7.30
$7.40
$7.43
$7.89
Q1
Q2
Q3
Q4
Q1
Q2
Q3
EBU
$10.60
$11.03
$9.74
$9.13
$9.63
$9.95
$10.30
WASBU
12.35
12.24
13.71
13.28
14.26
14.62
14.17
NABU
7.05
7.11
5.84
6.12
6.34
7.13
6.75
AUSBU
8.48
9.29
9.55
8.58
8.04
7.74
7.21
OIBU
4.22
4.62
4.76
4.94
4.97
4.73
4.58
Consolidated
$8.55
$8.95
$8.49
$8.35
$8.78
$9.07
$8.97
LACE rate
1,2
FY10
FY11
FY12
FY13
FY14 |
 33
Order and options book as of December 31, 2013
1)
22 large a/c on order and 13 large a/c on option are subject to the
successful development and certification of the aircraft 2)
One oil and gas full SAR /c is under contract
ORDER BOOK¹
#
Helicopter
Class
Delivery Date
Location
Contracted
1
Medium
March 2014
OIBU
1 of 1
1
Medium
March 2014
NABU
2
Large
March 2014
EBU
1 of 2
3
Medium
June 2014
OIBU
1 of 3
2
Large
June 2014
AUSBU
1 of 2
1
Large
June 2014
OIBU
1
Large
June 2014
WASBU
6
Medium
September 2014
WASBU
1
Medium
September 2014
NABU
3
Large
September 2014
EBU
2 of 3
2
1
Large
September 2014
AUSBU
1 of 1
1
Large
December 2014
EBU
1
Large
March 2015
OIBU
1
Large
March 2015
NABU
1 of 1
1
Large
March 2015
AUSBU
1
Large
March 2015
EBU
1
Large
June 2015
EBU
1
Large
June 2015
AUSBU
1
Large
September 2015
NABU
1
Large
December 2015
NABU
1
Large
March 2016
EBU
2
Large
March 2016
NABU
1
Large
June 2016
NABU
1
Large
June 2016
EBU
36
8 of 36
OPTIONS BOOK
#
Helicopter
Class
Delivery Date
2
Medium
March 2015
1
Large
June 2015
3
Medium
June 2015
3
Large
September 2015
2
Medium
September 2015
3
Large
December 2015
2
Medium
December 2015
2
Large
March 2016
3
Medium
March 2016
3
Large
June 2016
3
Medium
June 2016
4
Large
September 2016
2
Medium
September 2016
5
Large
December 2016
1
Medium
December 2016
3
Large
March 2017
1
Medium
March 2017
3
Large
June 2017
1
Medium
June 2017
3
Large
September 2017
1
Medium
September 2017
4
Large
December 2017
1
Medium
December 2017
1
Large
March 2018
57 |
 34
Order and options book as of December 31, 2013
(continued)
#
Helicopter
Class
Delivery Date
Location
Contracted
3
Large
September 2014
EBU
3 of 3
2
Large
March 2015
EBU
2 of 2
2
Large
June 2015
EBU
2 of 2
2
Large
September 2015
EBU
2 of 2
2
Large
December 2015
EBU
2 of 2
11
11 of 11
UK SAR CONFIGURED ORDER BOOK |
 35
Adjusted EBITDAR margin* trend
*
Adjusted
EBITDAR
excludes
special
items
and
asset
dispositions
and
margin
is
calculated
by
taking
adjusted
EBITDAR
divided
by
operating
revenue
FY11
FY12
Q1
Q2
Q3
Q4
Full Year
Q1
Q2
Q3
Q4
Full Year
EBU
29.8%
31.5%
34.6%
34.4%
32.7%
33.0%
31.4%
30.7%
36.1%
32.9%
WASBU
33.7%
36.9%
35.8%
34.3%
35.2%
29.5%
35.5%
37.2%
36.6%
35.0%
NABU
20.8%
25.8%
15.9%
8.5%
18.5%
14.3%
20.6%
14.8%
19.4%
17.3%
AUSBU
33.2%
26.1%
27.0%
31.1%
29.3%
20.2%
14.4%
23.5%
35.6%
24.3%
OIBU
18.3%
40.2%
37.4%
59.4%
39.3%
48.1%
19.1%
47.8%
42.9%
39.5%
Consolidated
23.8%
27.5%
25.9%
29.6%
26.7%
23.4%
24.0%
27.6%
31.2%
26.6%
FY13
FY14
Q1
Q2
Q3
Q4
Full Year
Q1
Q2
Q3
EBU
32.2%
34.6%
39.5%
38.3%
36.2%
30.3%
35.3%
35.3%
WASBU
31.9%
26.5%
35.0%
31.8%
31.5%
31.3%
30.4%
33.5%
NABU
23.2%
20.7%
29.1%
29.5%
25.7%
29.2%
31.0%
33.1%
AUSBU
27.0%
28.0%
27.3%
26.0%
27.1%
17.7%
21.0%
15.0%
OIBU
36.2%
44.2%
55.7%
51.6%
46.6%
67.4%
39.3%
33.2%
Consolidated
26.3%
26.1%
31.5%
29.4%
28.3%
28.5%
28.7%
27.0% |
 36
Adjusted EBITDAR* reconciliation
* Adjusted EBITDAR excludes special items and asset dispositions
Fiscal year ended,
3/31/2011
3/31/2012
($ in millions)
Q1
Q2
Q3
Q4 Full Year
Q1
Q2
Q3
Q4
Full Year
Net income
$20.9
$38.8
$42.3
$31.2
$133.3
$21.2
$3.0
$26.5
$14.6
$65.2
Income tax expense
8.5
3.3
-11.8
7.1
7.1
6.6
-1.9
7.1
2.4
14.2
Interest expense
11.1
11.5
13.8
9.9
46.2
9.0
9.5
9.8
10.0
38.1
Gain on disposal of assets
-1.7
-1.9
0.0
-5.1
-8.7
-1.4
1.6
2.9
28.6
31.7
Depreciation and amortization
19.3
21.0
21.3
27.7
89.4
22.7
25.4
22.7
25.3
96.1
Special items
0.0
0.0
-1.2
2.4
1.2
0.0
24.6
0.0
3.4
28.1
EBITDA Subtotal
58.1
72.7
64.4
73.3
268.5
58.1
62.1
68.9
84.3
273.4
Rental expense
6.6
6.1
8.7
7.7
29.2
9.0
9.1
12.8
15.1
46.0
Adjusted EBITDAR
$64.7
$78.8
$73.1
$81.1
$297.7
$67.0
$71.2
$81.8
$99.5
$319.5
3/31/2013
3/31/2014
($ in millions)
Q1
Q2
Q3
Q4 Full Year
Q1
Q2
Q3
Net income
$24.2
$30.4
$36.7
$40.4
$131.7
$26.9
$109.9
$19.0
Income tax expense
6.2
8.3
7.8
12.7
35.0
7.6
41.1
2.9
Interest expense
8.8
8.6
14.7
10.3
42.4
20.4
9.1
7.3
Gain on disposal of assets
5.3
1.3
-7.4
-7.2
-8.1
1.7
3.1
-4.0
Depreciation and amortization
21.4
23.3
24.9
26.7
96.3
22.8
23.9
23.7
Special items
2.2
-2.8
14.9
1.9
16.2
0.0
-101.8
23.5
EBITDA Subtotal
68.0
69.2
91.6
84.8
313.5
79.4
85.2
72.4
Rental expense
16.3
15.3
17.6
18.3
67.4
23.1
23.3
28.3
Adjusted EBITDAR
$84.3
$84.5
$109.2
$103.0
$381.0
$102.5
$108.5
$100.7 |
 37
Bristow stock price reflects improved operational
performance and increasing shareholder returns
Note: The net asset FMV per share does not include our UK SAR aircraft
|
 38
Net asset fair market value (FMV) per share
calculation as of December 31, 2013
(in millions)
(+) FMV of a/c
1,949
$
(+) FMV of leased a/c
873
(+) NBV of PPE w/o a/c
540
(+) Working capital
481
(-) LT debt
(833)
(-) Leased imputed debt
(394)
(-) Pension liability
(125)
Net asset FMV
2,492
$
# of common shares
37
Net asset FMV per share
67.71
$ |
 39
Bristow Value Added (BVA)
Sample calculation for Q2 FY14 and Q2 FY13
Bristow Value Added = Gross Cash Flow –
(Gross Operating Assets X Capital Charge)
BVA
=
GCF
-
(
GOA
X
10.5%**
)
Bristow Value Added calculation for Q2 FY14
$22.4
=
$109.2*
-
(
$3,309*
X
2.625%**)
Bristow Value Added calculation for Q2 FY13
$2.1
=
$78.8*
-
(
$2,922*
X
2.625%**)
* Reconciliation for these items follows right after this
slide ** Quarterly capital charge of 2.625% is based on annual
capital charge of 10.5% |
 40
Bristow Value Added (BVA)
Sample calculation for Q3 FY14 and Q3 FY13
Bristow Value Added = Gross Cash Flow –
(Gross Operating Assets X Capital Charge)
BVA
=
GCF
-
(
GOA
X
10.5%**
)
Bristow Value Added calculation for Q3 FY14
$12.1
=
$100.8*
-
(
$3,378*
X
2.625%**)
Bristow Value Added calculation for Q3 FY13
$9.3
=
$95.1*
-
(
$3,269*
X
2.625%**)
* Reconciliation for these items follows right after this
slide ** Quarterly capital charge of 2.625% is based on annual
capital charge of 10.5% |
 41
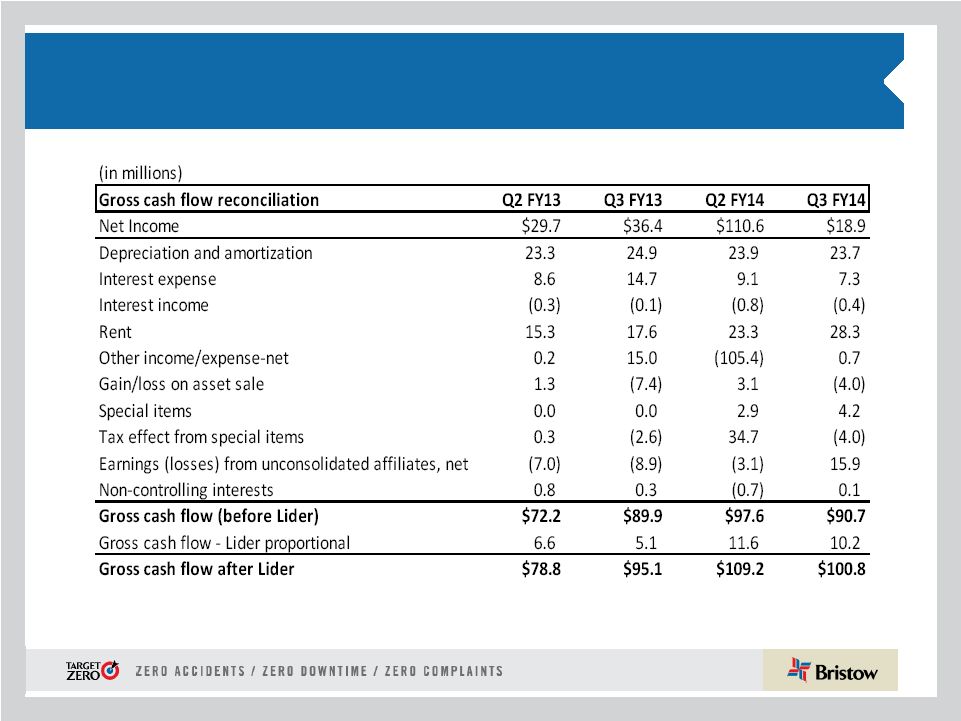
Gross cash flow reconciliation |
 42
Adjusted gross operating assets reconciliation
(in millions)
Adjusted gross operating assets reconciliation
Q2 FY13
Q3 FY13
Q2 FY14
Q3 FY14
Total assets
$2,785
$3,051
$3,166
$3,277
Accumulated depreciation
464
480
518
530
Capitalized operating leases
225
244
373
419
Cash and cash equivalents
(348)
(232)
(314)
(323)
Investment in unconsolidated entities
(215)
(267)
(272)
(255)
Goodwill
(30)
(30)
(30)
(30)
Intangibles
(4)
(4)
(2)
(2)
Assets held for sale: net
(20)
(15)
(27)
(22)
Assets held for sale: gross
83
76
56
48
Adj. for gains and losses on assets sales
120
108
(8)
(5)
Accounts payable
(56)
(63)
(70)
(60)
Accrued maintenance and repairs
(19)
(18)
(17)
(17)
Other accrued taxes
(8)
(8)
(10)
(8)
Accrued wages, benefits and related taxes
(45)
(51)
(49)
(67)
Other accrued liabilities
(27)
(27)
(24)
(145)
Income taxes payable
(13)
(13)
(33)
(20)
Deferred revenue
(13)
(20)
(21)
(23)
ST deferred taxes
(15)
(12)
(2)
(2)
LT deferred taxes
(144)
(147)
(155)
(146)
Adjusted gross operating assets before Lider
$2,723
$3,053
$3,079
$3,150
Adjusted gross operating assets-Lider proportional
199
216
230
228
Adjusted gross operating assets after Lider
$2,922
$3,269
$3,309
$3,378 |
 43
GAAP reconciliation
(i) See information about special items in 10-Q or earnings release for Q3
FY14 (ii)
These amounts are presented after applying the appropriate tax effect to each item
and dividing by the weighted average shares outstanding during the related period to calculate the earnings per share impact |
 44
Leverage reconciliation
*Adjusted EBITDAR excludes gains and losses on dispositions of assets
Debt
Investment
Capital
Leverage
(a)
(b)
(c) = (a) + (b)
(a) / (c)
(in millions)
As of December 31, 2013
$
841.6
$ 1,762.9
$ 2,604.5
32.3%
Adjust for:
Unfunded Pension Liability
125.0
125.0
NPV of Lease Obligations
393.6
393.6
Letters of credit
2.4
2.4
Adjusted
$
1,362.6
(d)
$ 1,762.9
$ 3,125.5
43.6%
Calculation of debt to adjusted EBITDAR multiple
TTM Adjusted EBITDAR*:
FY 2014
$
414.0
(e)
= (d) / (e)
3.29:1 |
 45
Bristow Group Inc. (NYSE: BRS)
2103 City West Blvd., 4
th
Floor
Houston, Texas 77042
t
713.267.7600
f
713.267.7620
bristowgroup.com
Contact Us |